Comparison of South Korea & Taiwan NIE development model reconsidered.
21
Comparison of South Korea & Taiwan NIE development model reconsidered
-
Upload
pauline-clarke -
Category
Documents
-
view
217 -
download
0
Transcript of Comparison of South Korea & Taiwan NIE development model reconsidered.
Comparison of South Korea & Taiwan
NIE development model reconsidered
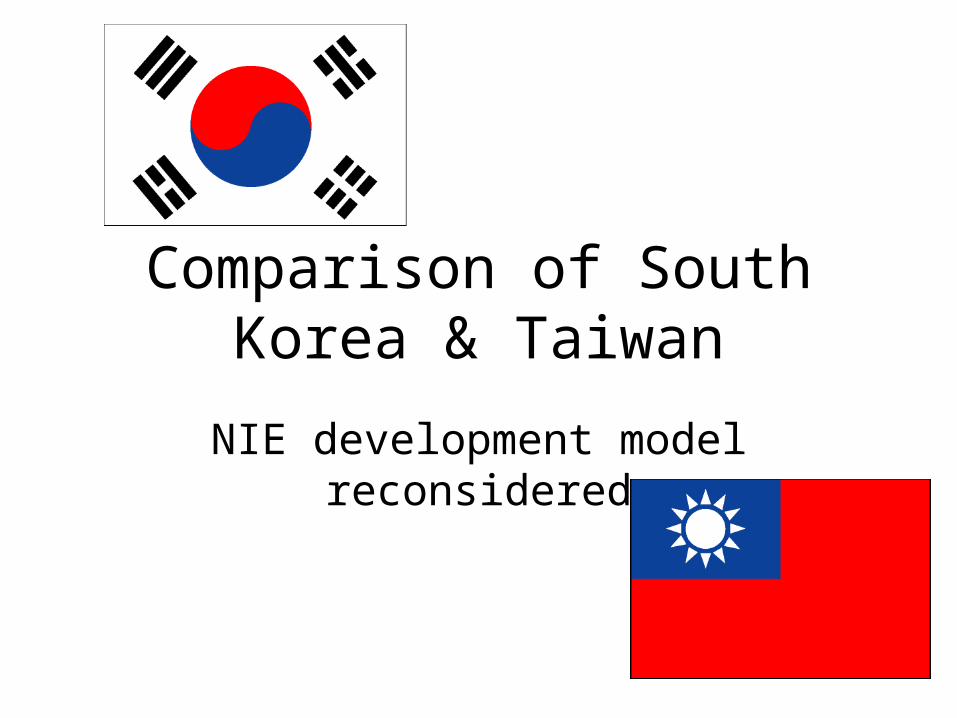
Comparison
• Population– South Korea:49 million– Taiwan: 23 million
• land area– South Korea:96,920 km2
– Taiwan: 32,260 km2
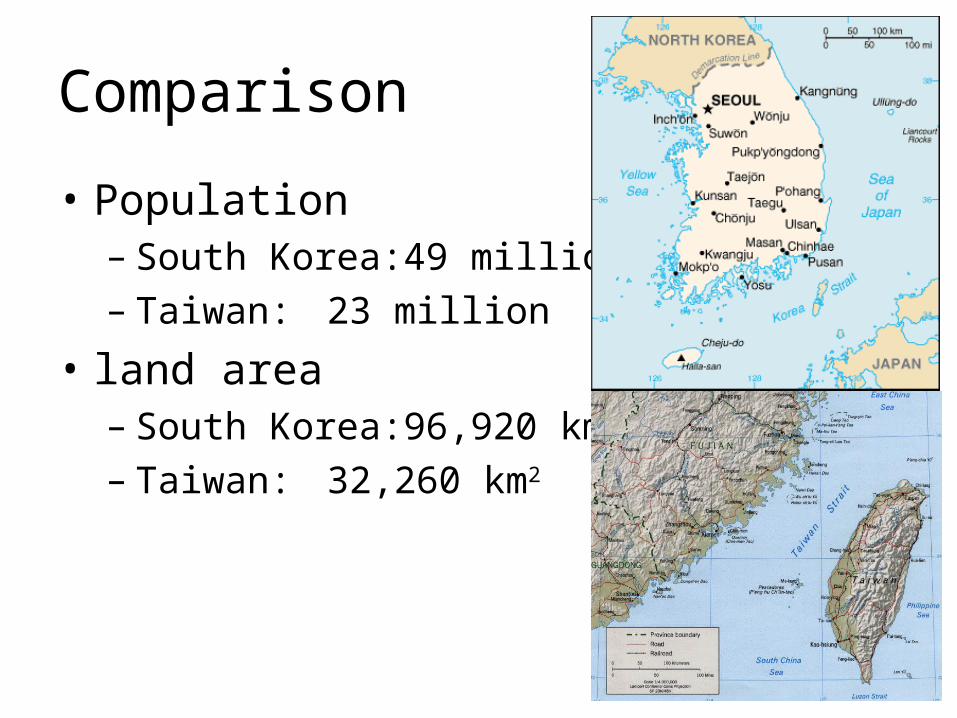
South Korea and Taiwan
• Purchasing power parity GDP of 2012– South Korea: US$1.64 trillion (12th)– Taiwan: US$0.92 trillion (20th)
• GDP growth rate 2010-2012– South Korea: 6.3%, 3.6%, 2%– Taiwan: 10.8%, 4.1%, 1.3%
NIE development models
• Singapore, Hong Kong, Taiwan, and South Korea
• export-oriented industrialization
• state guidance
• state involvement in economic development
• high investment in human capital formation
NIE development model dead?
• South Korea in 1997– negative growth for the 1st time in 2 decades– unemployment rate rose from 3% to 7%– per capita GNP almost shrank by half
• Taiwan in 1997– economic growth slowed down– still robust
• Is the NIE development model in crisis?
South Korea and Taiwan
• development becomes state’s priority
• commitment to private property & market– government’s strategic industrial policy
• state agencies formulate and implement strategic policies (e.g. Japan’s MITI)
• sound macroeconomic management
• bureaucratic autonomy from interest groups
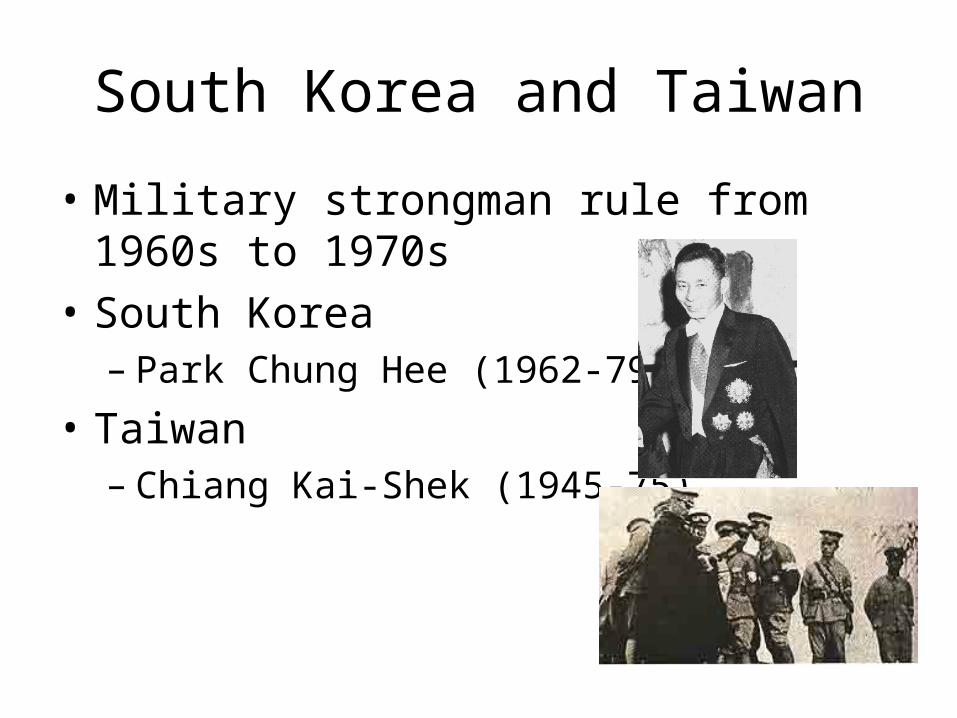
South Korea and Taiwan
• Military strongman rule from 1960s to 1970s
• South Korea– Park Chung Hee (1962-79)
• Taiwan– Chiang Kai-Shek (1945-75)
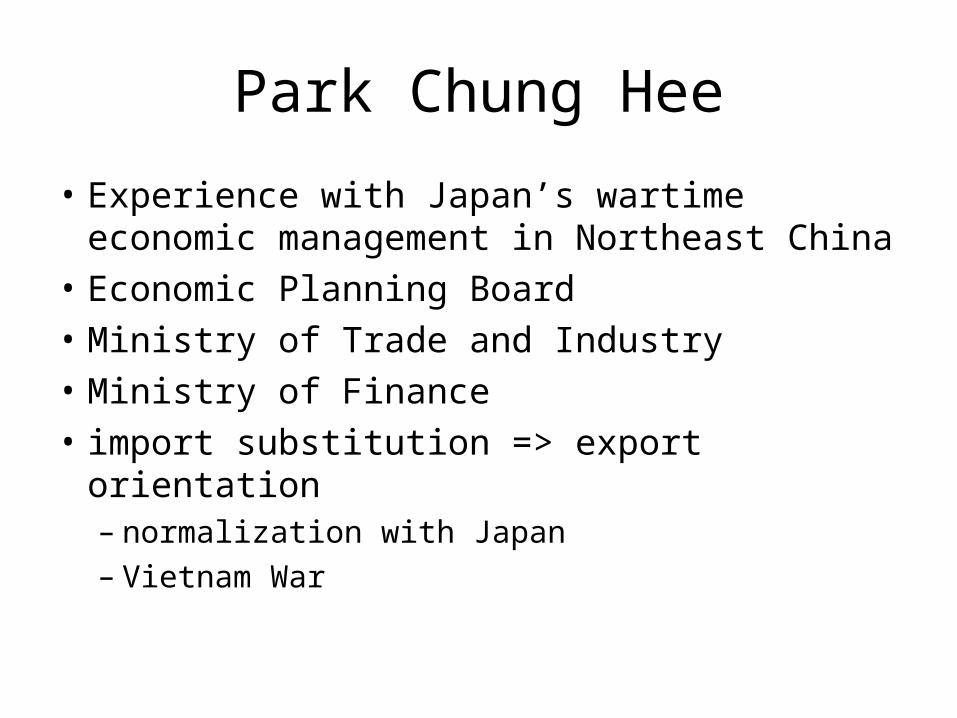
Park Chung Hee
• Experience with Japan’s wartime economic management in Northeast China
• Economic Planning Board
• Ministry of Trade and Industry
• Ministry of Finance
• import substitution => export orientation– normalization with Japan– Vietnam War
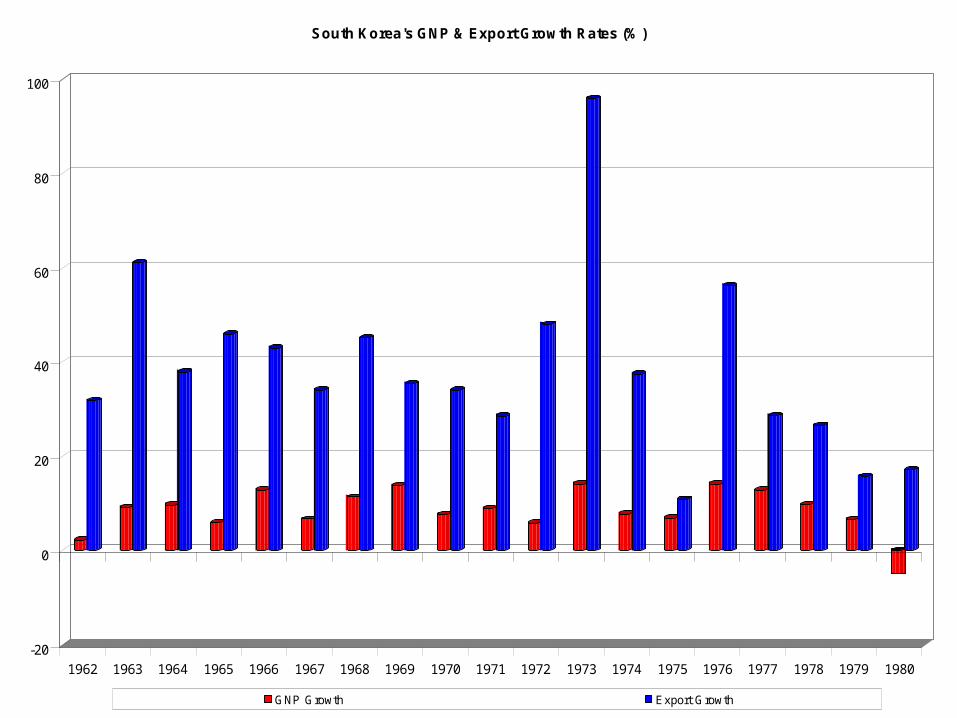
-20
0
20
40
60
80
100
1962 1963 1964 1965 1966 1967 1968 1969 1970 1971 1972 1973 1974 1975 1976 1977 1978 1979 1980
South Korea's GNP & Export Growth Rates (% )
GNP Growth Export Growth
Financial sector
• Government owned and controlled
• all 5 commercial banks– including the central bank (Bank of Korea)
• all 6 special banks
• 2 of the 3 non-bank financial institutions
Financial sector
• Foreign Capital Inducement Law– control private sector’s access to foreign
capital
• business activities were directed by the state
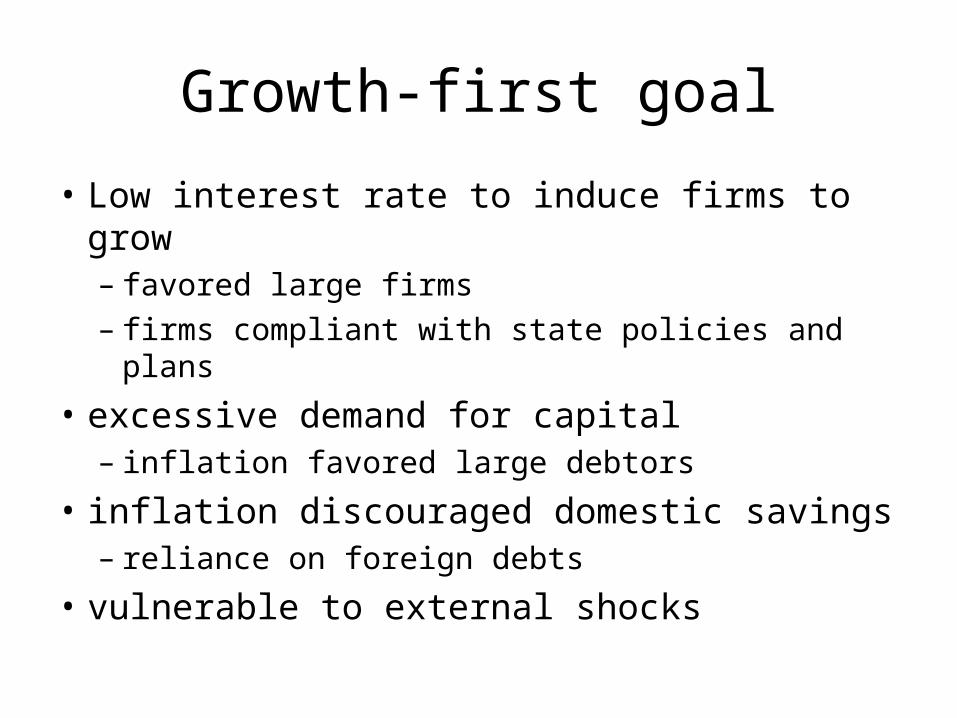
Growth-first goal
• Low interest rate to induce firms to grow– favored large firms– firms compliant with state policies and plans
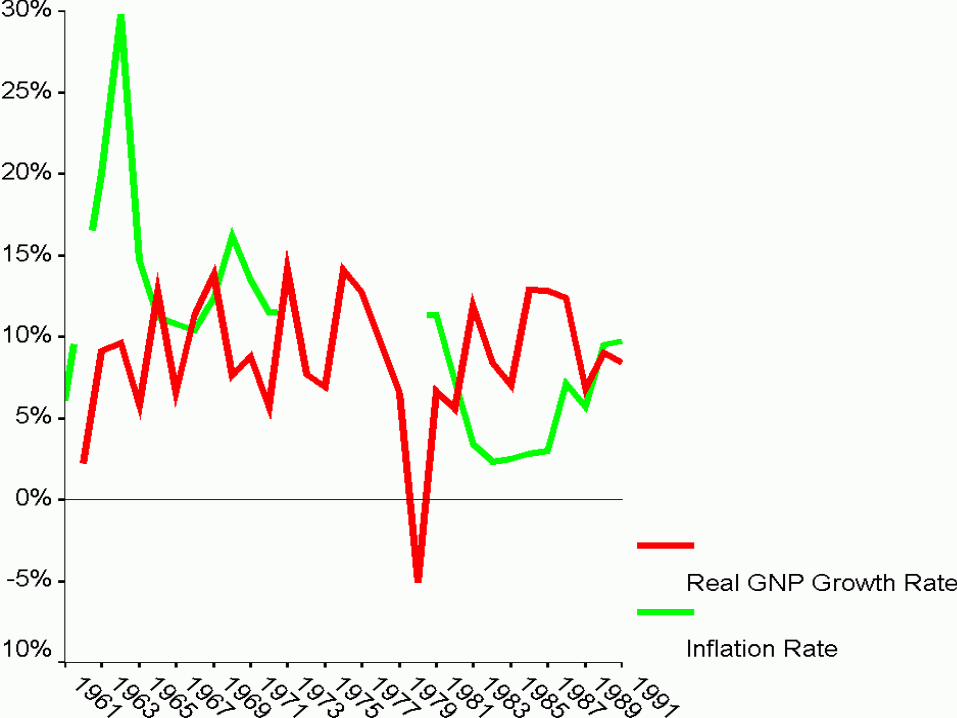
• excessive demand for capital– inflation favored large debtors
• inflation discouraged domestic savings– reliance on foreign debts
• vulnerable to external shocks
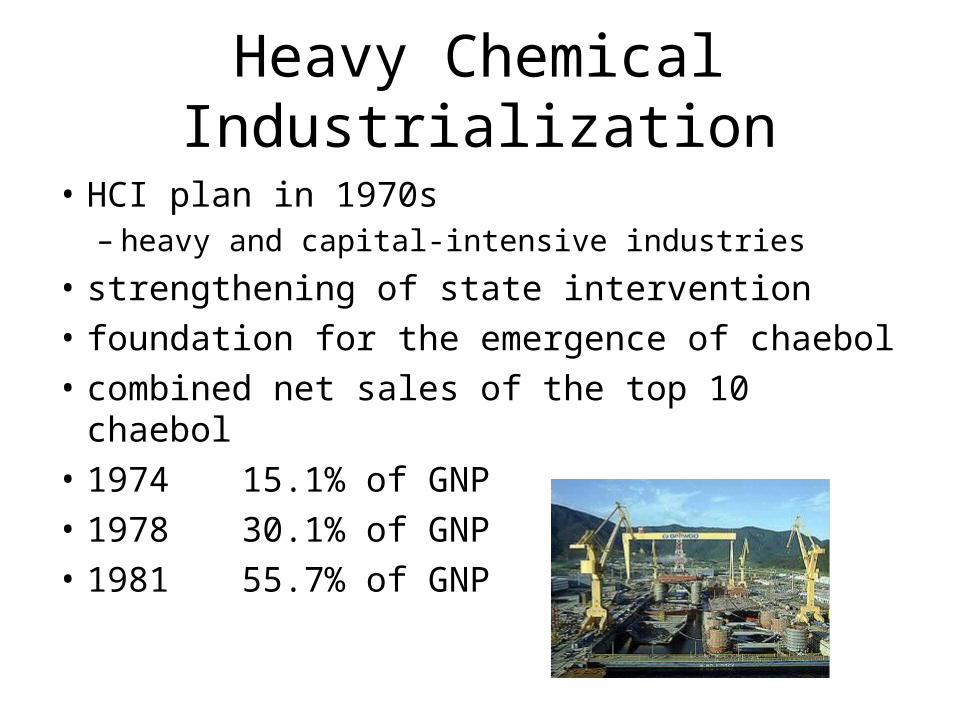
Heavy Chemical Industrialization
• HCI plan in 1970s– heavy and capital-intensive industries
• strengthening of state intervention
• foundation for the emergence of chaebol
• combined net sales of the top 10 chaebol
• 197415.1% of GNP
• 197830.1% of GNP
• 198155.7% of GNP
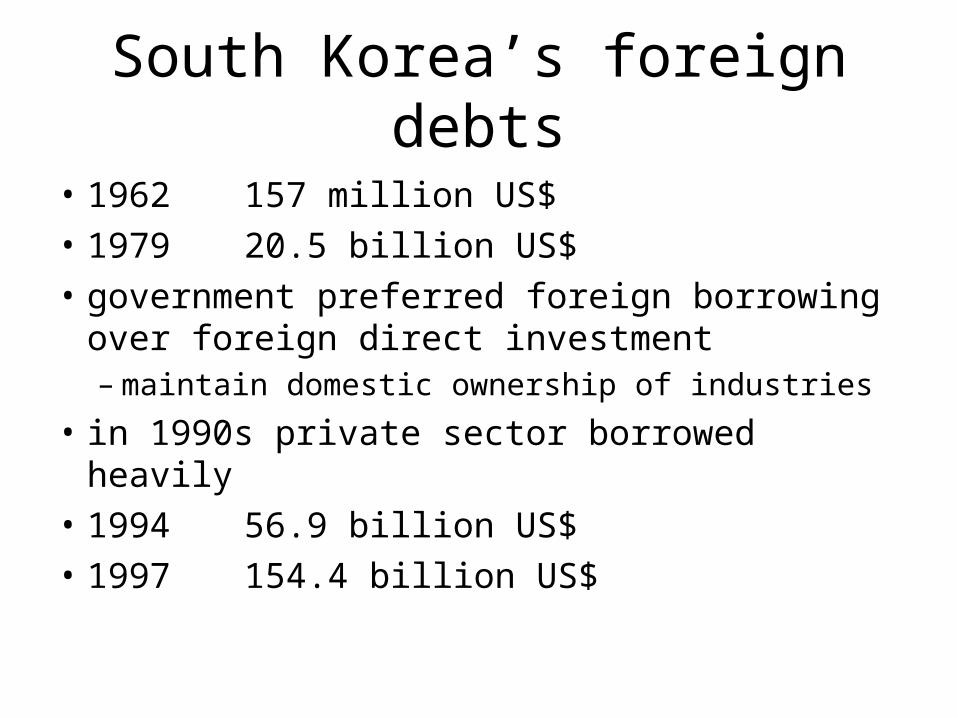
South Korea’s foreign debts
• 1962157 million US$
• 197920.5 billion US$
• government preferred foreign borrowing over foreign direct investment– maintain domestic ownership of industries
• in 1990s private sector borrowed heavily
• 199456.9 billion US$
• 1997154.4 billion US$
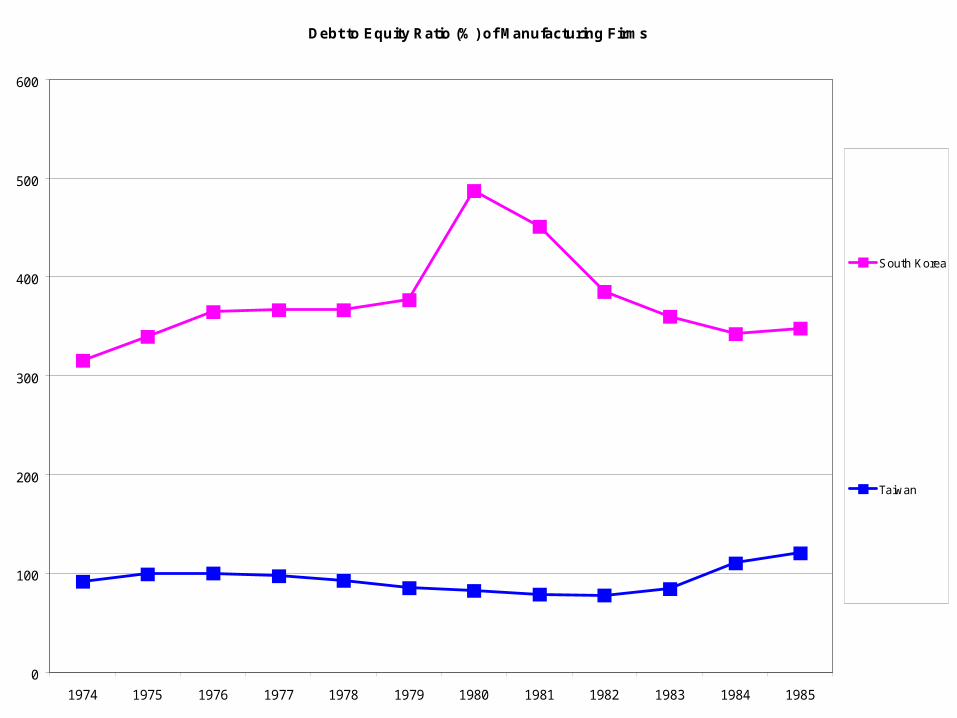
Debt to Equity Ratio (% ) of Manufacturing Firms
0
100
200
300
400
500
600
1974 1975 1976 1977 1978 1979 1980 1981 1982 1983 1984 1985
South Korea
Taiwan
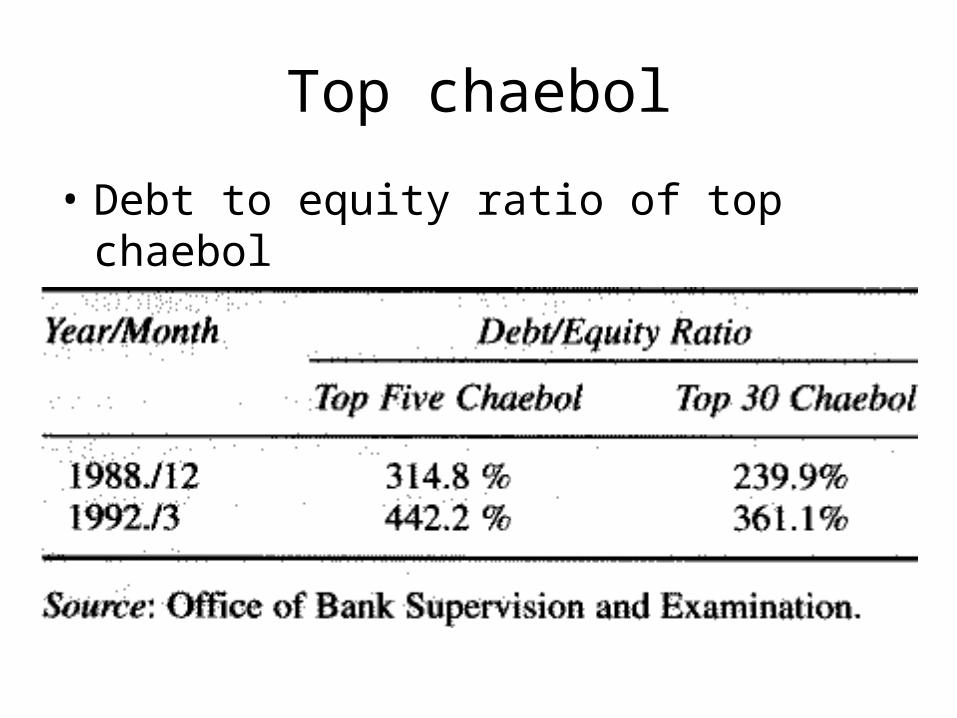
Top chaebol
• Debt to equity ratio of top chaebol
Taiwan’s financial sector
• Control inflation and maintain stability
• Central Bank of China ultra-conservative
• government controlled financial sector– nationalized the banking system– private commercial banks were not allowed to
operate until 1991– 71.3% of the assets of all financial institutions
were in government-owned banks
Result of financial control
• Traditional family networks became the major source of capital
• limited the size of Taiwan’s companies– small and medium-sized firms
• limited the expansion of firms
• limited the debt-equity ratio of firms
• most large, capital-intensive, technology-intensive industries were state-owned
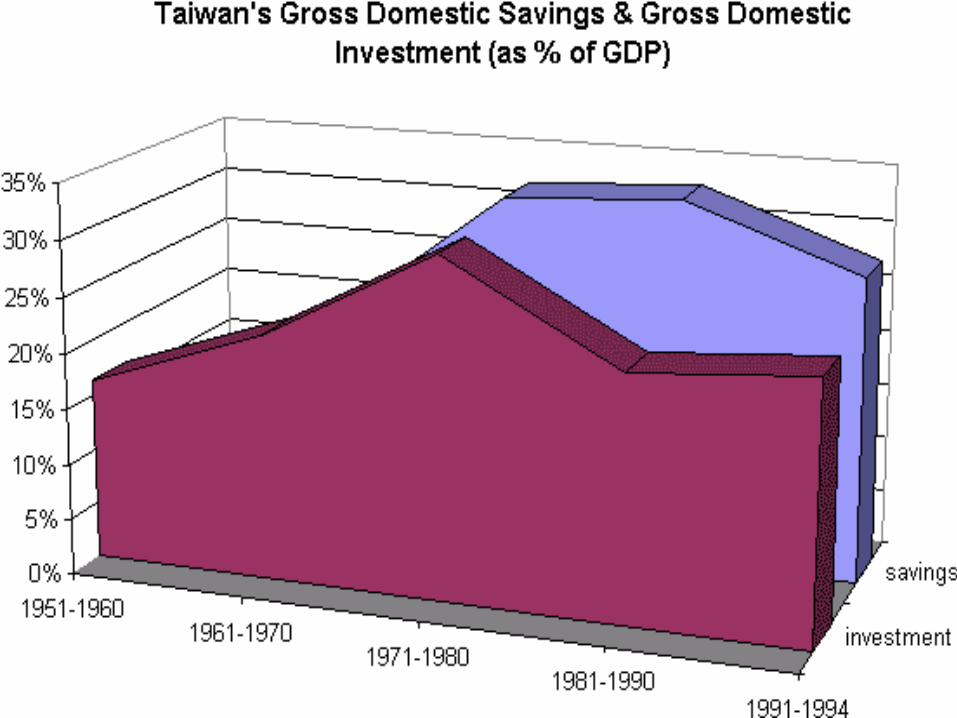
Equity-first versus growth-first
• Government’s anti-inflation policy– encouraged savings
• Government avoided concentration of economic power
• Government promoted equitable distribution of income
• Government’s reluctant to use preferential financial treatment to large firms