Comparison of seven in silico tools for evaluating of ...
31
Comparison of seven in silico tools for evaluating of daphnia and fish acute toxicity: case study on Chinese Priority Controlled Chemicals and new chemicals Linjun Zhou 1,2† , Deling Fan 2† , Wei Yin 2 , Wen Gu 2 , Zhen Wang 2 , Jining Liu 2 , Yanhua Xu 1* , Lili Shi 2* , Mingqing Liu 2 and Guixiang Ji 2 Abstract Background: A number of predictive models for aquatic toxicity are available, how- ever, the accuracy and extent of easy to use of these in silico tools in risk assessment still need further studied. This study evaluated the performance of seven in silico tools to daphnia and fish: ECOSAR, T.E.S.T., Danish QSAR Database, VEGA, KATE, Read Across and Trent Analysis. 37 Priority Controlled Chemicals in China (PCCs) and 92 New Chemi- cals (NCs) were used as validation dataset. Results: In the quantitative evaluation to PCCs with the criteria of 10-fold difference between experimental value and estimated value, the accuracies of VEGA is the high- est among all of the models, both in prediction of daphnia and fish acute toxicity, with accuracies of 100% and 90% after considering AD, respectively. The performance of KATE, ECOSAR and T.E.S.T. is similar, with accuracies are slightly lower than VEGA. The accuracy of Danish Q.D. is the lowest among the above tools with which QSAR is the main mechanism. The performance of Read Across and Trent Analysis is lowest among all of the tested in silico tools. The predictive ability of models to NCs was lower than that of PCCs possibly because never appeared in training set of the models, and ECO- SAR perform best than other in silico tools. Conclusion: QSAR based in silico tools had the greater prediction accuracy than category approach (Read Across and Trent Analysis) in predicting the acute toxicity of daphnia and fish. Category approach (Read Across and Trent Analysis) requires expert knowledge to be utilized effectively. ECOSAR performs well in both PCCs and NCs, and the application shoud be promoted in both risk assessment and priority activities. We suggest that distribution of multiple data and water solubility should be considered when developing in silico models. Both more intelligent in silico tools and testing are necessary to identify hazards of Chemicals. Keywords: QSAR, Category, Aquatic toxicity, Daphnia, Fish, In silico Open Access © The Author(s) 2021. Open Access This article is licensed under a Creative Commons Attribution 4.0 International License, which permits use, sharing, adaptation, distribution and reproduction in any medium or format, as long as you give appropriate credit to the original author(s) and the source, provide a link to the Creative Commons licence, and indicate if changes were made. The images or other third party material in this article are included in the article’s Creative Commons licence, unless indicated otherwise in a credit line to the mate- rial. If material is not included in the article’s Creative Commons licence and your intended use is not permitted by statutory regulation or exceeds the permitted use, you will need to obtain permission directly from the copyright holder. To view a copy of this licence, visit http:// creativecommons.org/licenses/by/4.0/. The Creative Commons Public Domain Dedication waiver (http://creativecommons.org/publi cdomain/zero/1.0/) applies to the data made available in this article, unless otherwise stated in a credit line to the data. RESEARCH ARTICLE Zhou et al. BMC Bioinformatics (2021) 22:151 https://doi.org/10.1186/s12859-020-03903-w *Correspondence: [email protected]; [email protected] † Linjun Zhou and Deling Fan contributed equally to this work 1 Nanjing Tech University, Nanjing 211816, China 2 Nanjing Institute of Environmental Sciences, Ministry of Ecology and Environment, Nanjing 210042, China
Transcript of Comparison of seven in silico tools for evaluating of ...

Comparison of seven in silico tools for evaluating of daphnia and fish acute toxicity: case study on Chinese Priority Controlled Chemicals and new chemicalsLinjun Zhou1,2†, Deling Fan2†, Wei Yin2, Wen Gu2, Zhen Wang2, Jining Liu2, Yanhua Xu1* , Lili Shi2*, Mingqing Liu2 and Guixiang Ji2
Abstract
Background: A number of predictive models for aquatic toxicity are available, how-ever, the accuracy and extent of easy to use of these in silico tools in risk assessment still need further studied. This study evaluated the performance of seven in silico tools to daphnia and fish: ECOSAR, T.E.S.T., Danish QSAR Database, VEGA, KATE, Read Across and Trent Analysis. 37 Priority Controlled Chemicals in China (PCCs) and 92 New Chemi-cals (NCs) were used as validation dataset.
Results: In the quantitative evaluation to PCCs with the criteria of 10-fold difference between experimental value and estimated value, the accuracies of VEGA is the high-est among all of the models, both in prediction of daphnia and fish acute toxicity, with accuracies of 100% and 90% after considering AD, respectively. The performance of KATE, ECOSAR and T.E.S.T. is similar, with accuracies are slightly lower than VEGA. The accuracy of Danish Q.D. is the lowest among the above tools with which QSAR is the main mechanism. The performance of Read Across and Trent Analysis is lowest among all of the tested in silico tools. The predictive ability of models to NCs was lower than that of PCCs possibly because never appeared in training set of the models, and ECO-SAR perform best than other in silico tools.
Conclusion: QSAR based in silico tools had the greater prediction accuracy than category approach (Read Across and Trent Analysis) in predicting the acute toxicity of daphnia and fish. Category approach (Read Across and Trent Analysis) requires expert knowledge to be utilized effectively. ECOSAR performs well in both PCCs and NCs, and the application shoud be promoted in both risk assessment and priority activities. We suggest that distribution of multiple data and water solubility should be considered when developing in silico models. Both more intelligent in silico tools and testing are necessary to identify hazards of Chemicals.
Keywords: QSAR, Category, Aquatic toxicity, Daphnia, Fish, In silico
Open Access
© The Author(s) 2021. Open Access This article is licensed under a Creative Commons Attribution 4.0 International License, which permits use, sharing, adaptation, distribution and reproduction in any medium or format, as long as you give appropriate credit to the original author(s) and the source, provide a link to the Creative Commons licence, and indicate if changes were made. The images or other third party material in this article are included in the article’s Creative Commons licence, unless indicated otherwise in a credit line to the mate-rial. If material is not included in the article’s Creative Commons licence and your intended use is not permitted by statutory regulation or exceeds the permitted use, you will need to obtain permission directly from the copyright holder. To view a copy of this licence, visit http:// creat iveco mmons. org/ licen ses/ by/4. 0/. The Creative Commons Public Domain Dedication waiver (http:// creat iveco mmons. org/ publi cdoma in/ zero/1. 0/) applies to the data made available in this article, unless otherwise stated in a credit line to the data.
RESEARCH ARTICLE
Zhou et al. BMC Bioinformatics (2021) 22:151 https://doi.org/10.1186/s12859-020-03903-w
*Correspondence: [email protected]; [email protected] †Linjun Zhou and Deling Fan contributed equally to this work1 Nanjing Tech University, Nanjing 211816, China2 Nanjing Institute of Environmental Sciences, Ministry of Ecology and Environment, Nanjing 210042, China

Page 2 of 31Zhou et al. BMC Bioinformatics (2021) 22:151
BackgroundGlobal regulations have called for systematic testing of potential environmental contam-inants to protect human health and the environment from exposure to anthropogenic chemicals, such as industrial chemicals and pharmaceuticals. Considering the ever-increasing number of chemicals, more than 350,000 chemicals and mixtures of chemi-cals been registered for production and use currently [1], are presenting challenges to traditional ecotoxicity testing strategies for in vivo experiments, which are expensive, time-consuming, and reliant on large number of animal subjects. Therefore, it is virtually impossible to test acute toxicity for all the chemicals used globally.
To mitigate the challenges associated with in vitro and in vivo toxicity testing, global regulations, including European Chemical Agency (ECHA) REACH initiative, U.S. Toxic Substances Control Act and Canadian Environmental Protection Act, encourage increased reliance on in silico approaches [2–5]. China is also attempting to explore the possibility using in silico approaches when chemicals risk assessment.
The cost-benefit advantages and regulatory support of in silico methods have led to the development of a number of tools for ecotoxicity assessments [6]. The major in silico methods including (Quantitative) Structure–Activity Relationships (QSAR), and chemi-cal category methods.
QSAR method uses a mathematical model that was derived from a training set of example chemicals. The training set includes the chemicals that were found to be positive and negative in a given toxicological study (e.g., the bacterial reverse muta-tion assay) or to induce a continuous response (e.g., Lowest Observed Adverse Effect Level in teratogenicity) that the model will predict. As part of the process to generate the model, physicochemical property based descriptors (e.g., molecular weight, octanol water partition coefficient (Kow)), electronic and topological descriptors (e.g., quan-tum mechanics calculations), or chemical structure-based descriptors (e.g., the pres-ence or absence of different functional groups) are generated and used to describe the training set compounds. The model encodes the relationship between these descriptors and the (toxicological) response. After the model is built and validated, it can be used to make a prediction. The (physical) chemical descriptors incorporated into the model are then generated for the test compound and are used by the model to generate a pre-diction. This prediction is only accepted when the test compound is sufficiently simi-lar to the training set compounds (i.e., it is considered within the applicability domain of the QSAR model, often considering the significance of descriptors). This applicabil-ity domain analysis may be performed automatically by some software to determine whether the training set compounds share similar chemical and/or biological properties with the test chemical [7].
Chemicals whose physical-chemical, toxicological and ecotoxicological properties are likely to be similar or follow a regular pattern as a result of structural similarity may be considered as a group, or ‘category’ of chemicals. The assessment of chemicals by using this category approach differs from the approach of assessing them on an individual basis, since the properties of the individual chemicals within a category are assessed on the basis of the evaluation of the category as a whole, rather than based on measured data for any one particular chemical alone. For (a) category member(s) that lacks data for one or more endpoints, the data gap can be filled in a number of ways, including

Page 3 of 31Zhou et al. BMC Bioinformatics (2021) 22:151
by read-across from one or more other category members. Within a chemical category, the members are often related by a trend in an effect for a given endpoint, and a trend analysis can be carried out through deriving a model based on the data for the members of the category [8].
In 2007, the Organization for Economic Co-operation and Development (OECD) guidelines on the development and validation of QSAR models were issued [9]. They proposed that a QSAR model for practical application should be associated with an unambiguous algorithm [10], a defined endpoint, an AD, appropriate goodness-of-fit measures, robustness as well as predictive ability, and a mechanistic interpretation, if possible [9, 11]. Despite these guidelines, lack of external validations and model perfor-mances of the test sets, model overfitting, and poor AD definitions remain major con-cerns [12–15]. A clear AD definition would ensure that the model assumptions are met [16, 17].
A number of studies developed in silico models for the endpoint of acute toxicity to daphnia and fish [18–22]. Specifically, some in silico tools were developed for ecological risk assessment and are widely used for support chemicals regulation purpose. These include: Ecological Structure Activity Relationships (ECOSAR) [23], Toxicity Estimation Software Tool (T.E.S.T.) [24], Kashinhou Tool for Ecotoxicity (KATE) [25], Virtual mod-els for property Evaluation of chemicals within a Global Architecture (VEGA) [26], Dan-ish QSAR Database (Danish Q.D.) [27], and QSAR Toolbox developed by OECD [28].
In view of the possible uses of in silico tools, regulators often use predictions from multiple in silico tools to arrive at a decision, such as persistence, bioaccumulation,and toxicity/very persistent and very bioaccumulative (PBT/vPvB) assessment and prior-itization [29]. In framework of regulation purpose, the performance of in silico tools requires not only accuracy, but also ease of use, and can fulfil the different purpose, such as qualitative risk assessment, quantitative risk assessment, and even high throughput screening [30].
Based on models for specific chemical classes and different classes of substances, some studies have compared the performance of some QSAR models for acute toxicity. Moore et al. [31] evaluated model performance of six QSAR modeling packages that predict acute toxicity to fish: ECOSAR, TOPKAT, a Probabilistic Neural Network, a Computa-tional Neural Network, the QSAR components of the Assessment Tools for the Evalua-tion of Risk (ASTER) system, and the Optimized Approach Based on Structural Indices Set (OASIS) system. Golbamaki et al. [32] evaluated and compared eight in silico model-ling packages that predict daphnia acute toxicity: TOPKAT, ACD/Tox Suite, ADMET Predictor™, ECOSAR, TerraQSAR™, T.E.S.T. and two models implemented in VEGA. Cassotti et.al [33]. evaluated the accuracy, stability and reliability of two acute toxicity models (MICHEM and ChemProp) to daphnia.
However, some of those evaluated tools were not easy to use and were not developed for regulatory purposes. These evaluation study did not include recently developed mod-els, such as QSAR Toolbox, Danish Q. D., KATE, or the latest version of prediction tools, such as VEGA. Finally, the performance of chemical category approach for predicting acute toxicity to fish and daphnia has not been evaluated.
To implement the regulatory requirements of the “Action Plan for Preven-tion and Control of Water Pollution,” the Ministry of Ecological Environment of
Page 4 of 31Zhou et al. BMC Bioinformatics (2021) 22:151
China issued the List of Priority Controlled Chemicals (PCCs) (the first batch) at the end of 2017 [34]. List of PCCs (the second batch) has been compiled and is under com-ment [35]. Most of these PCCs had been assessed shown the characteristic of PBT/vPvB, especially hazard to aquatic ecosystem. If a model can identify such eventually hazard-determining chemicals, it has great regulation application prospects. In addition, in sil-ico tools should also be able to predict the hazard of emerging chemical substances in order to respond to the premanufacture notification for new chemical substances.
In this study, we selected seven in silico tools, namely ECOSAR, T.E.S.T., Danish Q. D., VEGA, KATE, Read Across and Trent Analysis, to predict acute aquatic toxicity to daphnia and fish, in order to provide insight into the applicability, accuracy and ease of use (convenience and the level of expert knowledge required) of these in silico tools. The testsets used in this evaluation were PCCs which are representative the final chemicals in the regulatory management process and NCs which are representative of emerging substances.
MethodsValidation datasets
Systematic and rigorous model evaluation requires reliable experimental data. As such, acute aquatic toxicity experimental data (48-h LC50 for daphnia and 96-h LC50 for fish) of PCCs with a great reliability were obtained from resources such as ECHA’s risk assess-ment report, Good Laboratory Practice (GLP) reports, or study with standard test meth-ods were prioritize used. Other sources, such as ECHA, OECD eChemPortal database and QSAR Toolbox were also considered. If more than one data existed, a lowest reason-able value was used. Daphnia species were consist of Daphnia magna, Daphnia pulex. Fish species were consist of Lepomis macrochirus, Cyprinus carpio, Pimephales prome-las, Poecilia reticulate, Oncorhynchus mykiss, Oryzias latipes, and Brachydanio rerio et.al. within Actinopterygii.
A total of 92 NCs tested were used after removing the mixture and UVCBs (Chemical Substances of Unknown or Variable Composition, Complex Reaction Products and Bio-logical Materials), within which, there are 42 daphnia 48-h LC50 value and 82 fish 96-h LC50 value. These NCs were tested at the year from 2014 to 2017 using OECD testing guideline 202 [36] and 203 [36] under the GLP conditions in Lab of Chemical Testing and Assessment, Nanjing Institute of Environment Sciences, Ministry of Environment Protection (MEP), China. Daphnia species were Daphnia magna, and fish species were zebra fish. As these NCs came from chemical companies, the testing data is used for registration as the requirement of Measures for Environmental Management of New Chemical Substances in China. For confidentiality requirements, identification informa-tion of these NCs such as structural can not be provided. The functional groups con-tained were used to analysis and were obtained by module of organic functional groups (nested) in QSAR Toolbox.
Predictive tools
The following seven in silico methods were evaluated for predicting acute aquatic toxic-ity to daphnia and fish: ECOSAR, T.E.S.T., Danish Q. D., VEGA, KATE, Read Across in QSAR Toolbox, and Trent Analysis in QSAR Toolbox. All of seven in silico tools were
Page 5 of 31Zhou et al. BMC Bioinformatics (2021) 22:151
evaluated with PCCs dataset. Five tools including ECOSAR, T.E.S.T., Danish Q. D., VEGA and KATE were evaluated with NCs dataset.
Simplified Molecular Input Line Entry System (SIMLES) of each chemicals was used as input to models. A brief description of each program is provided below, and the perti-nent details are summarized in Table 1.
ECOSAR
ECOSAR estimates acute aquatic toxicity via the Mayer–Overton relationship for chem-icals within structurally similar classes. ECOSAR is trained on a large data set of ecotox-icity studies from the ECOTOX database that follow the U.S. EPA Office of Chemical Safety and Pollution Prevention guidelines, which comprise 130 structural classes. The log10 KOW values for each training set chemical is predicted using the KOWWIN pro-gram from U.S. EPA’s Estimation Programs Interface Suite (EPISuit) model. The linear regression models between the LC50 toxicity estimates and log10 KOW were developed for substances in each class. The predicted results of acute toxicity of fresh water other than saltwater were select to validation. Chemicals that do not meet the log10 KOW range are considered to lie outside the AD.
KATE
KATE estimates acute aquatic toxicity via the Mayer–Overton relationship for chemi-cals within a total of 40 structural chemical classes [37, 38]. KATE is trained on the US EPA fathead minnow (Pimephales promelas) and the Japanese Ministry of Environment Oryzias latipes datasets [25]. The log KOW value of the test chemical, which is obtained from an internal experimental database or is estimated with the alternative forced choice method. The relationship between LC50 value and log10 Kow is obtained by linear regres-sion. log10 Kow of predicted substance is compared to the range of log Kow values in each structural class of the training set, and it internally defines the ADs. The lowest predicted values were used to validation.
T.E.S.T
T.E.S.T. estimates acute aquatic toxicity using several QSAR methodologies: hierarchical clustering, single model, the Food and Drug Administration method, multilinear regres-sion method, group contribution method, mode of action method, nearest neighbour method and consensus methods. In the default consensus methods (used to validation), the predicted toxicity is simply the average of the predicted toxicities from the above QSAR methodologies (taking into account the applicability domain of each method). T.E.S.T. is trained on the endpoint from the EPA ECOTOX database [39]. T.E.S.T has AD for each method and a final AD where predicitons must be made by at least 2 meth-ods for a consensus value to be used. If only a single QSAR methodology can make a prediction, the predicted value is deemed unreliable and not used. So if there is a pre-dicted value given by consensus methods, we defined this situation as in the AD.
VEGA
VEGA provides seven models to predict the fish acute toxicity: (1) SarPy/IRFMN (V1.0.2), QSAR classification model based on fragments built by SarPy software. (2)

Page 6 of 31Zhou et al. BMC Bioinformatics (2021) 22:151
Tabl
e 1
Sum
mar
y of
the
pred
ictiv
e to
ols
Para
met
ers
ECO
SAR
T.E.
S.T.
Dan
ish
Q.D
.VE
GA
KATE
Read
Acr
oss
Tren
t Ana
lysi
s
Vers
ion
V2.0
V4.2
.1N
ot a
vaila
ble
V1.1
.520
20 V
1.0
QSA
RToo
lbox
V4.
4Q
SART
oolb
ox V
4.4
AD
defi
nitio
nK O
W ra
nge
Stru
ctur
al s
imila
rity
Not
ava
ilabl
eFi
ve A
D in
dex
K OW
rang
eKo
w ra
nge
and
func
tiona
l gro
ups
sim
ilarit
y
Kow
rang
e an
d fu
nctio
nal g
roup
s si
mila
rity
AD
judg
eM
anua
llyA
utom
atic
Aut
omat
icA
utom
atic
Aut
omat
icA
utom
atic
Aut
omat
ic
Alg
orith
mQ
SAR,
Lin
ear r
egre
ssio
nQ
SAR,
Hie
rarc
hica
l cl
uste
ring,
Sin
gle
mod
el, G
roup
con
tri-
butio
n, F
DA
, Nea
rest
ne
ighb
or
QSA
R, L
eads
cope
: pa
rtia
l lea
st s
quar
es,
part
ial l
ogis
tic
regr
essi
on; S
ciQ
SAR:
re
gres
sion
on
prin
ci-
pal c
ompo
nent
s an
d pa
rtia
l lea
st s
quar
es
regr
essi
on, e
t.al.
Seve
n m
odel
s fo
r fish
, co
verin
g Q
SAR
and
Read
Acr
oss;
two
QSA
R m
odel
s fo
r D
aphn
ia m
agna
,
QSA
R, L
inea
r reg
ress
ion
Che
mic
al C
ateg
ory
Che
mic
al C
ateg
ory
Dap
hnia
Dap
hnia
mag
na, D
aph-
nia
pule
xD
aphn
ia m
agna
Dap
hnia
mag
naD
aphn
ia m
agna
Dap
hnia
mag
naD
aphn
ia m
agna
Dap
hnia
mag
na
Trai
ning
set
s si
ze o
f da
phni
a10
0035
362
6N
ot a
vaila
ble
562
> 1
> 1
Fish
spe
cies
Lepo
mis
mac
roch
irus,
Cypr
inus
car
pio,
Pi
mep
hale
s pro
mel
as,
Poec
ilia
retic
ulat
e,
Onc
orhy
nchu
s myk
iss,
Ory
zias
latip
es, a
nd
Brac
hyda
nio
rerio
Pim
epha
les p
rom
elas
Pim
epha
les p
rom
elas
Pim
epha
les p
rom
elas
, et
.al.
Ory
zias
latip
es, P
ime-
phal
es p
rom
elas
Actin
opte
rygi
iAc
tinop
tery
gii
Trai
ning
set
s si
ze o
f fish
1000
823
565
Not
ava
ilabl
e53
5>
1>
1

Page 7 of 31Zhou et al. BMC Bioinformatics (2021) 22:151
KNN/Read-Across (V 1.0.0), Read-Across model. (3)NIC (V1.0.0), QSAR quantita-tive modely based on a Neural Network. (4) IRFMN (V1.0.0), Quantitative model. (5) IRFMN/Combase (V1.0.0), Quantitative model, specific for biocides, developed by IRFMN for the Combase EU project. (6) EPA (V 1.0.7), QSAR model for Fathead Min-now LC50 (96 h), based on multiple linear regression. The model extends the original model implemented in the T.E.S.T. software. (7) KNN/IRFMN(V1.1.0). KNN model on fathead minnow.
VEGA provides two models to predict the daphnia acute toxicity: (1) EPA (1.0.7), QSAR model, based on multiple linear regression. The model extends the original model implemented in the T.E.S.T. software. (2) DEMETRA (1.0.4), Hybrid Model upon two ANNs and a single PLS for pesticides.
Two sets of fragments have been considered and implemented in VEGA and freely available: Functional Groups that account for 154 chemical groups, and Atom-Cantered Fragments (ACF), for 115 fragments, each one corresponding to a type of atom with different connectivity. The software to analyse the chemical space checks for the pres-ence of the above mentioned Functional Groups and ACF, then reports, for each of these chemical features, the total number of matches, the number of matches in each class, and its percentage. The overall reliability of the prediction is measured by combining statistical values, elements of case based reasoning, and possibly presence of active sub-structures. The possible reasons of concern are underlined. All those considerations are weighted and summed up in an index (in 0–1) that is called Applicability Domain Index (ADI) [26].
Fig. 1 Recommended integrated assessment strategy with different models in VEGA when predicting the fish acute toxicity

Page 8 of 31Zhou et al. BMC Bioinformatics (2021) 22:151
All of the seven models predicting the fish acute toxicity and two models predicting daphnia acute toxicity were used with an integrated method (Fig. 1), except that experi-mental values were not used. The predicted results with good reliability were deem as inside the AD, else deem as outside the AD.
Danish Q. D
Danish Q. D. includes nearly all organic single constituent substances that were pre-registered or registered under REACH (around 80,000). The database was developed by Technical University of Denmark. The endpoints are modelled in two software systems (Leadscope, and SciQSAR), and an overall battery prediction is made to reduce “noise” from the individual model estimates and thereby improve accuracy and broaden the AD [27, 40].
Leadscope is a software program for systematic sub-structural analysis of a chemical using predefined structural features stored in a template library, training set-dependent generated structural features (scaffolds) and calculated molecular descriptors. Lead-scope has a default automatic descriptor selection procedure. This procedure selects the top 30% of the descriptors (structural features and molecular descriptors) accord-ing to X2-test for a binary variable or the top and bottom 15% descriptors according to t-test for a continuous variable. After selection of descriptors the program performs par-tial least squares (PLS) regression for a continuous response variable, or partial logistic regression for a binary response variable, to build a predictive model.
The SciQSAR software provides over 400 built-in molecular descriptors such as con-nectivity indices, electrotopological (atom E and HE-state) indices, and other descrip-tors. For continuous data, regression analysis is used to build the predictive model, and a number of different regression methods are available such as regression on principal components and PLS.
The Battery results were used firstly. If not given for Battery results, the lowest toxicity value of Leadscope and SciQSAR was selected to verification.
Trent Analysis and Read Across
OECD QSAR Toolbox finds structurally and mechanistically defined analogues and chemical categories, which serve as sources for Read Across, Trent Analysis and QSAR for filling in data gaps. QSAR Toolbox has multiple functions, such as identifying ana-logues of a chemical, retrieving the existing experimental results of those analogues, and filling in data gaps through Read Across, Trent Analysis or QSAR.
The predictions of Read Across and Trent Analysis were accomplished by collecting a set of test data for PCCs considered to be in the same category as the target molecule. The category was firstly defined using categorization method of “Organic functional groups (nested)”. The analogues of each PCCs were identified. Then all available exper-imental data on 48 h-LC50 value for daphnia and 96 h-LC50 value for Actinopterygii of identified analogues were retrieved from the selected databases (Aquatic ECETOC, Aquatic Janpan MoE, Aquatic OASIS, ECHA REACH, ECOTOX and Food TOX Haz-ard EFSA). Finally the Read Across and Trend Analysis were implemented with internal standardized workflow. By default of Read Across, the QSAR Toolbox averages the result of the 5 “nearest” analogues (log10 Kow in this case) to estimate the result for the target

Page 9 of 31Zhou et al. BMC Bioinformatics (2021) 22:151
chemical. AD of each prediction was recorded as it automatic assessed by combing the log10 Kow range and organic functional groups similarity. log10 Kow must be in the range of all collected analogues, and organic functional groups must be included by that of all collected analogues.
Statistical analysis
Two types of method were used to quantify the performance of all the models to PCCs: qualitative assessment and quantitative assessment methods. Only qualitative assess-ment was used to quantify the performance of the five models to NCs, as most of NCs were not harmful and only a limit test result of 96-h LC50 > 100 mg/L were given.
Qualitative effect assessment only needs classified chemicals according to toxic-ity values (Table 2). This is related to the toxicity classes described in the The Globally Harmonized System of Classification and Labelling of Chemicals (GHS) [41]. These clas-sification criteria are accepted by most of countries as regulatory classes. In qualitative assessment, the experimental data and predicted data were classified into four classes based GHS criteria of United Nations (Table 2). If the predicted value and the experi-mental value are in the same regulation category, the prediction can be considered accu-rate without specific values.
Quantitative assessment needs exact toxicity value to obtain the risk quotient [42]. In quantitative assessment, the difference between predicted and measured LC50 value was analysed, with difference factors of 10, 100 and 100.
A number of summary statistics were calculated to compare model performance. The correlation coefficient (R2), correlation coefficient of the AD (R2
AD), root mean square error (RMSE), and percent of accuracy between predicted and measured tox-icity were statistic with Microsoft excel. Software of IBM SPSS Statistics (V19) was used to obtain distribution of difference frequency between log10 experimental LC50 and log10 estimated LC50.
Total accuracy was calculated as:
Similar to total accuracy, predictive power measures the total number of cor-rect category assignments. However, lack of prediction was treated as an incorrect assignment:
Total accuracy =
No.of correct
No.of all −No.of missing predictions× 100%
Predictive power =No.of correct
No.of all× 100%
Table 2 Classification criteria of acute toxicity according to GHS
Toxicity range (mg/L) Class
LC50 ≤ 1 1 (very toxic)
1 < LC50 ≤ 10 2 (toxic)
10 < LC50 ≤ 100 3 (harmful)
LC50 > 100 4 (not harmful)

Page 10 of 31Zhou et al. BMC Bioinformatics (2021) 22:151
ResultsStatistical distribution of experimental values
The 37 PCCs assessed in this study represent a diverse array of commercial sub-stances. They include olefins, nitrobenzene, perfluorinated and polyfluoro com-pounds, halogenated hydrocarbon, halogenated benzene, organophosphate, phenols, aldehydes, organophosphate, phthalates, polycyclic aromatic hydrocarbons. The experimental LC50 values of 37 chemicals cover all regulatory categories (Fig. 2 (A) and (B)). 43% of chemicals are very toxic chemicals. The number of very toxic, toxic and hazardous chemicals are account for 92 and 86% of all the chemicals for daphnia and fish acute toxicity, respectively.
The NCs assessed in this study include almost all of the organic functional groups. They are much more complex as many of which have two or more functional groups, and the most complex NC have 12 functional groups. The overall toxicity of NCs are lower than PCCs shown in Fig. 2 (c) and (d). The number of non-toxicity NCs account for 57 and 65% of total NCs to Daphnia and fish, respectively.
Acute toxicity of daphnia
Experimental and predicted toxicity values to daphnia for the 37 PCCs are shown in Table 3, for the results of NCs can be found in section of “Availability of data and materials”.
Models performance across the entire data set
Model performance was evaluated on the entire 37 PCCs and 42 NCCs. The perfor-mance metrics for all models tested in this evaluation to acute toxicity of daphnia are summarized in Table 4.
Prediction to 37 PCCs In qualitative assessment based on classification into the four toxicity classes of the entire 37 PCCs data set, KATE has total accuracies of 84%, which is highest among all of the test models. However, the predictive power of KATE is decrease to 57% as it did not predict 12 of PCCs, which is most among all of the test models. ECOSAR predict all of the PCCs, both of total accuracy and the predictive power is 65%. Based on total accuracies, the tested tools can be ranked in the following order from highest- to lowest-performers: KATE > ECOSAR >T.E.S.T. > Danish Q.D. > VEGA>Read Across>Trend Analysis. KATE shows the excellent performance as only five PCCs were predicted incorrectly.
In quantitative assessment based on comparison of the LC50 value of PCCs provided by models, the KATE and ECOSAR shows better performance with accuracies of 80 and 76%, respectively, when predictions fall within a factor 10 of the measured LC50. All of the models can achieve the accuracy of 80% when differences between measured and predicted toxicity within a factor 100, except for Trent Analysis was only 55%. From Coefficient of variance (R2) in both qualitative assessment and quantitative assessment, it can be further prove that KATE has the best performance.

Page 11 of 31Zhou et al. BMC Bioinformatics (2021) 22:151
Prediction to 42 NCs In qualitative assessment based on classification into the four toxicity classes of the entire 42 NCs dataset, total accuracy and predictive power are decrease dramatically compare with to PCCs. Danish Q.D and KATE have 18 and 22 chemicals that could not be predicted, which are relative higher than other model. These indicate that the performance of models are poor to NCs, and predictive power to NCs is limited.
16
7
11
3
0.0
0.2
0.4
0.6
0.8
1.0
0
5
10
15
20
LC50 ≤ 1 1 <LC50 ≤ 10 10<LC50 ≤ 100 LC50>100
Cum
ula�
ve fr
eque
ncie
s
Freq
uenc
y
PCCs
a Frequency Cumula�ve
16
8 8
5
0.0
0.2
0.4
0.6
0.8
1.0
0
5
10
15
20
LC50 ≤ 1 1 <LC50 ≤ 10 10<LC50 ≤ 100 LC50>100
Cum
ula�
ve fr
eque
ncie
s
Freq
uenc
y
PCCs
b Frequency Cumula�ve
8 5 5
24
0.0
0.2
0.4
0.6
0.8
1.0
0
5
10
15
20
25
30
LC50 ≤ 1 1 <LC50 ≤ 10 10<LC50 ≤ 100 LC50>100
Cum
ula�
ve fr
eque
ncie
s
Freq
uenc
y
NCs
c Frequency Cumula�ve
5 11 14
56
0.0
0.2
0.4
0.6
0.8
1.0
0
10
20
30
40
50
60
LC50 ≤ 1 1 <LC50 ≤ 10 10<LC50 ≤ 100 LC50>100
Cum
ula�
ve fr
eque
ncie
s
Freq
uenc
y
NCs
d Frequency Cumula�ve
Fig. 2 Distribution of acute toxicity of experimental values (mg/L). a 48-LC50 of daphnia for PCCs. b 96-h LC50 of fish for PCCs. c 48-LC50 of daphnia for NCs. b 96-h LC50 of fish for NCs.

Page 12 of 31Zhou et al. BMC Bioinformatics (2021) 22:151
Tabl
e 3
Expe
rimen
tal a
nd p
redi
cted
toxi
city
val
ues
to d
aphn
ia fo
r the
37
PCC
s
CA
S N
o.C
hem
ical
nam
eEx
p.EC
OSA
RT.
E.S.
T.D
anis
h Q
.D.
VEG
ARe
ad A
cros
sTr
end
Ana
lysi
sKA
TE
LC50
LC50
AD
LC50
AD
LC50
AD
LC50
AD
LC50
AD
LC50
AD
LC50
AD
120–
82-1
1,2,
4-Tr
ichl
orob
enze
ne1.
681.
88In
2.88
In1.
04In
2.69
In5.
36In
171
In1.
60In
81–1
5-2
Mus
k xy
lene
0.15
45.7
In2.
41In
1.38
In6.
71O
ut6.
90In
0.55
InIn
NA
75–0
9-2
Dic
hlor
omet
hane
27.0
146.
0In
59.0
6In
NA
81.9
2In
148
InIn
115
In51
.00
In
50–0
0-0
Form
alde
hyde
29.0
12.0
InN
AN
AN
A26
10In
8090
InN
A
77–4
7-4
Hex
achl
oroc
yclo
pent
adie
ne0.
039
0.21
In1.
04In
0.11
Out
0.07
Out
0.11
Out
NA
NA
25,6
37–9
9-4
Hex
abro
moc
yclo
dode
cane
0.00
320.
0035
Out
0.16
In0.
01O
ut0.
43O
ut0.
17O
ut−
84.0
Out
0.00
Out
91–2
0-3
Nap
htha
lene
1.96
5.94
In8.
14In
3.26
Out
0.24
In11
.5In
99.0
AD
3.90
In
1763
-23-
1H
epta
deca
fluor
ooct
anes
ulfo
nic
acid
37.0
416
.9In
NA
18.2
0O
ut12
.01
Out
63,8
00In
29,9
00In
NA
307–
35-7
Perfl
uoro
-1-o
ctan
esul
fony
l fluo
ride
100
0.00
51O
utN
A19
.98
In2.
51O
utN
AN
AN
A
2795
-39-
3Po
tass
ium
per
ufluo
rooc
tane
sul
fona
te27
.016
.9In
NA
19.9
8In
NA
12,0
00In
17,5
00In
NA
25,1
54–5
2-3
Non
ylph
enol
0.14
0.16
8In
0.55
In0.
32In
3.88
Out
3.58
In0.
57In
0.12
In
9016
-45-
9N
P-po
ly(e
thyl
eneo
xy)e
than
ol0.
150.
211
Out
2.58
In3.
15In
1.03
Out
12.7
0O
ut21
.80
Out
0.09
Out
67–6
6-3
Chl
orof
orm
29.0
143
In77
.40
InN
A17
.07
Out
198
In11
0In
63O
ut
79–0
1-6
Tric
hlor
oeth
ylen
e43
.07.
91In
36.1
0In
11.0
8O
ut5.
27O
ut8.
51In
12.8
0In
10In
127–
18-4
Tetr
achl
oroe
thyl
ene
18.2
3.68
In9.
86In
4.13
Out
21.9
2In
20.5
In21
.7In
4.6
In
75–0
7-0
Ace
tald
ehyd
e12
,418
32.6
829
In58
3In
117
Out
126
Out
− 4
51O
utN
A
732–
26-3
2,4,
6-Tr
i-ter
t-bu
tylp
heno
l0.
072
0.10
8In
0.09
36In
0.80
6In
19.2
3O
ut3.
16O
ut−
3.32
Out
0.16
In
68,9
37–4
1-7
Isop
ropy
lphe
nyl p
hosp
hate
1.5
0.00
44O
ut0.
0115
In0.
0007
4O
ut0.
0002
Out
1.41
In2.
91In
NA
50–3
2-8
Benz
o[de
f]ch
ryse
ne0.
250.
0016
Out
0.2
In0.
225
In0.
1512
Out
NA
NA
NA
120–
12-7
Ant
hrac
ene
0.03
560.
809
In0.
7In
1.21
In0.
1007
In0.
173
Out
0.05
5N
A0.
8In
56–5
5-3
Benz
[a]a
nthr
acen
e0.
140.
101
Out
0.28
In0.
359
In0.
1239
Out
0.25
Out
NA
0.00
74O
ut
53–7
0-3
Dib
enz[
a,h]
anth
race
ne0.
0005
510.
0044
Out
0.11
In0.
138
In0.
0768
Out
0.19
8O
utN
A0.
012
Out
106–
46-7
1,4-
Dic
hlor
oben
zene
2.2
5.45
In4.
16In
3.07
In5.
9In
6.83
In30
3In
3.8
In
608–
93-5
Pent
achl
orob
enze
ne0.
180.
203
Out
0.65
In0.
641
In0.
7177
Out
108
In53
.9In
0.27
In
71–4
3-2
Benz
ene
1036
.9In
49.1
In7.
65O
ut19
.34
Out
181
In2.
26E7
In16
In
Page 13 of 31Zhou et al. BMC Bioinformatics (2021) 22:151
Tabl
e 3
(con
tinue
d)
CA
S N
o.C
hem
ical
nam
eEx
p.EC
OSA
RT.
E.S.
T.D
anis
h Q
.D.
VEG
ARe
ad A
cros
sTr
end
Ana
lysi
sKA
TE
LC50
LC50
AD
LC50
AD
LC50
AD
LC50
AD
LC50
AD
LC50
AD
LC50
AD
108–
88-3
Tolu
ene
3.78
14.8
In25
In5.
44In
15.7
9O
ut18
5In
56.8
In4.
5In
115–
96-8
Tris
(2-c
hlor
oeth
yl) p
hosp
hate
170
135
In0.
0403
In0.
0857
In0.
0004
Out
104
Out
113
Out
NA
117–
81-7
Bis(
2-et
hylh
exyl
) pht
hala
te0.
370.
01O
ut0.
99In
7.06
Out
0.02
99O
ut0.
0363
In0.
0696
In0.
027
Out
84–7
4-2
Dib
utyl
pht
hala
te0.
51.
75In
6.61
In17
.5In
1.74
2In
6.38
In73
.6In
3In
85–6
8-7
Benz
yl b
utyl
pht
hala
te0.
741.
4In
3.17
In9.
92In
0.07
67O
ut2.
84In
4.96
In2.
5In
84–6
9-5
Diis
obut
yl p
htha
late
32.
17In
6.44
In26
.2In
0.10
47O
ut0.
0204
Out
−0.
0906
Out
3.7
In
78–8
7-5
1,2-
dich
loro
prop
ane
55.9
32.2
In50
.1In
13.1
Out
150.
2In
15.8
Out
NA
14In
75–3
5-4
1,1-
Dic
hlor
oeth
ylen
e37
12In
10.3
In15
.2O
ut19
.49
In75
In59
In15
In
121–
14-2
2,4-
Din
itrot
olue
ne34
.931
.8In
4.06
In8.
04In
7.82
Out
7.92
In30
.8In
0.27
In
95–5
3-4
o-To
luid
ine
0.52
23.3
In1.
49In
6.82
In6.
48O
ut9.
13O
ut11
.8O
utN
A
335–
67-1
Pent
adec
afluo
rooc
tano
ic a
cid
202
7.44
In10
.3In
37.2
In1.
14O
ut1.
01E6
Out
1.02
E6O
utN
A
87–8
6-5
Pent
achl
orop
heno
l0.
730.
711
In0.
19In
0.76
9O
ut1.
29In
0.74
8O
ut0.
886
Out
0.61
In

Page 14 of 31Zhou et al. BMC Bioinformatics (2021) 22:151
Model performance within AD
Robust and relevant AD definition is essential for model performance. Model perfor-mance within ADs is shown in Table 5.
Prediction to 37 PCCs ECOSAR has the most chemicals inside the AD, with 27 of the 37 PCCs. VEGA has the least chemicals inside the AD, with 10 of the 37 tested chemi-cals, showing a rigorous AD assessment mechanism.
Table 4 Tool performance and comparison summary statistics to 48 h-LC50 of daphnia based on entire dataset
a Total accuracy is the fraction of chemicals assessed by each tool for which the predicted LC50 falls within the same regulatorycategory as the measured LC50. b Similar to total accuracy, predictive power measures the total number of correct category assignments. However, lack of prediction is treated as an incorrect assignment. c Not analyzed
Chemicals Methods Measures of predictive performance
ECOSAR T.E.S.T. Danish Q.D.
VEGA Read Across
Trend Analysis
KATE
37 PCCs Number of missing predic-tions
0 4 3 2 2 6 12
Qualita-tive
Number of correct
24 21 20 18 16 14 21
Number of incorrect
13 12 14 17 19 17 4
Total accuracy (%)a
65 64 59 51 46 45 84
Predictive power (%)b
65 57 54 49 43 38 57
R2 (toxicity class)
0.46 0.46 0.37 0.29 0.51 0.33 0.65
Quantita-tive
Accuracy within a factor of 10 (%)
76 67 68 63 49 45 80
Accuracy within a factor of 100 (%)
86 91 91 80 83 55 96
Accuracy within a fac-tor of 1000 (%)
97 97 94 94 94 81 100
R2(log10 LC50) 0.40 0.42 0.38 0.13 0.42 0.40 0.68
42 NCs Qualita-tive
Number of correct
22 9 13 9 /c / 9
Number of incorrect
16 22 11 32 / / 11
Number of missing predictions
4 11 18 1 / / 22
Total accuracy (%)a
58 29 54 22 / / 45
Predictive power (%)b
52 21 31 21 / / 21
R2 (toxicity class)
0.35 0.04 0.50 0.04 / / 0.36

Page 15 of 31Zhou et al. BMC Bioinformatics (2021) 22:151
In qualitative assessment, the accuracies of VEGA increased slightly from 51 to 60% after considering AD. T.E.S.T. kept at 64%. The accuracies of other five tools did not increase when inside the AD.
Table 5 Model performance to 48 h-LC50 of daphnia for chemicals within each applicability domains
a Not analyzed
Chemicals Method Measures of predictive accuracy
ECOSAR T.E.S.T. Danish Q. D.
VEGA Read Across
Trend Analysis
KATE
37 PCCS General Number of inside AD
27 22 22 10 21 22 19
Number of outside AD and missing prediction
10 4 15 27 16 15 18
Qualita-tive
Number of correct
17 21 12 6 6 9 15
Number of incorrect
10 12 10 4 15 13 4
Accuracy inside AD (%)
63 64 55 60 29 41 79
Coefficient of variance (R2
AD)
0.40 0.46 0.28 0.58 0.29 0.54 0.53
Quantita-tive
Accuracy within a factor of 10 (%)
85 67 59 100 52 55 89
Accuracy within a factor of 100 (%)
96 91 91 100 86 64 95
Accuracy within a fac-tor of 1000 (%)
100 97 96 100 95 96 100
RMSE (log10 scale)
0.82 0.91 1.24 0.48 1.49 2.06 0.70
R2AD (log10 LC50)
0.51 0.42 0.43 0.82 0.35 0.36 0.51
57 NCs Qualita-tive
Number of inside AD
32 31 13 10 /a / 10
Number of outside AD and missing prediction
10 11 29 31 / / 32
Number of correct
20 9 7 3 / / 4
Number of incorrect
12 22 6 7 / / 6
Accuracy inside AD (%)
63 29 54 30 / / 40
Coefficient of variance (R2
AD)
0.45 0.04 0.76 0.09 / / 0.66

Page 16 of 31Zhou et al. BMC Bioinformatics (2021) 22:151
Accuracies and R2AD of Danish Q.D., Read Across and KATE after considering the AD
are decreasing. Some PCCs with correct predicted were excluded as a results of outside the AD. Danish Q.D., Read Across and KATE assess the AD by the range of log10 Kow and structural classes, and the methods are not as rigorous as used by VEGA. Similar phenomena was also found by Melnikov et.al [43]. that KATE total accuracy decreased from 58 to 46% when analysis is limited to the compounds within its AD.
In quantitative assessment, performance of all tools is increase when inside the AD. VEGA shows the best performance with 100% accuracy when predictions fall within a factor 10 of the measured LC50. VEGA also has the lowest RMSE (0.48 log10 units) and highest R2
AD (0.82). Read Across and Trent Analysis have the worst predictive ability from all of the indictors: accuracies, RMSE and R2
AD.
In general, Based on the accuracies of quantitative assessment, the tested tools for daph-nia can be ranked in the following order, from the highest to the lowest performers: VEGA> KATE > ECOSAR > T.E.S.T. > Danish Q.D > Trend Analysis > Read Across.
Prediction to 57 NCs The number of NCs outside the AD and missing prediction are more for Danish Q.D, VEGA and KATE, except for ECOSAR and T.E.S.T. Accura-cies inside AD of ECOSAR and Danish Q. D. are still high as same as in prediction to PCCs, whereas, T.E.S.T., VEGA and KATE are lower with accuracies of 29, 30 and 40%, respectively.
Figure 3 shows the error distribution of the daphnia toxicity predictions to PCCs and NCs with respect to under- and overestimation. Positive errors indicate predicted LC50 is above experimental LC50 and toxicity is underestimated. Considering the error of pre-diction between the log10 LC50 of the experimental value and the log10 LC50 of the esti-mated toxicity value provided by the model, over- and underestimation of daphnia by ECOSAR, T.E.S.T, Danish Q.D. and KATE are more or less similarly distributed. Daph-nia toxicity predicted by VEGA appear to be overestimated, whereas, Read Across and
Fig. 3 Errors distribution (predicted – experimental) of daphnia toxicity categories. Positive errors indicate predicted LC50 is above experimental LC50 and toxicity was underestimated. Dataset of Read Across and Trend Analysis were based on PCCs, others were based on both PCCs and NCs. Mean is average error, SD is Standard Deviation, and N is number of chemicals.
Page 17 of 31Zhou et al. BMC Bioinformatics (2021) 22:151
Trent Analysis are underestimated significantly. Underestimated toxicity does not meet the principal of reasonable worst-case.
Acute toxicity of fish
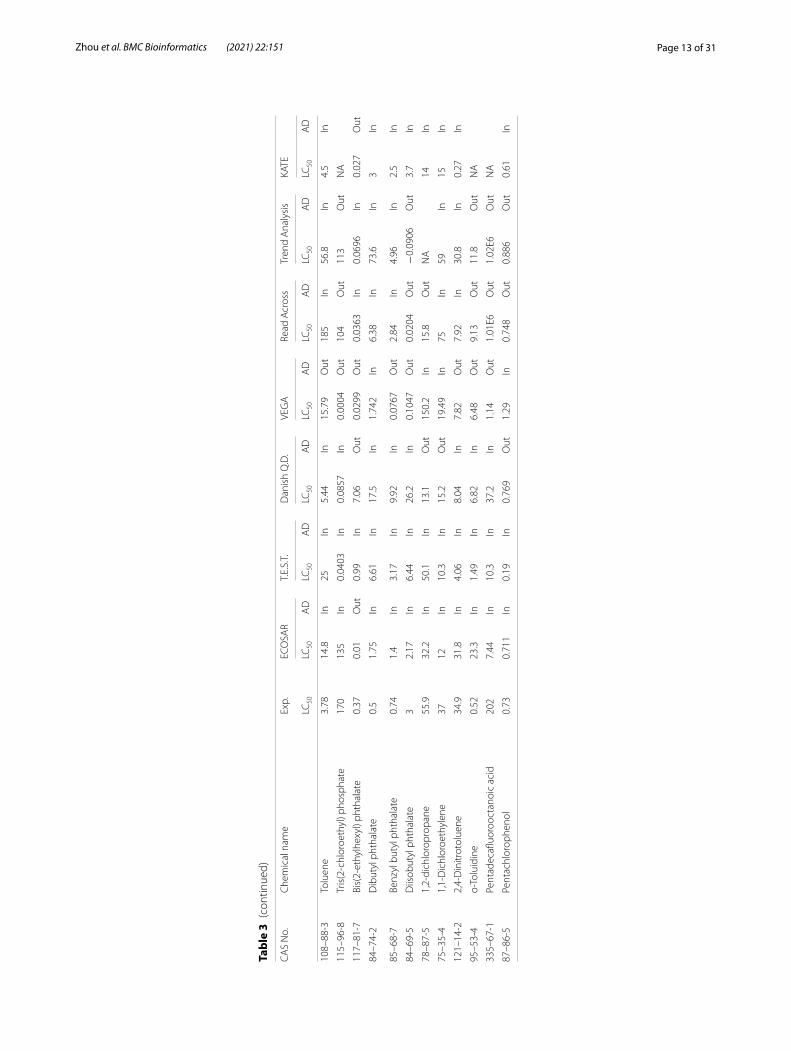
Experimental and predicted toxicity results to fish for the 37 PCCs are shown in Table 6, for the results of 86 NCs can be found in section of “Availability of data and materials”.
Model performance across the entire test set
Models performance were first evaluated on the entire dataset regardless of the AD to assess the tool utility for any new or existing chemical. The performance metrics for all models tested in this evaluation to acute toxicity of fish are summarized in Table 7.
Prediction to 37 PCCs In qualitative assessment based on predictive power of classifi-cation into the four toxicity categories of the entire dataset, all models besides ECOSAR are performance not well, with accuracies not more than 50%. ECOSAR has the highest predictive power, with accuracy of 54% and all of the 37 chemicals predicted. The perfor-mance of ECOSAR to fish is similar as well as to daphnia. The total accuracies followed are Danish Q.D., T.E.S.T. and VEGA, with the accuracy of 50, 49 and 47%, respectively. Read Across and Trend Analysis have the lowest total accuracies, which are same as the situation of prediction to daphnia. The total accuracy of KATE is only 36%, the perfor-mance to predict the toxicity of fish is far less than prediction to daphnia.
In quantitative assessment of comparison log10 LC50 of experiment value with predicted value, VEGA and T.E.S.T. shows excellent predicted ability as they can achieve the accu-racy of 80% when the absolute deviation between predicted and experimental value is limited to 10 times. The performance is followed by KATE and ECOSAR when deviation is limited to 10 times, with the accuracy of 71 and 68%, respectively. The coefficient of variance also reflect the same tendency with accuracy.
Prediction to 86 NCs In qualitative assessment based on classification into the four toxicity classes of the entire 86 NCs, total accuracies decreased comparing with predic-tion to PCCs. As T.E.S.T., Danish Q.D and KATE could not predict 25, 45 and 49 NCs, respectively, the predictive power of these three tools are lowest. Both total accuracy and predictive power of VEGA are about 20%, which are decrease dramatically compare with prediction to PCCs. ECOSAR has the highest total accuracy and Predictive power com-pare with others tools, however, it is still not high with accuracy of about 40%.
Model performance within the AD
Model performance within AD to fish toxicity is shown in Table 8.
Prediction to 37 PCCs The number PCCs inside the AD of VEGA, Read Across and Trend Analysis is most, with 29, 31 and 30 tested chemicals, respectively. T.E.S.T. and KATE have the minimal number of chemical inside the AD.

Page 18 of 31Zhou et al. BMC Bioinformatics (2021) 22:151
Tabl
e 6
Expe
rimen
tal a
nd p
redi
cted
toxi
city
resu
lts to
fish
for t
he 3
7 PC
Cs
CA
S N
o.C
hem
ical
nam
eEx
p.EC
OSA
RT.
E.S.
T.D
anis
h Q
.D.
VEG
ARe
ad A
cros
sTr
end
Ana
lysi
sKA
TE
LC50
LC50
AD
LC50
AD
LC50
AD
LC50
AD
LC50
AD
LC50
AD
LC50
AD
120–
82-1
1,2,
4-Tr
ichl
orob
enze
ne0.
72.
77In
1.84
In1.
45In
2.67
In15
.3In
244
In2.
4In
81–1
5-2
Mus
k xy
lene
0.2
6.12
In0.
07In
1.03
In10
.1In
1.5
In32
InN
A
75–0
9-2
Dic
hlor
omet
hane
330
273
In31
7In
NA
251
In27
70In
329
85In
50–0
0-0
Form
alde
hyde
23.9
11.2
InN
AN
A12
2In
26In
141
InN
A
77–4
7-4
Hex
achl
oroc
yclo
pent
adie
ne0.
007
0.21
7In
0.33
In0.
25O
ut0.
0227
In0.
164
Out
NA
NA
25,6
37–9
9-4
Hex
abro
moc
yclo
dode
cane
0.00
250.
0037
Out
0.04
5In
0.00
13O
ut0.
0135
Out
575
Out
411
In0.
0039
Out
91–2
0-3
Nap
htha
lene
0.96
9.39
In7.
27In
5.07
In3.
74In
48In
901
In6.
8In
1763
-23-
1H
epta
deca
fluor
ooct
anes
ulfo
nic
acid
6823
.7In
0.57
In17
7,03
2In
1.79
Out
47.1
In23
7In
2.6
In
307–
35-7
Perfl
uoro
-1-o
ctan
esul
fony
l fluo
ride
4.7
0.04
5O
ut0.
24In
177,
032
In0.
5612
Out
NA
NA
NA
2795
-39-
3Po
tass
ium
per
ufluo
rooc
tane
sul
fona
te9.
523
.7In
NA
177,
032
InN
A11
1In
299
InN
A
25,1
54–5
2-3
Non
ylph
enol
0.12
80.
068
In0.
63In
0.11
Out
0.57
02In
20.4
In51
.3In
0.11
In
9016
-45-
9N
onyl
phen
oxyp
oly(
ethy
lene
oxy)
etha
nol
50.
274
Out
0.72
In0.
417
In0.
592
Out
22.4
In4.
1In
0.35
Out
67–6
6-3
Chl
orof
orm
121
2464
In72
.24
InN
A10
0.1
In67
2In
319
In53
In
79–0
1-6
Tric
hlor
oeth
ylen
e44
.52
9.48
In30
.49
In9.
95O
ut31
.25
In18
.3In
20.3
In20
In
1163
-19-
5D
ecab
rom
odip
heny
l oxi
de0.
183
6.6E
-7O
ut6.
4E-4
In0.
0004
Out
0.79
98O
ut0.
689
Out
NA
2.0E
-6O
ut
127–
18-4
Tetr
achl
oroe
thyl
ene
8.4
4.27
In15
.65
In2.
86O
ut11
.3In
18.3
In20
.3In
11In
75–0
7-0
Ace
tald
ehyd
e30
.829
In36
.99
In13
4O
ut12
6.79
In41
.1In
169
InN
A
732–
26-3
2,4,
6-tr
i-ter
t-bu
tylp
heno
l0.
048
0.03
4In
0.21
In0.
053
Out
0.84
43In
40.9
In23
3In
NA
68,9
37–4
1-7
Isop
ropy
lphe
nyl p
hosp
hate
10.8
0.00
45O
ut0.
0184
In0.
0017
Out
3.75
no84
.2In
89.8
In0.
0011
Out
120–
12-7
Ant
hrac
ene
2.78
1.15
In0.
6In
1.2
In1.
42In
4480
In68
80In
1.6
In
106–
46-7
1,4-
Dic
hlor
oben
zene
1.24
8.52
In4.
19In
5.51
In5.
41In
23.3
In24
8In
5.8
In
608–
93-5
Pent
achl
orob
enze
ne0.
310.
266
Out
0.41
In0.
12In
0.31
6In
22In
76.7
In0.
38In
118–
74-1
Hex
achl
orob
enze
ne0.
119
0.00
68O
ut0.
14In
0.02
7In
0.54
34In
41.8
In11
0In
0.2
In
71–4
3-2
Benz
ene
5.3
65.1
In39
.35
In26
.7O
ut30
.39
In77
.2In
270
In40
In

Page 19 of 31Zhou et al. BMC Bioinformatics (2021) 22:151
Tabl
e 6
(con
tinue
d)
CA
S N
o.C
hem
ical
nam
eEx
p.EC
OSA
RT.
E.S.
T.D
anis
h Q
.D.
VEG
ARe
ad A
cros
sTr
end
Ana
lysi
sKA
TE
LC50
LC50
AD
LC50
AD
LC50
AD
LC50
AD
LC50
AD
LC50
AD
LC50
AD
108–
88-3
Tolu
ene
5.5
24.8
In35
.5In
19.8
In8.
37In
104
In15
2In
20In
115–
96-8
Tris
(2-c
hlor
oeth
yl) p
hosp
hate
6662
.5In
14.5
In5.
57O
ut2.
38O
ut64
.3In
124
InN
A
117–
81-7
Bis(
2-et
hylh
exyl
) pht
hala
te0.
160.
0097
Out
0.33
In0.
0027
Out
54.0
9In
204
In17
3In
0.01
1O
ut
84–7
4-2
Dib
utyl
pht
hala
te0.
481.
11In
1.11
In0.
339
In1.
13In
0.40
8In
60.9
In1.
3In
85–6
8-7
Benz
yl b
utyl
pht
hala
te0.
510.
911
In0.
47In
0.12
3In
0.59
76In
110
In11
6In
1.1
Out
84–6
9-5
Diis
obut
yl p
htha
late
0.9
1.36
In4.
16In
0.56
8In
1.12
In3.
81In
−28
.9In
1.6
In
78–8
7-5
1,2-
Dic
hlor
opro
pane
133
55.4
In61
.8In
42.3
Out
45.1
8In
71.3
In28
4In
60In
75–3
5-4
1,1-
Dic
hlor
oeth
ylen
e10
7.9
14.8
In64
.1In
49.1
Out
36.5
9In
90.2
In10
1In
67In
121–
14-2
2,4-
Din
itrot
olue
ne31
4.2
In5.
59In
15.1
In11
.07
In11
In50
.9In
0.38
In
95–5
3-4
o-To
luid
ine
81.3
75.2
In64
.7In
42.7
In47
.81
In25
.6In
144
In82
In
335–
67-1
Pent
adec
afluo
rooc
tano
ic a
cid
157
10.1
In3.
62In
133,
766
In10
.1O
ut10
70O
ut10
40O
ut1.
2In
87–6
8-3
Hex
achl
orob
uta-
1,3-
dien
e0.
0949
0.17
1In
0.56
In2.
6O
ut0.
0252
InN
AN
AN
A
87–8
6-5
Pent
achl
orop
heno
l0.
250.
477
In0.
37In
0.17
4In
0.33
62In
20.3
In10
.8In
0.73
In

Page 20 of 31Zhou et al. BMC Bioinformatics (2021) 22:151
In qualitative assessment based on classification into the four toxicity categories, ECO-SAR, Danish Q.D. and VEGA have the highest performance, with R2
AD of 0.66, 0.58 and 0.57 and accuracies of 55, 58 and 55%, respectively. The performance of tested tools for fish can be ranked in the following order, from the highest to the lowest performers: ECOSAR = Danish Q.D. = VEGA> T.E.S.T. > KATE > Read Across > Trend Analysis. The prediction Accuracies inside the AD is not significant improved in comparison to entire accuracy not considering the AD. This phenomenon is similar in prediction of daphnia.
Table 7 Tool performance and comparison summary statistics to 96 h-LC50 of fish based on entire dataset
a Total accuracy is the fraction of chemicals assessed by each tool for which the predictedLC50 falls within the same regulatory category as the measured LC50. b Similar to total accuracy, predictive power measures the total number of correct category assignments. However, lack of prediction was treated as an incorrect assignment
Chemicals Methods Measures of predictive accuracy
ECOSAR T.E.S.T Danish Q.D.
VEGA Read Across
Trend Analysis
KATE
37 PCCs Number of missing predic-tions
0 2 3 1 2 4 9
Qualita-tive
Number of correct
20 17 17 17 14 10 10
Number of incorrect
17 18 17 19 21 23 18
Total accuracy (%)a
54 49 50 47 40 30 36
Predictive power (%)b
54 46 46 46 38 27 27
R2 (toxicity class)
0.50 0.39 0.38 0.43 0.17 0.10 0.25
Quantita-tive
Accuracy within a factor of 10 (%)
68 80 65 81 57 36 71
Accuracy within a factor of 100 (%)
89 89 79 94 83 48 86
Accuracy within a fac-tor of 1000 (%)
92 97 85 97 94 76 89
R2(log10 LC50) 0.31 0.35 0.27 0.34 0.32 0.03 0.21
86 NCs Qualita-tive
Number of correct
34 25 17 18 / / 17
Number of incorrect
47 36 24 65 / / 40
Number of missing predictions
5 25 45 3 / / 29
Total accuracy (%)a
42 41 41 22 / / 30
Predictive power (%)b
40 29 20 21 / / 20
R2 (toxicity class)
0.08 0.10 0.13 0.001 / / 0.03

Page 21 of 31Zhou et al. BMC Bioinformatics (2021) 22:151
In quantitative assessment, there are four models: VEGA, KATE, ECOSAR and T.E.S.T., with which the prediction accuracies are greater than 80% when the absolute error is limited to 10 times. VEGA reaches highest accuracy of 90%, with accuracy increased significantly after considering the AD. RMSE is a measure of accuracy, the lower of the RMSE, the higher of the predication accuracy. ECOSAR has the best RMSE (0.71 log10
Table 8 Tool performance to 96 h-LC50 of fish for chemicals within each applicability domains
Chemicals Methods Measures of predictive accuracy
ECOSAR T.E.S.T. Danish Q. D.
VEGA Read Across
Trend Analysis
KATE
37 PCCs General Number of inside AD
29 22 19 29 31 30 22
Number of outside AD and missing prediction
8 15 18 8 6 6 15
Qualita-tive
Number of correct
16 9 11 16 11 8 8
Number of incorrect
13 13 8 13 20 23 14
Accuracy inside AD (%)
55 41 58 55 35 26 36
R2AD (toxicity class)
0.66 0.41 0.58 0.57 0.07 0.06 0.35
Quantita-tive
Accuracy within a factor of 10 (%)
83 82 74 90 55 42 86
Accuracy within a factor of 100 (%)
100 95 79 97 81 55 95
Accuracy within a fac-tor of 1000 (%)
100 100 84 100 94 84 100
RMSE (log10 LC50)
0.71 0.87 1.83 0.75 1.47 2.09 0.80
R2AD (log10 LC50)
0.68 0.52 0.57 0.68 0.14 0.00 0.50
86 NCs Qualita-tive
Number of inside AD
58 61 22 50 / / 21
Number of outside AD and missing prediction
28 25 64 36 / / 67
Number of correct
32 25 13 18 / / 7
Number of incorrect
26 36 9 32 / / 12
Accuracy inside AD (%)
55 41 59 36 / / 37
R2AD (toxicity class)
0.37 0.10 0.42 0.03 / / 0.37

Page 22 of 31Zhou et al. BMC Bioinformatics (2021) 22:151
units) and Trend Analysis has the worst (2.09 log units). All RMSEs of ECOSAR, T.E.S.T., VEGA and KATE are below 1 log10 scale, which are at same performance levels.
In general, based on the predictive power of quantitative assessment, the tested tools for fish can be ranked in the following order, from the highest to the lowest performers: VEGA > ECOSAR = KATE = T.E.S.T. > Danish Q.D > Read Across >Trend Analysis.
Prediction to 86 NCs Accuracies inside AD of ECOSAR, T.E.S.T., Danish Q. D. and KAT are as same as prediction to PCCs. Whereas, Accuracy inside AD of VEGA to decreased from 55% for PCCs to 36% for NCs. The lower accuracy of VEGA’s predic-tion of NCs, probably because most of the measured results of SCs were non-toxic (LC50 > 100 mg/L), but when VEGA predicted, the lowest value of the 7 model included in VEGA was used and finally the probability of being predicted to be toxic category increased.
Figure 4 shows the distribution of the 96 h-LC50 fish toxicity predictions with respect to under- and overestimation. Positive errors indicate predicted LC50 is above experimental LC50 and toxicity is underestimated. Considering the error of prediction between the log10 LC50 of the experimental value and the log10 LC50 of the estimated toxicity value provided by the model, over- and underestimation of fish toxicities by Danish Q.D. are more or less similarly distributed. Fish toxicity predicted by ECOSAR, T.E.S.T, VEGA and KATE appear to be more often overestimated than underestimated, which meet the principal of reasonable worst-case.
DiscussionMethods to assess AD
All models provide AD assessments that predictions fall inside or outside the AD of the models. Most of these models (ECOSAR, KATE, Read Across and Trent Analysis) assess the AD directly with the range of log10 Kow. In addition to log10 Kow, these models also
Fig. 4 Errors distribution (predicted – experimental) of fish toxicity categories. Positive errors indicate predicted LC50 is above experimental LC50 and toxicity was underestimated. Datasets of Read Across and Trend Analysis were based on PCCs, others were based on both PCCs and NCs. Mean is average error, SD is Standard Deviation, and N is number of chemicals.

Page 23 of 31Zhou et al. BMC Bioinformatics (2021) 22:151
consider the structural similarity. The ECOSAR package provides warnings when the model prediction is above the substance solubility limit or if the substance log10 Kow is outside the AD, it is helpful when non-professional application.
T.E.S.T. does not provide the AD of results directly. However, T.E.S.T has AD for each method and a final AD where predicitons must be made by at least 2 methods for a con-sensus value to be used .
Although there is no criterion to judge the validity or invalidity of the predicted data, predicted results within the AD are preferred. Although, the prediction accuracy inside the AD is not obviously improved compare to total accuracy not considering the AD in qualitative assessment, it improved significant in quantitative assessment.
There is no single and absolute AD assessment methods for a given model. Gener-ally, the broader the definition of the AD, the lower the accuracies. This principle can be confirmed in the prediction of daphnia, in which the number of PCCs outside the AD and missing prediction are most by VEGA, however, the performance is best. In the quantitative evaluation within AD with the 10-fold factor, the accuracy of VEGA is the highest among all of the models, both to daphnia and to fish toxicity, with accuracy of 100 and 90%, respectively. The reason for the highest accuracy of VEGA prediction may be attributed to the detailed definition of the AD.
VEGA assess the AD with overall reliability, which is a relative complex mechanism. An overall reliability of the prediction is measured in a quantitative manner, whose value ranges from 1 to 0, by considering five factors, including Global AD Index, simi-lar index of molecules with known experimental value, accuracy index of prediction for similar molecules, concordance index for similar molecules, index of Atom Cen-tered Fragments similarity check. All those considerations are weighted and summed up into reliability of a model.
Difference between classification and quantitative assessment
The qualitative method has a certain randomness for the substances at the classifica-tion boundary point. Substances at the toxicity boundary point will be divided into two distinct toxicities class easily. Therefore, qualitative method with toxicity clas-sification method to assess accuracy will be inferior to quantitative methods in terms of scientific significance. The current aquatic acute classification method is based on the 10-fold factor in toxicity values. The quantitative method with a 10-fold factor is similar to the toxicity classification method, but it overcomes the uncertainty of the boundary points and is more meaningful for accuracy evaluation. It can also be proven from the results that the accuracy of the quantitative method is higher than that qualitative method. Therefore, the results of quantitative method is a good indi-cator to assess the performance of tested tools.
Integrated assessment strategy when predicting the fish acute toxicity using VEGA
In the quantitative evaluation to prediction both daphnia and fish toxicity inside the AD, VEGA performs very well with the highest accuracy. However, there are seven models can be used to predict the fish acute toxicity in VEGA. Some confuse existing

Page 24 of 31Zhou et al. BMC Bioinformatics (2021) 22:151
even if internal reliability is given. For example, several models may give the same liability with different AD index. And SarPy/IRFMN model is a classification model, it will give a toxicity class instead of toxicity value. Therefore, it is crucial to choose the most rational value of different models, and to use the toxicity class provided by SarPy/IRFMN model in quantitative effect assessment.
In order to make full advantage of VEGA, we proposed an integrated assessment strategy for fish acute toxicity, as shown in Fig. 1. This integrated assessment strategy were used in this study except that experimental values were not used, and it is prove to be useful.
Step 1: if experimental value exist, it should be used, else go to step 2.Step 2: if reliability shows 3 stars with all ADI =1, it should be used, else go to step 3 at the following case:
-If more than 1 models have 3 stars, or.-If models have only 2 stars or 1 star.
Step 3: if it has a highest global ADI, it should be priority used, else go to step 4.Step 4: if the other ADI outperforms the others models, it should be priority used.
Notes: (1) A lowest toxicity value should be used when all ADIs are same; (2) Toxicity class given by SarPy/IRFMN model is transformed to lower limit, if needed. e.g. trans-formed the toxic-3 (between 10 and 100 mg·L− 1) to 10.1 mg·L− 1.
QSAR vs Chemical category approach
ECOSAR, KATE, T.E.S.T. Danish Q.D and some of models in VEGA belong to QSAR methods. Both Read Across and Trent Analysis method are category approach. QSAR models and category approach method have similarities and differences.
In QSAR Toolbox, application strategy of Read across, Trend analysis and QSAR mod-els is addressed. Read across is recommended for “qualitative” (e.g. skin sensitisation or mutagenicity) or “quantitative endpoints” (e.g., 96 h-LC50 for fish) if only a low number of analogues with experimental results are identified. Trend analysis is the appropriate data-gap filling method for “quantitative endpoints” (e.g., 96 h-LC50 for fish) if a high number of analogues with experimental results are identified. QSAR models can be used to fill a data gap if no adequate analogues are found for a target chemical.
The issue of chemical-to-chemical similarity is not directly present in the case of QSAR models. In the case of QSAR models, the target chemical is in some way com-pared with the whole population of chemicals as the basis of the model, and this is addressed within the AD of the model. Thus, the comparison is done not between one chemical and another, or a few others, as in the category approach, but with the whole set of compounds used for the model.
The overall structure of the SAR models model is like a collection of read across mod-els, with similarity structure or fragment are collect and statistic. Identification of simi-larity structure in QSAR models is completed automatically. The evaluation of similar
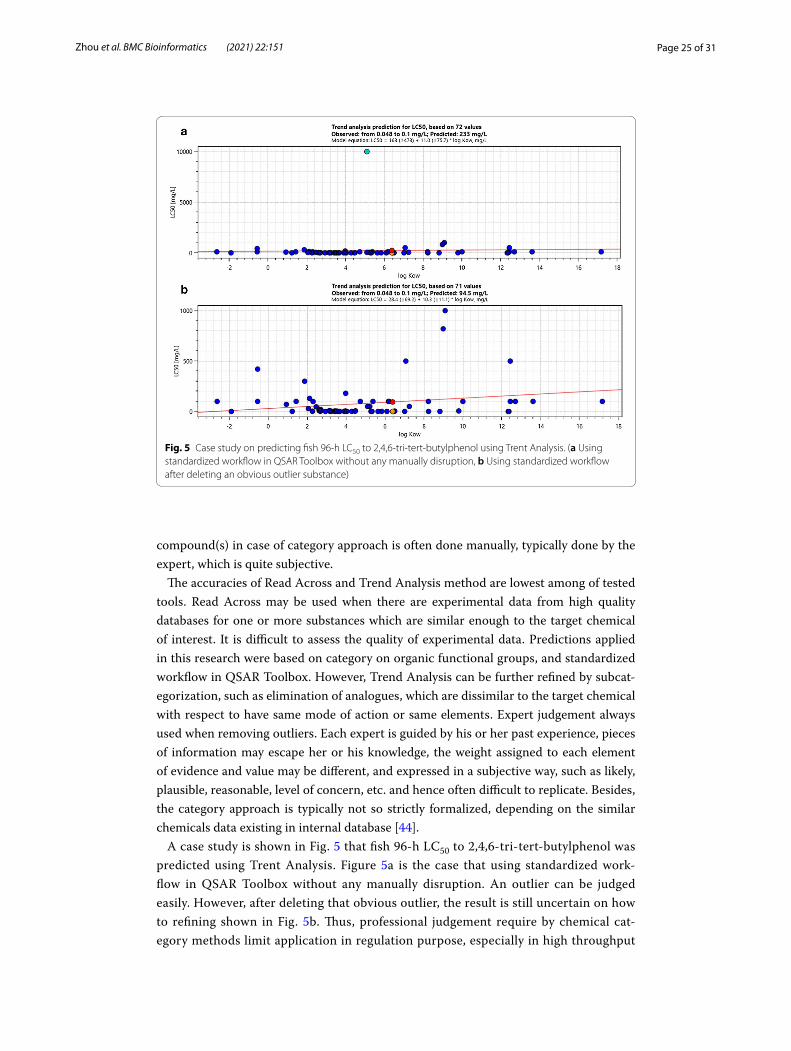
Page 25 of 31Zhou et al. BMC Bioinformatics (2021) 22:151
compound(s) in case of category approach is often done manually, typically done by the expert, which is quite subjective.
The accuracies of Read Across and Trend Analysis method are lowest among of tested tools. Read Across may be used when there are experimental data from high quality databases for one or more substances which are similar enough to the target chemical of interest. It is difficult to assess the quality of experimental data. Predictions applied in this research were based on category on organic functional groups, and standardized workflow in QSAR Toolbox. However, Trend Analysis can be further refined by subcat-egorization, such as elimination of analogues, which are dissimilar to the target chemical with respect to have same mode of action or same elements. Expert judgement always used when removing outliers. Each expert is guided by his or her past experience, pieces of information may escape her or his knowledge, the weight assigned to each element of evidence and value may be different, and expressed in a subjective way, such as likely, plausible, reasonable, level of concern, etc. and hence often difficult to replicate. Besides, the category approach is typically not so strictly formalized, depending on the similar chemicals data existing in internal database [44].
A case study is shown in Fig. 5 that fish 96-h LC50 to 2,4,6-tri-tert-butylphenol was predicted using Trent Analysis. Figure 5a is the case that using standardized work-flow in QSAR Toolbox without any manually disruption. An outlier can be judged easily. However, after deleting that obvious outlier, the result is still uncertain on how to refining shown in Fig. 5b. Thus, professional judgement require by chemical cat-egory methods limit application in regulation purpose, especially in high throughput
Fig. 5 Case study on predicting fish 96-h LC50 to 2,4,6-tri-tert-butylphenol using Trent Analysis. (a Using standardized workflow in QSAR Toolbox without any manually disruption, b Using standardized workflow after deleting an obvious outlier substance)

Page 26 of 31Zhou et al. BMC Bioinformatics (2021) 22:151
screening in risk assessment. QSAR Toolbox also allows some different category methods, such as acute aquatic toxicity classification by ECOSAR, acute aquatic tox-icity Mode of Action by OASIS, acute aquatic toxicity classification by Verhaar (Mod-ified). Thus, performance of these category methods need further assessment, and they shall be used limiting in experts. At the same time, more intelligence technolo-gies, such as artificial intelligence shall apply in category approach.
PCCs that were incorrect predicted frequently
There are two PCCs, which daphnia toxicity were predicted incorrectly by more than 2 models (Table 9). The water solubility of anthracene is 0.047 mg·L− 1, which is lower than experimental LC50 value of 0.0356 mg·L− 1, indicating that experimental LC50 value may be tested incorrectly. There was only one experimental data of anthracene, so the acute toxicity to daphnia needs further testing.
The experimental LC50 value to daphnia used to validate of dibutyl phthalate is 0.5 mg·L− 1, which was evaluated and accepted by ECHA. However, values are range from 1.4 to 3.7 mg·L− 1 gathered from database of these models. Predicted LC50 value of dibutyl phthalate from T.E.S.T, Danish Q.D, Read Across and Trend Analysis is 6.61, 17.5, 6.68 and 73.6 mg·L− 1, respectively. Therefore, it is the experiment value difference causing the “incorrectly prediction” to dibutyl phthalate by T.E.S.T, Danish Q.D and Read Across. Trend Analysis will still give a value that exceed to 10 times dif-ference to experimental value, which performances not well.
For the acute toxicity of fish, according to the evaluation criterion that the difference between the experimental value and the predicted value is 10 times, there are 6 sub-stances that more than 3 models predicted incorrectly, shown in Table 10.
Table 9 The PCCs that daphnia toxicity were predicted incorrectly by more than 2 models
Substance Water solubility/mg·L−1
ExperimentalLC50/mg·L− 1
No. of models incorrect predicted
Used to validation Range in models and mean
Anthracene 0.047 0.0356 0.0356 4
Dibutyl phthalate 11.2 0.5 1.4 ~ 3.7, 3.52 4
Table 10 The PCCs that fish toxicity were predicted incorrectly by more than 2 models
Substance Water solubility /mg·L−1
Experimental LC50/mg·L− 1 No. of models incorrect predictedUsed to
validationRange in models and mean
Musk xylene 0.15 0.2 2.9 ~ 47 (9.87) 3
Heptadecafluorooctanesul-fonic acid
0.10 68 68 3
2,4,6-tri-tert-butylphenol 0.063 0.048 0.06 ~ 0.1 (0.07) 3
Benzene 1880 5.3 5.3 ~ 452 (83) 3
Bis(2-ethylhexyl) phthalate 0.27 0.16 0.16 ~ 1106 (573) 3
Pentadecafluorooctanoic acid 0.48 157 24.6 ~ 607 (316) 4

Page 27 of 31Zhou et al. BMC Bioinformatics (2021) 22:151
Among them, five substance have low water solubility of below 1 mg·L− 1. In principle, the experimental LC50 value of a substance should be lower than its water solubility. The water solubility of musk xylene, 2,4,6-tri-tert-butylphenol and bis(2-ethylhexyl) phtha-late, show no significant difference to experimental LC50 value. Water solubility of hep-tadecafluorooctanesulfonic acid and pentadecafluorooctanoic acid is much lower than experimental LC50 value, indicating an incorrect experimental data. In fact, substance with low water solubility is classed as “difficult to test”, the aquatic toxicity of these dif-ficult substance were often testing improperly even at GLP condition. Hence, the special caution should be given to this low water solubility substance when developing mod-els. Meanwhile, uncertainly of models when validation and comparison of these PCCs, with low water solubility. As a result, some of the differences between model predictions and measured toxicity values can be partially attributed to the measured toxicity values themselves being less-than-perfect indicators of true toxicity. The errors associated with the measured toxicity values, however, should not affect our conclusions regarding the relative performance of the tested models (their rank orders), particularly in the com-mon PCCs comparison, because all models are being evaluated against the same meas-ured toxicity values.
Danish Q.D. predicted large errors to heptadecafluorooctanesulfonic acid, perfluoro-1-octanesulfonyl fluoride, potassium perufluorooctane sulfonate, pentadecafluoroocta-noic acid, with which all LC50 value are above 100,000 mg·L− 1. There are two models in Danish Q.D: Leadscope and SciQSAR. As a case to predict Heptadecafluorooctanesulfonic acid, Leadscope predict a 0.00636 mg·L− 1, that is much closer to its water solubility of 0.10 mg·L− 1 than SciQSAR with predicted value of 354,065 mg·L− 1. This situation is similar in prediction of Perfluoro-1-octanesulfonyl fluoride, Potassium perufluorooctane sulfonate, Pentadecafluorooctanoic acid. Therefore, the SciQSAR model in Danish Q.D. is note suite for estimate the fish acute toxicity of perfluorinated compounds.
There are 54 experimental 96 h- LC50 fish values of benzene ranging from 5.3 mg·L− 1 to 542 mg·L− 1 collected in QSAR Toolbox, covering 21 fish species within the Actinopterygii class. As many factors affect the experimental results, such as test method, test conditions, species, or even the experience dealing with difficult substance.
It is difficulty to select a fish species to compare the models performance, as the fish spe-cies in tanning data of some model are not deterministic. Hence, this single point compari-son method has some limitation when more than one experiment data exist. Therefore, we suggest that distribution of multiple data other than single value should be consider when developing in silico models.
Analysis to Groups of NCs that were incorrect predicted frequently
The functional groups of NCs with more than three model prediction incorrectly were analyzed. Among them, the functional groups with more than 2 occurrences are shown in Table 11.
Of the 42 NCs in the daphnia toxicology prediction, 14 substances were simultaneously incorrect predicted by more than 3 models. The most frequently predicted functional groups are aryl, aryl halide, and aromatic amine.
Of the 86 NCs in the fish toxicology prediction, 40 substances were simultaneously incor-rect predicted by more than 3 models. The most frequently predicted functional groups are
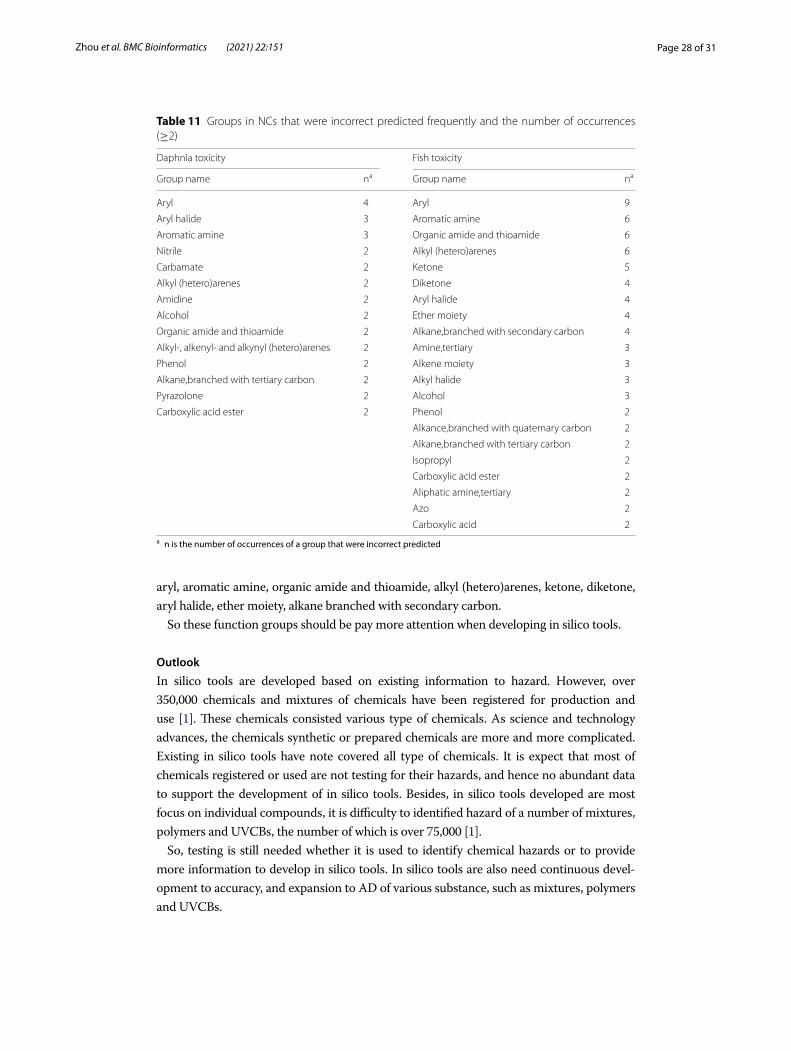
Page 28 of 31Zhou et al. BMC Bioinformatics (2021) 22:151
aryl, aromatic amine, organic amide and thioamide, alkyl (hetero)arenes, ketone, diketone, aryl halide, ether moiety, alkane branched with secondary carbon.
So these function groups should be pay more attention when developing in silico tools.
Outlook
In silico tools are developed based on existing information to hazard. However, over 350,000 chemicals and mixtures of chemicals have been registered for production and use [1]. These chemicals consisted various type of chemicals. As science and technology advances, the chemicals synthetic or prepared chemicals are more and more complicated. Existing in silico tools have note covered all type of chemicals. It is expect that most of chemicals registered or used are not testing for their hazards, and hence no abundant data to support the development of in silico tools. Besides, in silico tools developed are most focus on individual compounds, it is difficulty to identified hazard of a number of mixtures, polymers and UVCBs, the number of which is over 75,000 [1].
So, testing is still needed whether it is used to identify chemical hazards or to provide more information to develop in silico tools. In silico tools are also need continuous devel-opment to accuracy, and expansion to AD of various substance, such as mixtures, polymers and UVCBs.
Table 11 Groups in NCs that were incorrect predicted frequently and the number of occurrences (≥2)
a n is the number of occurrences of a group that were incorrect predicted
Daphnia toxicity Fish toxicity
Group name na Group name na
Aryl 4 Aryl 9
Aryl halide 3 Aromatic amine 6
Aromatic amine 3 Organic amide and thioamide 6
Nitrile 2 Alkyl (hetero)arenes 6
Carbamate 2 Ketone 5
Alkyl (hetero)arenes 2 Diketone 4
Amidine 2 Aryl halide 4
Alcohol 2 Ether moiety 4
Organic amide and thioamide 2 Alkane,branched with secondary carbon 4
Alkyl-, alkenyl- and alkynyl (hetero)arenes 2 Amine,tertiary 3
Phenol 2 Alkene moiety 3
Alkane,branched with tertiary carbon 2 Alkyl halide 3
Pyrazolone 2 Alcohol 3
Carboxylic acid ester 2 Phenol 2
Alkance,branched with quaternary carbon 2
Alkane,branched with tertiary carbon 2
Isopropyl 2
Carboxylic acid ester 2
Aliphatic amine,tertiary 2
Azo 2
Carboxylic acid 2

Page 29 of 31Zhou et al. BMC Bioinformatics (2021) 22:151
ConclusionIn this study, the performance of seven in silico methods (ECOSAR, T.E.S.T., Danish Q. D., VEGA, KATE, Read Across and Trend Analysis) for acute aquatic toxicity to daphnia and fish was evaluated and compared using PCCs and NCs datasets.
In the quantitative evaluation of PCCs with the criteria of 10-fold difference between experimental value and estimated value, the accuracy of VEGA is the highest among all of the models, both in prediction of daphnia and fish acute toxicity, with accuracy of 100 and 90% after considering AD, respectively. The performance of KATE, ECOSAR and T.E.S.T. is at the similar level, with the accuracies are slight lower than VEGA. The accu-racies of Danish Q.D. is lowest among above tools within them QSAR is the main mech-anism. The performance of Read Across and Trent Analysis is lowest among all of the tested in silico tools by standardized workflow of QSAR Toolbox, indicating that chemi-cal category approach shall limited in expert use at this stage. The main factor affects the accuracies of in silico tools may be the distribution of multiple experimental data, and the accuracies of experimental values for PCCs with poorly water solubility.
The performance of models to NCs that are much more complex are not as well as to PCCs, indicating in silico tools are also need continuous development. Testing is still needed whether it is used to identify hazards of NCs or to provide more information to develop in silico tools.
AbbreviationsACF: Atom-Cantered Fragments; AD: Applicability domain; ADI: Applicability Domain Index; ASTER: Assessment Tools for the Evaluation of Risk; Danish Q. D.: Danish QSAR Database; ECHA: European Chemical Agency; ECOSAR: Ecological Struc-ture Activity Relationships; EPISuite: Estimation Programs Interface Suite; GHS: The Globally Harmonized System of Clas-sification and Labelling of Chemicals; GLP: Good Laboratory Practice; KATE: Kashinhou Tool for Ecotoxicity; Kow: Octanol water partition coefficient; LC50: Median lethal concentration; MEP: Ministry of Environment Protection; NCs: New Chemicals; OASIS: Optimized Approach Based on Structural Indices Set; OECD: Organization for Economic Co-operation and Development; PBT/vPvB: Persistence, bioaccumulation, and toxicity/very persistent and very bioaccumulative; PCCs: Priority Controlled Chemicals in China; PLS: Partial least squares; QSAR: (Quantitative) Structure–Activity Relationships; R2: The correlation coefficient; R2
AD: Correlation coefficient of the AD; REACH: Registration, Evaluation, Authorization and Restriction of Chemicals; RMSE: Root mean square error; SIMLES: Simplified Molecular Input Line Entry System; T.E.S.T.: Toxicity Estimation Software Tool; UVCBs: Chemical Substances of Unknown or Variable Composition, Complex Reaction Products and Biological Materials; VEGA: Virtual models for property Evaluation of chemicals within a Global Architecture.
AcknowledgmentsNot applicable.
Authors’ contributionsLJZ compared the data. DLF and GXJ analyzed the data, and was a major contributor in writing the manuscript. WG researched the in silico tools. JJL and MQL revised the manuscript. ZW and WY predicted the chemical using models. YHX and LLS contributed to design of the study. All authors read and approved the final manuscript.
FundingThis work was funded by the National Key Research and Development Program of China (No. 2018YFC1801504), and the Central Scientific Research Projects for Public Welfare Research Institutes (GYZX200102). Funders played no role in the design of the study or collection, analysis, or interpretation of data and in writing the manuscript.
Availability of data and materialsThe datasets used and/or analysed during the current study are available from the corresponding author or from: https:// pan. baidu. com/s/ 19I6o MJDAh MDw2e atJ6E ViA, with Extracted code: t392.
Ethics approval and consent to participatePermission was obtained for datasets used from the owner of Key Lab of Pesticide Environmental Assessment and Pollution Control, MEE. All fish and daphnia experiments by the Key Lab were approved by ethics committee of Nanjing Institute of Environmental Sciences, MEE.
Consent for publicationNot applicable.
Competing interestsThe authors declare that they have no competing interests.

Page 30 of 31Zhou et al. BMC Bioinformatics (2021) 22:151
Received: 20 November 2019 Accepted: 24 November 2020
References 1. Wang Z, Walker GW, Muir DCG, Nagatani-Yoshida K. Toward a global understanding of chemical pollution: a first
comprehensive analysis of national and regional chemical inventories. Environ Sci Technol. 2020;54(5):2575–84. 2. EC: Directive 2010/63/EU of the european parliament and of the council of 22. September 2010 on the protection
of animals used for scientific purposes. In: Official Journal of the European Union. vol. L276; 2010: 33–76. 3. Sanderson H, Solomon K. Contaminants of emerging concern challenge ecotoxicology. Environ Toxicol Chem.
2009;28(7):1359–60. 4. Council NR. A framework to guide selection of chemical alternatives. Washington, DC: The National Academies
Press; 2014. 5. ECHA. The use of alternatives to testing on animals for the REACH regulation, European chemicals agency, third
report under article 117(3) of the REACH regulation. Helsinki: European Chemicals Agency; 2017. 6. Voutchkova AM, Osimitz TG, Anastas PT. Toward a comprehensive molecular design framework for reduced Hazard.
Chem Rev. 2010;110(10):5845–82. 7. Myatt GJ, Ahlberg E, Akahori Y, Allen D, Amberg A, Anger LT, Aptula A, Auerbach S, Beilke L, Bellion P, et al. In silico
toxicology protocols. Regul Toxicol Pharmacol. 2018;96:1–17. 8. OECD. Guidance on grouping of chemicals, second edition, OECD series on testing and assessment, no. 194. Paris:
OECD Publishing; 2017. 9. OECD. Guidance document on the validation of (quantitative) structure-activity relationship [(Q)SAR] models, OECD
series on testing and assessment, no. 69. Paris: OECD Publishing; 2014. 10. Cardoso-Silva J, Papageorgiou LG, Tsoka S. Network-based piecewise linear regression for QSAR modelling. J Com-
put Aided Mol Des. 2019;33:831–44. 11. Toropov AA, Raska I Jr, Toropova AP, Raskova M, Veselinovic AM, Veselinovic JB. The study of the index of ideality of
correlation as a new criterion of predictive potential of QSPR/QSAR-models. Sci Total Environ. 2019;659:1387–94. 12. Lombardo A, Roncaglioni A, Benfenati E, Nendza M, Segner H, Jeram S, Pauné E, Schüürmann G. Optimizing the
aquatic toxicity assessment under REACH through an integrated testing strategy (ITS). Environ Res. 2014;135:156–64. 13. Benfenati E, Diaza RG, Cassano A, Pardoe S, Gini G, Mays C, Knauf R, Benighaus L. The acceptance of in silicomodels
for REACH: requirements, barriers, and perspectives. Chem Central J. 2011;5(1):58. 14. Feher M, Ewing T. Global or local QSAR: is there a way out? QSAR Combinatorial Sci. 2009;28(8):850–5. 15. Gramatica P. Principles of QSAR models validation: internal and external. QSAR Combinatorial Sci.
2007;26(5):694–701. 16. Nendza M, Muller M, Wenzel A. Discriminating toxicant classes by mode of action: 4. Baseline and excess toxicity.
SAR QSAR Environ Res. 2014;25(5):393–405. 17. Cronin MTD, Schultz TW. Pitfalls in QSAR. J Mol Struct THEOCHEM. 2003;622(1):39–51. 18. Sheffield TY, Judson RS. Ensemble QSAR modeling to predict multispecies fish toxicity lethal concentrations and
points of departure. Environ Sci Technol. 2019;53(21):12793–802. 19. Ding F, Wang Z, Yang X, Shi L, Liu J, Chen G. Development of classification models for predicting chronic toxicity of
chemicals to Daphnia magna and Pseudokirchneriella subcapitata. SAR QSAR Environ Res. 2019;30(1):39–50. 20. Fan D, Liu J, Wang L, Yang X, Zhang S, Zhang Y, Shi L. Development of quantitative structure-activity relationship
models for predicting chronic toxicity of substituted benzenes to Daphnia magna. Bull Environ Contam Toxicol. 2016;96(5):664–70.
21. Kluver N, Bittermann K, Escher BI. QSAR for baseline toxicity and classification of specific modes of action of ioniz-able organic chemicals in the zebrafish embryo toxicity test. Aquat Toxicol. 2019;207:110–9.
22. Jia Q, Zhao Y, Yan F, Wang Q. QSAR model for predicting the toxicity of organic compounds to fathead minnow. Environ Sci Pollut Res Int. 2018;25(35):35420–8.
23. Mayo-Bean K, Moran K, Meylan B, Ranslow P. Methodology document for the ECOlogical structure-activity relation-ship model (ECOSAR) class program. Washington DC: US-EPA; 2012.
24. EPA: User’s Guide for T.E.S.T. (version 4.2) (Toxicity Estimation Software Tool): A Program to Estimate Toxicity from Molecular Structure. In. Cincinati, Ohio: U.S. Environme ntal Protection Agency 2016.
25. Furuhama A, Toida T, Nishikawa N, Aoki Y, Yoshioka Y, Shiraishi H. Development of an ecotoxicity QSAR model for the KAshinhou tool for Ecotoxicity (KATE) system, march 2009 version. SAR QSAR Environ Res. 2010;21(5–6):403–13.
26. Benfenati E, Manganaro A, Gini GC: VEGA-QSAR: AI inside a platform for predictive toxicology. In: Proceedings of the workshop popularize artificial intelligence co-located with the 13th conference of the Italian Association for Artificial Intelligence (AIxIA 2013): 2013; Turin, Italy. 21–28.
27. DTU: User Manual for the Danish (Q)SAR Database. In.: National Food Institute, DTU; 2018. 28. OECD. The guidance document for using the OECD (Q)SAR application toolbox to develop chemical categories
according to the OECD guidance on grouping chemicals, OECD series on testing and assessment, no. 102. Paris: OECD Publishing; 2014.
29. Pizzo F, Lombardo A, Manganaro A, Cappelli CI, Petoumenou MI, Albanese F, Roncaglioni A, Brandt M, Benfenati E. Integrated in silico strategy for PBT assessment and prioritization under REACH. Environ Res. 2016;151:478–92.
30. Gramatica P, Papa E, Sangion A. QSAR modeling of cumulative environmental end-points for the prioritization of hazardous chemicals. Environ Sci Process Impacts. 2018;20(1):38–47.
31. Moore DRJ, Breton RL, MacDonald DB. A comparison of model performance for six quantitative structure-activity relationship packages that predict acute toxicity to fish. Environ Toxicol Chem. 2003;22(8):1799–809.
32. Golbamaki A, Cassano A, Lombardo A, Moggio Y, Colafranceschi M, Benfenati E. Comparison of in silico models for prediction of Daphnia magna acute toxicity. SAR QSAR Environ Res. 2014;25(8):673–94.

Page 31 of 31Zhou et al. BMC Bioinformatics (2021) 22:151
• fast, convenient online submission
•
thorough peer review by experienced researchers in your field
• rapid publication on acceptance
• support for research data, including large and complex data types
•
gold Open Access which fosters wider collaboration and increased citations
maximum visibility for your research: over 100M website views per year •
At BMC, research is always in progress.
Learn more biomedcentral.com/submissions
Ready to submit your researchReady to submit your research ? Choose BMC and benefit from: ? Choose BMC and benefit from:
33. Cassotti M, Consonni V, Mauri A, Ballabio D. Validation and extension of a similarity-based approach for prediction of acute aquatic toxicity towards Daphnia magna. SAR QSAR Environ Res. 2014;25(12):1013–36.
34. MEP-China. List of Priority Controlled Chemicals (The First Batch). Beijing: MEE,China; 2017. 35. MEP-China. List of Priority Controlled Chemicals (The Second Batch)(Draft for Comment). Beijing: MEE; 2020. 36. OECD: Test no. 202: Daphnia sp. Acute Immobilisation Test; 2004. 37. Results of eco-toxicity tests of chemicals conducted by Ministry of the Environment in Japan (- March) [http:// www.
env. go. jp/ chemi/ sesaku/ 02e. pdf ]. 38. Russom CL, Bradbury SP, Broderius SJ, Hammermeister DE, Drummond RA. Predicting modes of toxic action
from chemical structure: acute toxicity in the fathead minnow (Pimephales promelas). Environ Toxicol Chem. 1997;16(5):948–67.
39. Gramatica P, Pilutti P: Evaluation of different statistical approaches for the validation of quantitative structure-activity relationships. Ispra, Italy, The European Commission-Joint Research Centre. Institute for Health and Consumer Protection–ECVAM 2004.
40. Jaworska JS, Comber M, Auer C, Leeuwen CJV. Summary of a workshop on regulatory acceptance of (Q)SARs for human health and environmental endpoints. Environ Health Perspect. 2003;111(10):1358–60.
41. UN. Globally harmonized system of classification and Labelling of chemicals (GHS), , eighth revised edition edn. New York and Geneva: United Nations; 2019.
42. Nations U. Globally harmonized system of classification and labelling of chemicals. United Nations: New York and Geneva; 2011.
43. Melnikov F, Kostal J, Voutchkova-Kostal A, Zimmerman JB, Anastas T. P: assessment of predictive models for estimat-ing the acute aquatic toxicity of organic chemicals. Green Chem. 2016;18(16):4432–45.
44. Benfenati E, Roncaglioni A, Petoumenou MI, Cappelli CI, Gini G. Integrating QSAR and read-across for environmental assessment. SAR QSAR Environ Res. 2015;26(7–9):605–18.
Publisher’s NoteSpringer Nature remains neutral with regard to jurisdictional claims in published maps and institutional affiliations.