Greg Kester Biosolids Program Manager [email protected] SCAP Biosolids Committee.

Caro
lloT
em
pla
teW
ate
rWave.p
ptx
Comparison of Options for
Biosolids Dewatering
Water Environment School 2017
Clackamas Community College
3/28/2017; Session 7
Matt Sprick, PE
Carollo Engineers

Caro
lloT
em
pla
teW
ate
rWave.p
ptx
2
Agenda
• Dewatering Overview and Purpose
• Math of Dewatering
• Process Effects on Dewatering
• Key Plant Criteria
• Technology Overview: BFP, Screw, and Centrifuge
– Process
– Operation Parameters
– Critical and Routine Maintenance
• Technology Comparison Summary

Caro
lloT
em
pla
teW
ate
rWave.p
ptx
3
DEWATERING OVERVIEW AND PURPOSE
Why do we dewater biosolids and where does it fit in?
Caro
lloT
em
pla
teW
ate
rWave.p
ptx
4
Biosolids Dewatering Process

Caro
lloT
em
pla
teW
ate
rWave.p
ptx
5
Essential Function of Dewatering
Feed
Overflow
Liquid phase
Solid particles
Caro
lloT
em
pla
teW
ate
rWave.p
ptx
6
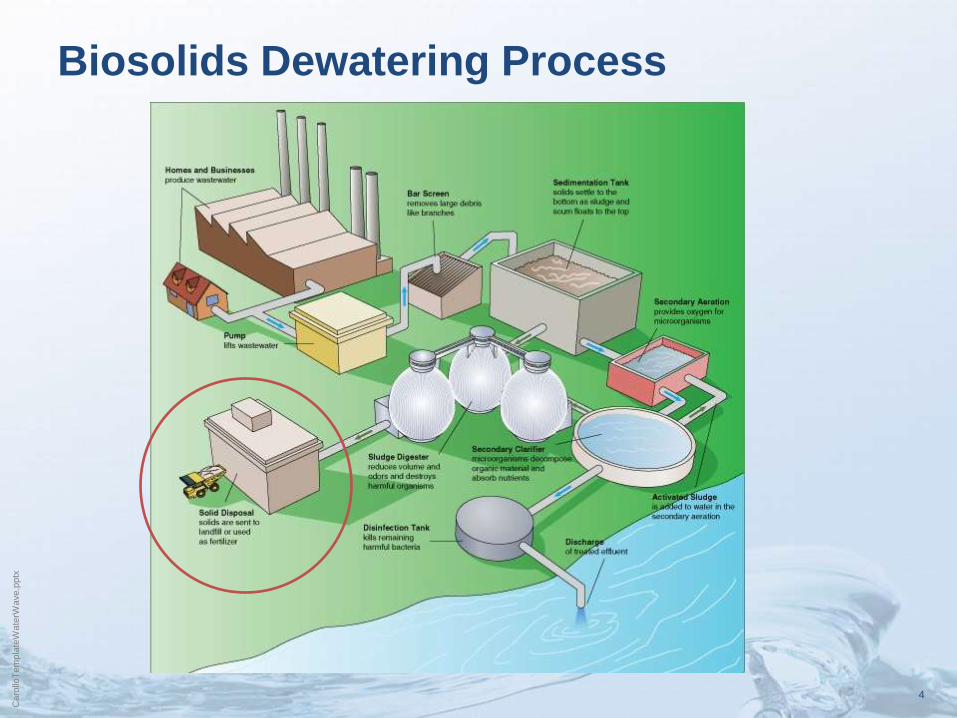
Why Dewater?

Caro
lloT
em
pla
teW
ate
rWave.p
ptx
7
Why Dewater?
• Hauling costs drastically affect choice to dewater and what technology to use:
– How far away is the disposal site?
• Is Landfill an Option? Not in Washington
• Class B Application Sites? Eastern OR/WA
• Class A Reuse? Local options year round? – Composting/Drying
– Is there future legislation that may change the decision you make today?
• Hauling Costs vs Dewatering Costs – It is cheaper to haul less water rather than more.
– It is NOT cheaper to produce a product with less water.

Caro
lloT
em
pla
teW
ate
rWave.p
ptx
8
DEWATERING MATH
Caro
lloT
em
pla
teW
ate
rWave.p
ptx
9
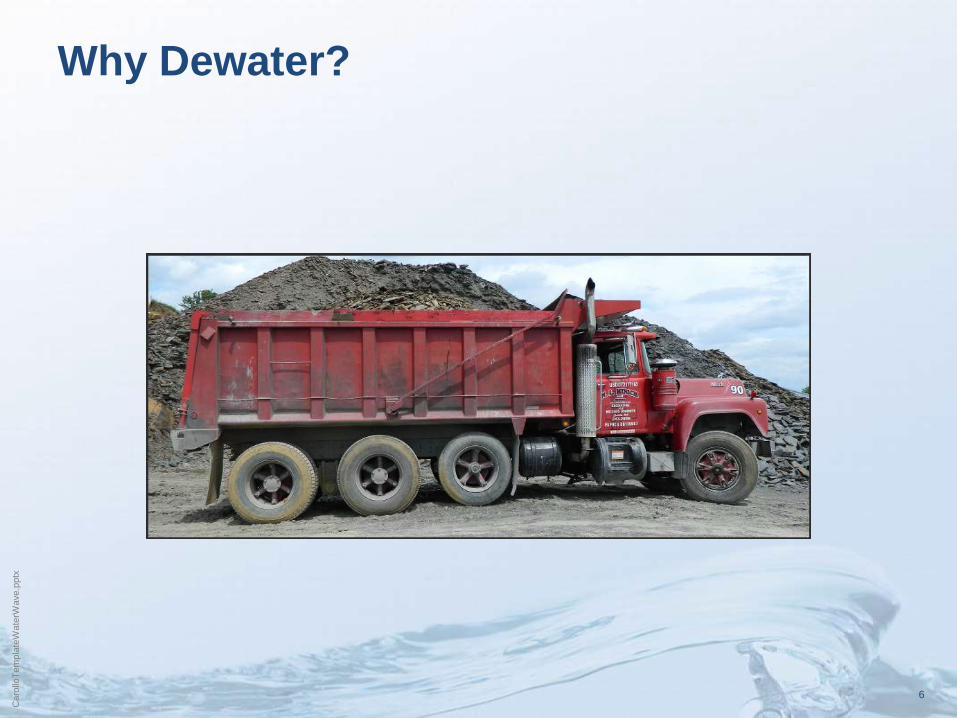
Dewatering Terms
• Hydraulic Loading Rate (gpm):
– Sludge feed flow.
• Solids Loading (lbs/day or hr):
– Solids fed per day or per (operating) hour to unit.
• Operating Hours:
– How long each day the unit is processing solids (doesn’t include start up or shutdown time)
• Cake Dryness (%):
– Total solids percentage in dewatering unit solids discharge.
• Capture Efficiency (%):
– percentage of solids retained in cake
• WAS:PS Ratio (##:##):
– Ratio of WAS to PS on a MASS basis

Caro
lloT
em
pla
teW
ate
rWave.p
ptx
10
Dewatering Math • Total solids:
𝑇𝑆% =𝑆𝑜𝑙𝑖𝑑𝑠 𝑐𝑜𝑛𝑐𝑒𝑛𝑡𝑟𝑎𝑡𝑖𝑜𝑛 (
𝑚𝑔𝐿 )
10,000
• Solids loading rate: 𝐿𝑏𝑠
ℎ𝑟= 𝐹𝑙𝑜𝑤 𝑟𝑎𝑡𝑒
𝑔𝑎𝑙𝑙𝑜𝑛𝑠
𝑚𝑖𝑛𝑢𝑡𝑒× 8.34
𝑙𝑏𝑠
𝑔𝑎𝑙𝑙𝑜𝑛× 𝑇𝑆% × 60
𝑚𝑖𝑛𝑢𝑡𝑒𝑠
ℎ𝑜𝑢𝑟
Ex: 140 gpm @ 4% solids = 140 x 8.34 x 0.04 x 60 = 2,800 lbs/hr
• Operating hours: 𝑆𝑜𝑙𝑖𝑑𝑠 𝐿𝑜𝑎𝑑𝑖𝑛𝑔 𝑅𝑎𝑡𝑒
𝐿𝑏𝑠𝐷𝑎𝑦 × 7
𝐷𝑎𝑦𝑠𝑊𝑒𝑒𝑘
𝑈𝑛𝑖𝑡 𝐶𝑎𝑝𝑎𝑐𝑖𝑡𝑦𝐿𝑏𝑠
𝐻𝑜𝑢𝑟 × 𝑁𝐷𝑎𝑦𝑠𝑊𝑒𝑒𝑘
= 𝑇𝑂𝑝𝑒𝑟𝑎𝑡𝑖𝑜𝑛 𝐻𝑜𝑢𝑟𝑠
𝐻𝑜𝑢𝑟𝑠
𝐷𝑎𝑦
• Capture efficiency: 𝐶𝑐𝑎𝑘𝑒 × 𝐶𝑓𝑒𝑒𝑑 − 𝑟 × 𝐶𝑓𝑖𝑙𝑡𝑟𝑎𝑡𝑒
𝐶𝑓𝑒𝑒𝑑 × (𝐶𝑐𝑎𝑘𝑒 − 𝐶𝑓𝑖𝑙𝑡𝑟𝑎𝑡𝑒)= %
Where r (recycle) = 𝑄𝑓𝑒𝑒𝑑+𝑄𝑤𝑎𝑠ℎ𝑤𝑎𝑡𝑒𝑟
𝑄𝑓𝑒𝑒𝑑= %
Caro
lloT
em
pla
teW
ate
rWave.p
ptx
11
PROCESS EFFECTS ON DEWATERING
What happens upstream that affects dewatering?

Caro
lloT
em
pla
teW
ate
rWave.p
ptx
12
Process Effects on Dewatering
Increase
• Anaerobic digestion
• Chemical additions
– Ferric chloride
– Lime
Decrease
• Aerobic digestion
• Biological Phosphorus Removal
• Fine screening
• FOG*

Caro
lloT
em
pla
teW
ate
rWave.p
ptx
13
KEY PLANT CRITERIA

Caro
lloT
em
pla
teW
ate
rWave.p
ptx
14
Dewatering Unit Specifications
• General plant processes (screening, activated sludge, digestion, etc)
• Ratios
– WAS:PS
– VS:TS
• Hydraulic and Solids Loading Rate
– Average Annual, Maximum Month, and Maximum Week
• Operating Hours
– Fully automated? 24/7? 7/5?
• Desired Cake Dryness

Caro
lloT
em
pla
teW
ate
rWave.p
ptx
15
Dewatering Unit Specifications
• Sludge is very specific to the plant. In general, industry numbers are just averages for the industry.
– Leverage this data and similar facilities to determine realistic performance goals
• Recommend:
– Send in sludge samples to multiple vendors
– Full sized pilot test with multiple vendors
• Using a smaller unit than what will be installed doesn’t help as dewatering doesn’t “scale”.
• Dewatering unit performance difficult to enforce; sludge can always, “change”.

Caro
lloT
em
pla
teW
ate
rWave.p
ptx
16
TECHNOLOGY OVERVIEW: BELT FILTER PRESS

Caro
lloT
em
pla
teW
ate
rWave.p
ptx
17
Operation Animation

Caro
lloT
em
pla
teW
ate
rWave.p
ptx
18
Overall Performance
Parameter Belt Filter Press
Cake Dryness 16 to 22%
Power Consumption up to 10 HP
Operating Speed Relatively low
Polymer Use 8 to 16 lbs/DT
Capture Efficiency 95%+
Solids Loading Rate 500 to 1000 lbs/hr per meter width
Wash Water Use Continuous; 50 to 100% of solids flow
Sludge Sensitivity High
Odor High; Open to atmosphere
Noise Medium
Operator oversite High

Caro
lloT
em
pla
teW
ate
rWave.p
ptx
19
Operation Parameters
Parameter Effect
Hydraulic Loading Rate increase Cake dryness decreases
Solids Loading Rate increase Cake dryness increases
Polymer Feed Rate increase Cake dryness increases(1)
Capture increases(1)
Polymer Type Polymer efficacy
Belt Speed increase Throughput increases
Cake dryness decreases
Belt Tension increase Cake dryness increases
Capture decreases
Belt wear increases
Belt blinding
Notes:
(1) General trend. There is a peak “efficiency” for polymer dosage.

Caro
lloT
em
pla
teW
ate
rWave.p
ptx
20
Maintenance
• Routine:
– Daily:
• General inspection
• Check bearing lubrication (20-30 of them)
• Belt wash down
– Every 4 months (3000 hours):
• Replace belts, change seals, replace doctor (belt cleaning) blade
– Annually:
• Replace wear strips and worn rollers
• Major Considerations
– Walkway around unit should allow access to bearings, removing belts, and rollers
– Crane (or portable hoist) necessary to remove rollers

Caro
lloT
em
pla
teW
ate
rWave.p
ptx
21
TECHNOLOGY OVERVIEW: SCREW PRESS

Caro
lloT
em
pla
teW
ate
rWave.p
ptx
22
Operation Animation

Caro
lloT
em
pla
teW
ate
rWave.p
ptx
23
Overall Performance
Parameter Screw Press
Cake Dryness 16 to 22%
Power Consumption up to 8 HP
Operating Speed Very Low (0.1 to 2 RPM)
Polymer Use 10 to 20 lbs/DT
Capture Efficiency Depends on MFR; 95%+
Solids Loading Rate up to 1200 lbs/hr
Wash Water Use Intermittent; up to 15% of solids flow
Sludge Sensitivity High; especially flow
Odor Low; enclosed
Noise Low
Operator oversite Low

Caro
lloT
em
pla
teW
ate
rWave.p
ptx
24
Operation Parameters
Parameter Effect
Hydraulic Loading Rate increase(2) Cake dryness decreases
Solids Loading Rate increase Cake dryness increases
Polymer Feed Rate increase Cake dryness increases(1)
Capture increases(1)
Polymer Type Polymer efficacy
Screw Rotation Speed increase Throughput increases
Cake dryness decreases
Notes:
(1) General trend. There is a peak “efficiency” for polymer dosage.
(2) Screw presses prefer constant feed (i.e. progessing cavity pumps) at constant
screw rotation rates. Deviation from this significantly affects performance. Unit
can be automated to increase or decrease screw speed as feed rate changes.

Caro
lloT
em
pla
teW
ate
rWave.p
ptx
25
Maintenance • Routine:
– Daily:
• General inspection
– Weekly:
• Unit washdown
– Annually:
• Replace scrapers/brushes, and spray bar brushes
• Inspect spray nozzles
– Every two years:
• Replace spray nozzles, bearings (2), seals
• Service counter pressure device
• Major Considerations
– Walkway around unit should allow access to bearings and cover

Caro
lloT
em
pla
teW
ate
rWave.p
ptx
26
TECHNOLOGY OVERVIEW: CENTRIFUGE

Caro
lloT
em
pla
teW
ate
rWave.p
ptx
27
Operation Animation
Caro
lloT
em
pla
teW
ate
rWave.p
ptx
28
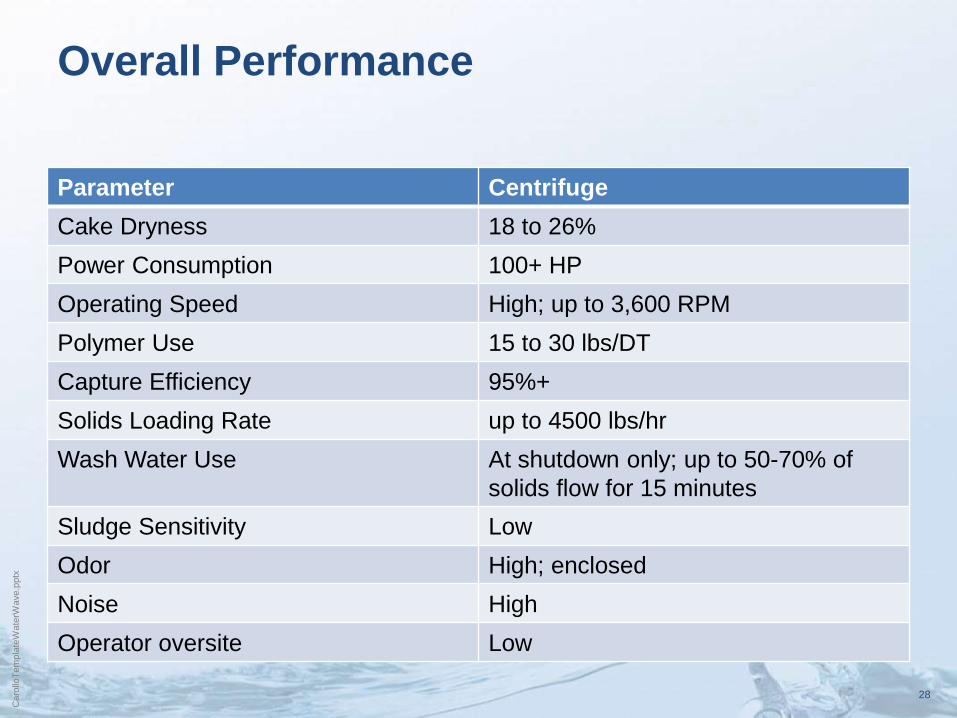
Overall Performance
Parameter Centrifuge
Cake Dryness 18 to 26%
Power Consumption 100+ HP
Operating Speed High; up to 3,600 RPM
Polymer Use 15 to 30 lbs/DT
Capture Efficiency 95%+
Solids Loading Rate up to 4500 lbs/hr
Wash Water Use At shutdown only; up to 50-70% of
solids flow for 15 minutes
Sludge Sensitivity Low
Odor High; enclosed
Noise High
Operator oversite Low
Caro
lloT
em
pla
teW
ate
rWave.p
ptx
29
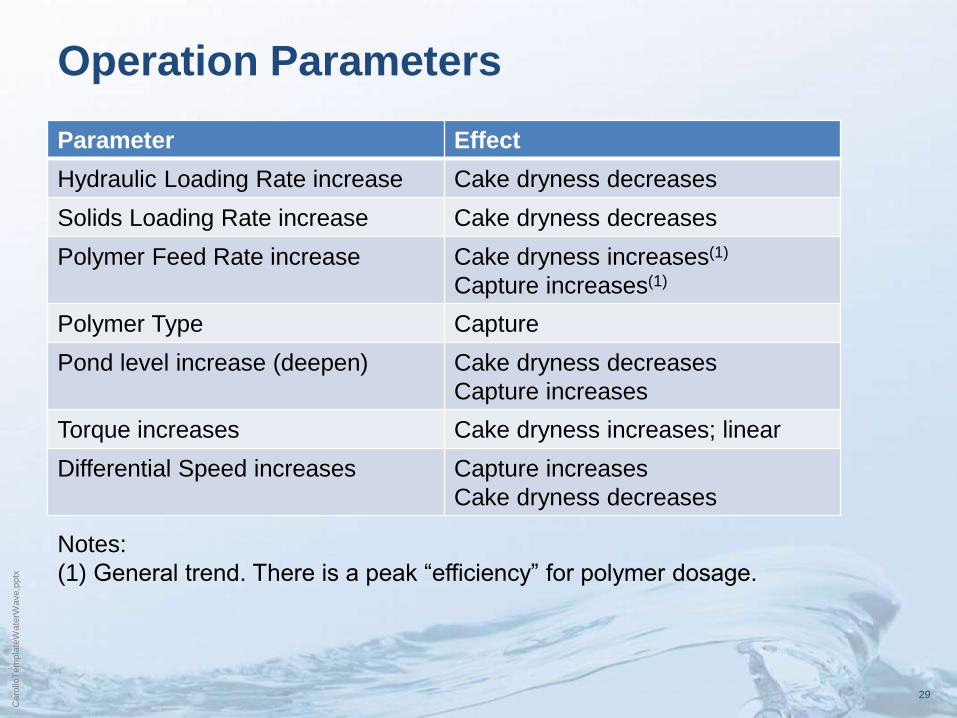
Operation Parameters
Parameter Effect
Hydraulic Loading Rate increase Cake dryness decreases
Solids Loading Rate increase Cake dryness decreases
Polymer Feed Rate increase Cake dryness increases(1)
Capture increases(1)
Polymer Type Capture
Pond level increase (deepen) Cake dryness decreases
Capture increases
Torque increases Cake dryness increases; linear
Differential Speed increases Capture increases
Cake dryness decreases
Notes:
(1) General trend. There is a peak “efficiency” for polymer dosage.

Caro
lloT
em
pla
teW
ate
rWave.p
ptx
30
Maintenance • Routine:
– Daily:
• General inspection
• Check for unusual noise or vibration
– Every 3-4 months:
• Grease bearings; gearbox lubrication change, check belt tension
– Annually:
• Replace bearings: drives, scroll thrust, gear box
• Replace spray nozzles
• Replace belts.
• Major Considerations
– Routine maintenance should NOT be ignored.
– Walkway around unit should allow access to bearings and cover
– Monorail or bridge crane needed to replace bowl assembly

Caro
lloT
em
pla
teW
ate
rWave.p
ptx
31
TECHNOLOGY COMPARSION SUMMARY

Caro
lloT
em
pla
teW
ate
rWave.p
ptx
32
Technology Summary Parameter Belt Filter Press Screw Press Centrifuge
Cake Dryness 16 to 22% 16 to 22% 18 to 26%
Power Consumption up to 10 HP up to 8 HP 100+ HP
Operating Speed Relatively low 0.1 to 2 RPM 3,600 RPM
Polymer Use 8 to 16 lbs/DT 10 to 20 lbs/DT 15 to 30 lbs/DT
Capture Efficiency 95%+ Depends on
MFR
95%+
Solids Loading Rate up to 1000 lbs/hr per
meter width
up to 1200 lbs/hr Up to 4500
lbs/hr
Wash Water Use High Low Lowest
Sludge Sensitivity High High Low
Odor Open Enclosed Enclosed
Noise Medium Low High
Operator oversite High Lowest Low

Caro
lloT
em
pla
teW
ate
rWave.p
ptx
33
Example Sizing Scenario
Screw Presses Belt Filter Presses Centrifuges
Size/Model Huber RoS3 Q800
(largest unit)
2-meter Nominal 30-inch
bowl
Hydraulic Capacity, gpm 55 220 300
Solids Loading Capacity, lb/hr 700* 2000 4500
No. Units for Operation During
Manned Hours (7/5)
8 3 2
No. Units for Continuous
Operation/Unmanned Hours
(24/7)
2 N/A 1
NOTE:
(1) 7/5 Operation assumes an 8-hour manned shift with 1 hour for startup and shutdown.
Dewatering 5 days per week.
(2) 24/7 Operation is essentially continuous operation during manned and unmanned hours.
Actual operating time depends on solids production and may be less than 24 hours/day.
Dewatering 7 days/week.
Caro
lloT
em
pla
teW
ate
rWave.p
ptx
34
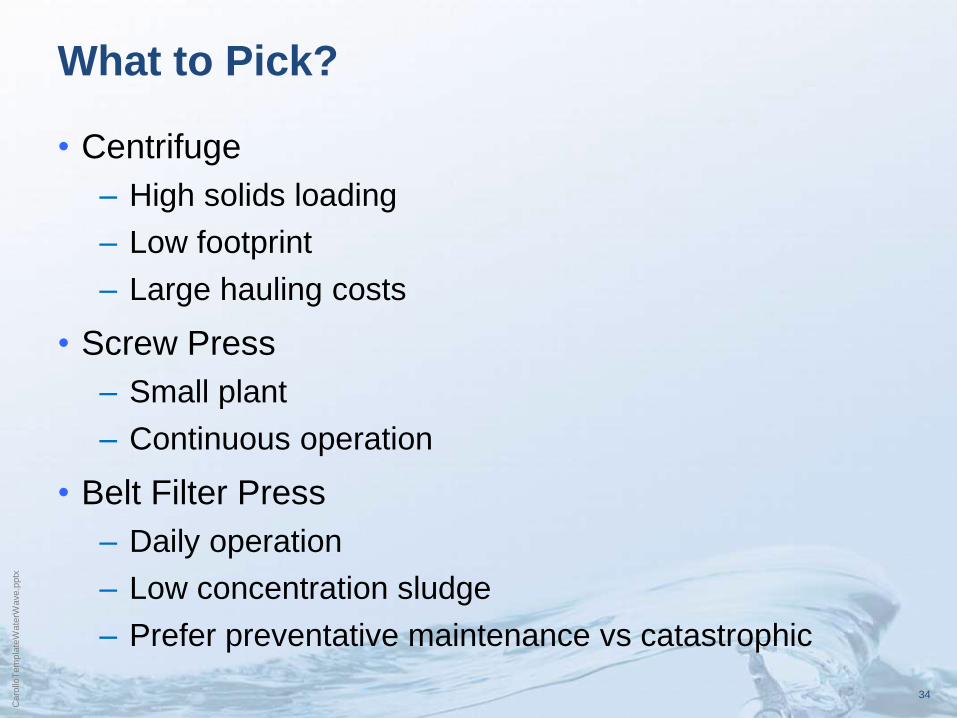
What to Pick?
• Centrifuge
– High solids loading
– Low footprint
– Large hauling costs
• Screw Press
– Small plant
– Continuous operation
• Belt Filter Press
– Daily operation
– Low concentration sludge
– Prefer preventative maintenance vs catastrophic

Caro
lloT
em
pla
teW
ate
rWave.p
ptx
35
WHY OPTIMIZE?

Caro
lloT
em
pla
teW
ate
rWave.p
ptx
36
Example Dewatering Costs Breakdown
Annual Dewatering Cost = $3.7M

Caro
lloT
em
pla
teW
ate
rWave.p
ptx
37
Optimizing Polymer Can Save Money
2 pounds per dry ton =
$30,000 savings per year at
$1.25/lb neat polymer

Caro
lloT
em
pla
teW
ate
rWave.p
ptx
38
Optimizing Cake Can Save More Money
2% increase in cake solids =
$80,000 annual savings at
$46/wet ton

Caro
lloT
em
pla
teW
ate
rWave.p
ptx
39
Optimization Is Continuous

Caro
lloT
em
pla
teW
ate
rWave.p
ptx
40
Questions?
Thank you for being an operator.
Matt Sprick Carollo Engineers, Inc.
720 SW Washington St Suite 550, Portland Oregon 97205
Office: 503-227-1885 Direct: 503-290-2808 Mobile: 503-765-8904