Comparison of Numerical Forced Response Predictions · PDF file ·...
12
139 DOI: 10.24352/UB.OVGU-2017-091 TECHNISCHE MECHANIK, 37, 2-5, (2017), 139-150 submitted: June 30, 2017 Comparison of Numerical Forced Response Predictions with Experimental Results Obtained in a Subsonic Test Turbine Facility A. Marn, F. Schönleitner, M. Mayr, F. Heitmeir In order to achieve the ACARE targets regarding reduction of emissions it is essential to reduce fuel consumption drastically. Reducing engine weight is supporting this target and one option to reduce weight is to reduce the overall engine length (shorter shafts, nacelle). However, to achieve a reduction of engine length the spacing between stator and rotor can be minimised, thus changing rotor blade excitation. Related to the axial spacing, a number of excitation mechanisms in respect to the rotor blading have to be considered already during the design process. Based on these facts several setups have been investigated at different engine relevant operating points and axial spacing between stator and rotor in the subsonic test turbine facility for aerodynamic, acoustic, and aeroelastic investigations (STTF-AAAI) at the Institute for Thermal Turbomachinery and Machine Dynamics at Graz University of Technology. In order to avoid upstream effects of supporting struts, these struts are far downstream of the stage which is under investigation. In this paper the capability to predict forced response vibrations of selected rotor blades is evaluated with experimental results for two different axial gaps between rotor blade and stator vane row. The investigation is done for engine relevant operating conditions. For rotor blade vibration measurements a novel telemetry system in combination with strain gauges is applied. The stage was modelled using the software package ANSYS. Flow fields up and downstream of the turbine stage are analysed and visualised for two axial gaps and compared to the forced response of the blading. Detailed structural dynamic investigations show critical modes during operation which are identified by the telemetry measurements as well. Finally, the influence of the axial spacing regarding the rotor blade excitation and vibration can be elaborated and is prepared to get a better understanding of basic mechanism. The paper shows that reducing axial spacing is a promising option when reducing engine weight. However, prediction of forced response vibrations is still challenging due to the variety of unknown parameters of a real life engine such as coupling stiffness, damping, blade mass, etc. 1 Introduction Anthropogenic climate change has become more and more evident during the last decades. It is well known that it is primarily caused by emissions of mainly carbon dioxide. Therefore, it is essential to reduce the emissions of pollutants at every region where they are formed. That means that engineers have to develop techniques and/or strategies to reduce fuel consumption that is directly linked to the formation of carbon dioxide. In case of air traffic aero engines can be named as the only polluters and here it is highly necessary to set measures when considering that the number of passengers is growing fast. There are mainly two options to decrease fuel consumption of aero engines. Firstly, increase of efficiency which is indeed challenging and secondly decrease of engine weight. The latter one can be "easily" achieved by e.g. reducing axial spacing between blade and vane rows or increasing stage loading by decreasing the number of vane and blade counts. However, as simple these measures seem to be many new problems have to be accounted for. E.g. smaller axial gaps lead to altered blade- vane interaction and therefore, a more reliable forced response prediction is crucial in order to ensure a safe design of aero engines. Aerodynamic excitation and response of the blading is dependent on the damping especially close to and in resonance. However, it is known that in general the available aerodynamic theories are less reliable for evaluating the (out-of-phase with displacement) damping forces than those forces in-phase with displacement (Acum, 1988). Nevertheless, the aero elastic response is essential to the analysis of fatigue of turbomachinery blades. The question of crack initiation, propagation and destructive failure cannot be addressed without giving attention to the type of excitation, damping and the parametric dependencies on the unsteady aerodynamic forces. In resonance (blade eigenfrequency=excitation frequency) damping is responsible for limiting vibration amplitudes, that means damping also limits the cyclic stresses in oscillating blades and thus has a direct (positive) impact on high cycle fatigue.
Transcript of Comparison of Numerical Forced Response Predictions · PDF file ·...

139
DOI: 10.24352/UB.OVGU-2017-091 TECHNISCHE MECHANIK, 37, 2-5, (2017), 139-150 submitted: June 30, 2017
Comparison of Numerical Forced Response Predictions with Experimental Results Obtained in a Subsonic Test Turbine Facility A. Marn, F. Schönleitner, M. Mayr, F. Heitmeir In order to achieve the ACARE targets regarding reduction of emissions it is essential to reduce fuel consumption drastically. Reducing engine weight is supporting this target and one option to reduce weight is to reduce the overall engine length (shorter shafts, nacelle). However, to achieve a reduction of engine length the spacing between stator and rotor can be minimised, thus changing rotor blade excitation. Related to the axial spacing, a number of excitation mechanisms in respect to the rotor blading have to be considered already during the design process. Based on these facts several setups have been investigated at different engine relevant operating points and axial spacing between stator and rotor in the subsonic test turbine facility for aerodynamic, acoustic, and aeroelastic investigations (STTF-AAAI) at the Institute for Thermal Turbomachinery and Machine Dynamics at Graz University of Technology. In order to avoid upstream effects of supporting struts, these struts are far downstream of the stage which is under investigation. In this paper the capability to predict forced response vibrations of selected rotor blades is evaluated with experimental results for two different axial gaps between rotor blade and stator vane row. The investigation is done for engine relevant operating conditions. For rotor blade vibration measurements a novel telemetry system in combination with strain gauges is applied. The stage was modelled using the software package ANSYS. Flow fields up and downstream of the turbine stage are analysed and visualised for two axial gaps and compared to the forced response of the blading. Detailed structural dynamic investigations show critical modes during operation which are identified by the telemetry measurements as well. Finally, the influence of the axial spacing regarding the rotor blade excitation and vibration can be elaborated and is prepared to get a better understanding of basic mechanism. The paper shows that reducing axial spacing is a promising option when reducing engine weight. However, prediction of forced response vibrations is still challenging due to the variety of unknown parameters of a real life engine such as coupling stiffness, damping, blade mass, etc. 1 Introduction Anthropogenic climate change has become more and more evident during the last decades. It is well known that it is primarily caused by emissions of mainly carbon dioxide. Therefore, it is essential to reduce the emissions of pollutants at every region where they are formed. That means that engineers have to develop techniques and/or strategies to reduce fuel consumption that is directly linked to the formation of carbon dioxide. In case of air traffic aero engines can be named as the only polluters and here it is highly necessary to set measures when considering that the number of passengers is growing fast. There are mainly two options to decrease fuel consumption of aero engines. Firstly, increase of efficiency which is indeed challenging and secondly decrease of engine weight. The latter one can be "easily" achieved by e.g. reducing axial spacing between blade and vane rows or increasing stage loading by decreasing the number of vane and blade counts. However, as simple these measures seem to be many new problems have to be accounted for. E.g. smaller axial gaps lead to altered blade-vane interaction and therefore, a more reliable forced response prediction is crucial in order to ensure a safe design of aero engines. Aerodynamic excitation and response of the blading is dependent on the damping especially close to and in resonance. However, it is known that in general the available aerodynamic theories are less reliable for evaluating the (out-of-phase with displacement) damping forces than those forces in-phase with displacement (Acum, 1988). Nevertheless, the aero elastic response is essential to the analysis of fatigue of turbomachinery blades. The question of crack initiation, propagation and destructive failure cannot be addressed without giving attention to the type of excitation, damping and the parametric dependencies on the unsteady aerodynamic forces. In resonance (blade eigenfrequency=excitation frequency) damping is responsible for limiting vibration amplitudes, that means damping also limits the cyclic stresses in oscillating blades and thus has a direct (positive) impact on high cycle fatigue.
140
In turbomachines damping is the sum of structural damping, material damping, and aerodynamic damping, which is a phenomenon that occurs as a consequence of the blade vibration and its interaction with the flow. While structural damping is always positive and limits the vibration amplitude, and material damping is in general negligibly small, aerodynamic damping can become negative and instead of reducing the amplitudes it would induce a self-excited condition where the vibration amplitude increases rapidly and leads to failure of the complete engine. This is referred as flutter. (Mayorca, 2011) stated that a closer attention should be given to the aerodynamic damping (numerical and experimental) predictions. This implies a major challenge since it requires high quality test data that allows a one to one validation only accounting for the aerodynamic damping. However, there is only a minimal amount of published experimental data at engine conditions (Kielb et al., 2001)). Within the last years a lot of literature became available dealing with numerical investigations of flutter or fluid-structure-interaction, respectively. In the following only a few of them are cited. For example (Carstens et al., 2001) who stated that non-linear fluid-structure-interaction may significantly influence the aerodynamic damping and hence shifts the stability boundaries. (Cinnella et al., 2004) presented an accurate and efficient numerical method for turbomachinery flutter and simulated the 11th Aeroelastic Standard Configuration, which is a well known test case. They same authors extended the afore mentioned numerical method to the computation of 3D problems. (Petrie-Repar et al., 2014) presented a flutter analysis of a long steam turbine blade. The logarithmic decrements of the aeroelastic modes were calculated. (Rzadkowski et al., 2006) presented numerical simulations of 3D viscous flutter and compared the results with the available experimental results. The calculations were carried out for bending oscillations of the 11th Aeroelastic Standard Configuration. Recently, fully coupled fluid-structure-interaction and flutter simulations were conducted as reported by (Tateishi, et al., 2014). (Srinivasan, 1997), (Marshall et al., 1996). (Hall et al., 2005) surveyed papers investigating aeroelastic problems. Aerodynamic damping has been studied more carefully by (Chiang et al., 1993) and (Abhari et al., 1997). (Li et al., 2003) conducted a parameter study numerically and showed that the rotor aerodynamic damping could be changed by up to 100% when varying the rotor-stator gap. (Yamaguchi et al., 2000) presented an analytical approach to predict flutter limits of a thin sheet in high speed flow. (Yamaguchi et al., 2000) also presented experimental results and made a comparison between the prediction and the experimental results. Compared to the amount of numerical work there have been only few experiments regarding to axial turbomachinery conducted. (Stepanov et al., 2014) investigated three different counter rotating fan models, aerodynamically and acoustically. However, the authors had the opportunity to measure blade vibrations by means of tip-timing measurements and strain gauges. (Gubran et al., 2014) investigated three different blade faults of a generic rotor and showed the influence of the faults on the spectrum. (Hentschel et al., 2014) presented an experimental setup for specimen specific structural damping determination in a vacuum chamber. Further, different clamping mechanisms, temperature, and static stress are applied and the results are compared to each other. Also (Kubin et al., 2013) measured structural damping for different blade couplings and compared the results to a new type of blading. (Vega et al., 2014) have shown the stabilizing effect of rotor blades in pairs experimentally and numerically. The authors stated that there is a shielding effect of the neighbouring rotor blade. (Heinz et al., 2010) measured mechanical and aerodynamic damping parameters for different mass flow densities (including vacuum). In a next step (Heinz et al., 2011) showed the influence of mistuning on the circumferential blade amplitude distribution at different operating points. (Glodic et al., 2011) investigated experimentally and numerically the effect of aerodynamic damping in an oscillating low-pressure turbine cascade taking mistuning into account. (Vogt et al., 2007) used the same cascade to show that the main influence of a vibrating blade is limited to the adjacent blades. (Petrov, 2010) and (Petrov, 2011) investigated the effect of mistuning on aerodynamic damping and explained the effect that for very low engine orders the amplification factor may become even lower than one. In the survey of (Ewins, 1991) many papers on the effect of mistuning on flutter are listed, also with the uniform conclusion that mistuning always raises the flutter threshold. A current overview of mistuning literature can be found in the review paper of (Castanier, et al., 2006), including intentional mistuning. (Kielb et al., 2001) presented some results of an experimental method and data analysis study of multiple engine relevant damping sources. The contributions of aerodynamic and structural damping for several vibration modes were determined. (Nowinsky et al., 2000) presented a series of experiments in an annular cascade to investigate torsional flutter in low-pressure turbines. They showed that relatively small changes to the location of the torsion axis had a dramatic effect on the stability behaviour. (Kovats, 1980) determined time histories of aerodynamic forces interferometrically and showed experimentally that at large negative flow incidence blades are becoming unstable in the twist mode. Experimental research in the field of forced response for a fan under engine representative conditions was performed in detail by (Manwaring et al., 1991) and (Manwaring et al., 1990). The experiments quantified the effect of the inlet flow conditions and the blade pressure distribution on the vibratory response of the blades. (Chen et al., 2012) investigated the combined effects of both axial gap and blade count ratio numerically. They have found that the excitation of a downstream rotor is reduced when increasing the blade count ratio. The excitation is also reduced exponentially with increased axial gap. However, the response of the blades is not analysed in their paper.
141
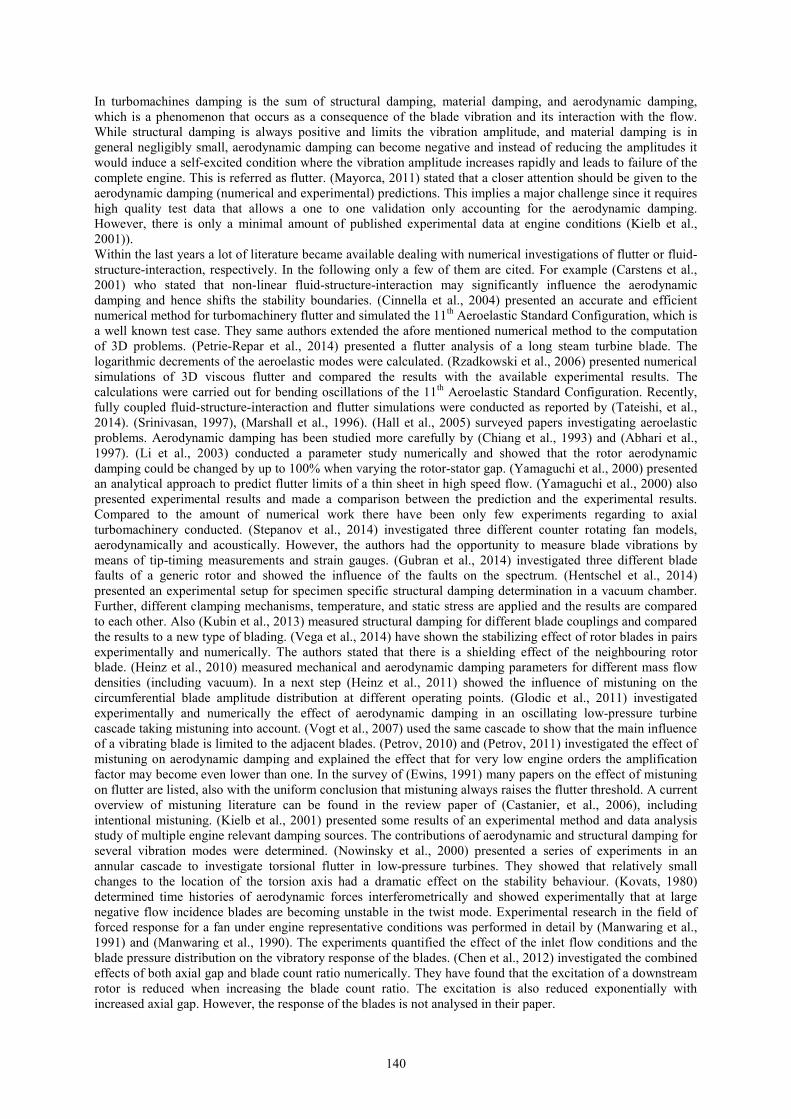
There are a lot of papers dealing with damping, mistuning vibration suppression but there is not much about measured response of low pressure turbine rotor blades at engine realistic conditions. This paper focuses on that response of the rotor blades and compares experimental and numerical results of different axial gaps between rotor and stator. The aim of this paper is to show the differences one have to deal with between experiments and simulations due to necessary simplifications of the numerical model. 2 Experimental Facility and Instrumentation Test Facility The Institute for Thermal Turbomachinery and Machine Dynamics at Graz University of Technology operates a 3MW compressor station in order to supply a couple of test facilities continuously with pressurized air. For the subsonic turbine test facility the maximum pressure ratio is limited to 2. The maximum mass flow rate is 15 kg/s at a temperature at stage inlet of 100°C. This inlet temperature can be adjusted by coolers within a wide range. The pressurized air enters the facility through a spiral inlet casing where the flow turns into axial direction. Within this spiral inlet casing the front bearing of the overhung-type turbine shaft is mounted. The shaft is coupled to a water brake. In order to provide well defined and uniform inflow conditions a de-swirler and a perforated plate is located upstream of the stage inlet. Further, upstream of the stage, inlet guide vanes (IGV) can be found that should simulate additional wakes of other upstream low pressure turbine stages. The air leaves the rig through an acoustic measurement section, supporting struts, exhaust casing, and the exhaust stack to ambient. The rig is designed to be able to perform aerodynamic, acoustic and aeroelastic investigations (AAAI). A detailed description of the STTF-AAAI is given in (Moser, et al., 2007). To be able to change the distance between blade/vane rows interchangeable rings (rings upstream of IGV and rotor in Figure 1) are available and have been changed to adjust the axial gap between stator and rotor. However, the rotor was always on the same axial position, only IGVs and stator vanes have been moved upstream. Also, the relative position of the five-hole-probe measurement planes A and C have been the same. Turbine Stage The aerodynamic design of the low pressure turbine (LPT) stage and the IGVs was performed by MTU Aero Engines. Considerable effort was put into the adjustment of relevant model parameters to reproduce the full scale LPT configuration. The turbine diameter is approximately half of that of a commercial aero engine LPT and therefore the rig is operated at higher rotational speeds. The blade count ratio (BCR) is chosen to fulfil an acoustic design intend. A meridional section of the rig is shown in Figure 1. The rig is characterised by a high aspect ratio unshrouded rotor. Relevant geometry parameters can be seen in the upper half of Table 1. For this investigation three different operating points have been chosen. Operating Point OP1 represents an acoustically relevant operating point ("approach"). For this investigation two additional operating points OP2 and OP3 were chosen. With OP2 the behaviour of the turbine stage at the same pressure ratio as for OP1 but lower rotational speeds was investigated. Further, blade vibrations have been measured at the same lower rotational speed as for OP2 but at a lower stage total pressure of 1.14 (=OP3).
Figure 1. Meridional section of the STTF-AAAI
Operating Conditions Based on the intended use of the LPT rig for aeroelastic, acoustic and aerodynamic investigations, the main operating points are selected according to the typical noise certification points. They have been defined using an aero design point of the last stage LPT, derived from current LPT design practice using scaling along reduced speed, reduced mass flow (both referred to 288.15 K and 1013.25 mbar) and pressure ratio. For this investigation

142
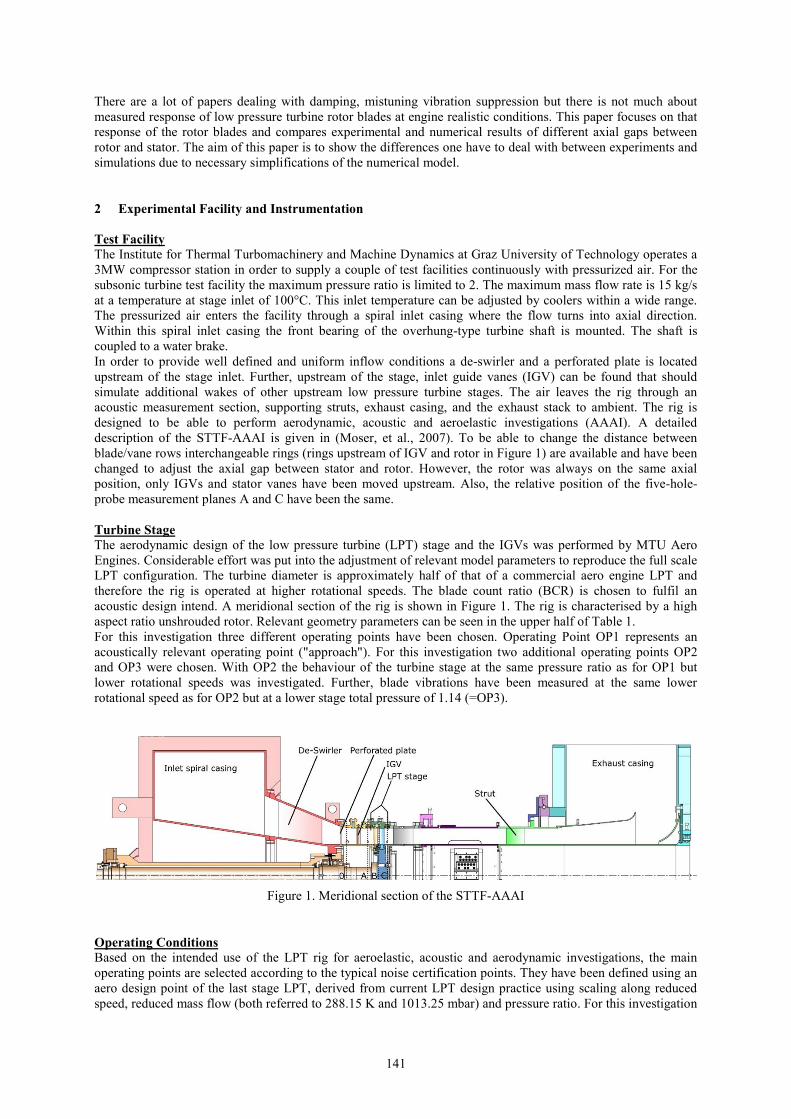
the operating point approach (=OP1) was chosen. Based on that point the rotational speed was reduced to investigate "near-resonance" behaviour at the same stage total pressure and temperature (=OP2). A third operating point (OP3) was investigated with decreased total pressure at the same temperature and rotational speed. The lower half of Table 1 shows the operating conditions. Although, the reduced values for the rotational speed are given, in the experiment it was crucial to keep also the mechanical rotational speed constant for each operating point. Also, all vibration measurements have been performed at the same day in order to have the same ambient pressure. That is important to ensure that different stage pressure ratios are only related to the inlet pressure. Table 1. Geometry details and operating conditions Geometry details Number of blades/vanes IGV 83 Stator 96 Rotor 72 Tip gap to blade height ratio 1.0% Hub to tip radius ratio ≈2/3 Operating conditions Reduced mass flow OP3 6.86kg/s Reduced rotational speed OP2 and OP3 3000rpm Reduced mass flow OP1 6.94kg/s Reduced rotational speed OP1 3653rpm Stage pressure ratio OP3 1.14 Stage pressure ratio OP1 and OP2 1.16 Stage total inlet temperature OP1 and OP2 100°C Instrumentation Five-hole-probes (from Institute of Jet Propulsion and Turbomachinery, RWTH Aachen University) with a probe head of 2.5 mm diameter were applied in measurement plane C (see Figure 1). The probes are calibrated for Mach numbers between 0.1 and 0.8, yaw angles between –20 deg and +20 deg, pitch angles between –16 deg and +20 deg. Negative values of the yaw angle indicate a counter-rotating flow and negative values of the pitch angle indicate the flow direction towards the hub. The correlation between the calibration characteristics and the value to be measured is given by a multi-parameter approximation. The axial positions of measurement planes can be seen in Figure 1. Plane C is located downstream of the rotor trailing edge (TE) in a distance of 60% of the axial rotor blade chord length. The grid covers two stator pitches and about 95% passage height. Traversing was done along radial lines. In each measurement point the probe was turned into the flow to reach the highest accuracy and to ensure to be always within the calibration range of the probe (with these probes it would not have been necessary, if one ensures to be always within the calibration range). Unfortunately, it was not possible to reliable measure in plane B between stator and rotor because of the very small (engine realistic) axial gap. The rotor blading which had to be instrumented was already characterized and results presented by (Schönleitner, et al., 2015). A number of numerical and experimental studies showed the optimum strain gauge positions for blade vibration measurements. Basically, the telemetry system used in the experiments provides 12 ports for strain gauge measurements. Therefore, 12 strain gauges were applied on different blades of the rotor and on three different blade surface positions near maximum strain positions for eigenmodes. Additional to that 12 ports for strain gauge measurements the telemetry system provides 8 ports for temperature measurements and is extendable with pressure sensors. The maximum sampling rate is 400 ksamples/second with a simultaneous data acquisition of 12bit. The strain gauge data is transmitted by rotor stator principle via antenna outside of the test rig where it is recorded. Further information can be found in (Schönleitner, et al., 2015). The system is able to operate at rotational speeds up to 11000rpm and temperature ranges up to 150°C. Data is acquired for the investigations presented in this paper with a sampling rate of 204.8 ksamples/second. For this investigation only one strain gauge SG3 was evaluated. SG3 is marked in Figure 2 with a circle.

143
Figure 2. Rotor strain gauge application and FE model
Measurement Uncertainties Instrumentation has to meet not only high demands on accuracy and repeatability but requires higher numbers of channels, too. Therefore, the measurement system is made up by eleven multi channel pressure transducers PSI 9016 with a total amount of 176 channels and an accuracy of 0.05% full scale and four National Instruments Field Point FP-TC-120 eight-channel thermocouple input modules and one FP-RTD-122 resistance thermometer input module. Table 2 shows the measurement uncertainties (within a 95% confidence interval) of the five-hole-probe measurements. From these measurements the Mach number ��, flow angle � as well as static � and total pressure �� is obtained. The uncertainty of these values are positive and negative deviations and contain the error due to the approximation, random error and the systematic error of the PSI Modules. The difference between the positive and the negative direction is a result of the multiparameter approximation, because the calibration surface is not symmetrical. The measurement uncertainties of the static pressure and the total pressure at rig and stage inlet are +/- 1 mbar. The variation of speed is below 0.2% of the current operating speed and the measurement uncertainty of the temperature measurement is about +/- 0.5 K. The variation of the operating parameters (pressure ratio, corrected speed, speed, total pressure and temperature at rig inlet) between different measurement days has been below 0.5%. Table 2. Measurement uncertainties of the five-hole-probe
Ma +0.006 -0.003 [/] � +0.5 -0.08 [deg] pt +3.3 -3.0 [mbar] p +5.3 -5.2 [mbar]
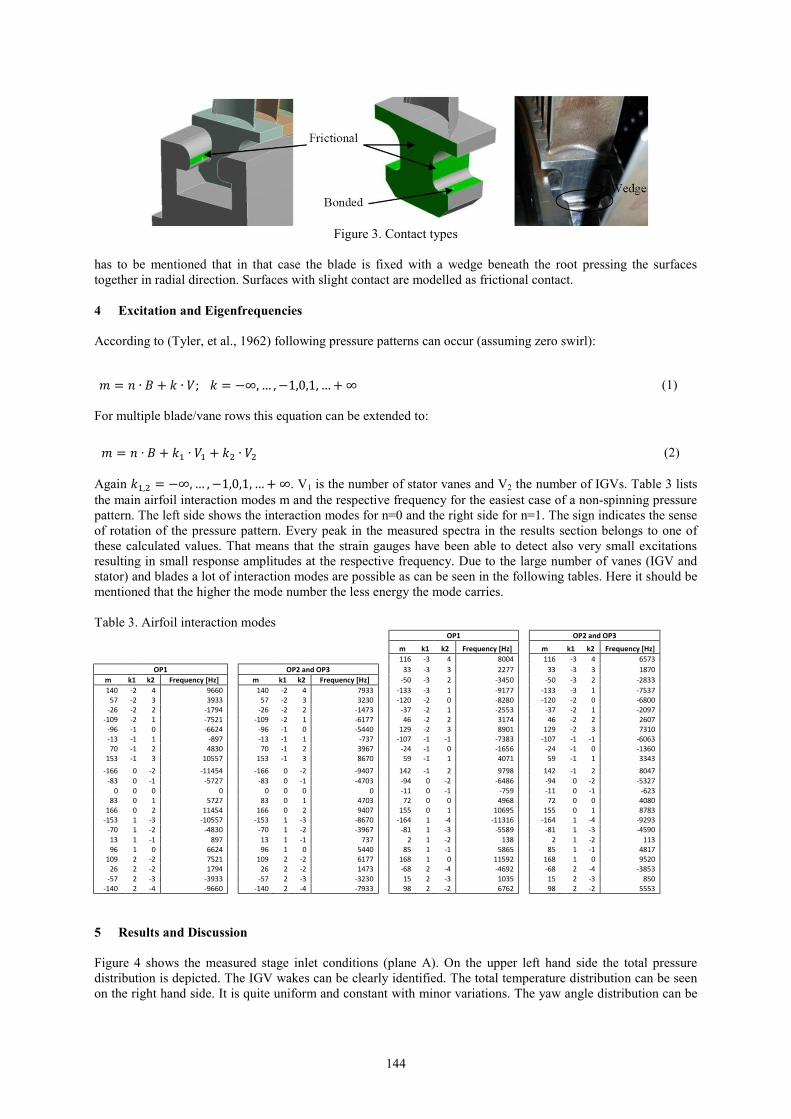
3 Numerical Setup Numerical simulations have been performed using ANSYS 16.2. CFx was used for fluid dynamic simulations and ANSYS mechanical for the structural simulation. In order to capture the effect of the deformed blades on the fluid flow this deformation has to be feed back into the CFD solver and therefore a two-way coupled fluid-structure-interaction simulation was performed. For the transient CFD simulation (time step: 0.000025 [s]) 4 stator vanes and 3 rotor blades have been modelled for periodicity reasons, although the calculated frequencies are about 1% higher compared to a five blade model that also contains a solid part between two holes. The IGV's have not been modelled to reduce mesh size. As boundary conditions a constant backpressure at outlet was set according to measurement results. Measured total pressure, total temperature, pitch angle, and yaw angle distribution at inlet are given (see Figure 4) as well as turbulence intensity at inlet of 10% was set. The CFD mesh consists of approx. 6.3 million hexahedral elements. As turbulence model � − � ��� with automatic wall functions ( y+~60) was applied. The FE mesh for the transient structural (time step 0.0002451 [s]) computation consists of approx. 75000 elements. The blade (made of aluminium) is modelled with hexahedral elements and the disc with tetrahedral elements. The contact type between rotor disc and blades is set as frictional (� = 0.19) and bonded (see Figure 3) and between the blades as frictional (� = 1.05). A study showed that the combination frictional and bonded with that specific standard values of � reproduces best agreement between calculation and experiment. Further, it
144
Figure 3. Contact types
has to be mentioned that in that case the blade is fixed with a wedge beneath the root pressing the surfaces together in radial direction. Surfaces with slight contact are modelled as frictional contact. 4 Excitation and Eigenfrequencies According to (Tyler, et al., 1962) following pressure patterns can occur (assuming zero swirl):
For multiple blade/vane rows this equation can be extended to:
Again ��,� = −∞, … ,−1,0,1, … +∞. V1 is the number of stator vanes and V2 the number of IGVs. Table 3 lists the main airfoil interaction modes m and the respective frequency for the easiest case of a non-spinning pressure pattern. The left side shows the interaction modes for n=0 and the right side for n=1. The sign indicates the sense of rotation of the pressure pattern. Every peak in the measured spectra in the results section belongs to one of these calculated values. That means that the strain gauges have been able to detect also very small excitations resulting in small response amplitudes at the respective frequency. Due to the large number of vanes (IGV and stator) and blades a lot of interaction modes are possible as can be seen in the following tables. Here it should be mentioned that the higher the mode number the less energy the mode carries. Table 3. Airfoil interaction modes
OP1 OP2 and OP3 m k1 k2 Frequency [Hz] m k1 k2 Frequency [Hz] 116 -3 4 8004 116 -3 4 6573
OP1 OP2 and OP3 33 -3 3 2277 33 -3 3 1870 m k1 k2 Frequency [Hz] m k1 k2 Frequency [Hz] -50 -3 2 -3450 -50 -3 2 -2833 140 -2 4 9660 140 -2 4 7933 -133 -3 1 -9177 -133 -3 1 -7537
57 -2 3 3933 57 -2 3 3230 -120 -2 0 -8280 -120 -2 0 -6800 -26 -2 2 -1794 -26 -2 2 -1473 -37 -2 1 -2553 -37 -2 1 -2097
-109 -2 1 -7521 -109 -2 1 -6177 46 -2 2 3174 46 -2 2 2607 -96 -1 0 -6624 -96 -1 0 -5440 129 -2 3 8901 129 -2 3 7310 -13 -1 1 -897 -13 -1 1 -737 -107 -1 -1 -7383 -107 -1 -1 -6063 70 -1 2 4830 70 -1 2 3967 -24 -1 0 -1656 -24 -1 0 -1360
153 -1 3 10557 153 -1 3 8670 59 -1 1 4071 59 -1 1 3343 -166 0 -2 -11454 -166 0 -2 -9407 142 -1 2 9798 142 -1 2 8047
-83 0 -1 -5727 -83 0 -1 -4703 -94 0 -2 -6486 -94 0 -2 -5327 0 0 0 0 0 0 0 0 -11 0 -1 -759 -11 0 -1 -623
83 0 1 5727 83 0 1 4703 72 0 0 4968 72 0 0 4080 166 0 2 11454 166 0 2 9407 155 0 1 10695 155 0 1 8783
-153 1 -3 -10557 -153 1 -3 -8670 -164 1 -4 -11316 -164 1 -4 -9293 -70 1 -2 -4830 -70 1 -2 -3967 -81 1 -3 -5589 -81 1 -3 -4590 13 1 -1 897 13 1 -1 737 2 1 -2 138 2 1 -2 113 96 1 0 6624 96 1 0 5440 85 1 -1 5865 85 1 -1 4817
109 2 -2 7521 109 2 -2 6177 168 1 0 11592 168 1 0 9520 26 2 -2 1794 26 2 -2 1473 -68 2 -4 -4692 -68 2 -4 -3853
-57 2 -3 -3933 -57 2 -3 -3230 15 2 -3 1035 15 2 -3 850 -140 2 -4 -9660 -140 2 -4 -7933 98 2 -2 6762 98 2 -2 5553
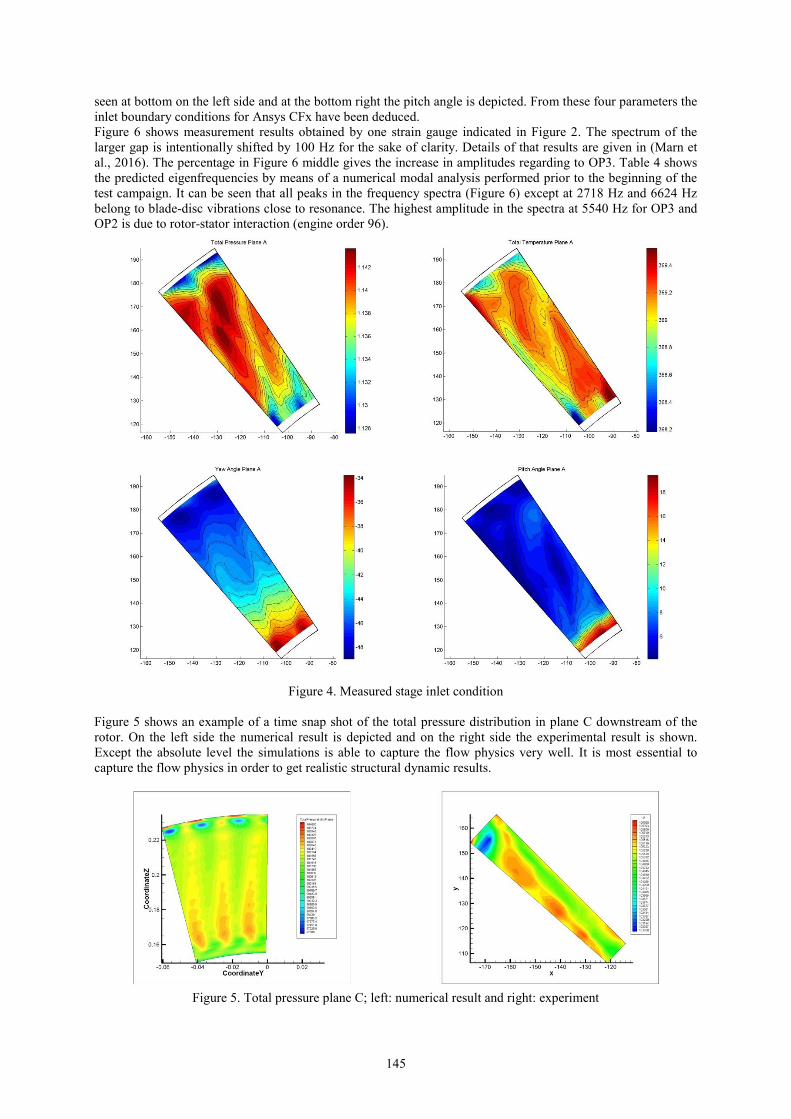
5 Results and Discussion Figure 4 shows the measured stage inlet conditions (plane A). On the upper left hand side the total pressure distribution is depicted. The IGV wakes can be clearly identified. The total temperature distribution can be seen on the right hand side. It is quite uniform and constant with minor variations. The yaw angle distribution can be
� = � ∙ � + � ∙ �; � = −∞, … ,−1,0,1, … +∞ (1)
� = � ∙ � + �� ∙ �� + �� ∙ �� (2)
145
seen at bottom on the left side and at the bottom right the pitch angle is depicted. From these four parameters the inlet boundary conditions for Ansys CFx have been deduced. Figure 6 shows measurement results obtained by one strain gauge indicated in Figure 2. The spectrum of the larger gap is intentionally shifted by 100 Hz for the sake of clarity. Details of that results are given in (Marn et al., 2016). The percentage in Figure 6 middle gives the increase in amplitudes regarding to OP3. Table 4 shows the predicted eigenfrequencies by means of a numerical modal analysis performed prior to the beginning of the test campaign. It can be seen that all peaks in the frequency spectra (Figure 6) except at 2718 Hz and 6624 Hz belong to blade-disc vibrations close to resonance. The highest amplitude in the spectra at 5540 Hz for OP3 and OP2 is due to rotor-stator interaction (engine order 96).
Figure 4. Measured stage inlet condition
Figure 5 shows an example of a time snap shot of the total pressure distribution in plane C downstream of the rotor. On the left side the numerical result is depicted and on the right side the experimental result is shown. Except the absolute level the simulations is able to capture the flow physics very well. It is most essential to capture the flow physics in order to get realistic structural dynamic results.
Figure 5. Total pressure plane C; left: numerical result and right: experiment

146
Table 4. Predicted eigenfrequencies Mode Operating Point No. 0rpm OP1 OP2&3 1st 923 [Hz] 955 [Hz] 939 [Hz] 2nd 1648 [Hz] 1649 [Hz] 1648 [Hz] 3rd 3270 [Hz] 3303 [Hz] 3274 [Hz] 4th 5404 [Hz] 5472 [Hz] 5424 [Hz] 5th 8180 [Hz] 8288 [Hz] 8223 [Hz]
Figure 6. Spectra (experiment) for OP3 (top), OP2 (middle), and OP1 (bottom)
147
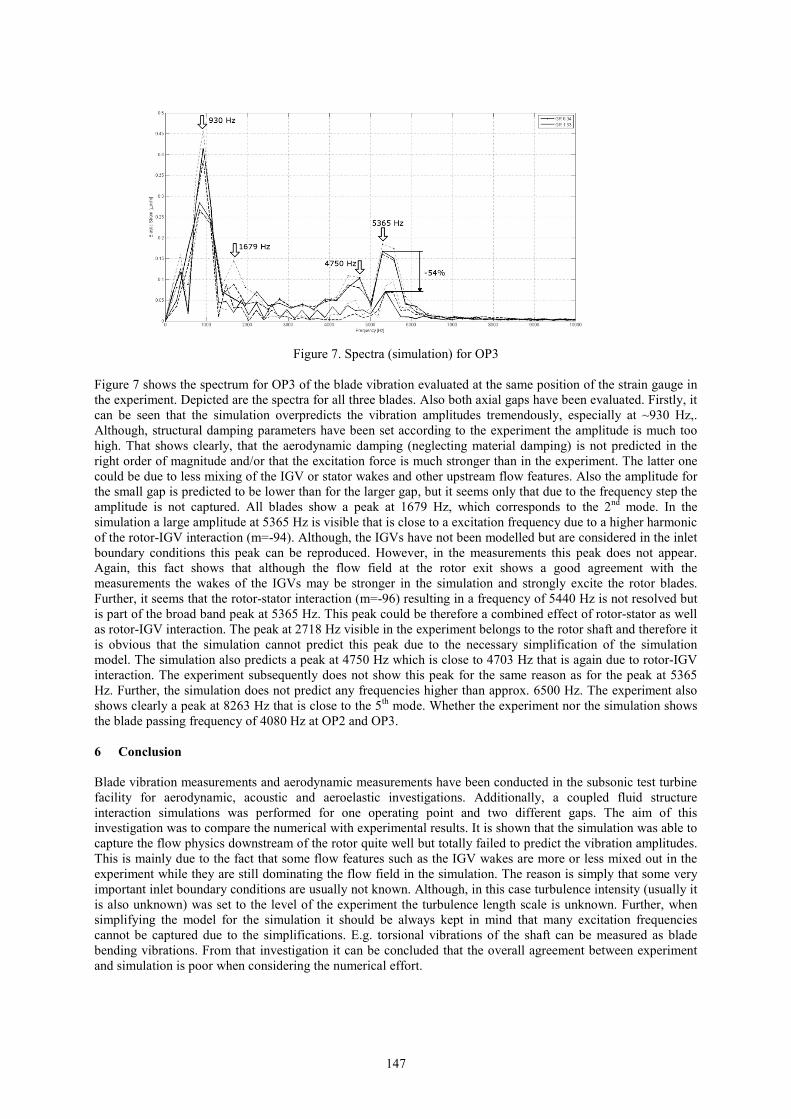
Figure 7. Spectra (simulation) for OP3
Figure 7 shows the spectrum for OP3 of the blade vibration evaluated at the same position of the strain gauge in the experiment. Depicted are the spectra for all three blades. Also both axial gaps have been evaluated. Firstly, it can be seen that the simulation overpredicts the vibration amplitudes tremendously, especially at ~930 Hz,. Although, structural damping parameters have been set according to the experiment the amplitude is much too high. That shows clearly, that the aerodynamic damping (neglecting material damping) is not predicted in the right order of magnitude and/or that the excitation force is much stronger than in the experiment. The latter one could be due to less mixing of the IGV or stator wakes and other upstream flow features. Also the amplitude for the small gap is predicted to be lower than for the larger gap, but it seems only that due to the frequency step the amplitude is not captured. All blades show a peak at 1679 Hz, which corresponds to the 2nd mode. In the simulation a large amplitude at 5365 Hz is visible that is close to a excitation frequency due to a higher harmonic of the rotor-IGV interaction (m=-94). Although, the IGVs have not been modelled but are considered in the inlet boundary conditions this peak can be reproduced. However, in the measurements this peak does not appear. Again, this fact shows that although the flow field at the rotor exit shows a good agreement with the measurements the wakes of the IGVs may be stronger in the simulation and strongly excite the rotor blades. Further, it seems that the rotor-stator interaction (m=-96) resulting in a frequency of 5440 Hz is not resolved but is part of the broad band peak at 5365 Hz. This peak could be therefore a combined effect of rotor-stator as well as rotor-IGV interaction. The peak at 2718 Hz visible in the experiment belongs to the rotor shaft and therefore it is obvious that the simulation cannot predict this peak due to the necessary simplification of the simulation model. The simulation also predicts a peak at 4750 Hz which is close to 4703 Hz that is again due to rotor-IGV interaction. The experiment subsequently does not show this peak for the same reason as for the peak at 5365 Hz. Further, the simulation does not predict any frequencies higher than approx. 6500 Hz. The experiment also shows clearly a peak at 8263 Hz that is close to the 5th mode. Whether the experiment nor the simulation shows the blade passing frequency of 4080 Hz at OP2 and OP3. 6 Conclusion Blade vibration measurements and aerodynamic measurements have been conducted in the subsonic test turbine facility for aerodynamic, acoustic and aeroelastic investigations. Additionally, a coupled fluid structure interaction simulations was performed for one operating point and two different gaps. The aim of this investigation was to compare the numerical with experimental results. It is shown that the simulation was able to capture the flow physics downstream of the rotor quite well but totally failed to predict the vibration amplitudes. This is mainly due to the fact that some flow features such as the IGV wakes are more or less mixed out in the experiment while they are still dominating the flow field in the simulation. The reason is simply that some very important inlet boundary conditions are usually not known. Although, in this case turbulence intensity (usually it is also unknown) was set to the level of the experiment the turbulence length scale is unknown. Further, when simplifying the model for the simulation it should be always kept in mind that many excitation frequencies cannot be captured due to the simplifications. E.g. torsional vibrations of the shaft can be measured as blade bending vibrations. From that investigation it can be concluded that the overall agreement between experiment and simulation is poor when considering the numerical effort.

148
7 Acknowledgements This work has been carried out in the framework of the national funded TAKE-OFF programme within the research project AdMoNt (contract no. 839008) regarding aeroelastic investigations of low pressure turbine blading at Graz University of Technology at the Institute for Thermal Turbomachinery and Machine Dynamics. The authors therefore want to thank the Austrian Research Promotion Agency (FFG) and the Austrian Ministry for Transport, Innovation and Technology (bmvit) for funding this project. The authors would like to thank Prof. Dr.techn. H.P. Pirker for his great support and the discussions during all experimental investigations and for operating the compressor station. References Abhari, R. and Giles, M.: A Navier-Stokes Analysis of Airfoils in Oscillating Transonic Cascades for the Prediction of Aerodynamic Damping. ASME Journal of Turbomachinery, vol. 119, January 1997. Acum, W.: The Comparison of Theory and Experiment of Oscillating Wings. AGARD Manual on Aeroelasticity in Axial Flow Turbomachines, vol. 2, 1988, Chapter 10. Carstens, V. and Belz, J.: Numerical Investigation of Nonlinear Fluid-Structure Interaction in Vibrating Compressor Blades. ASME Journal of Turbomachinery, vol.123, pp. 402-408, April 2001. Castanier, M. and Pierre, C.: Modeling and Analysis of Mistuned Bladed Disk Vibration: Status and Emerging Directions. Journal of Propulsion and Power, vol. 22, no. 2, pp. 384-396, 2006. Chen, T.; Patel, K.; Millington, P.: Combined Effects of Both Axial Gap and Blade Count Ratio on the Unsteady Forces of a Steam Turbine Stage. Proceedings of the ASME TurboExpo, 2012, ASME Paper GT2012-68874. Chiang, H. and Kielb, R.: An Analysis System for Blade Forced Response. ASME Journal of Engineering for Gas Turbines and Power, vol. 115, October 1993. Cinnella, P.; De Palma, P.; Pascazio, G., Napolitano, M.: A Numerical Method for Turbomachinery Aeroelasticity. ASME Journal of Turbomachinery, vol.126, pp. 310-315, April 2004. Ewins, D.: The Effect of Blade Mistuning on Vibration Response – A Survey. IFToMM Conference on Theory of Machines and Mechanisms, 1991. Glodic, N.; Vogt, D.; Fransson, T.: Experimental and Numerical Investigation of Mistuned Aerodynamic Influence Coefficients in an Oscillating LPT Cascade. Proceedings of the ASME TurboExpo, 2011, ASME Paper GT2011-46283. Gubran, A. and Sinha, J.: Comparison between Long and Short Blade Vibration Using Shaft Instantaneous Angular Speed in Rotating Machine. Proceedings of ASME TurboExpo, 2014, ASME Paper GT2014-25904. Hall, K.; Kielb, R.; Ekici, K.; Thomas, J.: Recent Advancements in Turbomachinery Aeroelastic Analysis. Proc. 43rd AIAA Aerospace Sciences Meeting and Exhibit, 2005, AIAA 2005-0014. Heinz, C.; Schatz, M.; Casey, M.; Stüer, H.: Experimental and Analytical Investigation of a Low Pressure Model Turbine During Forced Response Excitation. Proceedings of the ASME TurboExpo, 2010, ASME Paper GT2010-22146. Heinz, C.; Schatz, M.; Stüer, H.; Casey,M.: Impact of Mistuning on the Vibration Behaviour of the Last Stage in a Model Three Stage Low Pressure Steam Turbine. Proceedings of ASME TurboExpo, 2011, ASME Paper GT2011-45784. Hentschel, O.P.; Panning-von Scheidt, L.; Wallaschek, J.; Denk, M.; Masserey, P.-A.: Influential Parameters on Structural Damping Values of Turbine Blades. Proceedings of ASME TurboExpo, 2014, ASME Paper GT2014-25656. Kielb J. and Abhari, R.: Experimental Study of Aerodynamic and Strutural Damping in a Full-Scale Rotating Turbine. Proceedings of the ASME TurboExpo, 2001, 2001-GT-0262.

149
Kovats, Z.: Interferometrically Measured Aerodynamic Forces on a Vibrating Turbine Blade Group, Journal of Engineering for Power, vol. 102, July 1980. Z. Kubin, Z.; Polreich, V.; Cerny, V.; Babkova, P.; Prchlik, L.: Damping Identification and its Comparison For Various Types of Blade Couplings. Proceedings of ASME TurboExpo, 2013, ASME Paper GT2013-95438. Li, H.D. and He, L.: Blade Aerodynamic Damping Variation with Rotor-Stator Gap-A Computational Study Using Singe-Passage Approach. Proceedings of ASME TurboExpo, 2003, ASME Paper GT2003-38199. Manwaring, S.R. and Fleeter, S.: Forcing Function Effects on Rotor Aerodynamic Response. Journal of Turbomachinery, vol. 113, no. 2, 1991. Manwaring, S.R. and Fleeter, S.: Inlet Distortion Generated Periodic Aerodynamic Rotor Response. Journal of Turbomachinery, vol. 112, no. 2, pp. 298-307, 1990. Marn, A.; Schönleitner, F.; Mayr, M.; Selic, T.; Heitmeir, F.: On the Effect of Axial Spacing Between Rotor and Stator onto the Blade Vibrations of a Low Pressure Turbine Stage at Engine Relevant Operating Conditions. Proceedings of the ASME TurboExpo, pp. 1-13, 2016, ASME Paper GT2016-56069. Marshall, J. and Imregun, M.: A Review of Aeroelasticity Methods with Emphasis on Turbomachinery Applications. Journal of Fluids and Structures, vol. 10, pp. 237-267, 1996. Mayorca, M.A.: Numerical Methods for Turbomachinery Aeromechanical Predictions. Stockholm, Sweden, 2011, Doctoral Thesis. Moser, M.; Kahl, G.; Kulhanek, G.; Heitmeir, F.: Construction of a Subsonic Test Turbine Facility for Experimental Investigations of Sound Generation and Propagation for Low Pressure Turbines. Beijing, China, ISABE-2007-1366, 2007. Nowinsky, M. and Panovsky, J.: Flutter Mechanisms in Low Pressure Turbine Blades. Journal of Turbomachinery, vol. 122, January 2000. Petrie-Repar, P.; Makhnov, V.; Shabrov, N.; Smirnov, E.; Galaev, S.; Eliseev, K.: Advanced Flutter Analysis of a Long Shrouded Steam Turbine Blade. Proccedings of ASME TurboExpo, 2014, ASME Paper GT2014-26874. Petrov, E.P.: A Method for Forced Response Analysis of Mistuned Bladed Discs with Aerodynamic Effects Included. Journal of Engineering for Gas Turbines and Power, vol. 132, pp. 062502-1/-10, June 2010. Petrov, E.P.: Reduction of Forced Response Levels for Bladed Discs by Mistuning: Overview of the Phenomenon. Journal of Engineering for Gas Turbines and Power, vol. 133, pp. 072501-1/-10, July 2011. Rzadkowski, R.; Gnesin, V.; Kolodyazhnaya, L.: 3D Viscous Flutter in Turbomachinery Cascade by Godynov-Kolgan Method. ASME TurboExpo, 2006, ASME Paper GT2006-90157. F. Schönleitner, F.; Selic, T.; Traussnig, L.; Heitmeir, F.; Marn, A.: Experimental Blade Vibration Measurements on Rotating Turbomachinery. 20th Blade Mechanics Seminar, 2015. Schönleitner, F.; Traussnig, L.; Heitmeir, F.; Marn, A.: Modal Characteristics, Strain Gage Setup and 1-way FSI of a Low Pressure Turbine Rotor as Preparation for Upcoming Experimental Aeroelastic Investigations. Proceedings of the ASME TurboExpo, 2015, ASME Paper GT2015-42717. Srinivasan, A.V.: Flutter and Resonant Vibration Characteristics of Engine Blades, Journal of Engineering for Gas Turbine and Power, vol.119, pp. 741-775, October 1997. Stepanov, A.; Fateev, V.; Mileshin, V.: Study of Rotor Vibration Behavior of Counter Rotating Fan Models. Proceedings of ASME TurboExpo, 2014, ASME Paper GT2014 26310. Tateishi, A.; Watanabe, T.; Himeno, T.; Inoue, C.: Multimode Flutter Analysis of Transonic Fan Using FSI Simulation. Proceedings of ASME TurboExpo, 2014, ASME Paper GT2014-26702.

150
Tyler J.M. and Sofrin, T.G.: Axial Flow Compressor Noise Studies. SAE Transactions, vol. 70, pp. 309-332, 1962. Vega, A.; Corral, R.; Zanker, A.; Ott, P.: Experimental and Numerical Assessment of the Aeroelastic Stability of Blade Pair Packages. Proceedings of ASME TurboExpo, 2014, ASME Paper GT2014-25607. Vogt, D.M. and Fransson, T.: Experimental Investigation of Mode Shape Sensitivity of an Oscillating Low Pressure Turbine Cascade at Design and Off-Design Conditions. Journal of Engineering for Gas Turbines and Power, vol.129, pp. 530-541, April 2007. Yamaguchi, N.; Sekiguchi, T.; Yokota, K.; Tsujimoto, Y.: Flutter Limits and Behavior of a Flexible Thin Sheet in High Speed Flow—II: Experimental Results and Predicted Behaviors for Low Mass Ratios. Journal of Fluids Engineering, vol. 122, pp. 74-83, 2000. Yamaguchi, N.; Yokota, K.; Tsujimoto, Y.: Flutter Limits and Behaviors of a Flexible Thin Sheet in High-Speed Flow—I: Analytical Method for Prediction of the Sheet Behavior. Journal of Fluids Engineering, vol. 122, pp. 65-73, 2000. _________________________________________________________________________________________ Address: Dr. Andreas Marn, Mathias Mayr, Univ.-Prof. Dr.-Ing. Franz Heitmeir; Graz University of Technology, Institute for Thermal Turbomachinery and Machine Dynamics, Inffeldgasse 25A, A-8010 Graz, Austria. Dr. Florian Schönleitner, Semperit AG Holding, Modecenterstraße 22, A-1031 Vienna, Austria email: [email protected], [email protected], [email protected], [email protected]