Comparison of Kinematics of GHBMC to PMHS on the The goal of this study was to evaluate the...
12
Abstract The goal of this study was to evaluate the biofidelity of the Global Human Body Models Consortium (GHBMC) human body model under a side impact loading condition with an airbag, and analyze the effect of initial position of the model on the response. Shaw et al. conducted side impact sled tests using three Post mortem human surrogates (PMHS) with impact speeds of 4.3 ± 0.1 m/s, and used a rigid wall boundary condition with an airbag mounted to the sled. The correlation between the PMHS and the GHBMC was evaluated using the CORA rating method. The rating ranged from 0.27 to 0.69 along the body regions on a scale in which a rating of 1.0 indicated a perfect correlation between the PMHS and the GHBMC. The pelvis and thorax region showed good correlation with those of the PMHS while the spinal regions did not. In addition, the roll and yaw angle of the initial position of the PMHS had an effect on the response of subjects. The result of this research indicated two points, that the GHBMC model should be validated focusing on the internal biofidelity of the model, and that the yaw and roll angle should be carefully controlled during a side impact test. Keywords Biofidelity, GHBMC, Kinematics, Side impact I. INTRODUCTION In the field of biomechanics, post mortem human surrogates (PMHS), volunteers, anthropometric test devices (ATDs), animals and computational models have been employed to quantify the response and injury tolerance of a live human [1]. With the recent development of computational technology and software, the use of full human body finite element (FE) models have been expanded for over a decade. Two models have been widely used in the field: The Human Model for Safety (HUMOS) [4] and Total Human Model for Safety (THUMS) [5]‐[7]. The main advantage of the full human body FE model is its capability to predict injuries based on local values of stress and strain, offering considerable advantages over simpler multi‐body models, dummies, and in some circumstances even PMHS. However, the accuracy of any computational model for the assessment of injury risk depends inherently on the quality of the model in terms of model geometry and material properties [1]. Thus, the biofidelity of the human FE model should be evaluated across various loading conditions. The male 50th percentile GHBMC model has been developed by Global Human Body Models Consortium TM and validated from the component level to whole body sled test responses [19]‐[25]. The biofidelity of this model was also evaluated in lateral sled tests and drop test conditions, focusing on the impact force, thorax deflection and rib fracture [18]. The kinematics of bony structures including the head, spine, and pelvis have not been evaluated. However, differences in body kinematics affect the forces and accelerations that occur in the spine and thorax [8]. Shaw et al. conducted PMHS sled tests in which significant information about the occupant response was measured, including kinematics of body regions [9], which may provide an ideal basis to assess the biofidelity of the computational models in predicting human response and injury. The goal of this study was to compare the responses of the GHBMC model under the side impact condition to that of the PMHS, not only the impact forces from the impact wall but also the kinematics. The level of validation was evaluated objectively using a correlation analysis. The effects of varying the initial position on response of the human body model were analyzed using a sensitivity analysis. G. Park is a graduate student (tel: +1 (434) 296‐7288, fax: +1 (434) 296‐3453, [email protected]), T. Kim is a research scientist and J.R. Crandall is Professor at the University of Virginia Center for Applied Biomechanics, Charlottesville, Virginia. C. Arregui‐Dalmases is a visiting assistant professor at the University of Virginia and an associate professor at the Universitat Politècnica de Catalunya (UPC) Barcelona Tech. J. Luzon‐Narro is an associate professor at the Universitat Politècnica de Catalunya (UPC) Barcelona Tech. Comparison of Kinematics of GHBMC to PMHS on the Side Impact Condition Gwansik Park, Taewung Kim, Jeff R. Crandall, Carlos Arregui‐Dalmases, Javier Luzon‐Narro IRC-13-41 IRCOBI Conference 2013 - 368 -
Transcript of Comparison of Kinematics of GHBMC to PMHS on the The goal of this study was to evaluate the...

Abstract The goal of this study was to evaluate the biofidelity of the Global Human Body Models
Consortium (GHBMC) human body model under a side impact loading condition with an airbag, and analyze the
effect of initial position of the model on the response. Shaw et al. conducted side impact sled tests using three
Post mortem human surrogates (PMHS) with impact speeds of 4.3 ± 0.1 m/s, and used a rigid wall boundary
condition with an airbag mounted to the sled. The correlation between the PMHS and the GHBMC was
evaluated using the CORA rating method. The rating ranged from 0.27 to 0.69 along the body regions on a scale
in which a rating of 1.0 indicated a perfect correlation between the PMHS and the GHBMC. The pelvis and
thorax region showed good correlation with those of the PMHS while the spinal regions did not. In addition, the
roll and yaw angle of the initial position of the PMHS had an effect on the response of subjects. The result of this
research indicated two points, that the GHBMC model should be validated focusing on the internal biofidelity of
the model, and that the yaw and roll angle should be carefully controlled during a side impact test.
Keywords Biofidelity, GHBMC, Kinematics, Side impact
I. INTRODUCTION
In the field of biomechanics, post mortem human surrogates (PMHS), volunteers, anthropometric test
devices (ATDs), animals and computational models have been employed to quantify the response and injury
tolerance of a live human [1]. With the recent development of computational technology and software, the use
of full human body finite element (FE) models have been expanded for over a decade. Two models have been
widely used in the field: The Human Model for Safety (HUMOS) [4] and Total Human Model for Safety (THUMS)
[5]‐[7].
The main advantage of the full human body FE model is its capability to predict injuries based on local values
of stress and strain, offering considerable advantages over simpler multi‐body models, dummies, and in some
circumstances even PMHS. However, the accuracy of any computational model for the assessment of injury risk
depends inherently on the quality of the model in terms of model geometry and material properties [1]. Thus,
the biofidelity of the human FE model should be evaluated across various loading conditions.
The male 50th percentile GHBMC model has been developed by Global Human Body Models ConsortiumTM
and validated from the component level to whole body sled test responses [19]‐[25]. The biofidelity of this
model was also evaluated in lateral sled tests and drop test conditions, focusing on the impact force, thorax
deflection and rib fracture [18]. The kinematics of bony structures including the head, spine, and pelvis have not
been evaluated. However, differences in body kinematics affect the forces and accelerations that occur in the
spine and thorax [8]. Shaw et al. conducted PMHS sled tests in which significant information about the occupant
response was measured, including kinematics of body regions [9], which may provide an ideal basis to assess
the biofidelity of the computational models in predicting human response and injury.
The goal of this study was to compare the responses of the GHBMC model under the side impact condition
to that of the PMHS, not only the impact forces from the impact wall but also the kinematics. The level of
validation was evaluated objectively using a correlation analysis. The effects of varying the initial position on
response of the human body model were analyzed using a sensitivity analysis.
G. Park is a graduate student (tel: +1 (434) 296‐7288, fax: +1 (434) 296‐3453, [email protected]), T. Kim is a research scientist and J.R. Crandall is Professor at the University of Virginia Center for Applied Biomechanics, Charlottesville, Virginia. C. Arregui‐Dalmases is a visiting assistant professor at the University of Virginia and an associate professor at the Universitat Politècnica de Catalunya (UPC) Barcelona Tech. J. Luzon‐Narro is an associate professor at the Universitat Politècnica de Catalunya (UPC) Barcelona Tech.
Comparison of Kinematics of GHBMC to PMHS on the Side Impact Condition
Gwansik Park, Taewung Kim, Jeff R. Crandall, Carlos Arregui‐Dalmases, Javier Luzon‐Narro
IRC-13-41 IRCOBI Conference 2013
- 368 -

II. METHODS
To evaluate the biofidelity of the GHBMC model to the PMHS, two methods were employed: correlation
analysis (CORA) and analysis of variance (ANOVA). The correlation analysis objectively assessed the reliability of
the model and the ANOVA analyzed the effect of the initial position variance of the human body model on its
response. The experimental testing data using the PMHS in this research was based on previous work conducted
by Shaw et al. [9]. A brief description of their test set‐up was provided in this paper, while more complete
details of the test set‐up can be found in Shaw et al. [9]: Three approximately 50th percentile adult male PMHS
were used for testing (test 1569, test 1570, and test 1571) and each subject had different anthropometry. In this
study, test1570 (stature: 175cm) was selected as the reference data due to its similar stature to the GHBMC
model. LS‐DYNA double precision MPP R4.2.1 was used for the simulations.
Test Fixtures
The right side of PMHS was struck at 4.3 ± 0.1 m/s by a rigid wall with the side airbag on a sled. There were fifteen separate load cell plates supported by a load cell in the wall buck and they were distributed from the head to lower extremity regions (Figure 3). The seat was inclined 15 degrees backward without a backrest, and a foam pad was placed between the distal thighs and the seat to achieve a target femur angle. Both the top and bottom of the seat was covered with Teflon to create a coefficient of friction of 0.249. In this study, the FE model of load cell wall and seat cushion were assumed to be a rigid body.
GHBMC Model
The GHBMC male 50th percentile model (version: FMB v.3‐5, weight: 77.1 kg, and height: 175.3 cm) [19]‐[25]
was used in this study. Overall, this FE human model consists of 1.3 million nodes, 1.95 million elements, and
847 parts. The fracture of bone was modeled by using effective failure strain. If an element reached the failure
strain, then the element was deleted. Shaw et al. amputated the forearms of their PMHS to improve visibility
during motion tracking [9]. Therefore, the forearms of the human model were removed, and nodes in cutting
plane were defined as rigid bodies by using the *CONSTRAINED _NODAL_RIGID_BODY keyword in LS‐DYNA
(Figure 1) [10].
Side Airbag
During the side impact tests a custom large volume, dual inflator side airbag was deployed prior to contact
with the subject’s thorax timing that allowed for full inflation prior to thorax loading. The airbag was mounted
using a hinge with a rotational spring (Figure 3). The rotational joint of the mounting system was modeled using
a connector element. The FE side airbag model was modeled using an *Airbag_Hybrid model which was
supported in LS‐DYNA [10]. This was a simple way to model the airbag assuming uniform pressure without flow
direction. The airbag deployed as shown in Figure 3. The side airbag model was validated by a previous research
that compared the impact forces and lateral accelerations of the ES‐2re FE model to that of the ES‐2re dummy
in the test [14].
Data Processing
The accelerations of the head, T1, T6, T11, L3 and pelvis were obtained using a tri‐axial accelerometer. The
kinematics of PMHS were determined using a VICONTM motion capture camera system. Using the VICONTM
system 3‐dimensional motions of the anatomical structures were captured through a transformation of a
marker‐based coordinate system to the anatomical coordinate system [9]. In this study, the lateral acceleration
of T1, T6, and pelvis and the kinematics of spine of the GHBMC model were compared to those of the reference
PMHS. During the tests, two dimensional torso deformation was measured using a chestband [12], which
encircled the torso at the level of the sixth rib laterally. The central thorax deflection from the chestband
(distance between point B and point E) was compared to assess the chest deflection (Figure 2).
To compensate the different anthropometries of the cadaver and GHBMC human model, the responses of the
cadaver were scaled to the standard anthropometry of the 50th percentile male, which is the same with the
GHBMC model, by using a mass scaling technique proposed by Eppinger et al. [28]
In the GHBMC model, impact forces were taken by contact force between the wall buck and the subject and
the acceleration was obtained. The nodal velocity output was differentiated to obtain acceleration time
histories at T1, T6, and pelvis because the GHBMC model (v3.5) did not used acceleration elements at the
locations of interest and the nodal acceleration data was very noisy even after filtering. Chest deflection was
IRC-13-41 IRCOBI Conference 2013
- 369 -

calculated by measuring the distance between two center nodes in the chestband and normalized using the
initial distance between two nodes in the GHBMC model.
All the data were represented according to SAE J1733 [16]. The coordinates system used in this study is shown
in Figure 3. For the comparison between the response of the PMHS and the human model, the impact forces
and accelerations were filtered using the CFC180 [17].
Initial Position
There was variation in the initial position of the subjects during testing due to the subjects themselves and the
tether support system. Although the target position during the PMHS tests were the UMTRI driving position [11]
which the GHBMC model was developed to target it, the initial position variance needed to be checked to
ensure similar test conditions. The initial position of the PMHS was compared using the position data from the
VICON markers in the test (Figure 4).
Correlation Analysis
The objective evaluation of the level of correlation of the GHBMC responses and a reference PMHS was
analyzed using the correlation and analysis method (CORA) [15]. The rating of each response was calculated and
overall rating of the model was obtained by averaging all the responses with same weight factor. The CORA
parameters used in this study is shown in Table I. Since the CORA rating score is a relative measure to
understand the meaning of the CORA rating score between responses of the GHBMC model and the reference
PMHS, CORA rating scores calculated between responses of the reference PMHS (test 1570) and other PMHSs
(test 1569 and test 1571).
Sensitivity Analysis
To analyze the effect of initial position to the subject responses, a one‐half fraction of two‐level factorial
design of experiment was used for the sensitivity analysis of initial positions of the GHBMC model on its
responses. Five variables, which were vertical position, horizontal position, pitch angle, roll angle, and yaw
angle, and seven responses, which were shoulder, thorax, and pelvis impact force, T1, T6, and pelvis
accelerations, and chest compression, were considered for the sensitivity analysis. Since the responses were
time histories not only peak values and timing of those but also CORA ratings were used for the sensitivity
analysis to evaluate overall correlation between a pair of signals.
Eight anatomical locations of cadavers were measured by using ViconTM camera systems as shown in Figure 4
(left). Vertical and horizontal positions were defined based on the location of the pelvis marker. The roll and
pitch were calculated by measuring angles between the vector from the pelvis to the T1 and the projected
vectors of it on the xz‐plane and yz‐plane, respectively. The yaw angle was calculated by measuring angle
between the vector from the pelvis to the mid‐point of left and right patellas and the projected vector of it on
the xy‐plane.
To determine the levels of the five design variables, the initial position data of three PMHS (test 1413, test
1414, and test 1415) [13] were additionally used with those from the study of Shaw et al. [9] to increase the
number of PMHSs. Tests performed by Lessely et al. [13] were similar to those of Shaw et al., except a rigid wall
condition was used instead of an airbag condition. One standard deviations of each design variables were used
as levels and UMTRI driving position was used as a baseline position because this position was the target for
PMHS tests (Table II). Since the GHBMC model has been developed targeting the UMTRI sitting posture as initial
posture, the model was selected as the baseline model for sensitivity analysis. In addition to the baseline model,
which was used for comparing the responses to PMHS responses, sixteen more simuilations were performed by
imposing the initial position errors for the sensitivity analysis. The whole GHBMC model was translated and
rotated with respect to its pre‐defined origin (Figure 1). Also the upper surface of seat foam was rotated
together with the GHBMC model for the pitch and roll rotation. The rotations of the GHBMC model were
applied in the order of yaw, pitch and roll angle.
Sensitivity of the initial position on the responses of the GHMBC model were analyzed through ANOVA
analysis. The normality of residuals of three measures, which were peak value, peak time, and CORA rating, of
the seven responses of the GHBMC model were tested by using the Anderson‐Darling normality test. ANOVA
analysis was performed only for the measures whose residuals showed normality. Also, main effects of the
design variables were analyzed to evaluate the magnitude of changes in responses due to the initial positions.
IRC-13-41 IRCOBI Conference 2013
- 370 -

Fig. 1. Forearm elements removed GHBMC (FBM v3.5)
model and origin of the model
Fig. 2. Full thorax deflection using the chestband
Fig. 3. Wall buck with load cell with side airbag mounting system and coordinates system (upper) and sequences
of deployment of the side airbag (below)
IRC-13-41 IRCOBI Conference 2013
- 371 -

Fig. 4. Comparison of Initial position at the anatomical landmarks from the VICON data between test 1570 (left)
and the GHBMC model (right)
TABLE I
CORA parameters used in this research
A_THRES B_THRES A_EVAL B_DELTA_END K G_1 0.030 0.075 0.010 0.200 2 0.5
a_0/b_0 a,b_sigma D_MIN D_MAX INT_MIN K_V 0.05 0 0.01 0.12 0.80 10
K_G K_P G_V G_G G_P G_2 1 1 0.50 0.25 0.25 0.50
TABLE II
Initial position variance of six PMHS
Variables (+) Direction test
1569 test
1570 test
1571 test
1413 test
1414 test
1415 STD
Vertical [mm] (along Z-axis)
178 183 199 149 162 183 18
Horizontal [mm] (along X-axis)
-59 -51 -92 11 -3 11 43
Pitch Angle [deg] (along Y-axis)
5 2 -3 4 -1 -5 4
Roll Angle [deg] (along X-axis)
-7 4 3 4 0 -8 5
Yaw Angle [deg] (along Z-axis)
-2 0 1 -4 -2 -1 2
III. RESULTS
The responses of the GHBMC human body model was compared to the reference PMHS (test 1570)
responses as shown in Figure 5, Figure 6, and Figure 7. The shoulder of GHBMC model sustained higher peak
impact force than the PMHS and showed higher T1 and T6 Y‐axis peak acceleration than those of the PMHS
responses. Also, GHBMC showed stiffer responses than the PMHS in terms of the chest compression. This
correlation can be well explained in Table III, which consists of peak values for each response, its peak time and
the CORA rating, which implies the level of correlation objectively. The CORA rating of the GHBMC human body
model ranged from 0.27 to 0.69 for the each response and the overall rating was 0.53 using the average of all
the responses. Additionally, the kinematics of bony structures around the spine were compared between the
GHBMC model and the PMHS (Figure 8). The GHBMC position along the Y‐axis seems similar to that of PMHS,
however, the location of pelvis in the GHBMC human body model remained stayed along the z‐axis while the
PMHS pelvis was going up along the z‐axis.
The sensitivity analysis results of seventeen cases including peak value, peak time and CORA rating are
IRC-13-41 IRCOBI Conference 2013
- 372 -
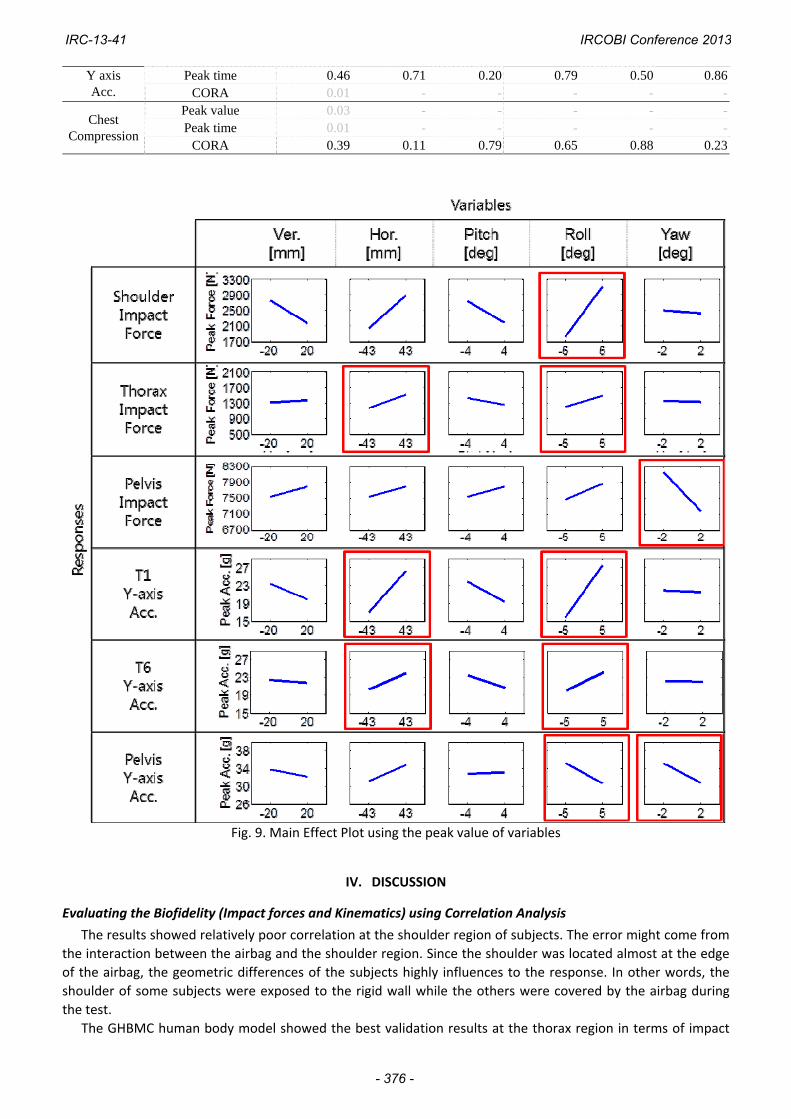
summarized in Table IV. Using the result in Table IV., ANOVA was performed to find the most influential
variables on the responses of the model and the results were summarized in Table V. From the ANOVA results,
the variation of the roll angle affected the most number of responses and showed statistically significant (p <
0.05) effect on the peak impact force at the shoulder and its timing, the peak impact force of thorax, the peak
Y‐axis acceleration and its time of T1 and T6. The horizontal direction had a significant effect (p <0.05) on the
peak impact force of thorax and peak Y‐axis acceleration of T1. Furthermore, the variation of the yaw angle
significantly (p < 0.05) affected, peak impact force and Y‐axis acceleration of the pelvis. Main effect of the design
variables on the peak values were shown in Figure 9.
Fig. 5. Comparison of impact force time history : shoulder (left), thorax (middle), pelvis (right)
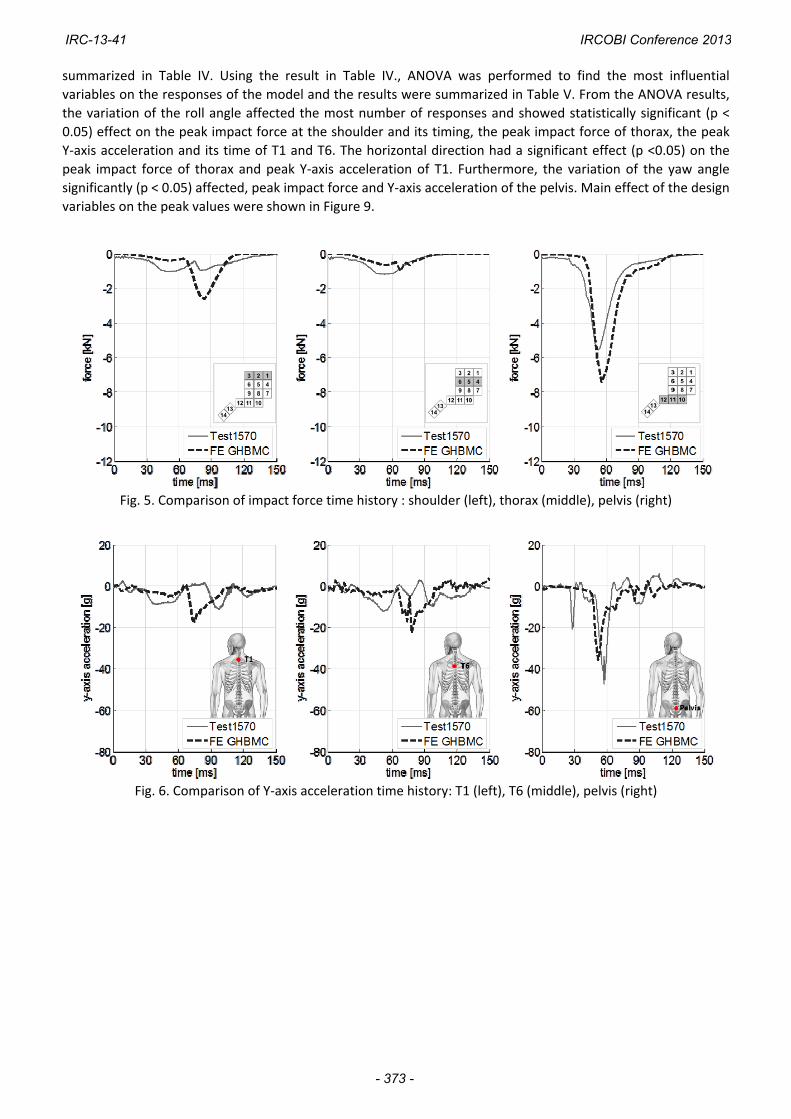
Fig. 6. Comparison of Y‐axis acceleration time history: T1 (left), T6 (middle), pelvis (right)
IRC-13-41 IRCOBI Conference 2013
- 373 -

Fig. 7. Comparison of chest compression time history
Fig. 8. Spinal position from 0 – 120 ms with
respect to the seat coordinate system
TABLE III Summary of biofidelity evaluation results
Subject Impact Force [kN] Y axis acc. [g] Chest
Defection [%]
AverageCORA Rating
Shoulder Thorax Pelvis T1 T6 Pelvis
Test 1570
Peak value 1.02 1.18 5.55 11 12 42 6.10Peak Time [ms] 51 53 52 97 51 57 57
Test 1569
Peak value 1.38 0.83 7.06 15 13 41 2.940.57Peak Time [ms] 104 65 49 95 100 54 65
COAR Rating 0.41 0.68 0.85 0.58 0.39 0.72 0.35
Test 1571
Peak value 1.19 1.31 6.17 12 12 36 6.560.63Peak Time [ms] 102 65 52 104 57 60 70
COAR Rating 0.53 0.69 0.78 0.62 0.60 0.74 0.46
GHBMC Peak value 2.62 1.25 7.43 18 23 36 4.25
0.53Peak Time [ms] 84 65 56 75 77 52 99COAR Rating 0.44 0.69 0.67 0.37 0.27 0.68 0.57
TABLE IV
Summary of data
No. Ver. [mm]
Hor. [mm]
Pitch [deg]
Roll [deg]
Yaw [deg]
Peak Impact Force [kN] Y acc. [g] Chest
Def.[%]Ave.
Rating Sho. Tho. Pelvis T1 T6 Pelvis
1 -18 -43 -4 -5 2 Value -1.89 -1.22 -7.14 -16 -19 -32 5.18
0.71Time 96 73 105 91 87 56 100Rating 0.64 0.73 0.77 0.59 0.67 0.78 0.80
2 18 -43 -4 -5 -2 Value -1.58 -1.18 -8.10 -13 -13 -34 5.92
0.76Time 97 53 56 91 98 51 100Rating 0.62 0.73 0.93 0.58 0.65 0.95 0.83
3 -18 43 -4 -5 -2 Value -2.74 -1.35 -7.90 -20 -23 -41 6.02
0.79Time 85 62 57 79 87 53 103Rating 0.85 0.68 0.88 0.70 0.77 0.88 0.75
4 18 43 -4 -5 2 Value -2.27 -1.46 -7.05 -18 -20 -31 5.57
0.75Time 88 61 57 80 84 53 101Rating 0.80 0.57 0.97 0.62 0.70 0.85 0.76
5 -18 -43 4 -5 -2 Value -1.58 -1.18 -8.07 -14 -14 -37 6.31
0.71Time 99 53 57 94 102 55 103Rating 0.60 0.71 0.91 0.44 0.62 0.85 0.80
IRC-13-41 IRCOBI Conference 2013
- 374 -

6 18 -43 4 -5 2 Value -1.58 -1.18 -6.60 -14 -14 -29 6.13
0.68Time 99 53 58 94 102 53 103Rating 0.40 0.71 0.90 0.42 0.63 0.87 0.83
7 -18 43 4 -5 2 Value -2.31 -1.33 -7.04 -23 -21 -38 5.23
0.78Time 88 66 57 89 93 55 103Rating 0.68 0.87 0.93 0.64 0.71 0.84 0.81
8 18 43 4 -5 -2 Value -1.73 -1.23 -7.90 -16 -20 -42 5.56
0.76Time 91 69 56 90 82 55 102Rating 0.66 0.74 0.91 0.62 0.70 0.88 0.78
9 -18 -43 -4 5 -2 Value -3.20 -1.20 -8.16 -27 -22 -30 4.10
0.73Time 72 63 56 62 75 56 77Rating 0.59 0.71 0.96 0.58 0.69 0.88 0.70
10 18 -43 -4 5 2 Value -2.74 -1.63 -6.74 -21 -22 -29 3.65
0.83Time 78 65 59 68 78 56 73Rating 0.74 0.90 0.89 0.76 0.81 0.87 0.82
11 -18 43 -4 5 2 Value -4.16 -1.61 -7.08 -38 -28 -33 3.66
0.69Time 68 48 58 57 61 50 85Rating 0.51 0.66 0.98 0.47 0.56 0.86 0.83
12 18 43 -4 5 -2 Value -3.37 -1.93 -8.23 -39 -25 -32 3.41
0.67Time 67 51 58 59 64 54 87Rating 0.54 0.62 0.74 0.49 0.58 0.86 0.82
13 -18 -43 4 5 2 Value -2.69 -1.18 -6.71 -21 -21 -26 3.81
0.79Time 79 53 56 69 75 53 71Rating 0.76 0.67 0.93 0.79 0.79 0.85 0.75
14 18 -43 4 5 -2 Value -2.29 -1.24 -8.74 -17 -19 -32 3.95
0.82Time 81 72 58 71 76 53 74Rating 0.84 0.81 0.81 0.82 0.80 0.86 0.79
15 -18 43 4 5 -2 Value -3.48 -1.69 -8.20 -29 -28 -33 3.82
0.70Time 68 54 58 60 69 52 76Rating 0.54 0.69 0.80 0.55 0.64 0.87 0.78
16 18 43 4 5 2 Value -3.04 -1.58 -9.03 -28 -27 -29 3.24
0.73Time 69 55 59 63 70 51 76Rating 0.60 0.73 0.85 0.57 0.65 0.88 0.85
* Abbreviations : Vertical (Ver.), Horizontal(Hor.), Shoulder (Sho.), Thorax (Tho.)
TABLE V. Sensitivity analysis results : significant effect variables using the analysis of variance (ANOVA)
Category Normality (p >0.05)
Effectiveness (p <0.05)
Ver. Hor. Pitch Roll Yaw
Shoulder Impact Force
Peak value 0.89 0.22 0.06 0.24 0.00 0.89Peak time 0.25 0.76 0.10 0.63 0.00 0.90
CORA 0.84 0.97 1.00 0.68 0.79 0.81
Thorax Impact Force
Peak value 0.80 0.67 0.01 0.21 0.05 0.87Peak time 0.09 0.89 0.64 0.93 0.37 0.95
CORA 0.14 0.79 0.21 0.37 0.93 0.70
Pelvis Impact Force
Peak value 0.10 0.52 0.51 0.54 0.32 0.00Peak time 0.01 - - - - -
CORA 0.23 0.60 0.90 0.80 0.38 0.35
T1 Y axis Acc.
Peak value 0.34 0.44 0.03 0.31 0.00 0.94Peak time 0.06 0.80 0.26 0.46 0.00 0.95
CORA 0.62 0.80 0.50 0.88 0.42 0.86
T6 Y axis Acc.
Peak value 0.25 0.78 0.08 0.19 0.04 0.98Peak time 0.79 0.93 0.10 0.53 0.00 0.95
CORA 0.46 0.85 0.27 0.77 0.81 0.89Pelvis Peak value 0.17 0.46 0.11 0.88 0.03 0.04
IRC-13-41 IRCOBI Conference 2013
- 375 -
Y axis Acc.
Peak time 0.46 0.71 0.20 0.79 0.50 0.86CORA 0.01 - - - - -
Chest Compression
Peak value 0.03 - - - - -Peak time 0.01 - - - - -
CORA 0.39 0.11 0.79 0.65 0.88 0.23
Fig. 9. Main Effect Plot using the peak value of variables
IV. DISCUSSION
Evaluating the Biofidelity (Impact forces and Kinematics) using Correlation Analysis
The results showed relatively poor correlation at the shoulder region of subjects. The error might come from
the interaction between the airbag and the shoulder region. Since the shoulder was located almost at the edge
of the airbag, the geometric differences of the subjects highly influences to the response. In other words, the
shoulder of some subjects were exposed to the rigid wall while the others were covered by the airbag during
the test.
The GHBMC human body model showed the best validation results at the thorax region in terms of impact
IRC-13-41 IRCOBI Conference 2013
- 376 -

force by comparing the CORA rating to that of PMHS’s as shown in Table III. Despite good correlation of
test1569 and test 1571 for thorax response to the target PMHS response, chest deflection indicated relatively
poor correlation. This might indicate that the internal biofidelity of the thorax region highly depends on the
material property. The pelvis region of the GHBMC model showed relatively high rating, however, it is still lower
rating than the PMHS’s. The GHBMC model showed the lowest rating at the spinal (T1,T6) region among other
responses. This may be a result of the compliance of the GHBMC model. Based upon the impact force
distribution, which showed good correlation with the test data, this problem may have resulted from the
GHBMC model. This implies that the GHBMC model is not good enough to investigate injury risk in stress‐strain
levels because it could not capture the localized deformation modes seen in the PMHS.
Although the responses were scaled based on the mass ratio and the 50th percentile male PMHS that were
selected for this study, there were still differences in terms of anthropometry. Also, the target PMHS had
scoliosis as shown in Figure 8; the initial spinal points of the reference PMHS were located closer to the wall
buck than the head and pelvis, but the GHBMC had straight spine in its sagittal plane. Another source of the
difference could be modeling error of the GHBMC. For instance, thoracic and lumbar vertebrae of the GHBMC
model were assumed as rigid bodies, and this may have contributed to the stiffer responses of the model.
Furthermore, the types of elements of the disk parts on the lumbar and thoracic region were different, and it is
not clear whether a disk could be modeled by only using shell elements. Lastly, the airbag model was validated
based on a dummy test data [14], but there could be discrepancy between the FE model and the real product.
Effect of Initial position variables on the response (Analysis of Variance)
As shown in Table IV, the initial sitting position variation of roll angle had the most number of significant
effects on the responses. This may have been a result of differences in impact timing of each body region due to
the roll rotation. The total energy from the impact was the same regardless of the angle variation, therefore
increasing impact force at one body region decreased the force at other body regions. For instance, a plus roll
angle decreased the shoulder distance from the wall and increased the load of the shoulder region. The pelvis
impact force decreased due to the increased shoulder impact force.
The mechanism which was applied to the roll angle may have influenced the yaw angle due to the
dependency of pelvis and lower extremity region. Because the pelvis region was coupled with the lower
extremity region, impact timing of each body region made response different and this was reflected the
significant effect of yaw angle on the pelvis responses.
The variation of pitch angle does not affect the responses because it does not change the impact timing of
each body region. The horizontal directional variance affected the peak impact force on the thorax and Y‐axis
acceleration of T1. It might be due to the interaction between the airbag and the thorax. In other words, the
thorax region was first impacted by the airbag and the location of impact was determined by the initial position
of the subject.
It is noted that variables using the CORA rating did not have any significant effect on the responses. Although
the rating method could consider the whole time history of the response including peak value as well as peak
time, however, it may not be a good measure for the sensitivity analysis because the CORA rating cannot
consider signs in measuring differences. It treats responses the same whether they are a certain amount higher
or lower than a target response. Since baseline is at the middle of responses generated by changing design
variables for a sensitivity analysis, it is expected that CORA cannot capture the main effects of those variables
well.
V. CONCLUSIONS
The biofidelity of the 50th percentile male GHBMC model and the sensitivity of the initial positions on its
responses were evaluated under a side impact loading conditions with a side airbag. It can be concluded from
the results that
1. The GHBMC model showed good correlations in pelvis wall load and accelerations with those of PMHS.
2. However, the shoulder area of the GHBMC model is needed to be improved because it showed higher
wall load and T1 acceleration than those of PMHS.
3. It is difficult to evaluate the biofidelity of the thorax area because this body region was not highly engaged during the side impact event.
4. The external biofidelity of the GHBMC in terms of impact force showed better correlations (rating = 0.60)
IRC-13-41 IRCOBI Conference 2013
- 377 -

with those of the PMHS than the internal biofidelity of the GHBMC model (lateral accelerations of
components and chest deflection, rating = 0.47). It implies that the GHBMC model should be further
validated focusing on the internal biofidelity.
5. The results of the sensitivity analysis of the initial position suggest that the initial roll and yaw angles of a surrogate should be controlled carefully during a side impact test.
6. CORA rating might not be a good measure for the sensitivity analysis because it ignores sign in measuring
differences between two responses.
Limitations of this study are the following:
1. Only one loading case was considered in this study and it was not sufficient to evaluate biofidelity and find sources of errors of the GHBMC model.
2. Due to the difficulty to change an initial posture of the GHBMC model, variations in initial posture of the
arms were not considered.
VI. REFERENCES
[1] Crandall JR, Bose D, Forman J, Untaroiu CD, Arregui‐Dalmases C, Shaw, CG, Kerrigan JR, Human surrogates for injury biomechanics research, Clin. Anat., 24(3):362–371, 2011.
[2] Eppinger R, Marcus J, Morgan R, Development of Dummy and Injury Index for NHTSAs Thoracic Side Impact Protection Research Program, SAE Technical Paper, 840885, 1984.
[3] Lizee E, Robin S, Song E, Bertholon N, Coz JYL, Besnault B, and Lavaste F, Development of a 3D finite element model of the human body, Stapp Car Crash J, 42:124–149, 1998.
[4] Behr M, Arnoux PJ, Serre T, Bidal S, Kang HS, Thollon L, Cavallero C, Kayvantash K, Brunet C, A human model for road safety: from geometrical acquisition to model validation with Radioss, Computer Methods in Biomechanics and Biomedical Engineering, 6(4):263‐273, 2003.
[5] Documentation of Total Human Model for Safety (THUMS) AM50 Pedestrian/Occupant Model. Toyota Motor Corporation, 2010.
[6] Robin S, Human Model for Safety—a joint effort towards the development of redefined human‐like car‐occupant models, 17th International Conference for the Enhanced Safety of Vehicles, Amsterdam, 2001.
[7] Iwamoto M, Kisanuki Y, Wantanabe I, Furusu K, Miki K, and Hasegawa J, Development of a finite element model of the Total Human Model for Safety (THUMS) and application to injury reconstruction, International Research Council on the Biomechanics of Injury (IRCOBI), Munich Germany, 2002.
[8] Shaw CG, Crandall JR, Butcher J, Biofidelity Evaluation of the THOR Advanced Frontal Crash Test Dummy, IRCOBI Conference on the Biomechanics of Impact, Montpelier France, 2000.
[9] Shaw CG, Ash J, Lessley D, Sochor M., Carlos AD, Crandall JR. Side Impact PMHS Thoracic Response with Large Volume Airbag, Manuscript submitted for publication
[10] LS‐DYNA Keyword User’s Manual, Version 971, Livermore Software Technology Corporation [11] Schneider LW, Robbins DH, Pflug MA, Snyder RG, Anthropometry of Motor Vehicle Occupants, Vol. 3.
Specifications and Drawings. Report HS‐806 717; UMTRI‐83‐53‐2, UMTRI, 1983. [12] Eppinger RH, On the Development of a Deformation Measurement System and Its Application Toward
Developing Mechanically Based Injury Indices, Proceedings of the 33rd Stapp Car Crash Conference, Warrendale, Pa: Society of Automotive Engineers. 21‐28. SAE 892426., 1989.
[13] David Lessley, Greg Shaw, Daniel Parent, Carlos Arregui‐Dalmases, Matthew Kindig, Patrick Riley, Sergey Purtsezov, Mark Sochor, Thomas Gochenour, JamesBolton, Damien Subit, Jeff Crandall, Whole‐body response to pure lateral impact, Stapp Car Crash Journal, Arizona USA, Vol. 54., 2010.
[14] Park G, Kim T, Ash J, Lessley D, Shaw CG and Crandall J, Evaluation of ES‐2re dummy FE model under side impact sled tests with side airbag condition, Manuscript submitted for publication
[15] Gehre C, Gades H, and Wernicke P, Objective rating of signals using test and simulation responses, 21st International Technical Conference on the Enhanced Safety of Vehicles Conference (ESV), Paper 09‐0407, Germany, 2009.
[16] Society of Automotive Engineers. SAE Surface Vehicle Information Report: Sign Convention for Vehicle Crash Testing – SAE J1733. 1994.
[17] Society of Automotive Engineers, Surface Vehicle Recommended Practice J211‐1 – Instrumentation for Impact Test – Part 1 – Electronic Instrumentation, Warrendale, PA. 2003.
IRC-13-41 IRCOBI Conference 2013
- 378 -

[18] Vavalle NA, Moreno DP, Rhyne AC, Stizel JD, and Gayzik FS, Lateral Impact Validation of a Geometrically Accurate Full Body Finite Element Model for Blunt Injury Prediction, Annals of Biomedical Engineering, 2012.
[19] Beillas P, and Berthet F, Performance of a 50th percentile abdominal model for impact: effect of size and mass, European Society of Biomechanics Conference, 2012.
[20] DeWit JA, and Cronin DS, Cervical spine segment finite element model for traumatic injury prediction, J. Mech. Behav, Biomed. Mater, 10:138–150, 2012.
[21] Fice JB, Cronin DS, and Panzer MB, Cervical spine model to predict capsular ligament response in rear impact, Ann. Biomed. Eng., 39:2152–2162, 2011.
[22] Li Z, Kindig MW, Kerrigan JR, Untaroiu CD, Subit D, Crandall JR, and Kent RW, Rib fractures under anterior‐posterior dynamic loads: experimental and finiteelement study, J. Biomech., 43:228–234, 2010.
[23] Li Z, Kindig MW, Subit D and Kent RW, Influence of mesh density, cortical thickness and material properties on human rib fracture prediction, Med. Eng. Phys., 32, 998–1008, 2010.
[24] Mao H, Zhang L, Jiang B, Genthikatti VV, Jin X, Zhu F, Makwana R, Gill A, Jandir G, Singh A, and Yang KH, Recent advances in developing finite element head model, International Crashworthiness Conference, Milan Italy, 2012.
[25] Shin J, Yue N., and Untaroiu CD, A finite element model of the foot and ankle for automotive impact applications, Ann. Biomed. Eng., 2012.
IRC-13-41 IRCOBI Conference 2013
- 379 -