THE MASON JAR MAVENS: A Collaboration For Mason Jar Enthusiasts
Vol. 5(6), pp. 172-180, June 2013 DOI: 10.5897/JECE2013.0279
ISSN 2141-226X ©2013 Academic Journals
http://www.academicjournals.org/JECE
Journal of Environmental Chemistry and Ecotoxicology
Full Length Research Paper
Comparison of jar tests and microscope slide experiments for flocculation of paint wastewater
I. O. Ntwampe1*, L. L. Jewell1 and D. Glasser2
1School of Chemical and Metallurgical Engineering, University of the Witwatersrand, Private Bag X3, Johannesburg,
2050, RSA, South Africa. 2Centre of Material and Process Synthesis, University of the Witwatersrand, Private Bag X3, Johannesburg, 2050,
RSA, South Africa.
Accepted 20 May, 2013
In jar tests, synthetic wastewater was dosed with FeCl3, Fe2(SO4)3, AlCl3 or Al2(SO4)3 and flocculated. In each case the concentration of the metal ions in the flocculant was 0.043 M. Samples of the mixture were placed under a light microscope that had been fitted with a camera, so that the flocs could be examined. A further experiment was conducted using the same ratio (1:10) of sample to coagulant solutions with gentle mixing on a microscope slide and was also observed under the microscope. Photographs of the samples from both experiments were captured after 1, 30, 60 and 90 min to compare the area covered by the flocs. The area covered by the flocs in the jar test correlates linearly with the area covered by flocs in the microscope slide experiment. An equivalent means of testing can be carried out using microscope observation, which may be preferable to a jar test on the grounds of simplicity and lower cost. Key words: Wastewater, flocculant, mixture, mixing, microscope.
INTRODUCTION The previous experiments investigated flocculation of hard paint wastewater focusing on the physico-chemical treatment dynamics, yet analytical investigation is necessary to advance changing technology. A jar test was identified as an area to be investigated especially after it was observed that the characteristics of fluid flow during mixing does not necessarily have a direct impact on the removal of colloidal particles. A jar test is a laboratory technique used by water treatment plants to determine how a particular effluent should be flocculated, with respect to chemical dosing, mixing rates and retention time. The pH and turbidity are parameters which are measured to keep the quality of the treated water
within the parameters stipulated by the plants’ designers and legislated limits. Hoadley and Dutka (1977) recommended a jar test for determining parameters such as pH, coagulant dosage, and alkalinity and flocculation time. The pH tests measure the acidity or alkalinity of the treated water (because an extreme of either level can cause corrosion or scaling in plant equipment); conductivity tests measure the salinity; and turbidity tests measure the concentration of the colloidal particles.
Turbidity is a critical parameter, because the treated wastewater may be re-used in a process such as a cooling water system, where a high concentration of colloidal particles may damage the plant and equipment.
*Corresponding author. E-mail: [email protected].

Moreover, if the water is not re-used but discarded as effluent, it may affect the ecosystem into which it is released. Thus the removal of turbidity, which relies on the pH of the treated wastewater, is essential. Proper and effective dosages are determined by a high adsorption capacity of coagulants and optimum turbidity removal (O’Melia and Shen, 2001; Goldberg, 2002; Meghzili, 2008; Ghaly et al., 2006; Water Specialist Technology, 2003 and Metcalf and Eddy, 2003).
A pH level in the range of 8-9 has been recommended for the flocculation of paint wastewater (Dey et al., 2004; Aboulhassan et al., 2006). The pH and conductivity, which can be measured and analyzed either on-line or manually in the laboratory, are considered the operating parameters. The quality of feed wastewater also plays a vital role in wastewater treatment (Amuda et al., 2006, Amuda and Amoo, 2007; Gregory and Duan, 2001). The varying quality of feed wastewater in the treatment works can be caused by various plant operating factors such as the concentration of the mineral content, temperature, the coagulants dosed, dosing and mixing rates.
Some treatment works use reservoirs that are situated ‘upstream’ from the wastewater purification plant, to allow the heavy material settle out. This also allows mixing of the feed and attenuates variations in feed composition. However, changes in the feed properties can still occur at any time and require that laboratory tests are carried out frequently in order to adjust the dosages and achieve optimal turbidity removal efficiency.
The use of turbidity measurement as an indicator of the removal of colloidal particles from the solution in jar tests has been reported to be unreliable compared to measurement of the particle size distribution (PSD) or chord length distribution (CLD) (Barrett et al., 2002, McCurdy et al., 2004, Li et al., 2006 and Heath et al., 2002). PSD using light scattering cannot be employed for paint wastewater because the paint is likely to deposit a film on the lenses of the Malvern analyzer which may affect the accuracy of the results. CLD and PSD are complicated techniques and require specialized and expensive equipments. The size and shape of the flocs (spherical or non-spherical) are the most rapid means of testing the efficiency of the dose (Wu and Lee, 2001; Li et al., 2006).
In this study, we have done microscopic slide experiments which enables one to see immediately when the flocs are being formed. The experiments carried out were: (i) A jar test of paint wastewater that had been dosed with conventional inorganic coagulants, namely FeCl3, Fe2(SO4)3, AlCl3 and Al2(SO4)3, and (ii) A microscope slide version of the same test, using the same ratio of wastewater and coagulants as in the jar test. The coagulants were added to a colloidal suspension and mixed (in the case of B, by gentle manual stirring) to disperse them throughout the solution. The sample was observed using a microscope and floc
Ntwampe et al. 173 growth was monitored with time.
The objective of this study is to compare the results obtained from jar tests and microscope slide experiments and check if the latter can replace the former, a jar test which is a conventional technique that uses turbidity measurement, is an indicator of colloidal particles removal. The advantage with using the microscope slide test is its ideal representative determinations, which is done by showing the exact concentration of flocs formed.
MATERIALS AND METHODS
In this study, coagulation-flocculation treatment has been applied to a water-based paint dosed with 0.043 M Fe
3+ in FeCl3, 0.043 M Al
3+
in AlCl3 and 0.043 M Al3+
in Al2(SO4)3, combined 0.043 M Fe3+
in FeCl3 and 0.043 M Ca
2+ in Ca(OH)2 or 0.043 M Mg
2+ in Mg(OH)2,
0.043 M FeCl3–Ca(OH)2 or 0.043 M FeCl3–Mg(OH)2 polymers using a jar test, where the pH and turbidity of the supernatant were measured after 1 h of settling.
Paint wastewater sample
Solid content of paint is carried out by drying 20 g of water-based paint in triplicates in a crucible placed in an oven at 250°C for three h. The average mass obtained was 6.2 g showing that the ratio of solid paint to water is 1:2.22. An 80 g mass of solid paint was weighed in order to prepare 80 g solid/1000 g wastewater as the coagulant dosage required is considered to be proportional to total solids (Faust et al., 1983).
Coagulants
The use of 0.043 M of Fe
3+and Al
3+ ions (a concentration obtained
from the literature) during flocculation of the paint wastewater yielded a wide range of results showing effective flocculation at a solid content of 80 g paint solids in 1000 g of water (Fasemore, 2004). The calculation of the mass of metal salt to obtain 0.043 M of M
3+ (M
3+ = Fe or Al) is as follows:
Monoprotic metal salts (MCl3)
0.043 M of M
3+ x mass of M*Cl36H2O (M*= Fe or Al) (1)
Diprotic metal salts (M2 (SO4)3)
0.043 M of M
3+ x mass of M*2(SO4)318H2O/2(M*= Fe or Al) (2)
The metal salt-metal hydroxide (FeCl3-M(OH)2) polymers were prepared in the following manner:
a) A preparation of 0.043 M FeCl3-Ca(OH)2 polymer was made by dissolving 11.4 g FeCl3.6H2O hexahydrated CP and 3.18 g Ca(OH) to 1 L distilled water with 50 rpm slow mixing for 5 minutes and allowed to react for 6 hours b) A preparation of 0.043 M FeCl3-Mg(OH)2 polymer was made by dissolving 11.4 g FeCl3.6H2O hexahydrated CP and 2.49 g Mg(OH)2 to 1 L distilled water with 50 rpm slow mixing for 5 min and allowed to react for 6 h.

174 J. Environ. Chem. Ecotoxicol.
Table 1. Preparation of standard solutions of Fe3+
and Al3+
salts using distilled water.
Salt Mass of salt (g) Conc. of salt (mol/L) Conc. of M3+
(mol/L)
FeCl3.6H2O 11.4 0.0430 0.043
Fe2(SO4)3.18H2O 15.0 0.0215 0.043
AlCl3.6H2O 10.1 0.0430 0.043
Al2(SO4)3.18H2O 13.6 0.0215 0.043
Experiment A Jar test
Four 200 ml samples of synthetic paint wastewater with a pH of 8.09 were dosed with 20 ml of the FeCl3, Fe2(SO4)3, AlCl3 or Al2(SO4)3 respectively (the concentrations are given in Table 1), placed in the jar test mixing equipment, a BIBBY Stuart Scientific Flocculator (SW1 model), with six adjustable paddles and a rotating speed range of 0 to 250 rpm. Each beaker was stirred at 250 rpm for 60 seconds to disperse the reagents throughout the solution; the mixing speed was then reduced to 100 rpm for 10 m. After this, the jar test was allowed to stand for 90 m to allow for settling. Immediately after the 10 m of mixing at 100 rpm, a 40 ml sample mixture was poured into a 100 ml beaker and the pH and turbidity were measured. Two drops of a sample mixture from the beaker were placed between two microscopic slides held 2 mm apart using spacers, and placed on the stage of a light microscope fitted with a camera. A photograph of the drops of the sample mixture was taken after 1m, using light microscope. Three more similar samples were taken at 30, 60 and 90 minutes respectively where the pH and turbidity were measured and photographs of a few drops of the sample mixture were taken.
The pH meter used was a MetterToledo Seven Multimeter (made in Germany), which contains an electrode filled with silver chloride solution; it was calibrated with pH technical buffer solutions of pH 4 and 7 before being used for the analysis. A Hanna Microprocessor Turbidimeter was used to determine the turbidity of the suspended particles in the supernatant using NTU as a unit of measure. The instrument was calibrated every month using 0.1, 10, 100 and 1000 NTU calibration solutions. The supernatant was poured into a cuvette and inserted into the measuring cell. The cover was closed and the infrared light beam was passed through the cuvette from an emission source with a wavelength of around 890 nm. A sensor was placed at right angles to the direction of the light beam. The sensor detected the amount of light scattered by suspended particles in NTU.
Experiment B
Microscope slide
Microscope slide experiments were conducted (experiment B) by diluting 10 ml of each coagulant solution which was used in experiment A in a 100 ml volumetric flask using distilled water. Then 2 drops of each diluted coagulant and 2 drops of the paint wastewater (which was used in experiment A) to give the same ratio of coagulant to paint wastewater (that is, 1:10) were placed on a microscope slide and mixed manually for about 5 s. Another slide was placed on top and the slides were held 2 mm apart by spacers. Photographs of the samples were taken after 1 minute so that it could be compared with the first sample in experiment A. Further photographs of the drops of the sample mixture were taken 30, 60 and 90 m after mixing the paint wastewater and the coagulant.
A Wiezt Wetzlar light microscope (made in Germany) was used to obtain the images. The microscope slides were placed on the optical stage and turned up and down to focus the image for each slide at 400 times magnification. A digital Moticam 1000, 1.3MP Live Solution Macintosh OSX Compatible microscopy camera (made in China) was used to capture the images. It was connected to both the light microscope and a PC. The visuals were automatically saved as scf.doc file and stored in a folder. The images produced by the light microscope were printed in order to measure the area covered by the flocs in the total area covered by the sample. This was accomplished by placing a 2 mm square-meshed transparency and over the printed copy of the images; dark squares in the grid were counted. The total area covered by the dark flocs was compared to the total area covered by the sample. The photographs of the corresponding samples from experiment A and B were compared to determine the size of the flocs over time.
Sludge drying and characterization
The water from the sludge was drained by placing the whole cake of sludge on filter paper and put in an oven at 250°C for three days. The cake was then ground to a fine powder which was analyzed using X-ray diffraction (XRD), thermal gravimetric analysis (TGA) and scanning electron microscope (SEM). In addition, a dry paint sample was prepared for the XRD analysis in the same way. A XRD (Model Rigaku) diffractometer with CuK radiation at 150 mA and 50 kV was used in this study. Approximately 1 g of a sample was placed in the diffractometer.
For TGA analysis, the dried sludge samples that had been ground to a fine powder were sieved through a 100 mesh sieve. A Stanton thermogravimetric balance (Model HT-M) was used to measure h weight changes as a function of temperature under flowing nitrogen gas (99.9% pure) at a heating rate of 3°C/min to 1000°C. Buoyancy correction was applied in each case. The differential weight loss was recorded as a function of time. The instrument used in this study was a scanning electron microscope SEM (Model JEOL). A few grains of a dry sludge sample were placed on a cylindrical stub and carbon coated to prevent ionization. Performance evaluation The pH between coagulation and flocculation was used as a determinant to assess the rate of hydrolysis and hydrolytic potential of coagulants at different mixing duration.
pH measurement
A MetterToledo Seven Multimeter (made in Germany) pH meter with an electrode filled with silver chloride solution and the outer glass casing with a small membrane covering at the tip was used. The pH meter was calibrated daily before analysis with pH technical
Ntwampe et al. 175
Figure 1. Microscopic observation using 0.043 M Fe
3+ in FeCl3 and
Fe2(SO4)3 dosing. ♦ = flocs-FeCl3, ■ = flocs-Fe2(SO4)3, ∆ = flocs-AlCl3, = flocs-Al2(SO4)3. pHaver-FeCl3 = 4.1, pHaver-Fe2(SO4)3 = 3.3, pHaver-AlCl3 = 4.5, pHaver-Al2(SO4)3 = 4.6. pHaver = average pH of the samples which
were photographed after 1, 30, 60 and 90 min measured after jar tests.
0
4
8
12
16
20
0 0.2 0.4 0.6 0.8 1
Mass of dry sludge (g)/solid paint in a solution (g)
% a
rea c
overe
d b
y f
locs-9
0 m
ins
A
C
D
B
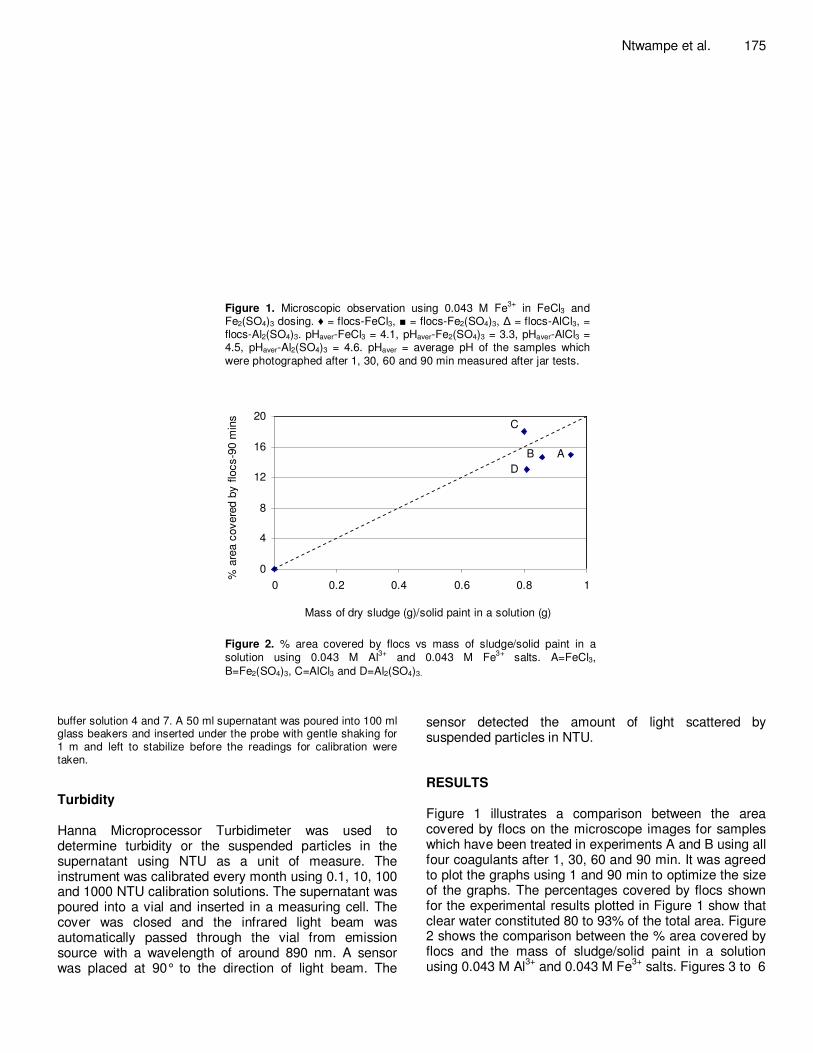
Figure 2. % area covered by flocs vs mass of sludge/solid paint in a solution using 0.043 M Al
3+ and 0.043 M Fe
3+ salts. A=FeCl3,
B=Fe2(SO4)3, C=AlCl3 and D=Al2(SO4)3.
buffer solution 4 and 7. A 50 ml supernatant was poured into 100 ml glass beakers and inserted under the probe with gentle shaking for 1 m and left to stabilize before the readings for calibration were taken.
Turbidity Hanna Microprocessor Turbidimeter was used to determine turbidity or the suspended particles in the supernatant using NTU as a unit of measure. The instrument was calibrated every month using 0.1, 10, 100 and 1000 NTU calibration solutions. The supernatant was poured into a vial and inserted in a measuring cell. The cover was closed and the infrared light beam was automatically passed through the vial from emission source with a wavelength of around 890 nm. A sensor was placed at 90° to the direction of light beam. The
sensor detected the amount of light scattered by suspended particles in NTU. RESULTS Figure 1 illustrates a comparison between the area covered by flocs on the microscope images for samples which have been treated in experiments A and B using all four coagulants after 1, 30, 60 and 90 min. It was agreed to plot the graphs using 1 and 90 min to optimize the size of the graphs. The percentages covered by flocs shown for the experimental results plotted in Figure 1 show that clear water constituted 80 to 93% of the total area. Figure 2 shows the comparison between the % area covered by flocs and the mass of sludge/solid paint in a solution using 0.043 M Al
3+ and 0.043 M Fe
3+ salts. Figures 3 to 6

176 J. Environ. Chem. Ecotoxicol.
A B
C D
Figure 3. Comparison of the microscopic images of the flocs formed during a jar test and microscope slide with 0.043 M ferric sulphate dosage. A=FeCl3-jar test for 1 min, B= FeCl3-jar test for 90
mins, C= FeCl3-slide for 1 min and D= FeCl3-slide for 90 mins.
C D
B A
Figure 4. Comparison of the microscopic images of the flocs
formed during a jar test and microscope slide with 0.043 M ferric chloride dosage. A=FeCl3-jar test for 1 min, B= FeCl3-jar test for 90 mins, C= FeCl3-slide for 1 min and D= FeCl3-slide for 90 mins.
shows representative microscope images of flocs from the jar tests and microscope slide experiments after 1 and 90 m. A further test on characterisation of the dry paint wastewater sludge was carried out using XRD, TGA and SEM analyses as shown by Figures 3.4, 3.5 and 3.6. The SEM images of the sludge for FeCl3 and AlCl3 show similar morphology of the particles. Similarly, the morphology of the samples which have been treated with Fe2 (SO4)3 and Al2 (SO4)3 are alike.
A
D
B
C
Figure 5. Comparison of the microscopic images of the flocs
formed during a jar test and microscope slide with 0.043 M aluminium sulphate dosage. A=FeCl3-jar test for 1 min, B= FeCl3-jar test for 90 mins, C= FeCl3-slide for 1 min and D= FeCl3-slide for 90 mins
A
D C
B
Figure 6. Comparison of the microscopic images of the flocs formed during a jar test and microscope slide with 0.043 M ferric aluminium chloride dosage. A=FeCl3-jar test for 1 min, B= FeCl3-jar test for 90 mins, C= FeCl3-slide for 1 min and D= FeCl3-slide for 90 mins.
DISCUSSION Figure 1 shows a slightly higher colloidal particles in the microscope slide for the samples which were dosed with AlCl3 and Al2 (SO4)3 compared to the corresponding samples dosed with FeCl3 and Fe2(SO4)3. In addition to there being a linear relationship between the two different types of experiments, all the different coagulants lie on the same line. The comparison between the microscope images of jar tests and the microscope slides, experiments A and B, reveals that an important technological advancement is achieved by our substitution of a microscope slide technique for the common jar test. For completeness the average pH for each coagulant has been included in the figure title, that is, 4.1, 3.3, 4.5 and 4.6 for FeCl3, Fe2(SO4)
3, AlCl3 and

Ntwampe et al. 177
Table 2. Comparison between pH, turbidity, mass and moles of M3+
in the sludge , mass and volume of sludge using Fe
3+ and Al
3+ salts dosages in paint wastewater.
Coagulants FeCl3 Fe2(SO4) AlCl3 Al2(SO4)3
pH-before settling 4.19 3.42 4.53 4.61
pH-after 90 mins 3.9 3.21 4.41 4.38
Turbidity (NTU) 100 65 84 76
Calculated mass of M3+
(g) 0.22 0.30 0.20 0.27
Calculated moles of M3+
in sludge 0.016 0.017 0.019 0.017
Sludge volume (ml) 90 106 90 95
Sludge mass (g) 12.9 15.7 15.6 14.8
Al2(SO4)3 respectively. These averages were taken for the samples removed from the jar test beaker after 1, 30, 60 and 90 m. The range of the pH values averaged was between 0.12 and 0.29, which is insignificant. Figure 2 illustrates that the area covered by the flocs and the fraction of solids removed are very similar in all four coagulants. These results indicate that FeCl3 and Fe2(SO4)3 removed 85.0 and 86.1% of the total solids in the wastewater, whereas AlCl3 and Al2(SO4)3 removed 82.0 and 87.7% of the paint solids respectively. According to the area covered by flocs, Al2(SO4)3 yielded better solids removal compared to AlCl3after 90 m, whereas Fe2(SO4)3 yielded almost the same solids removal as FeCl3 after 90 m. Al2(SO4)3 and AlCl3 yielded the same mass of dry sludge whereas FeCl3 yielded less dry sludge than Fe2(SO4)3.
The results shown in Figures 3 and 4 indicate that FeCl3 and Fe2(SO4)3 removed 85.0 and 86.1% of the total solids in the wastewater whereas AlCl3 and Al2(SO4)3 removed 82.0 and 87.7 % of the paint solids respectively. According to the area covered by flocs, Al2(SO4)3 yielded better solids removal compared to AlCl3 after 90 m, whereas Fe2(SO4)3 yielded almost the same solids removal as FeCl3 after 90 m. Al2(SO4)3 and AlCl3 yielded the same mass of dry sludge whereas FeCl3 yielded less dry sludge than Fe2(SO4)3. Figures 3 to 6 show representative microscope images of flocs from the jar tests and microscope slide experiments after 1 and 90 m. The comparisons of the area covered by the flocs after 30 and 60 m between the two tests jar test and microscope slides, do not show significant differences; which also do not differ much from that for 1 and 90 m. The 30 and 60 m are omitted on the basis of those observations to avoid distortion of the graphs. Figures 3 and 5 show that the flocs which are formed in the microscope slide experiment (with FeCl3 and AlCl3) after 1 and 90 m have a dense structure whereas the flocs formed in a jar test are dispersed throughout the image and appear to be scattered. Further, our method which involves the measurement of the percentage area covered by flocs, enabled us to confirm that the flocs in experiments A and B form in the same way. Table 2 shows the properties of the paint wastewater sample and
the sludge. Table 2 shows the pH, turbidity, volume and mass of
sludge, number of moles and mass of Fe3+
and Al3+
in the sludge. The pH of the original wastewater sample was pHi = 8.1. The pH values in Table 2 were 4.19, 3.42, 4.53 and 4.61 before settling for FeCl3, Fe2(SO4)3) AlCl3 and Al2(SO4)3 respectively, whereas the pH values after 1 h of settling were lower in each case, that is, 3.90, 3.21, 4.41 and 4.38 for FeCl3, Fe2(SO4)3, AlCl3 and Al2(SO4)3 respectively. As the cations hydrolyse, the pH drops and rapid precipitation occurs (Lee, 2001; Pratt et al., 2007; Molony, 2005; Baylis,1971; Chang and Yu, 2004). Table 2 shows that the pH of the sample treated with Fe2(SO4)3 is 3.21, which is lower than 3.90, which resulted with FeCl3 whereas the pH values of the samples treated with Al2(SO4)3 and AlCl3 do not differ significantly, that is, 4.38 and 4.41 respectively. The observations show that the amount of acid with Fe2(SO4)3 is higher than with FeCl3, which also shows that the amount of hydrolysis with Al2(SO4)3 and AlCl3 is similar.
Another observation is that Fe3+
salts give lower pH than Al
3+ salts, which is in line with the pKa’s of the
coagulant solutions before addition. Binnie et al. (2003) found that Fe2(SO4)3 was superior to Al2(SO4)3 in colloid removal from wastewater at a low pH, which confirms our results. Table 2 shows that Fe2(SO4)3 and Al2(SO4)3 result in a marginally lower turbidity (from > 1000 NTU to 65 and 76 NTU respectively) than FeCl3 (from > 1000 to 100 NTU) AlCl3 (from a value greater than 1000 to 84 NTU). This indicates that sulphate salts reduce turbidity more than the corresponding chloride salt.The results in Table 3.2 showed that Fe2(SO4)3 and Al2(SO4)3 yielded a higher sludge volume, 106 and 95 ml respectively, than the corresponding metal chlorides (FeCl3 and AlCl3), which is 90 ml in each case. Since more sludge is associated with colloidal particle removal, it can be concluded that diprotic coagulants have higher colloidal particles removal efficiency than their corresponding monoprotic coagulants. This shows that the density of Fe2(SO4)3 and Al2(SO4)3 is 0.143 and 0.168 whereas FeCl3 and AlCl3 is 0.143 and 0.152 respectively. Figure 7 shows the X-ray diffraction (XRD) spectra of the paint sludge from the paint wastewater which has been dosed

178 J. Environ. Chem. Ecotoxicol. Al2(SO4)3
Operations: Import
Paint - File: d2_00697.raw - Type: Locked Coupled - Start: 10.002 ° - End: 89.962 ° - Step: 0.020 ° - Step time: 94.5 s - Temp.: 25 °C (Room) - Time Started: 0 s - 2-Theta: 10.002 ° - Theta: 5.001 ° - Chi: 0.00 ° - Phi: 0.0
Operations: Import
FeCl3 - File: d2_00695.raw - Type: Locked Coupled - Start: 10.002 ° - End: 89.962 ° - Step: 0.020 ° - Step time: 94.5 s - Temp.: 25 °C (Room) - Time Started: 0 s - 2-Theta: 10.002 ° - Theta: 5.001 ° - Chi: 0.00 ° - Phi: 0.0
Operations: Import
FeSO4 - File: d2_00694.raw - Type: Locked Coupled - Start: 10.002 ° - End: 89.962 ° - Step: 0.020 ° - Step time: 94.5 s - Temp.: 25 °C (Room) - Time Started: 0 s - 2-Theta: 10.002 ° - Theta: 5.001 ° - Chi: 0.00 ° - Phi: 0.
Operations: Import
Al2(SO4)3 - File: d2_00696[1].raw - Type: Locked Coupled - Start: 10.002 ° - End: 89.962 ° - Step: 0.020 ° - Step time: 94.5 s - Temp.: 25 °C (Room) - Time Started: 0 s - 2-Theta: 10.002 ° - Theta: 5.001 ° - Chi: 0.00 ° -
Lin
(C
ounts
)
0
1000
2000
3000
4000
5000
6000
7000
8000
9000
10000
11000
12000
2-Theta - Scale
10 20 30 40 50 60 70 80
Figure 7. XRD images of the dry sludge using 0.043 M Al
3+ (Al2(SO4)3) and 0.043 M Fe
3+ salts.
-0.8
-0.7
-0.6
-0.5
-0.4
-0.3
-0.2
-0.1
0
0.1
0
10
0
20
0
30
0
40
0
50
0
60
0
70
0
80
0
90
0
10
00
Mean-temperature (ºC)
Ma
ss c
ha
nge
with
te
mp
era
ture
-dm
/dT
10 per. Mov. Avg. (FeCl3) 10 per. Mov. Avg. (Fe2(SO4)3) 10 per. Mov. Avg. (AlCl3)
10 per. Mov. Avg. (Al2(SO4)3)
Mean-temperature (°C) Figure 8. TGA graph of dry paint sludge dosed with 0.043 M Al
3+ and 0.043 M Fe
3+ salts.
with FeCl3, Fe2(SO4)3 and Al2(SO4)3 in a jar test and the spectrum for the dry paint itself. The purpose of this analysis was to determine the crystal morphologies of different coagulants after treatment using dry sludge. From that data, one can see that the samples are essentially the same as the dried paint sample. The sample which was dosed with AlCl3 was also run on the
XRD but its spectrum has not been plotted because it was almost identical to the curve with FeCl3, Fe2(SO4) and Al2(SO4). The data for AlCl3 with the spectra for FeCl3 and Fe2(SO4) is identical to that in Al2(SO4)3, hence it not included.
In Figure 8 the derivative of mass loss (from the TGA analysis) has been plotted against temperature. The paint
Ntwampe et al. 179
A
B
C D
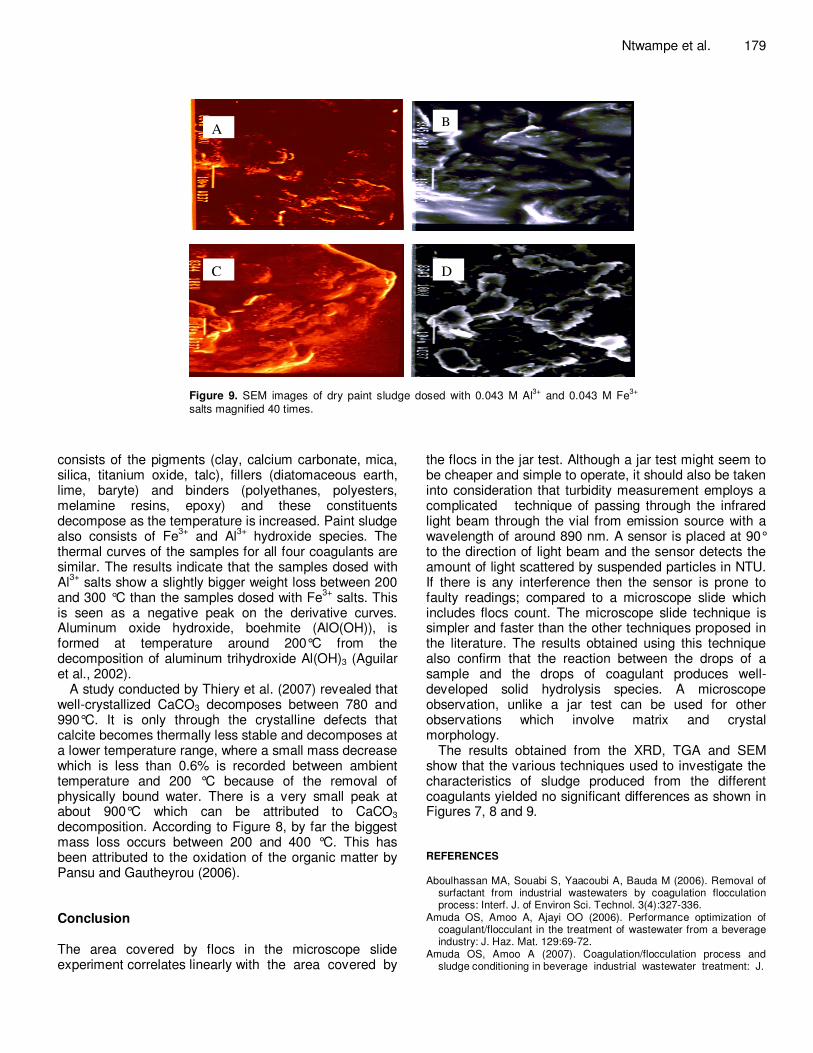
Figure 9. SEM images of dry paint sludge dosed with 0.043 M Al
3+ and 0.043 M Fe
3+
salts magnified 40 times.
consists of the pigments (clay, calcium carbonate, mica, silica, titanium oxide, talc), fillers (diatomaceous earth, lime, baryte) and binders (polyethanes, polyesters, melamine resins, epoxy) and these constituents decompose as the temperature is increased. Paint sludge also consists of Fe
3+ and Al
3+ hydroxide species. The
thermal curves of the samples for all four coagulants are similar. The results indicate that the samples dosed with Al
3+ salts show a slightly bigger weight loss between 200
and 300 °C than the samples dosed with Fe3+
salts. This is seen as a negative peak on the derivative curves. Aluminum oxide hydroxide, boehmite (AlO(OH)), is formed at temperature around 200°C from the decomposition of aluminum trihydroxide Al(OH)3 (Aguilar et al., 2002).
A study conducted by Thiery et al. (2007) revealed that well-crystallized CaCO3 decomposes between 780 and 990°C. It is only through the crystalline defects that calcite becomes thermally less stable and decomposes at a lower temperature range, where a small mass decrease which is less than 0.6% is recorded between ambient temperature and 200 °C because of the removal of physically bound water. There is a very small peak at about 900°C which can be attributed to CaCO3 decomposition. According to Figure 8, by far the biggest mass loss occurs between 200 and 400 °C. This has been attributed to the oxidation of the organic matter by Pansu and Gautheyrou (2006). Conclusion The area covered by flocs in the microscope slide experiment correlates linearly with the area covered by
the flocs in the jar test. Although a jar test might seem to be cheaper and simple to operate, it should also be taken into consideration that turbidity measurement employs a complicated technique of passing through the infrared light beam through the vial from emission source with a wavelength of around 890 nm. A sensor is placed at 90° to the direction of light beam and the sensor detects the amount of light scattered by suspended particles in NTU. If there is any interference then the sensor is prone to faulty readings; compared to a microscope slide which includes flocs count. The microscope slide technique is simpler and faster than the other techniques proposed in the literature. The results obtained using this technique also confirm that the reaction between the drops of a sample and the drops of coagulant produces well-developed solid hydrolysis species. A microscope observation, unlike a jar test can be used for other observations which involve matrix and crystal morphology.
The results obtained from the XRD, TGA and SEM show that the various techniques used to investigate the characteristics of sludge produced from the different coagulants yielded no significant differences as shown in Figures 7, 8 and 9. REFERENCES Aboulhassan MA, Souabi S, Yaacoubi A, Bauda M (2006). Removal of
surfactant from industrial wastewaters by coagulation flocculation process: Interf. J. of Environ Sci. Technol. 3(4):327-336.
Amuda OS, Amoo A, Ajayi OO (2006). Performance optimization of coagulant/flocculant in the treatment of wastewater from a beverage industry: J. Haz. Mat. 129:69-72.
Amuda OS, Amoo A (2007). Coagulation/flocculation process and sludge conditioning in beverage industrial wastewater treatment: J.
180 J. Environ. Chem. Ecotoxicol.
Haz. Mat. 141(13):778-783. Aguilar MI, Saez J, Liorens M, Soler A, Ortuno JF (2002). Nutrient
removal and sludge production in the coagulation–flocculation process: Water Res. 36:2910–2919.
Baylis RJ (1971). Water quality and treatment. McGraw-Hill, New York. Binnie C, Kimber M, Smethurst G (2003). Basic Water Treatment, 3
rd
Ed, MPG Books, Bodmin, Great Britain. pp. 62-65, 74-75. Chang Q, Yu M (2004). An, Application of macromolecular heavy metal
flocculant in wastewater treatment: Chem. 6:42-47. Dey BK, Hashim S, Sen GB (2004). (Microfiltration of water-based paint
effluents, Adv. Environ. Res. 8:455-466. Fasemore O (2004). The flocculation of paint wastewater using
inorganic salts, A dissertation submitted for MSc degree at the University of the Witwatersrand, RSA, pp. 12-13.
Ghaly AE, Snow A, Faber BE (2006). Treatment of grease filter washwater by chemical coagulation: Can. Biosyst. Eng. 48(6):13-6.22.
Goldberg S (2002). Competitive Adsorption of Arsenate and Arsenite on Oxides and Clay Minerals, Soil Sci. Soc. Am. 66:413-421.
Gregory J, Duan J (2001). Hydrolyzing metal salts as coagulants: Pure Appl. Chem. 73(12):2017-2026.
Heath AR, Fawell PD, Bahri PA, Swift JD (2002). Estimating average particle size by focused beam reflectance measurement (FBRM) Part. Part. Syst. Char, 19 (2002), 84-95. Full Text via Cross Ref/ View Record in Scopus/ Cited By in Scopus (52).
Hoadley AW, Dutka BJ (1977). Bacterial Indicators/Health hazards Associated with Water, American Society for Testing and Material, Philadelphia, PA. pp. 80–114.
Lee J (2001) Application of liquid electron theory to the cross effect between ionic and electric charge flow in semiconduct oxide: J. Phys. Chem. Solids, 62:1263-1270.
Li M, Wilkinson D, Patchigolla K (2006). Obtaining Particle Size Distribution from Chord Length Measurements: Water Res. 23(2): 170-174.
McCurdy K, Carlson K, Gregory D (2004). Floc morphology and cyclic shearing recovery: comparison of alum and polyaluminum chloride coagulants: Water Res. 38(2):486-494.
Meghzili B (2008). Tests of Coagulation - Flocculation by Aluminum Sulphate and Polycations Al13 on Raw Waters of the Station of Treatment Skikda (Algeria): European J. Sci. Res. 23(2):268-277.
Metcalf W, Eddy C (2003). Wastewater Engineering. 4th, McGraw-Hill
Inc, New York. pp. 377-380. Molony J (2005). Colour coating and corrosion SA-J for OCCA SA:
SAPMA. Leaf Media. Natal (SA), pp. 13-25.
O'Melia CR, Shen JY (2001). Removal of particles using dual media
filtration: modelling and experimental Studies: Water Sci. Technol., 12: 32-47.
Pansu M, Gautheyrou J (2006). Handbook of soil analysis mineralogical, organic and inorganic methods. Springer, Berlin. P.993
Pratt C, Shilton A, Pratt S, Haverkamp RG, Elmetri I (2007). Effects of redox potential and pH changes on phosphorus retention by smelter slag filters treating wastewater: J. Am. Chem. Soc. pp.1-2.
Thiery M, Villain G, Dangla P, Platret G (2007). Investigation of the carbonation front shape on cementitious materials: effects of the chemical kinetics: Cement Concrete Res. 37:1047-1058
Water Specialist Technology (2003). Jar test procedure for precipitants, coagulants and flocculants: Florida, USA.
Wu RM, Lee DJ (2001). Hydrodynamic drag on non-spherical floc and free-settling test: Water Res. 35(13):3226-3234