A comparison between yellow-green and green cultivars of ...

Comparison of Energy Consumption and Green-House-Gas emissions of different mobility scenarios with Optiresource®
The “Well-to-Wheel” Optimizer used at Daimler
Dr. J. Wind, P. FroeschleElectrical Vehicle Symposium 23, Anaheim, December 3, 2007

Caption of presentation / Department / Date (year-month-day) 2
Stern review, Oct. 2006
Al Gore:An inconvenient truth
UNO Climate report, Feb. 2007
Failed ACEA Self Commitment
?ACEA actual
165
140
120
ACEA commitment
1996 2000 2004 2008 2012
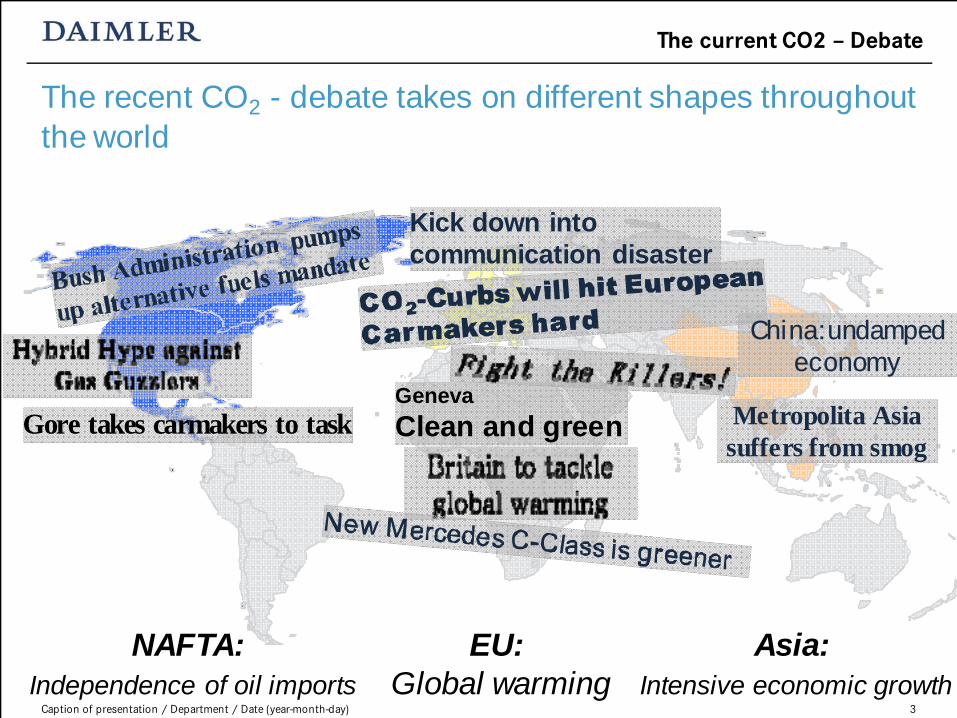
What are the reasons for the current debate?
The current CO2 – Debate
Caption of presentation / Department / Date (year-month-day) 3
Gore takes carmakers to taskGenevaClean and green
NAFTA:Independence of oil imports
EU:Global warming
Asia:Intensive economic growth
Kick down intocommunication disaster
China: undamped economy
Metropolita Asia suffers from smog
The recent CO2 - debate takes on different shapes throughout the world
The current CO2 – Debate

Caption of presentation / Department / Date (year-month-day) 4
Optiresource is a tool for quick and reliable decisionsDifferent Optiresource versions for different target groups
Expert version
Web/Exhibition version

Caption of presentation / Department / Date (year-month-day) 5
The Web version is designed for easy use by non-experts
www.daimler.com/go/optiresourceorwww.optiresource.org

Caption of presentation / Department / Date (year-month-day) 6
The expert version has a wide variety of funcionalities
The user can
• compare different energy chains in terms of energy consumption, GHG emissions etc.
• detect the chains allowing for the optimization of the consumptions and emissions.
• identify the impact of different energy scenarios.
Different modes
• “Query mode”: the user selects the chains according to certain criteria, the results are visualized (almost 1000 chains available)
• “Scenario Mode”: the user defines scenarios in terms of energy supply and energy demand and then visualizes and compares them

Caption of presentation / Department / Date (year-month-day) 7
Optiresource Query Mode
Query mode

Caption of presentation / Department / Date (year-month-day) 8
Example for WTW results in the Query Mode
Query mode
H2 from wind, pipeline, comp., FCV
H2 from NG, pipeline, CCS, comp., FCV
H2 from NG, pipe CCS, comp., ICE
H2 from wind, pipeline, comp., ICE
Gasoline, ship, refinery, ICE
Scenario Title Energy Consumption - Absolute GHG Emissions - Absolute
Ieg/100km

Caption of presentation / Department / Date (year-month-day) 9
Example for WTW results in the Query Mode
Query mode
H2 from wind, pipeline, comp., FCV
H2 from NG, pipeline, CCS, comp., FCV
H2 from NG, pipe CCS, comp., ICE
H2 from wind, pipeline, comp., ICE
Gasoline, ship, refinery, ICE
Scenario Title Energy Consumption - Absolute GHG Emissions - Absolute
MJ/100km

Caption of presentation / Department / Date (year-month-day) 10
• By far the lowest GHG emissions and very low energy consumption are achieved by a Fuel Cell vehicle powered by H2 from wind energy.
• Hydrogen from NG shows even lower energy consumption but clearly higher GHG emissions than H2 from wind. However GHG emissions of this pathway are already lower than those from conventional ICEs.
• An H2 ICE powered by hydrogen from NG is the worst of all shown both in terms of energy consumption and GHG emissions.
Both in terms of energy consumption and GHG emissions, the Fuel Cell vehicleis the best of all alternatives shown
The Optiresource findings for the example query are clearly in favor or renewable hydrogen as a fuel
Query mode

Caption of presentation / Department / Date (year-month-day) 11
Scenario mode
The Scenario mode lets one compare different scenarios in terms of energy consumption and GHG emissions

Caption of presentation / Department / Date (year-month-day) 12
Very good agreement between Optiresource data and real values
Scenario mode
Total energy consumption for passenger cars tank-to-wheel
(TTW) (MJ)
Energy consumption per
100 km TTW (MJ/100km)
Total GHG emissions from passenger cars
TTW (tons)
GHG emissions per km TTW (gCO2eg/km)
Data for German passenger cars in 2005 1.48 x 10¹² 255 110 x 106 189
Results from Optiresource® for simplified scenario for Germany
20051.22 x 1012 210 92 x 106 158
Optiresource figures are slightly lower that real values because
• 2002 compact class reference vehicle was used while actual car fleet is older with higher fuel consumption and GHG emissions.
• Compact class reference vehicle does not represent the variety within car fleet.• Real driving patterns differ from NEDC.

Caption of presentation / Department / Date (year-month-day) 13
Definition of example scenarios
Scenario mode
Driv e Train Fuel
Szenarios(Share of driv e trains)
Base scenario 20% Hybrid Electric Vehicles
20% Biodiesel Vehicles
20% Fuel Cell Vehicles, Wind
20% Battery Electric Vehicles,
Wind
Otto engine(Port injection)
Gasoline from crude oil 77% 67% 67% 67% 67%
Diesel engine (Direct Injection with
particle filter)
Diesel from crude oil 23% 13% 13% 13% 13%
Diesel engine(Direct Injection with
particle filter)
Biodiesel from rapeseed - - 20% - -
Parallel Hybrid with Otto engine
Gasoline from crude oil - 10% - - -
Parallel hybrid with Diesel engine
Diesel from crude oil - 10% - - -
Hybridized Fuel Cell Driv e Train
Hydrogen from Wind energy (by
electrolysis)
- - - 20% -
Li-Ion Battery and Electric Motor
Electricity from Wind
energy- - - - 20%
Caption of presentation / Department / Date (year-month-day) 14
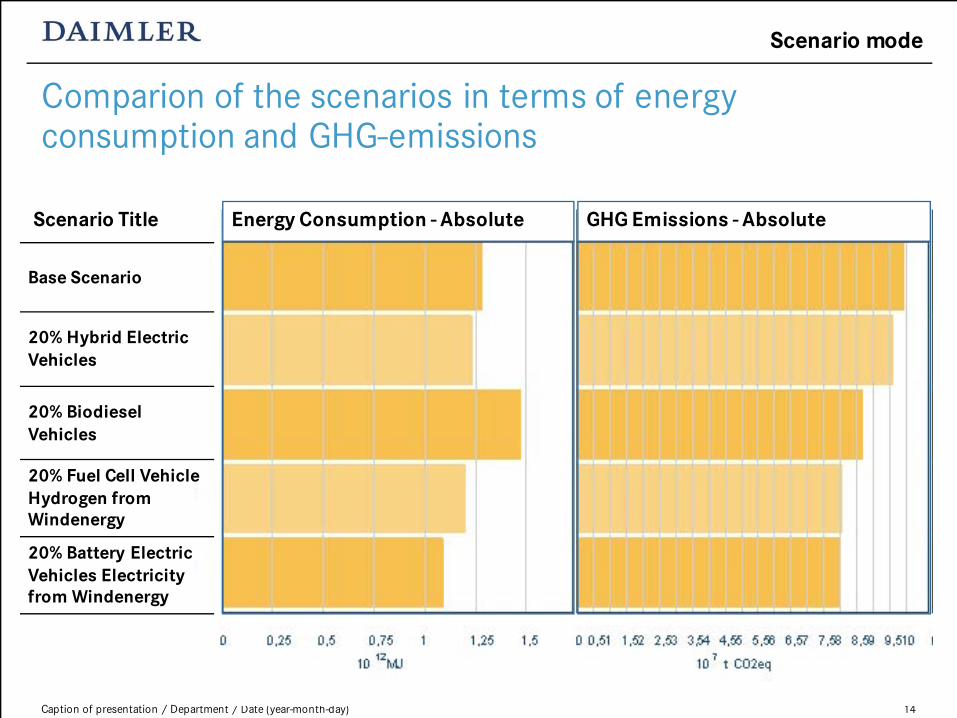
Comparion of the scenarios in terms of energy consumption and GHG-emissions
Scenario mode
Base Scenario
20% Hybrid Electric Vehicles
20% Biodiesel Vehicles
20% Fuel Cell Vehicle Hydrogen from Windenergy
20% Battery Electric Vehicles Electricity from Windenergy
Energy Consumption - Absolute GHG Emissions - AbsoluteScenario Title

Caption of presentation / Department / Date (year-month-day) 15
• In terms of GHG emissions every alternative scenario is better than the reference scenario
• However, only the introduction of Fuel Cell vehicles or battery electric vehicles lead to a significant reduction of GHG emissions as well as energy use
• BEV show a very similar effect on GHG emissions as FCV with even lower energy consumption
Due to still significant difficulties of battery electric vehicles, Fuel Cell vehicles are the only mid term alternative for sustainable mobility
The Optiresource analysis of the example scenarios shows FCV to be the only real alternative for the future
Scenario mode

Caption of presentation / Department / Date (year-month-day) 16
Thank you!