Comparison of Cardiovascular Risk Factors in Five Regions of Thailand: InterASIA Data
10
J Med Assoc Thai Vol. 93 No. 1 2010 17 Comparison of Cardiovascular Risk Factors in Five Regions of Thailand: InterASIA Data Virasakdi Chongsuvivatwong MD, PhD*, Tada Yipintsoi MB, PhD**, Paibul Suriyawongpaisal MD***, Sayan Cheepudomwit MD***, Wichai Aekplakorn MD, PhD***, Pinij Faramnuayphol MD, PhD****, Pyatat Tatsanavivat MD*****, Vongsvat Kosulwat PhD******, Somsak Thamthitiwat MD*******, Chalermsri Nuntawan MSc*** * Epidemiology Unit, Faculty of Medicine, Prince of Songkla University, Hat yai, Songkhla, Thailand ** Faculty of Medicine, Prince of Songkla University, Hat yai, Songkhla, Thailand *** Faculty of Medicine, Ramathibodi Hospital, Mahidol University, Bangkok, Thailand **** Health Information System Development Office, Health Systems Research Institute, Nonthaburi, Thailand ***** Faculty of Medicine, Khon Kaen University, Khon Kaen, Thailand ****** Institute of Nutrition, Mahidol University, Phutthamonthon, Salaya, Nakhon Pathom, Thailand ******* International Emerging Infections Program, Thailand MOPH-US CDC Collaboration, Ministry of Public Health, Nonthaburi, Thailand Background: Age- and sex- standardized mortality rate of cardiovascular disease (CVD) was high in Bangkok and central Thailand in the year 2000. This may partially be related to differences in risk factors. Objective: To compare prevalence of CVD risk factors among regions in Thailand in the same period. Material and Method: From a survey in 2000 (InterASIA) which involved 5 regions in Thailand, conventional CVD risk factors were compared multivariate-wise among regions and subsequently aligned with CVD deaths obtained within similar regions from the registry. Results: Bangkok and a central province had a higher prevalence of the following: hypertension, elevated body mass index, large waist circumference, elevated lipid associated with low density lipoprotein cholesterol and diabetes mellitus. The Northeast had a higher prevalence of smoking, low values of high density lipoprotein cholesterol and high triglyceride. Conclusion: Definite regional differences existed of CVD risks and death in Thailand in 2000. Some of the metabolic risk factors may be more important than smoking in the link with CVD death in Thailand. Keywords: Standardized mortality rate, Cardiovascular disease, Ischemic heart disease, Stroke Correspondence to: Chongsuvivatwong V, Epidemiology Unit, Faculty of Medicine, Prince of Songkla University, Hat Yai, Songkhla 90110, Thailand. Phone: 074-429-754, Fax: 074- 429-754. E-mail: [email protected] Cardiovascular disease (CVD) results from atheromatous process involving large and medium arteries, but in most reports, these diseases are often limited essentially to blood vessels of the brain (stroke) and the heart (myocardial infarct or ischemic heart disease). CVD is and will be a major burden in most countries whether developed or developing. Preventing or delaying atheroma aims to reduce the burden of CVD. However, the burden of CVD has to be looked at in terms of death and/or incidence and each with its conglomeration of risk factors. In developed countries, such as the United Kingdom and the United States of America, death from ischemic heart disease (IHD) showed a marked decrease, deemed to be due mainly to primary prevention (reduc- tion of smoking, of high blood pressure and abnormal lipids) rather than as a result of secondary prevention (1,2) . In Asia, it was estimated that the burden for CVD will be increasing (3) despite the lower incidence of coronary heart disease (4) , and the marked reduction of J Med Assoc Thai 2010; 93 (1): 17-26 Full text. e-Journal: http://www.mat.or.th/journal
-
Upload
suwan-samrit -
Category
Documents
-
view
212 -
download
0
description
Age- and sex- standardized mortality rate of cardiovascular disease (CVD) was high in Bangkok and central Thailand in the year 2000. This may partially be related to differences in risk factors. Objective: To compare prevalence of CVD risk factors among regions in Thailand in the same period. Material and Method: From a survey in 2000 (InterASIA) which involved 5 regions in Thailand, conventional CVD risk factors were compared multivariate-wise among regions and subsequently aligned with CVD deaths obtained within similar regions from the registry. Results: Bangkok and a central province had a higher prevalence of the following: hypertension, elevated body mass index, large waist circumference, elevated lipid associated with low density lipoprotein cholesterol and diabetes mellitus. The Northeast had a higher prevalence of smoking, low values of high density lipoprotein cholesterol and high triglyceride.
Transcript of Comparison of Cardiovascular Risk Factors in Five Regions of Thailand: InterASIA Data

J Med Assoc Thai Vol. 93 No. 1 2010 17
Comparison of Cardiovascular Risk Factors inFive Regions of Thailand: InterASIA Data
Virasakdi Chongsuvivatwong MD, PhD*, Tada Yipintsoi MB, PhD**,Paibul Suriyawongpaisal MD***, Sayan Cheepudomwit MD***,
Wichai Aekplakorn MD, PhD***, Pinij Faramnuayphol MD, PhD****,Pyatat Tatsanavivat MD*****, Vongsvat Kosulwat PhD******,
Somsak Thamthitiwat MD*******, Chalermsri Nuntawan MSc***
* Epidemiology Unit, Faculty of Medicine, Prince of Songkla University, Hat yai, Songkhla, Thailand** Faculty of Medicine, Prince of Songkla University, Hat yai, Songkhla, Thailand
*** Faculty of Medicine, Ramathibodi Hospital, Mahidol University, Bangkok, Thailand**** Health Information System Development Office, Health Systems Research Institute, Nonthaburi, Thailand
***** Faculty of Medicine, Khon Kaen University, Khon Kaen, Thailand****** Institute of Nutrition, Mahidol University, Phutthamonthon, Salaya, Nakhon Pathom, Thailand
******* International Emerging Infections Program, Thailand MOPH-US CDC Collaboration,Ministry of Public Health, Nonthaburi, Thailand
Background: Age- and sex- standardized mortality rate of cardiovascular disease (CVD) was high in Bangkokand central Thailand in the year 2000. This may partially be related to differences in risk factors.Objective: To compare prevalence of CVD risk factors among regions in Thailand in the same period.Material and Method: From a survey in 2000 (InterASIA) which involved 5 regions in Thailand, conventionalCVD risk factors were compared multivariate-wise among regions and subsequently aligned with CVD deathsobtained within similar regions from the registry.Results: Bangkok and a central province had a higher prevalence of the following: hypertension, elevatedbody mass index, large waist circumference, elevated lipid associated with low density lipoprotein cholesteroland diabetes mellitus. The Northeast had a higher prevalence of smoking, low values of high density lipoproteincholesterol and high triglyceride.Conclusion: Definite regional differences existed of CVD risks and death in Thailand in 2000. Some of themetabolic risk factors may be more important than smoking in the link with CVD death in Thailand.
Keywords: Standardized mortality rate, Cardiovascular disease, Ischemic heart disease, Stroke
Correspondence to: Chongsuvivatwong V, Epidemiology Unit,Faculty of Medicine, Prince of Songkla University, Hat Yai,Songkhla 90110, Thailand. Phone: 074-429-754, Fax: 074-429-754. E-mail: [email protected]
Cardiovascular disease (CVD) results fromatheromatous process involving large and mediumarteries, but in most reports, these diseases are oftenlimited essentially to blood vessels of the brain (stroke)and the heart (myocardial infarct or ischemic heartdisease). CVD is and will be a major burden in mostcountries whether developed or developing. Preventingor delaying atheroma aims to reduce the burden of
CVD. However, the burden of CVD has to be looked atin terms of death and/or incidence and each with itsconglomeration of risk factors.
In developed countries, such as the UnitedKingdom and the United States of America, death fromischemic heart disease (IHD) showed a marked decrease,deemed to be due mainly to primary prevention (reduc-tion of smoking, of high blood pressure and abnormallipids) rather than as a result of secondary prevention(1,2).In Asia, it was estimated that the burden for CVDwill be increasing(3) despite the lower incidence ofcoronary heart disease(4), and the marked reduction of
J Med Assoc Thai 2010; 93 (1): 17-26Full text. e-Journal: http://www.mat.or.th/journal

18 J Med Assoc Thai Vol. 93 No. 1 2010
stroke especially in Japan(5-7). In Japan, the change inincidence of ischemic heart disease (IHD) or myocardialinfarction (MI) did not appear consistent in that reportsincluded a rise(5), a no change(7), or a decrease(8). InTaiwan, there was a decrease in incidence but anincrease in hospitalization(9). These inconsistentchanges in IHD and persistent decrease in strokeoccurred while obesity and cholesterol increased,cigarette smoking decreased and hypertension wasbetter controlled(5-9). Urbanisation probably plays alarge part. The rate of decrease of death from IHDwas shown to be much less in cities such as Tokyoand Osaka when compared to the rest of Japan(8).For similar average age, the concentration of totalcholesterol varied among the cities in China(4). Theprevalence of hypertension in China depended onurbanization as well as education and body mass index(BMI)(10). The death for ischemic heart and CVD amongthe different States in the USA can vary by as much as2 times(11). The INTERHEART evaluated risks relatedto first acute MI in 52 countries. They reported thatAsians showed lower lipid levels when compared tonon-Asians but regions in Asia (e.g. China, Japan.south vs. southeast Asia) showed different prevalenceof lipids which were risks for acute MI(12). Thesereports strongly suggest the importance of examiningvariations in risks as functions of geographicaldistribution.
In Thailand, Faramnuayphol et al(13) hadshown marked differences in standardized mortalityrate (SMR) for CVD deaths among regions in Thailand.Table 1 was extracted from that report and showsage- and sex- SMR for IHD and stroke in the year 2000.
Deaths, from both components of CVD were mostcommon among the residents of Bangkok and wereapproximately 3 times those of the upper northeasternregion where the rates were the lowest. The correlationin geography of IHD and stroke (Spearman rankcorrelation coefficient of 0.72) suggested a commonset of risk factors.
InterASIA study is an international collabo-rative survey of CVD risk factors in China andThailand. In Thailand, the study was stratified intofive regions of more or less equal sample size. Theoverall prevalence of these risk factors(14) and thebreakdown of the prevalence by ethnicity and genderin Southern Thailand(15) had been reported. However,cross-regional comparisons which may help explainingmortality pattern for CVD have never been documented.
The objective of the present report was tocompare the prevalence of the above CVD risk factorsacross the five regions of Thailand based on theInterASIA data.
Material and MethodThe detailed methodology and the overall
results have been previously reported(16). In brief,5 regions were selected consisting of Bangkok (BKK)and 4 provinces; Chiang Mai representing the north(N), Khon Kaen representing the northeast (NE),SuphanBuri for the central (C), and Songkhla for thesouth (S). The list of all communities of the selectedprovinces was obtained from the development officeof the particular province. One well-developed and oneless-developed areas were randomly chosen from bothrural and urban communities in each study province.In each selected community, the list of the householdsand the residents was obtained from National StatisticalOffice. This was used as the sampling frame for thestudy subjects.
All residents who were 35 years old or overwere invited to join the present study. The presentstudy protocol was approved by the ethics committeeof each institution. The aim for the sample size per eachregion was 1,000 subjects with uniform age and sexdistribution. Such sample size would give a width ofthe 95% confidence limit being 6% if the prevalenceis 50%. It has a power of 80% to detect significantdifference between the prevalence of risk factor being30% in one region and 36% in another.
After an overnight fasting, the subjectswere interviewed and had their venous blood takenat the temporary data collection center in the studycommunity. Anthropometric measurements (weight,
Region IHD Stroke
Bangkok 167 158Central 122 146Western 118 114Eastern 120 138Upper southern 95 68Lower southern 94 60Upper northern 123 107Lower northern 92 118Upper northeastern 60 51Lower northeastern 63 78
Table 1. Age and sex standardized mortality rates per100,000 for ischemic heart disease (IHD) and forstroke for various regions of Thailand from thedeath registry in 2000

J Med Assoc Thai Vol. 93 No. 1 2010 19
height, waist and hip circumferences) were obtained.Waist was defined as 2.5 cm above the navel andits circumference was measured with a tape at end-expiration of a normal breathing. Hip circumferenceutilized the maximum prominence at the gluteallevel. Field wxorkers in all the involved regions weresimultaneously trained. Right arm blood pressureusing Hg manometer was taken three times after atleast 5 minutes of quiet sitting.
Definition for risksA smoker was defined as a person currently
smoking or had ever smoked 100 or more cigaretteswithin his/her life-time. Those considered drinkingmust have consumed alcohol on > 12 occasions inthe past 12 months. The blood pressure (BP) in thisreport was the average of the second and the thirdmeasurements. The followings described the cut-offvalues for risks(15). Hypertension (HT) was defined assystolic BP > 140 mmHg or diastolic BP > of 90 mmHgor on medication. Body mass index (BMI) was calculatedfrom body weight in kilograms divided by the squareof the height in metres. The BMI risks, in kg/m2, werepartitioned into 25.0-29.9 (overweight) and 30 or above(obese). Abdominal obesity utilized waist circumference(WC) in cm of > 90 for men and > 80 for women andwaist-hip ratio (WHR) of > 0.90 for men and > 0.85 forwomen. Levels of fasting plasma glucose (FPG) in mg/dlwere separated into impaired fasting glucose (IFG,which is FPG of 110-125 mg/dl) and diabetes mellitus(DM, which is FPG > 126 mg/dl) or on medication. Totalcholesterol level (TC, in mg/dl) had two cut off values,> 200 and > 240. Elevated triglyceride (TG, mg/dl) wasset at > 200. Risk values for high density lipoprotein-cholesterol (HDL-C, mg/dl) were set at < 35 for men and< 40 for women. High TC/HDL-C ratio was set at > 5.Low density lipoprotein cholesterol (LDL-C) wascalculated as TC minus TG/5 minus HDL-C using theFriedewald’s transformation and only where TG < 400mg/dl. The cut off value for high LDL-C was > 160 mg/dl. Non-HDL-cholesterol (nonHDL-C, in mg/dl) wascalculated from TC minus HDL-C among those with TG< 400 mg/dl. (There were 3.2% with TG > 400 mg%).High nonHDL-C was set at > 190 mg/dl, which wasobtained from the average of the 5 regions plus 1standard deviation. Other risk factors such as dietand exercise were not included.
Data analysisDemographic variables are displayed by
region. Central tendency and dispersion of variables
that are continuous were summarized without testingfor statistical significance. Logistic regression modelwas used to predict the region-specific prevalence ofvarious binary risk factors with adjustment for rural/urban and age effects. This was done separately formen and for women. The region- and sex-specificprevalences and their 95% confidence interval (CI)were adjusted for age and urban/rural residenceunder generalized linear modeling. Statistical tests forsignificant difference of the factors across region werefirst done under likelihood ratio test. When this wassignificant, a further test between each pair of regionswas carried out with Bonferroni adjustment ofp-value(17) setting a significant level of < 0.01 instead of< 0.05 to reduce type I error from multiple comparisonsusing the same model. Regions where the prevalenceare not significantly different from one another aremarked with the same superscript alphabet for the sakeof easy grouping. To further facilitate comparison ofthese data, bar chart of the adjusted prevalence of riskfactors by sex and region were displayed in shades ofgray where black represented the highest prevalenceand white, the lowest. All analyses were carried outwith the statistical software R(18) and the Epicalpackage(19).
ResultsTable 2 shows distribution of demographic
variables among the five regions. Most regions showedover-representation of women. Subjects from Bangkokwere predominantly women, more educated, had ahigher income and were more likely to be nevermarried, divorced and unemployed.
Table 3 shows means and standard deviationsof various variables for men and women in eachregion. A pattern can be seen in both men and women.Bangkok and the central region tended towards higheraverage for blood pressure, obesity indices, glucoseand lipids, except for TG. Northeast subjects showedlower average HDL-C but higher TG.
Tables 4.1, 4.2 and Fig. 1, 2 show the adjustedprevalence of relatively high risk subjects which nowalso include smoking and drinking. Essentially, thisreflects what is seen with the general distribution inthat Bangkok and a central province, had 2-3 timesthe prevalence of the 2 provinces in the north andnortheast with regard to hypertension, indices ofobesity, and elevated LDL-C associated lipids. Southand NE had low prevalence of DM, although the southhad the highest prevalence of IFG. The Northeastshowed 2-2.5 times the prevalence of low HDL-C and

20 J Med Assoc Thai Vol. 93 No. 1 2010
high TG for both men and women. The Northeast alsoshowed a very high proportion of men smokers, whilethe south had the lowest prevalence of drinking.
DiscussionThe present report showed 1.5 to 3 times
differences in prevalence among regions with highCVD risks such as in Bangkok and SuphanBuriwhen compared to provinces with lower CVD riskssuch as those in the northeast and north. The risksfor Bangkok appeared to be related to affluences suchas less labourers, more with education and higherincome. Such affluences perhaps resulted in a higherprevalence of hypertension, elevated BMI, largerwaist and waist-hip ratio, diabetes mellitus and LDLassociated lipids. The northeast showed a much lowerprevalence of many CVD risks except smoking, high
triglyceride and low HDL-C. While over one-fifth ofthe southerners had IFG, this should be less serious asCVD survival among IFG was shown to be close to thatof people with normal fasting plasma glucose(20). Therelatively low prevalence of alcohol in the south islikely contributed by subjects who are Muslims.
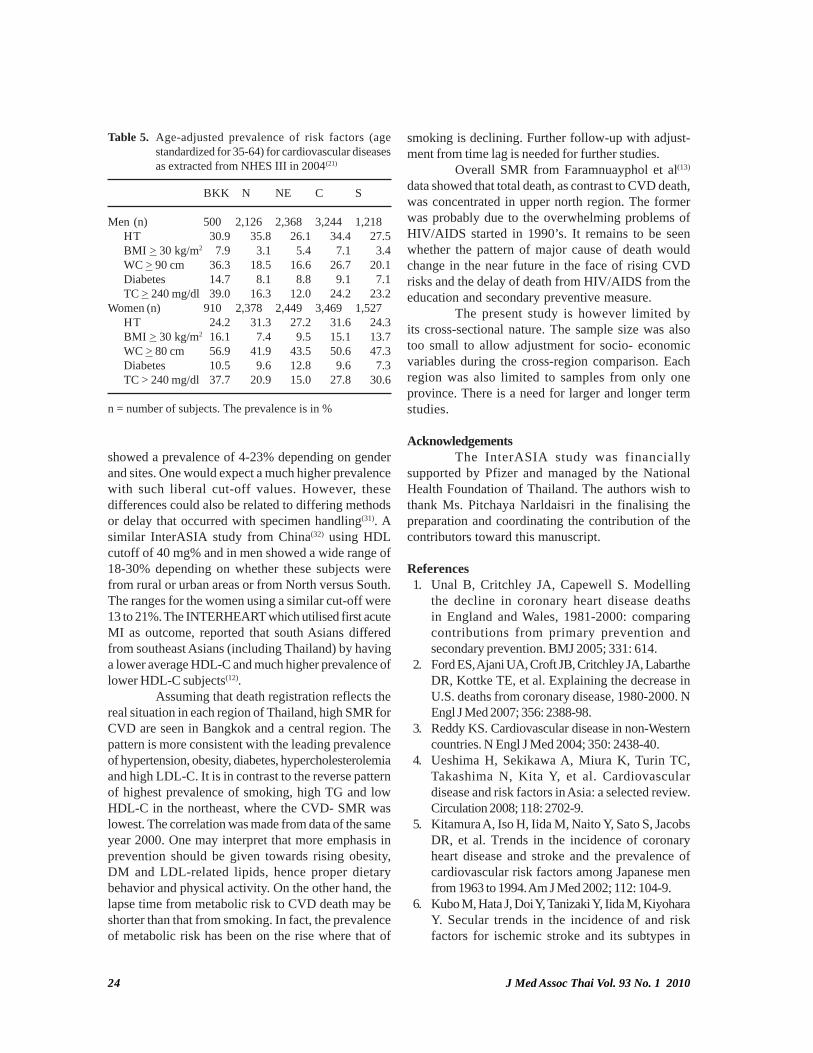
Table 5 presents the data from the NationalHealth Examination Survey III (NHES-III) in 2004 formen and women aged 35-64 years old(21). The riskswere specifically chosen to allow comparison ofprovinces to the present InterASIA report. HDL-C wasnot measured. For the men, a similar pattern is seenwith the present report in that Bangkok and a centralprovince showed a higher prevalence of hypertension,obesity, greater waist circumference, DM and hightotal cholesterol, although the proportional differenceswere not as marked. The prevalence of DM was lowest
Region* BKK N NE C S
n 1,000 1,029 1,280 1,036 1,005% women 73.3 63.6 54.7 50.6 62.7Age, mean 52.7 52.0 54.2 55.2 52.9
[SD] [11.4] [12.1] [11.4] [11.6] [11.8]Marital status
Married/cohabiting 64.0 69.5 76.3 73.3 78.4Widow 14.4 17.3 17.9 13.9 12.0Divorced/separated 9.9 7.3 3.5 4.3 6.2Never married 11.7 5.9 2.3 8.5 3.4
EmploymentEmployed 55.2 70.5 68.9 75.4 69.8Retired 5.8 1.7 4.2 22.9 5.9Not employed 39.0 27.9 26.9 1.7 24.4
OccupationManagement 0.7 0.3 0.0 1.1 0.4Professional 6.5 8.5 0.9 6.9 3.0Business owner 2.7 4.5 0.6 10.9 3.5Worker 17.1 38.2 15.2 18.6 15.3Farmer 1.9 22.0 38.5 40.3 38.6Self-employed 10.3 22.8 18.5 20.6 14.8Other 60.7 3.8 26.2 1.6 24.3
Household income x 1,000 Baht per yearMedian 108.0 60.0 43.4 72.0 50.0[IQR] [60.0-200.0] [36.0-120.0] [24.0-81.1] [34.3-145.2] [36.0-96.0]
Education achievedElementary or below 63.3 82.1 93.2 83.2 85.1Above elementary 36.7 17.9 6.8 16.8 14.9
Table 2. Distribution of demographic variables among the five regions
* BKK = Bangkok, N = north, NE = northeast, C = central, S = south, n = number of subjects. All values are in percentagesexcept those for age which is expressed as mean and standard deviation [SD] while household income is expressed as medianand interquartile range [IQR]

J Med Assoc Thai Vol. 93 No. 1 2010 21
SBP,
DB
P in
mm
Hg
= sy
stol
ic a
nd d
iast
olic
blo
od p
ress
ure;
BM
I in
kg/m
2 = b
ody
mas
s ind
ex; W
C in
cm
= w
aist
circ
umfe
renc
e; W
HR
, uni
tless
= w
aist
hip
ratio
; FPG
inm
g/dl
= fa
sting
pla
sma g
luco
se; T
C, H
DL-
C, T
G an
d LD
L-C
all i
n m
g/dl
= to
tal s
erum
chol
este
rol,
high
den
sity
lipop
rote
in ch
oles
tero
l, tr
igly
cerid
e and
calc
ulat
ed lo
w d
ensit
ylip
opro
tein
cho
lest
erol
(exc
lude
d su
bjec
ts w
ith T
G >
400
mg/
dl);
TC/H
DL
is u
nitle
ss =
tot
al c
hole
ster
ol d
ivid
e by
hig
h de
nsity
lipo
prot
ein
chol
este
rol;
non
HD
L-C
inm
g/dl
= n
on H
DL
chol
este
rol (
excl
uded
thos
e w
ith T
G >
400
mg/
dl).
Valu
es a
re m
ean
and
[SD
], ex
cept
TG
whi
ch is
exp
ress
ed a
s med
ian
and
[IQ
R]
Men
W
omen
Bot
h se
xes
BK
K
N
NE
C
S
BK
K
N
NE
C
S
BK
K
N
NE
C
S
SBP
128.
212
1.8
116.
912
7.7
125.
412
3.6
118.
611
8.0
124.
412
2.0
124.
811
9.7
117.
512
6.1
123.
3[2
0.3]
[19.
0][1
6.8]
[21.
7][1
9.6]
[21.
7][1
9.1]
[16.
9][2
1.2]
[21.
0][2
1.4]
[19.
1][1
6.8]
[21.
5][2
0.6]
DB
P83
.577
.674
.480
.178
.878
.274
.974
.075
.476
.779
.675
.974
.277
.777
.5[1
2.4]
[12.
9][9
.9]
[12.
3][1
2.8]
[11.
9][1
2.1]
[10.
0][1
1.5]
[12.
1][1
2.3]
[12.
4][9
.9]
[12.
1][1
2.4]
BM
I24
.422
.522
.423
.723
.026
.024
.224
.524
.825
.325
.623
.623
.524
.324
.4[4
.0]
[4.1
][3
.5]
[3.9
][3
.6]
[4.6
][4
.6]
[4.6
][4
.2]
[4.5
][4
.5]
[4.5
][4
.3]
[4.1
][4
.3]
WC
86.4
80.2
77.5
85.2
81.7
85.3
81.0
78.8
84.6
82.6
85.6
80.7
78.2
84.9
82.3
[10.
9][1
1.8]
[10.
3][1
1.1]
[11.
3][1
1.8]
[12.
3][1
1.7]
[11.
4][1
2.3]
[11.
6][1
2.1]
[11.
1][1
1.2]
[11.
9]W
HR
0.90
0.88
0.87
0.95
0.89
0.86
0.85
0.84
0.92
0.85
0.87
0.86
0.86
0.93
0.86
[0.0
7][0
.07]
[0.0
7][0
.08]
[0.0
7][0
.08]
[0.0
8][0
.07]
[0.0
8][0
.08]
[0.0
8][0
.08]
[0.0
7][0
.08]
[0.0
8]FP
G11
1.6
103.
397
.810
8.7
108.
311
3.3
98.4
101.
610
5.8
109.
111
2.8
100.
299
.810
7.2
108.
8[4
1.1]
[33.
8][4
2.5]
[39.
9][2
4.4]
[50.
4][2
6.9]
[43.
4][3
4.7]
[34.
3][4
8.1]
[29.
7][4
3.0]
[37.
4][3
1.0]
TC
228.
019
1.4
185.
620
7.5
210.
123
3.4
207.
219
9.1
219.
722
3.6
231.
920
1.4
192.
721
3.7
218.
6[4
6.2]
[45.
9][4
0.5]
[41.
2][4
5.2]
[46.
9][4
2.9]
[43.
6][4
6.2]
[51.
1][4
6.8]
[44.
7][4
2.7]
[44.
2][4
9.4]
HD
L-C
46.5
44.7
39.8
45.9
46.2
52.0
49.6
42.1
49.6
49.1
50.6
47.8
41.0
47.8
48.0
[12.
9][1
1.1]
[10.
3][1
2.0]
[11.
8][1
2.4]
[12.
8][1
0.4]
[12.
4][1
3.2]
[12.
8][1
2.4]
[10.
4][1
2.3]
[12.
7]T
G12
713
715
012
411
610
411
515
011
410
811
012
215
011
711
2[9
0-19
0][9
7-20
7][1
11-2
31]
[89-
190]
[89-
175]
[73-
151]
[83-
160]
[105
-206
][8
4-16
6][8
0-15
7][7
6-16
0][8
8-17
9][1
07-2
19]
[87-
177]
[83-
161]
TC/H
DL
5.2
4.5
4.9
4.8
4.8
4.7
4.4
4.9
4.7
4.8
4.8
4.4
4.9
4.7
4.8
[1.9
][1
.5]
[1.4
][1
.4]
[1.3
][1
.4]
[1.3
][1
.4]
[1.4
][1
.6]
[1.6
][1
.4]
[1.4
][1
.4]
[1.5
]LD
L-C
152
114
111
132
136
157
131
123
143
150
155
125
117
138
145
[44]
[43]
[37]
[40]
[42]
[42]
[38]
[39]
[42]
[46]
[43]
[40]
[39]
[41]
[45]
Non
HD
L-C
180
146
144
160
163
180
157
156
170
174
180
153
150
165
170
[44]
[46]
[37]
[41]
[42]
[46]
[40]
[40]
[44]
[48]
[45]
[42]
[39]
[43]
[46]
Tabl
e 3.
Mea
sure
d va
riabl
es am
ong
the 5
regi
ons i
n Th
aila
nd fo
r men
, wom
en an
d co
mbi
ned

22 J Med Assoc Thai Vol. 93 No. 1 2010
BKK N NE C S
Smoker 32.2 [26.8-38.1]a 31.8 [27.2-36.7]a 60.5 [56.4-64.5] 46.6 [42.3-51.1]b 49.8 [44.6-54.9]b
Drinking 49.3 [43.1-55.5]ab 59.8 [54.5-64.8]a 49.2 [44.9-53.4]b 48.2 [43.7-52.7]b 35.0 [30.2-40.1]HT 40.5 [34.7-46.7]a 26.3 [22.0-31.2]b 14.0 [11.4-17.0] 35.7 [31.6-40.1]a 25.7 [ 21.5-30.4]b
BMI > 30 kg/m2 7.9 [5.2-11.8]a 4.7 [3.0-7.3]abc 2.2 [1.3-3.8]b 5.4 [3.8-7.8]ac 2.1 [1.0-4.1]bc
WC > 90 cm 38.1 [32.4-44.1]a 18.7 [15.1-23.0]b 10.9 [8.6-13.7] 34.6 [ 30.5-38.9]a 22.3 [18.4-26.9]b
WHR > 0.9 54.6 [48.4-60.6] 38.1 [33.1-43.3]a 29.9 [26.3-33.9]a 73.4 [69.2-77.1] 37.8 [32.9-43.0]a
IFG 13.1 [9.5-17.7]b 6.9 [4.8-10.0]ab 5.3 [3.7-7.6]a 11.5 [9.0-14.6]b 21.4 [17.5-25.8]D M 16.1 [12.1-21.0]a 10.5 [7.7-14.0]ab 8.8 [6.7-11.3]b 11.0 [8.5-13.9]ab 8.1 [5.7-11.2]b
TC > 200 mg/dl 71.3 [65.6-76.4] 40.6 [35.7-45.8]a 32.6 [28.6-36.9]a 55.4 [51.0-59.8]b 56.9 [51.7-61.9]b
TC > 240 mg/dl 35.6 [30.1-41.5] 13.3 [10.2-17.1]a 7.5 [5.5-10.1] 18.6 [15.4-22.2]ab 22.0 [18.0-26.5]b
TG > 200 mg/dl 22.0 [17.4-27.4]bc 26.7 [22.5-31.5]ab 32.2 [28.2-36.4]a 22.9 [19.4-26.7]bc 16.3 [12.8-20.4]c
HDL < 35 mg/dl 15.4 [11.5-20.2]a 16.9 [13.5-21.1]a 36.2 [32.1-40.5] 17.2 [14.2-20.7]a 15.7 [12.4-19.8]a
TC/HDL > 5.0 50.3 [44.3-56.2]a 34.8 [30.1-39.8]b 42.9 [38.7-47.3]ab 41.0 [36.8-45.4]ab 37.7 [32.9-42.8]b
LDL > 160 mg/dl 41.0 [35.2-47.2] 14.9 [11.6-19.1] 8.6 [6.4-11.4] 23.0 [19.4-27.0]a 26.7 [22.4-31.6]a
Non HDL-C > 190 mg/dl 36.5 [30.8-42.6] 15.7 [12.2-19.8]a 10.3 [7.9-13.4]a 23.6 [20.0-27.6]b 25.8 [21.5-30.6]b
The values are in %HT = SBP/DBP > 140/> 90 mmHg or on antihypertensives; IFG, DM = impaired fasting plasma glucose, diabetes mellitusrespectively. The other abbreviations are similar to those in Table 2A similar superscript implies no difference between regions
Table 4.1. Age-adjusted prevalence (95% CI) and comparison of risk factors in men among the 5 regions
BKK N NE C S
Smoker 6.5 [5.0-8.6]a 5.7 [4.2-7.8]ab 3.3 [2.2-4.9 ]b 3.3 [2.1-5.2]ab 4.3 [3.0-6.1]ab
Drinking 13.5 [11.2-16.1]b 14.5 [12.0-17.4]ab 19.6 [16.7-22.8]a 13.5 [10.8-16.7]b 3.2 [2.1-4.7]HT 27.4 [24.1-30.9]a 22.8 [19.6-26.4]ab 11.9 [9.8-14.4] 24.3 [20.8-28.3]ab 20.9 [17.8-24.4]b
BMI > 30 kg/m2 17.1 [14.5-20.0]a 9.5 [7.5-12.0]b 10.6 [8.5-13.1]b 10.9 [8.5-13.9]b 14.0 [11.5-16.9]ab
WC >80cm 66.0 [62.5-69.4]a 54.9 [51.0-58.7]b 42.5 [38.8-46.3] 64.2 [59.9-68.3]ac 56.8 [52.8-60.6]bc
WHR > 0.85 55.5 [51.8-59.2]a 50.4 [ 46.4-54.4]ab 38.2 [34.6-42.0] 77.7 [73.8-81.2] 46.4 [42.4-50.5]b
IFG 10.1 [8.1-12.5]b 8.1 [6.3-10.5]b 4.2 [2.9-6.1]a 7.2 [5.3-9.6]ab 17.6 [14.8-20.8]D M 17.0 [14.4-19.9]a 6.7 [5.1-9.0]b 10.4 [ 8.4-12.8]bc 13.0 [10.4-16.1]ac 9.7 [7.6-12.3]bc
TC>200mg/dl 77.8 [74.6-80.7] 57.9 [53.9-61.7]a 46.6 [42.4-50.8] 64.8 [60.4-68.9]ab 67.7 [63.8-71.3]b
TC>240 mg/dl 42.7 [39.0-46.4] 18.7 [15.8-21.9] 12.2 [9.8-15.0] 28.0 [24.3-32.1]a 30.9 [27.3-34.8]a
TG > 200 mg/dl 13.0 [10.7-15.6]a 15.3 [12.7-18.4]a 25.8 [22.3-29.6] 15.0 [12.2-18.3]a 11.4 [9.1-14.1]a
HDL < 40 mg/dl 16.8 [14.3-19.7] 23.8 [20.6-27.3]a 46.3 [42.1-50.5] 23.5 [20.1-27.4]a 25.7 [22.4-29.3]a
TC/HDL > 5.0 36.8 [33.3-40.5]a 26.1 [22.8-29.7] 40.2 [36.1-44.4]a 34.1 [30.1-38.3]a 39.0 [35.2-43.0]a
LDL > 160 mg/dl 42.4 [38.7-46.2]a 21.8 [18.7-25.3] 13.7 [11.1-16.7] 29.6 [25.8-33.8] 37.9 [34.1-42.0]a
non HDL-C > 190 mg/dl 39.4 [35.7-43.1]a 19.6 [16.6-22.9]b 14.2 [11.6-17.3]b 26.8 [23.2-30.9]c 32.3 [28.7-36.3]ac
Table 4.2. Age-adjusted prevalence (95% CI) and comparison of risk factors in women among the 5 regions
in the south rather than the northeast. Among thewomen, the proportional differences among the regionsin the NHES-III were less still but showed a similardirection.
The high prevalence of low HDL-C in thepresent report is of concern and this had been pre-sented and discussed in previous reports(15,22). A searchof the publications from Thailand(23-30) showed a very
wide range of the prevalence of low HDL-C. This couldbe related to the cut off values, the ages, and whetherthe study was done from the rural or urban areas. Theseranges from a few percent to as high as 70% in theearlier series from Khon Kaen(26) and using 35 mg% asthe cut off values. Later reports from Khon Kaen andusing National Cholesterol Education Program cut offvalues of 40 mg% for men and 50 mg% for women

J Med Assoc Thai Vol. 93 No. 1 2010 23
Fig. 2 Age adjusted prevalence of various risk factors among women in different region
0.0
0.2
0.4
0.6
0.8
BK
K N
NE C S
Smoking
0.0
0.2
0.4
0.6
0.8
BK
K N
NE C S
Drinking
0.0
0.2
0.4
0.6
0.8
BK
K N
NE C S
HT
0.0
0.2
0.4
0.6
0.8
BK
K N
NE C S
BMI ≥ 30 kg/m2
0.0
0.2
0.4
0.6
0.8
BK
K N
NE C S
WC ≥ 80 cm
0.0
0.2
0.4
0.6
0.8
BK
K N
NE C S
WHR ≥ 0.85
0.0
0.2
0.4
0.6
0.8
BK
K N
NE C S
IFG
0.0
0.2
0.4
0.6
0.8
BK
K N
NE C S
DM
0.0
0.2
0.4
0.6
0.8
BK
K N
NE C S
TC ≥ 200 mg/dl
0.0
0.2
0.4
0.6
0.8
BK
K N
NE C S
TC ≥ 240 mg/dl
0.0
0.2
0.4
0.6
0.8
BK
K N
NE C S
TG ≥ 200 mg/dl
0.0
0.2
0.4
0.6
0.8
BK
K N
NE C S
HDL ≤ 40 mg/dl
0.0
0.2
0.4
0.6
0.8
BK
K N
NE C S
TG HDL ≥ 5
0.0
0.2
0.4
0.6
0.8
BK
K N
NE C S
LDL ≥ 160 mg/dl *
0.0
0.2
0.4
0.6
0.8
BK
K N
NE C S
nonHDL −C ≥ 190 mg/dl *
Fig. 1 Age adjusted prevalence of various risk factors among men in different regions
0.0
0.2
0.4
0.6
0.8
BK
K N
NE C S
Smoking
0.0
0.2
0.4
0.6
0.8
BK
K N
NE C S
Drinking
0.0
0.2
0.4
0.6
0.8
BK
K N
NE C S
HT
0.0
0.2
0.4
0.6
0.8
BK
K N
NE C S
BMI ≥ 30 kg/m2
0.0
0.2
0.4
0.6
0.8
BK
K N
NE C S
WC ≥ 90 cm
0.0
0.2
0.4
0.6
0.8
BK
K N
NE C S
WHR ≥ 0.850.
00.
20.
40.
60.
8
BK
K N
NE C S
IFG
0.0
0.2
0.4
0.6
0.8
BK
K N
NE C S
DM
0.0
0.2
0.4
0.6
0.8
BK
K N
NE C S
TC ≥ 200 mg/dl
0.0
0.2
0.4
0.6
0.8
BK
K N
NE C S
TC ≥ 240 mg/dl
0.0
0.2
0.4
0.6
0.8
BK
K N
NE C S
TG ≥ 200 mg/dl
0.0
0.2
0.4
0.6
0.8
BK
K N
NE C S
HDL ≤ 40 mg/dl0.
00.
20.
40.
60.
8
BK
K N
NE C S
TG HDL ≥ 5
0.0
0.2
0.4
0.6
0.8
BK
K N
NE C S
LDL ≥ 160 mg/dl *
0.0
0.2
0.4
0.6
0.8
BK
K N
NE C S
nonHDL −C ≥ 190 mg/dl *
24 J Med Assoc Thai Vol. 93 No. 1 2010
showed a prevalence of 4-23% depending on genderand sites. One would expect a much higher prevalencewith such liberal cut-off values. However, thesedifferences could also be related to differing methodsor delay that occurred with specimen handling(31). Asimilar InterASIA study from China(32) using HDLcutoff of 40 mg% and in men showed a wide range of18-30% depending on whether these subjects werefrom rural or urban areas or from North versus South.The ranges for the women using a similar cut-off were13 to 21%. The INTERHEART which utilised first acuteMI as outcome, reported that south Asians differedfrom southeast Asians (including Thailand) by havinga lower average HDL-C and much higher prevalence oflower HDL-C subjects(12).
Assuming that death registration reflects thereal situation in each region of Thailand, high SMR forCVD are seen in Bangkok and a central region. Thepattern is more consistent with the leading prevalenceof hypertension, obesity, diabetes, hypercholesterolemiaand high LDL-C. It is in contrast to the reverse patternof highest prevalence of smoking, high TG and lowHDL-C in the northeast, where the CVD- SMR waslowest. The correlation was made from data of the sameyear 2000. One may interpret that more emphasis inprevention should be given towards rising obesity,DM and LDL-related lipids, hence proper dietarybehavior and physical activity. On the other hand, thelapse time from metabolic risk to CVD death may beshorter than that from smoking. In fact, the prevalenceof metabolic risk has been on the rise where that of
smoking is declining. Further follow-up with adjust-ment from time lag is needed for further studies.
Overall SMR from Faramnuayphol et al(13)
data showed that total death, as contrast to CVD death,was concentrated in upper north region. The formerwas probably due to the overwhelming problems ofHIV/AIDS started in 1990’s. It remains to be seenwhether the pattern of major cause of death wouldchange in the near future in the face of rising CVDrisks and the delay of death from HIV/AIDS from theeducation and secondary preventive measure.
The present study is however limited byits cross-sectional nature. The sample size was alsotoo small to allow adjustment for socio- economicvariables during the cross-region comparison. Eachregion was also limited to samples from only oneprovince. There is a need for larger and longer termstudies.
AcknowledgementsThe InterASIA study was financially
supported by Pfizer and managed by the NationalHealth Foundation of Thailand. The authors wish tothank Ms. Pitchaya Narldaisri in the finalising thepreparation and coordinating the contribution of thecontributors toward this manuscript.
References1. Unal B, Critchley JA, Capewell S. Modelling
the decline in coronary heart disease deathsin England and Wales, 1981-2000: comparingcontributions from primary prevention andsecondary prevention. BMJ 2005; 331: 614.
2. Ford ES, Ajani UA, Croft JB, Critchley JA, LabartheDR, Kottke TE, et al. Explaining the decrease inU.S. deaths from coronary disease, 1980-2000. NEngl J Med 2007; 356: 2388-98.
3. Reddy KS. Cardiovascular disease in non-Westerncountries. N Engl J Med 2004; 350: 2438-40.
4. Ueshima H, Sekikawa A, Miura K, Turin TC,Takashima N, Kita Y, et al. Cardiovasculardisease and risk factors in Asia: a selected review.Circulation 2008; 118: 2702-9.
5. Kitamura A, Iso H, Iida M, Naito Y, Sato S, JacobsDR, et al. Trends in the incidence of coronaryheart disease and stroke and the prevalence ofcardiovascular risk factors among Japanese menfrom 1963 to 1994. Am J Med 2002; 112: 104-9.
6. Kubo M, Hata J, Doi Y, Tanizaki Y, Iida M, KiyoharaY. Secular trends in the incidence of and riskfactors for ischemic stroke and its subtypes in
BKK N NE C S
Men (n) 500 2,126 2,368 3,244 1,218HT 30.9 35.8 26.1 34.4 27.5BMI > 30 kg/m2 7.9 3.1 5.4 7.1 3.4WC > 90 cm 36.3 18.5 16.6 26.7 20.1Diabetes 14.7 8.1 8.8 9.1 7.1TC > 240 mg/dl 39.0 16.3 12.0 24.2 23.2
Women (n) 910 2,378 2,449 3,469 1,527HT 24.2 31.3 27.2 31.6 24.3BMI > 30 kg/m2 16.1 7.4 9.5 15.1 13.7WC > 80 cm 56.9 41.9 43.5 50.6 47.3Diabetes 10.5 9.6 12.8 9.6 7.3TC > 240 mg/dl 37.7 20.9 15.0 27.8 30.6
Table 5. Age-adjusted prevalence of risk factors (agestandardized for 35-64) for cardiovascular diseasesas extracted from NHES III in 2004(21)
n = number of subjects. The prevalence is in %

J Med Assoc Thai Vol. 93 No. 1 2010 25
Japanese population. Circulation 2008; 118:2672-8.
7. Kitamura A, Sato S, Kiyama M, Imano H, Iso H,Okada T, et al. Trends in the incidence of coronaryheart disease and stroke and their risk factors inJapan, 1964 to 2003: the Akita-Osaka study. J AmColl Cardiol 2008; 52: 71-9.
8. Okayama A, Ueshima H, Marmot M, Elliott P,Choudhury SR, Kita Y. Generational and regionaldifferences in trends of mortality from ischemicheart disease in Japan from 1969 to 1992. Am JEpidemiol 2001; 153: 1191-8.
9. Cheng Y, Chen KJ, Wang CJ, Chan SH, Chang WC,Chen JH. Secular trends in coronary heart diseasemortality, hospitalization rates, and major cardio-vascular risk factors in Taiwan, 1971-2001. Int JCardiol 2005; 100: 47-52.
10. Wu Y, Huxley R, Li L, Anna V, Xie G, Yao C, et al.Prevalence, awareness, treatment, and control ofhypertension in China: data from the ChinaNational Nutrition and Health Survey 2002.Circulation 2008; 118: 2679-86.
11. Murray CJ, Kulkarni SC, Ezzati M. Understandingthe coronary heart disease versus total cardio-vascular mortality paradox: a method to enhancethe comparability of cardiovascular death statisticsin the United States. Circulation 2006; 113: 2071-81.
12. Karthikeyan G, Teo KK, Islam S, McQueen MJ,Pais P, Wang X, et al. Lipid profile, plasmaapolipoproteins, and risk of a first myocardialinfarction among Asians: an analysis from theINTERHEART Study. J Am Coll Cardiol 2009; 53:244-53.
13. Faramnuayphol P, Chongsuvivatwong V, Panna-runothai S. Geographical variation of mortality inThailand. J Med Assoc Thai 2008; 91: 1455-60.
14. InterASIA Collaborative Group. Cardiovascularrisk factor levels in urban and rural Thailand-The International Collaborative Study of Cardio-vascular Disease in Asia (InterASIA). Eur JCardiovasc Prev Rehabil 2003; 10: 249-57.
15. Chongsuvivatwong V, YipIntsoi T, Apakupakul N.Gender and ethnic differences in cardiovascularrisks in Songkhla province, Thailand: theinterASIA-south. J Med Assoc Thai 2008; 91:464-70.
16. He J, Neal B, Gu D, Suriyawongpaisal P, Xin X,Reynolds R, et al. International collaborativestudy of cardiovascular disease in Asia: design,rationale, and preliminary results. Ethn Dis 2004;14: 260-8.
17. Simple and sophisticated Bonferroni adjustment[database on the Internet]. 2004 [cited 2009 Jan19]. Available from: http://privatewww.essex.ac.uk/~scholp/bonferroni.htm
18. R-project.org [homepage on the Internet].Development Core Team, R: A language andenvironment for statistical computing. RFoundation for Statistical Computing, Vienna,Austria. 2009 [cited 2009 Jan 19]. Available from:http://www.R-project.org/.
19. CRAN.R-project.org [homepage on the Internet]Chongsuvivatwong V. Epicalc: Epidemiologicalcalculator. R package version 2.8.0.0. 2008 [cited2009 Jan 19]. Available from: http://CRAN.R-project.org/.
20. O’Keefe JH, Bell DS. Postprandial hyperglycemia/hyperlipidemia (postprandial dysmetabolism) is acardiovascular risk factor. Am J Cardiol 2007; 100:899-904.
21. Porapakkham Y, Bunyaratpundu P. Report onNational Health Examination Survey III 2004.Nonthaburi: Health System Research Instituteand Bureau of Policy and Strategy, Ministry ofPublic Health; 2006.
22. Tocharoenvanich P, YipIntsoi T, Choomalee K,Boonwanno P, Rodklai A. Risk factors for a five-year death in the interASIA-south cohort. J MedAssoc Thai 2008; 91: 471-8.
23. Viseshakul D, Chularojamontri V, Premwatana P,Chuprasert S, Palachewin K. High-densitylipoprotein cholesterol in Thai adults: study in aselected population free of coronary heart diseasesand in diabetics. J Med Assoc Thai 1980; 63: 257-66.
24. Report of the study on heart and circulation onpersonnel of the Electricity Generating Authorityof Thailand (EGAT) 1985. Published by the insti-tution as a book. Principle investigator: LochayaS.
25. Sitthi-Amorn C, Chandraprasert S, Bunnag SC,Plengvidhya CS. The prevalence and riskfactors of hypertension in Klong Toey slum andKlong Toey government apartment houses. Int JEpidemiol 1989; 18: 89-94.
26. Bhuripanyo K, Tatsanavivat P, Matrakool B,Muktabhant B, Bhuripanyo P, HarnthaveesompolS. A prevalence survey of lipids abnormalities ofrural area in Amphoe Phon, Khon Kaen. J MedAssoc Thai 1993; 76: 101-8.
27. Pongchaiyakul C, Pongchaiyakul C, PratipanawatrT. Prevalence of dyslipidemia in rural Thai adults:an epidemiologic study in Khon Kaen province.

26 J Med Assoc Thai Vol. 93 No. 1 2010
J Med Assoc Thai 2005; 88: 1092-7.28. Nillakupt K, Nathalang O, Arnutti P, Aimpun P,
Rangsin R, Panichkul S, et al. Dyslipidemia in Thairural adults. J Med Assoc Thai 2005; 88: 824-8.
29. Pongchaiyakul C, Hongsprabhas P, Pisprasert V,Pongchaiyakul C. Rural-urban difference in lipidlevels and prevalence of dyslipidemia: a population-based study in Khon Kaen province, Thailand. JMed Assoc Thai 2006; 89: 1835-44.
30. Pongchaiyakul C, Nguyen TV, Wanothayaroj E,Karusan N, Klungboonkrong V. Prevalence of
ความแตกตางดานความเสยงตอโรคหลอดเลอดและหวใจระหวาง 5 ภาคในประเทศไทย: ขอมล
จากการศกษา InterASIA
วระศกด จงสววฒนวงศ, ธาดา ยบอนซอย, ไพบลย สรยวงศไพศาล, สายณห ชพอดมวทย, วชย เอกพลากร,
พนจ ฟาอำนวยผล, ปยทศน ทศนาววฒน, วงสวาท โกศลวฒน, สมศกด ธรรมธตวฒน, เฉลมศร นนทวรรณ
กรงเทพมหานครและภาคกลางมอตราการตายจากโรคหลอดเลอดและหวใจท ปรบฐานอายและเพศ
สงกวาภาคอน ๆ ในป พ.ศ. 2543 ซงอาจเกยวของกบความแตกตางดานปจจยเสยง ระหวางภาคตาง ๆ ของประเทศ
รายงานนเปรยบเทยบความชกของปจจยเสยงตอการเกดโรคหลอดเลอดและหวใจ จากขอมลการศกษา InterASIA
ซงสำรวจประชากรในจงหวดซงถอวาเปนตวแทน 5 ภาคในปดงกลาว พบวากลมตวอยางจากกรงเทพมหานคร
และภาคกลาง มภาวะความดนโลหตสง ดชนมวลกายสง ภาวะลงพง ระดบคอเลสเตอรอลท อย ในไขมน
ความหนาแนนตำ (low density lipoprotein cholesterol) สงและโรคเบาหวานชกกวาภาคอน ๆ สวนกลมตวอยาง
จากภาคตะวนออกเฉยงเหนอมความชกสงกวาภาคอนในดานการสบบหร ภาวะคอเลสเตอรอลทอย ในไขมน
ความหนาแนนสง (high density lipoprotein cholesterol) ตำและระดบไตรกลเซอรไรดสง สรปแลวภมภาคตาง ๆ
มความชกของปจจยเสยง และอตราตายจากโรคหลอดเลอดและหวใจแตกตางกนชดเจน ขอมลในป พ.ศ. 2543
อาจจะบงชวา อตราตายของโรคหลอดเลอดและหวใจสมพนธกบความผดปกตดานเมตาบอลกมากกวาสมพนธกบ
อตราการสบบหรของประชากรในปเดยวกน
metabolic syndrome and its relationship to weightin the Thai population. J Med Assoc Thai 2007;90: 459-67.
31. Musigavon P, YipIntsoi T. Loss of high densitylipoprotein cholesterol in serum: effect of storage.J Med Assoc Thai 2005; 88: 1388-94.
32. He J, Gu D, Reynolds K, Wu X, Muntner P, Zhao J,et al. Serum total and lipoprotein cholesterollevels and awareness, treatment, and control ofhypercholesterolemia in China. Circulation 2004;110: 405-11.