Comparison of burnt area estimates derived from satellite products and national statistics in Europe
21
This article was downloaded by: [Open University] On: 12 April 2013, At: 18:19 Publisher: Taylor & Francis Informa Ltd Registered in England and Wales Registered Number: 1072954 Registered office: Mortimer House, 37-41 Mortimer Street, London W1T 3JH, UK International Journal of Remote Sensing Publication details, including instructions for authors and subscription information: http://www.tandfonline.com/loi/tres20 Comparison of burnt area estimates derived from satellite products and national statistics in Europe Lasse Loepfe a , Francisco Lloret a b & Rosa María Román-Cuesta a c a Center for Ecological Research and Forestry Applications (CREAF), Autonomous University of Barcelona, E-08193, Bellaterra, Barcelona, Spain b Department of Animal Biology, Plant Biology and Ecology, Autonomous University of Barcelona, 08193, Bellaterra, Barcelona, Spain c UN-REDD Programme, FAO MRV Team, 00100, Rome, Italy Version of record first published: 08 Dec 2011. To cite this article: Lasse Loepfe , Francisco Lloret & Rosa María Román-Cuesta (2012): Comparison of burnt area estimates derived from satellite products and national statistics in Europe, International Journal of Remote Sensing, 33:12, 3653-3671 To link to this article: http://dx.doi.org/10.1080/01431161.2011.631950 PLEASE SCROLL DOWN FOR ARTICLE Full terms and conditions of use: http://www.tandfonline.com/page/terms-and- conditions This article may be used for research, teaching, and private study purposes. Any substantial or systematic reproduction, redistribution, reselling, loan, sub-licensing, systematic supply, or distribution in any form to anyone is expressly forbidden. The publisher does not give any warranty express or implied or make any representation that the contents will be complete or accurate or up to date. The accuracy of any instructions, formulae, and drug doses should be independently verified with primary sources. The publisher shall not be liable for any loss, actions, claims, proceedings,
-
Upload
rosa-maria -
Category
Documents
-
view
212 -
download
0
Transcript of Comparison of burnt area estimates derived from satellite products and national statistics in Europe
This article was downloaded by: [Open University]On: 12 April 2013, At: 18:19Publisher: Taylor & FrancisInforma Ltd Registered in England and Wales Registered Number: 1072954 Registeredoffice: Mortimer House, 37-41 Mortimer Street, London W1T 3JH, UK
International Journal of RemoteSensingPublication details, including instructions for authors andsubscription information:http://www.tandfonline.com/loi/tres20
Comparison of burnt area estimatesderived from satellite products andnational statistics in EuropeLasse Loepfe a , Francisco Lloret a b & Rosa María Román-Cuesta ac
a Center for Ecological Research and Forestry Applications(CREAF), Autonomous University of Barcelona, E-08193,Bellaterra, Barcelona, Spainb Department of Animal Biology, Plant Biology and Ecology,Autonomous University of Barcelona, 08193, Bellaterra,Barcelona, Spainc UN-REDD Programme, FAO MRV Team, 00100, Rome, ItalyVersion of record first published: 08 Dec 2011.
To cite this article: Lasse Loepfe , Francisco Lloret & Rosa María Román-Cuesta (2012): Comparisonof burnt area estimates derived from satellite products and national statistics in Europe,International Journal of Remote Sensing, 33:12, 3653-3671
To link to this article: http://dx.doi.org/10.1080/01431161.2011.631950
PLEASE SCROLL DOWN FOR ARTICLE
Full terms and conditions of use: http://www.tandfonline.com/page/terms-and-conditions
This article may be used for research, teaching, and private study purposes. Anysubstantial or systematic reproduction, redistribution, reselling, loan, sub-licensing,systematic supply, or distribution in any form to anyone is expressly forbidden.
The publisher does not give any warranty express or implied or make any representationthat the contents will be complete or accurate or up to date. The accuracy of anyinstructions, formulae, and drug doses should be independently verified with primarysources. The publisher shall not be liable for any loss, actions, claims, proceedings,
demand, or costs or damages whatsoever or howsoever caused arising directly orindirectly in connection with or arising out of the use of this material.
Dow
nloa
ded
by [
Ope
n U
nive
rsity
] at
18:
19 1
2 A
pril
2013
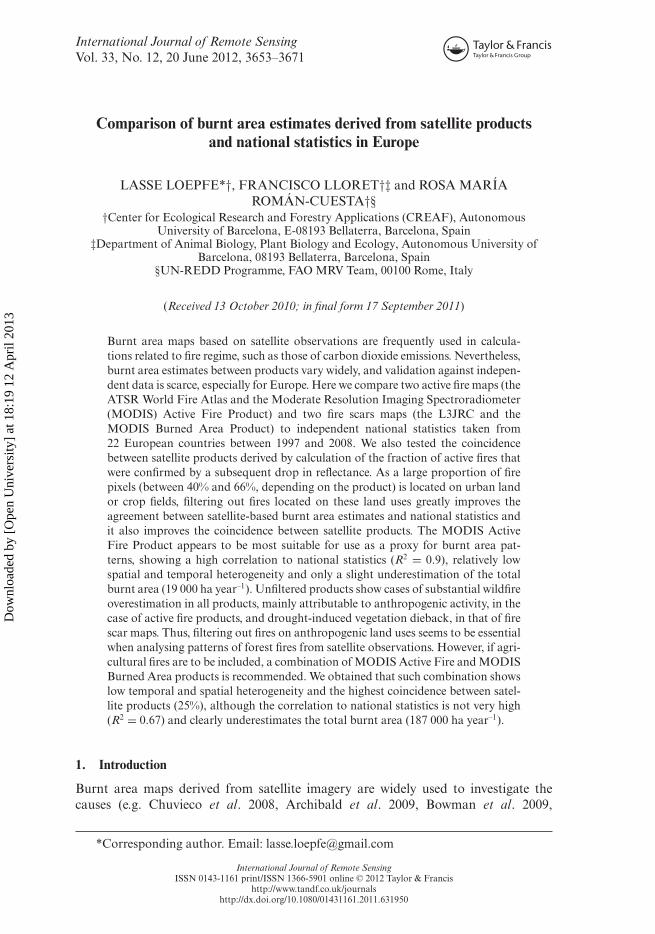
International Journal of Remote SensingVol. 33, No. 12, 20 June 2012, 3653–3671
Comparison of burnt area estimates derived from satellite productsand national statistics in Europe
LASSE LOEPFE*†, FRANCISCO LLORET†‡ and ROSA MARÍAROMÁN-CUESTA†§
†Center for Ecological Research and Forestry Applications (CREAF), AutonomousUniversity of Barcelona, E-08193 Bellaterra, Barcelona, Spain
‡Department of Animal Biology, Plant Biology and Ecology, Autonomous University ofBarcelona, 08193 Bellaterra, Barcelona, Spain
§UN-REDD Programme, FAO MRV Team, 00100 Rome, Italy
(Received 13 October 2010; in final form 17 September 2011)
Burnt area maps based on satellite observations are frequently used in calcula-tions related to fire regime, such as those of carbon dioxide emissions. Nevertheless,burnt area estimates between products vary widely, and validation against indepen-dent data is scarce, especially for Europe. Here we compare two active fire maps (theATSR World Fire Atlas and the Moderate Resolution Imaging Spectroradiometer(MODIS) Active Fire Product) and two fire scars maps (the L3JRC and theMODIS Burned Area Product) to independent national statistics taken from22 European countries between 1997 and 2008. We also tested the coincidencebetween satellite products derived by calculation of the fraction of active fires thatwere confirmed by a subsequent drop in reflectance. As a large proportion of firepixels (between 40% and 66%, depending on the product) is located on urban landor crop fields, filtering out fires located on these land uses greatly improves theagreement between satellite-based burnt area estimates and national statistics andit also improves the coincidence between satellite products. The MODIS ActiveFire Product appears to be most suitable for use as a proxy for burnt area pat-terns, showing a high correlation to national statistics (R2 = 0.9), relatively lowspatial and temporal heterogeneity and only a slight underestimation of the totalburnt area (19 000 ha year–1). Unfiltered products show cases of substantial wildfireoverestimation in all products, mainly attributable to anthropogenic activity, in thecase of active fire products, and drought-induced vegetation dieback, in that of firescar maps. Thus, filtering out fires on anthropogenic land uses seems to be essentialwhen analysing patterns of forest fires from satellite observations. However, if agri-cultural fires are to be included, a combination of MODIS Active Fire and MODISBurned Area products is recommended. We obtained that such combination showslow temporal and spatial heterogeneity and the highest coincidence between satel-lite products (25%), although the correlation to national statistics is not very high(R2 = 0.67) and clearly underestimates the total burnt area (187 000 ha year–1).
1. Introduction
Burnt area maps derived from satellite imagery are widely used to investigate thecauses (e.g. Chuvieco et al. 2008, Archibald et al. 2009, Bowman et al. 2009,
*Corresponding author. Email: [email protected]
International Journal of Remote SensingISSN 0143-1161 print/ISSN 1366-5901 online © 2012 Taylor & Francis
http://www.tandf.co.uk/journalshttp://dx.doi.org/10.1080/01431161.2011.631950
Dow
nloa
ded
by [
Ope
n U
nive
rsity
] at
18:
19 1
2 A
pril
2013
3654 L. Loepfe et al.
Krawchuk et al. 2009) and consequences (such as pyrogenic emissions) of vegetationfires (e.g. Van Der Werf et al. 2006, Randerson et al. 2007, Lehsten et al. 2008, Mievilleet al. 2010).
In the case of Europe, measuring biomass emissions from forest fires has gainedmomentum since the Commission wished the post-2012 European Trade System toinclude all greenhouse gases and all sectors, including aviation, maritime transporta-tion and forestry. This means that severe fire seasons, such as Portugal 2003, 2005(Trigo et al. 2006, Viegas 2006) or Greece 2007 (Veraverbeke et al. 2010), will have astrong political influence since they will translate into substantial losses of nationalcarbon credits.
The classical way of estimating biomass burning emissions from forest fires (GOFC-GOLD 2009) is the product of the area affected by fire, the fuel loading per unit area,the combustion factor, that is, the proportion of biomass consumed as a result offire, and the emission factor or emission ratio, that is, the amount of gas released foreach gaseous species per unit of biomass load consumed by the fire. The affected areaestimates are generally based on satellite inventories, but differences in the burnt areaestimates between satellite products can be considerable. It is, therefore, an urgent taskto improve knowledge on European burnt area estimates. Two conceptually differentapproaches are currently used to obtain burnt area estimates: (1) active fire countsbased on thermal emissions and (2) fire scar detection obtained from rapid drops invegetation-related reflectance.
Active fires detected by satellite are frequently used as a proxy of the spatio-temporal patterns of global fire incidence (see Mota et al. (2006) for a list ofapplications). This approach, however, has several known drawbacks, each with agreat potential for error: (1) fires that go undetected due to cloud cover or a lack ofcoincidence between the times of the satellite overpass and the fire occurrence (Smithet al. 2007); (2) limitations on thermal fire algorithms to detect non-intense under-story fires under dense forest crown covers (Schroeder et al. 2008, Tansey et al. 2008);(3) differences between the target ecosystem and ecosystem(s) used for global algo-rithm calibration (Barbosa et al. 1999); (4) satellite internal problems and viewingangles (Carmona-Moreno et al. 2005); (5) topographic area projections and darkshadows (Dennison 2006); (6) unknown/imprecise per cent of the real burned areaper pixel (Barbosa et al. 1999, Giglio et al. 2006); and (7) hotspots that do not cor-respond to vegetation fires but are the results of other thermal sources (i.e. gas flaresand volcanic eruptions) (Mota et al. 2006).
More recently, global post-fire scar products based on temporal–spectral differencesof the burnt vegetation cover have been developed, obviating the need for any coinci-dence between the time of the satellite overpass and that of the fire occurrence. Twoproducts with daily resolution are currently available: the L3JRC product (Tanseyet al. 2008) and the Moderate Resolution Imaging Spectroradiometer (MODIS)Burned Area Product (Roy et al. 2005, 2008). Major differences have been reported,however, between these fire scar products, mainly on account of overestimation of theburnt area by the L3JRC (Chang and Song 2009, Giglio et al. 2010).
Most validations of burnt area and active fire products are based on satellite–satellite comparisons, generally using Landsat or Advanced Spaceborne ThermalEmission and Reflection Radiometer (ASTER) images (e.g. Boschetti et al. 2004,Morisette et al. 2005a, Csiszar et al. 2006, Hawbaker et al. 2008, Roy et al. 2008,Schroeder et al. 2008, Tansey et al. 2008, Boschetti and Roy 2009). Only few compar-isons with independent national statistics (Chang and Song 2009, Giglio et al. 2010)
Dow
nloa
ded
by [
Ope
n U
nive
rsity
] at
18:
19 1
2 A
pril
2013
Fire products and national statistics in Europe 3655
or ground observations (Cardoso et al. 2005) are available. When such comparisonshave been made in North America (Giglio et al. 2010), Russia and China (Changand Song 2009), the L3JRC shows little correlation with national statistics, whereasthe MODIS Burned Area Product seems more suitable as a proxy, even though itunderestimates the burnt area. The MODIS Active Fire Product presents significanterrors of both commission and omission compared with the ground observations inAmazonia (Cardoso et al. 2005), whereas exhaustive MODIS–ASTER comparisonsshowed few commission errors (Schroeder et al. 2008). Very little validation effort hasbeen attempted with regard to Europe, so there is still great uncertainty about theaccuracy of the burnt area estimates for this continent, where climate change is likelyto induce profound changes in fire regimes (Piñol et al. 1998, Pausas 2004, Carvalhoet al. 2010).
In this article, we compare two active fire data sets (the ATSR World Fire Atlasand the MODIS Active Fire Product) and two burnt area data sets (the L3JRCand the MODIS Burned Area Product) to independent national statistics. The maingoal is to test for the correlation between satellite-derived burnt area estimates andthe burnt area in 22 European countries, as expressed by national statistics between1997 and 2008. More specifically, we analyse the spatial and temporal patterns of theburnt area estimates and show some examples of important burnt area underestima-tions and overestimations. We also analyse whether filtering out fire pixels related toanthropogenic land use improves the burnt area estimates.
2. Material and methods
2.1 Data source
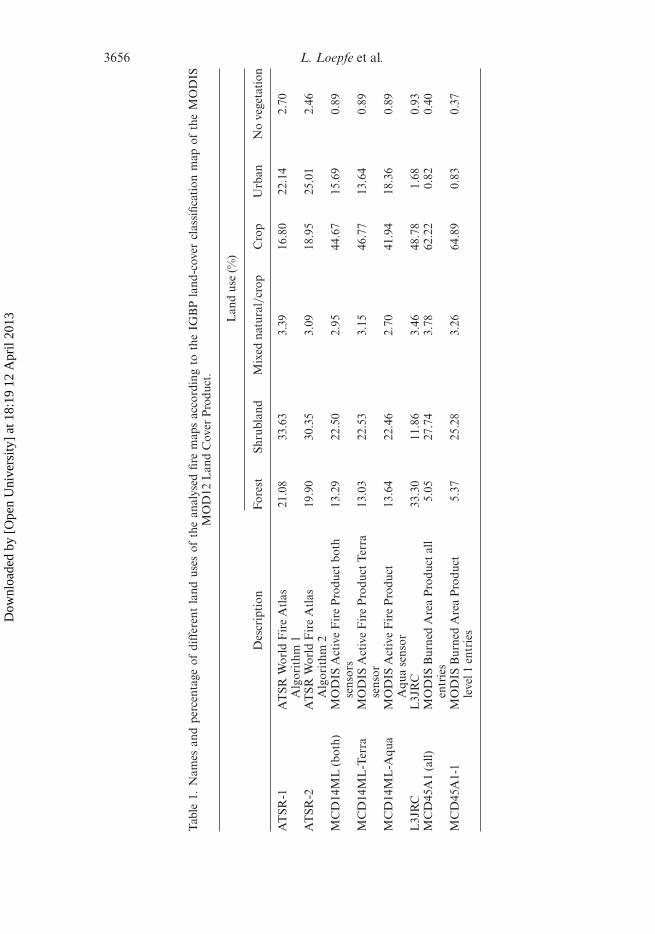
We used two active fire data sets (the ATSR World Fire Atlas and the MODIS ActiveFire Product) and two burnt area data sets (the L3JRC and the MODIS Burned AreaProduct). An overview of the analysed products is given in table 1.
The ATSR World Fire Atlas (Arino et al. 2001) extends from 1995 to the present(complete years are available from 1997 onwards) with a 1 km resolution. All hotspotswith a high temperature at night (including gas flares) are located by using night-timedata from the 3.7 µm thermal channel of the ATSR-2 (onboard ERS-2, 1995–2002)and AATSR (onboard ENVISAT, 2003–present) sensors. Two different algorithmshave been proposed to establish the threshold of hotspot assignation: >312 K (algo-rithm 1) and >308 K (algorithm 2). In this study, we tested for both algorithms.ENVISAT and ERS-2 fly in a sun-synchronous polar orbit of about 800 km altitude,providing a complete coverage of the globe within one to three days. These productsare in the public domain, on the Ionia website (http://shark1.esrin.esa.it/ionia).
The MODIS Active Fire Product (Justice et al. 2002) is a part of the MODISCollection 5 and offers data for active fires from November 2000 to the present atapproximately 1 km resolution (the actual pixel size is indicated as 927 m). MODIS isonboard the Terra (EOS AM) and Aqua (EOS PM) satellites, which are viewing theentire Earth’s surface twice a day in complementary orbits. Fire detection is performedusing a contextual algorithm (Giglio et al. 2003) that takes advantage of mid-infraredradiation from fires. The 4 and 11 µm brightness temperature of potential fire pix-els are compared to the neighbouring non-fire background. Here we used the globalmonthly fire location product (MCD14ML), which contains this information for allTerra and Aqua MODIS fire pixels in a single monthly ASCII file, available fromhttp://modis-fire.umd.edu/Active_Fire_Products.html.
Dow
nloa
ded
by [
Ope
n U
nive
rsity
] at
18:
19 1
2 A
pril
2013
3656 L. Loepfe et al.
Tab
le1.
Nam
esan
dpe
rcen
tage
ofdi
ffer
ent
land
uses
ofth
ean
alys
edfir
em
aps
acco
rdin
gto
the
IGB
Pla
nd-c
over
clas
sific
atio
nm
apof
the
MO
DIS
MO
D12
Lan
dC
over
Pro
duct
.
Lan
dus
e(%
)
Des
crip
tion
For
est
Shru
blan
dM
ixed
natu
ral/
crop
Cro
pU
rban
No
vege
tati
on
AT
SR-1
AT
SRW
orld
Fir
eA
tlas
Alg
orit
hm1
21.0
833
.63
3.39
16.8
022
.14
2.70
AT
SR-2
AT
SRW
orld
Fir
eA
tlas
Alg
orit
hm2
19.9
030
.35
3.09
18.9
525
.01
2.46
MC
D14
ML
(bot
h)M
OD
ISA
ctiv
eF
ire
Pro
duct
both
sens
ors
13.2
922
.50
2.95
44.6
715
.69
0.89
MC
D14
ML
-Ter
raM
OD
ISA
ctiv
eF
ire
Pro
duct
Ter
rase
nsor
13.0
322
.53
3.15
46.7
713
.64
0.89
MC
D14
ML
-Aqu
aM
OD
ISA
ctiv
eF
ire
Pro
duct
Aqu
ase
nsor
13.6
422
.46
2.70
41.9
418
.36
0.89
L3J
RC
L3J
RC
33.3
011
.86
3.46
48.7
81.
680.
93M
CD
45A
1(a
ll)M
OD
ISB
urne
dA
rea
Pro
duct
all
entr
ies
5.05
27.7
43.
7862
.22
0.82
0.40
MC
D45
A1-
1M
OD
ISB
urne
dA
rea
Pro
duct
leve
l1en
trie
s5.
3725
.28
3.26
64.8
90.
830.
37
Dow
nloa
ded
by [
Ope
n U
nive
rsity
] at
18:
19 1
2 A
pril
2013
Fire products and national statistics in Europe 3657
The L3JRC fire scar product (Tansey et al. 2008) is available from April 2000 toMarch 2007 at 1 km resolution. This map is derived from the VEGETATION 1 dataonboard SPOT 4, which provides daily coverage of the entire globe. The main pro-cessing algorithm makes use of a temporal index in the near infrared (NIR) channel.Data are available as binary product and ASCII file from http://bioval.jrc.ec.europa.eu/products/burnt_areas_L3JRC/GlobalBurntAreas2000-2007.php.
The MODIS Burned Area Product (MCD45A1; Roy et al. 2005, 2008) is avail-able from April 2000 to the present at an approximately 500 m resolution (actualpixel size is 463 m). Its data also come from MODIS Collection 5 based on Terraand Aqua images. A bi-directional reflectance model-based change detection algo-rithm was used to calculate the burnt areas from bands 5 (1230–1250 nm), 2(841–876 nm) and 7 (2105–2155 nm). The MODIS Burned Area Product presentsfour levels of confidence of detection. We tested for the most conservative map (onlyincluding pixels with the highest confidence rating) and the map with all pixelsincluded. The maps are available as HDF and GeoTIFF files from http://modis-fire.umd.edu/Burned_Area_Products.html.
The independent national statistics were obtained from the annual report no. 9,Forest Fire in Europe 2008, from the Joint Research Centre of the EuropeanCommission, available at http://effis.jrc.ec.europa.eu/reports/fire-reports and corre-sponding to the official statistics of the different European countries. The data arecollected by the authorities, rural agents or fire brigades, of the participating coun-tries and based on ground observations. This hierarchical data collection systembrings together many man-hours of in situ data collecting and gives the database ahigh credibility. Although these statistics refer to forests wildfires, they do not dis-tinguish between specific vegetation or land-cover types, and the criteria followed ineach country to include burnt areas in the statistics may be different. In spite of theobvious differences on the procedures followed in each country, this is the most com-prehensive and reliable field-data source available for the whole European territory.We used data from the following 22 countries: Austria, Bulgaria, Croatia, Cyprus,the Czech Republic, Estonia, Finland, France, Germany, Greece, Hungary, Italy,Latvia, Lithuania, Poland, Portugal, Romania, Slovakia, Slovenia, Spain, Sweden andSwitzerland.
2.2 Data processing and analysis
Whereas all the other products were available directly as ASCII files with oneentry per fire pixel, the raster images from the MCD45A1 were transformed toASCII files using the MiraMon software (Pons 2000). Further calculations were per-formed using the R Project for Statistical Computing (version 2.10.1, http://www.r-project.org).
We divided fire counts according to a simplified version of the IGBP land-cover clas-sification map (Belward et al. 1999, Scepan 1999) obtained from the MODIS MOD12Land Cover Product (http://www-modis.bu.edu/landcover/userguidelc/lc.html). Sincenational statistics are focused to report forest fires, we performed a filtering of thesatellite-derived maps of burnt area according to land cover. However, given the likelydisparity in the criteria and procedures to build the statistics in the different coun-tries and the land-cover criteria provided by regional maps may not agree with fieldassignment of burnt areas to forest land, we assessed the importance of this filteringby comparing unfiltered and filtered products. Land-cover types 1–5 were classified
Dow
nloa
ded
by [
Ope
n U
nive
rsity
] at
18:
19 1
2 A
pril
2013
3658 L. Loepfe et al.
as ‘forests’, 6–11 as ‘shrublands’ and 0, 15 and 16 as ‘no vegetation’, land cover 14(cropland/natural vegetation mosaic) was maintained. We then assessed the coinci-dence between national statistics and satellite products with and without filtering byremoving the fire counts on pixels with no vegetation cover (land covers 0, 15 and 16)or those related to anthropogenic land use, that is, urban areas (land cover 13) andcrop fields (land cover 12).
We tested the different satellite products against the set of yearly burnt areas of22 European countries, using linear regression and calculating Pearson’s correlationcoefficient. We assumed that the area burned is proportional to the simple counts offire pixels, that is,
A (i, y) = αNf (i, y) , (1)
where A(i, y) is the area burned (in ha) within a particular country i during a yeary, Nf (i, y) is the number of fire pixels observed within the same country duringthe same time period, and α a constant representing the effective burnt area per firepixel. As the estimated area is the product of the number of pixels and the pixel area,there will, therefore, be an overestimate (higher estimated area than the area obtainedfrom national statistics) when the pixel area is higher than the slope, α. We also testedfor exponential fitting but obtained worse correlations for all the products except theL3JRC. We also tested for the correlation of fire counts of satellite products with thenumber of fires as indicated by the national statistics.
To detect the spatial differences of performance, we modelled the burnt area of eachcountry, A(i), over the available years, fitting a different slope αs(i) (the subscript sstands for ‘spatial’) for each country i as follows:
A (i) = αs (i) Nf (i) , (2)
also calculating the coefficient of variation (CV) of these slopes and the Spearman’srank correlation coefficient for each country. Pearson’s correlation could not becalculated in this case, due to the small sample size.
We also tested for the capacity of satellite products to reproduce the temporal pat-tern of national statistics for burnt areas between the years 2001–2008, when data wereavailable from most of the countries. The procedure was analogous to the spatial anal-ysis, calculating a different slope αt (the subscript t stands for ‘temporal’) for each yearover the whole study area:
A (y) = αt (y) Nf (y) , (3)
again calculating the CV of these slopes and the Spearman’s rank correlationcoefficient for each year.
We furthermore tested for the coincidence between the active fire and burntarea products. We tested the MODIS Active Fires of the Terra satellite and ATSRalgorithm 2 against the MODIS Burned Area Product (all entries) and L3JRC. Activefires were considered ‘confirmed’ with the occurrence of a reflectance drop within onemonth after hotspot detection and a distance of 1 km (pixel centre to pixel centre).To compare the national statistics these combinations, that is, ‘confirmed’ pixels with
Dow
nloa
ded
by [
Ope
n U
nive
rsity
] at
18:
19 1
2 A
pril
2013
Fire products and national statistics in Europe 3659
both the hotspot detection and reflectance drop, the same procedure as above wasapplied.
3. Results
All the active fire products had a relatively high proportion of fire counts in urbanareas, especially the ATSR World Fire Map (table 1). All products, except the ATSR,showed a very high percentage of fire counts in land for agricultural use (table 1). Allthe products, apart from the L3JRC, had more fires in shrublands than in forests, andthis ratio was most extreme in the case of the MODIS Burned Area Products (table 1).
3.1 Unfiltered products (including anthropogenic land covers)
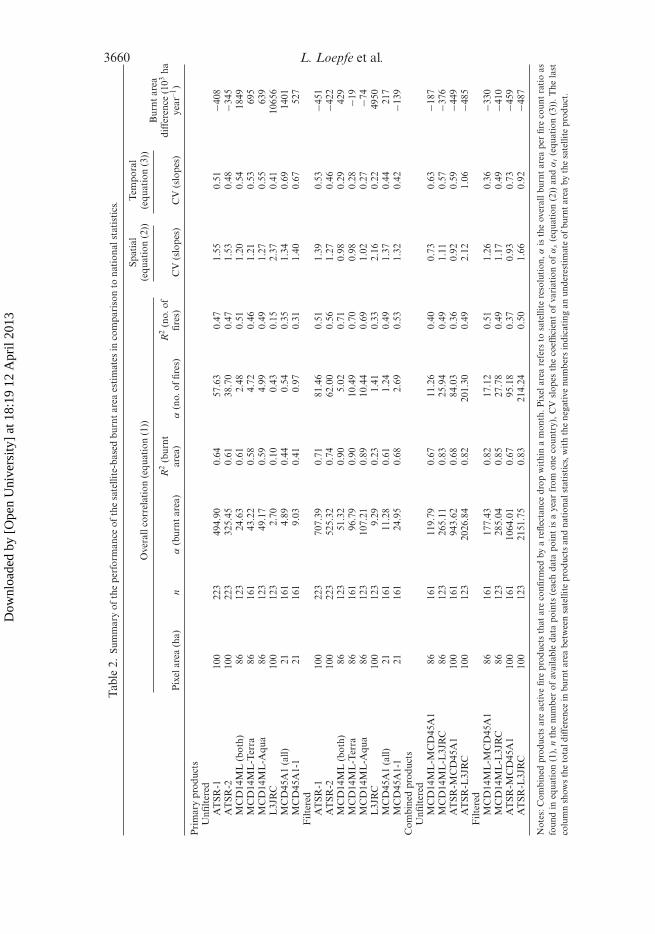
The active fire products showed a better overall coincidence with national statisticsthan burnt area maps (table 2). The fire counts were more closely related to nationalstatistics of burnt areas than to the national statistics on the number of fires (table 2).All the fire scar maps (L3JRC, MODIS Burned Area) and the MODIS Active FireProduct overestimated the burnt area in comparison with the national statistics, pre-senting slopes clearly below the pixel area (table 2). This indicates, for instance, thateach burnt pixel from the MODIS Burned Area Product in fact corresponds to 5.07 haof burnt area according to national statistics, whereas the actual pixel size is 21 ha. Asexpected, both the ATSR products have slopes well above the pixel area, as they onlyrecord night-time fires.
With regard to the Spearman’s rank coefficients for individual countries (usingequation (2)), the MODIS Active Fire Products showed the lowest number of verylow coefficients and that for practically all countries the coefficients were above 0.75(figure 1). Most products had low coefficients for some Central European coun-tries, in a belt extending to the southeast from Germany to Bulgaria, whereas theMediterranean countries presented higher coefficients. The heterogeneity of slopesbetween countries, measured as the coefficient of variance, was also the lowest in theMODIS Active Fire Products, followed by the MODIS Burned Area Products, theATSR-2 and the ATSR-1. Slope heterogeneity was clearly the highest in the L3JRC(table 2). Most products overestimated the burnt area in the Germany–Bulgaria belt,whereas the ATSR products underestimated the burnt area in the Mediterranean andthe MODIS Burned Area Products did the same in Northern Europe.
For individual years (equation (3)), the Active Fire Products showed Pearson’scoefficients between 0.5 and 0.9, whereas the MODIS Burned Area Products variedbetween 0.3 and 0.9 and the L3JRC had low coefficients throughout. The L3JRCproduct overestimated the burnt area regularly for all the years, whereas the rest ofthe products tended to overestimate the burnt area more particularly in years with lowfire activity.
3.2 Filtered products (excluding anthropogenic land covers)
Filtering out fire pixels for urban land, crop fields and pixels without vegetationgenerally improved the burnt area estimates (table 2).
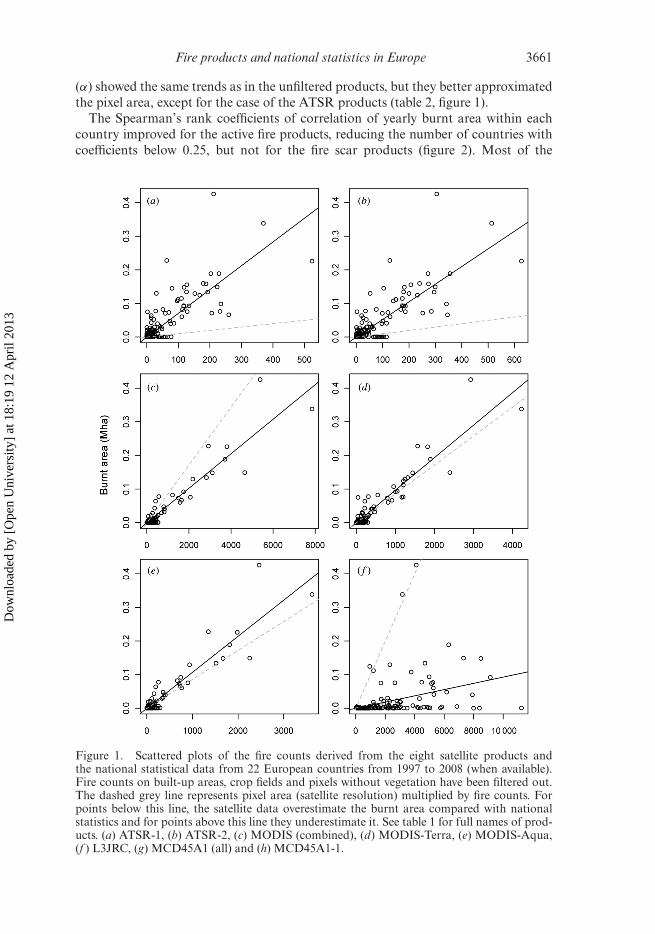
The active fire products showed a greater coincidence with national statistics thanthe burnt area data sets. The MODIS Active Fire Products clearly outperform the rest,with coefficient of determination, R2, values above 0.9 (table 2, figure 1). The slopes
Dow
nloa
ded
by [
Ope
n U
nive
rsity
] at
18:
19 1
2 A
pril
2013
3660 L. Loepfe et al.
Tab
le2.
Sum
mar
yof
the
perf
orm
ance
ofth
esa
telli
te-b
ased
burn
tar
eaes
tim
ates
inco
mpa
riso
nto
nati
onal
stat
isti
cs.
Ove
rall
corr
elat
ion
(equ
atio
n(1
))Sp
atia
l(e
quat
ion
(2))
Tem
pora
l(e
quat
ion
(3))
Pix
elar
ea(h
a)n
α(b
urnt
area
)R
2(b
urnt
area
)α
(no.
offir
es)
R2
(no.
offir
es)
CV
(slo
pes)
CV
(slo
pes)
Bur
ntar
eadi
ffer
ence
(103
haye
ar–1
)
Pri
mar
ypr
oduc
tsU
nfilt
ered
AT
SR-1
100
223
494.
900.
6457
.63
0.47
1.55
0.51
−408
AT
SR-2
100
223
325.
450.
6138
.70
0.47
1.53
0.48
−345
MC
D14
ML
(bot
h)86
123
24.6
30.
612.
480.
511.
200.
5418
49M
CD
14M
L-T
erra
8616
143
.22
0.58
4.72
0.46
1.21
0.53
695
MC
D14
ML
-Aqu
a86
123
49.1
70.
594.
990.
491.
270.
5563
9L
3JR
C10
012
32.
700.
100.
430.
152.
370.
4110
656
MC
D45
A1
(all)
2116
14.
890.
440.
540.
351.
340.
6914
01M
CD
45A
1-1
2116
19.
030.
410.
970.
311.
400.
6752
7F
ilter
edA
TSR
-110
022
370
7.39
0.71
81.4
60.
511.
390.
53−4
51A
TSR
-210
022
352
5.32
0.74
62.0
00.
561.
270.
46−4
22M
CD
14M
L(b
oth)
8612
351
.32
0.90
5.02
0.71
0.98
0.29
429
MC
D14
ML
-Ter
ra86
161
96.7
90.
9010
.49
0.70
0.98
0.28
−19
MC
D14
ML
-Aqu
a86
123
107.
210.
8910
.44
0.69
1.02
0.27
−74
L3J
RC
100
123
9.29
0.23
1.41
0.33
2.16
0.22
4950
MC
D45
A1
(all)
2116
111
.28
0.61
1.24
0.49
1.37
0.44
217
MC
D45
A1-
121
161
24.9
50.
682.
690.
531.
320.
42−1
39C
ombi
ned
prod
ucts
Unfi
lter
edM
CD
14M
L-M
CD
45A
186
161
119.
790.
6711
.26
0.40
0.73
0.63
−187
MC
D14
ML
-L3J
RC
8612
326
5.11
0.83
25.9
40.
491.
110.
57−3
76A
TSR
-MC
D45
A1
100
161
943.
620.
6884
.03
0.36
0.92
0.59
−449
AT
SR-L
3JR
C10
012
320
26.8
40.
8220
1.30
0.49
2.12
1.06
−485
Filt
ered
MC
D14
ML
-MC
D45
A1
8616
117
7.43
0.82
17.1
20.
511.
260.
36−3
30M
CD
14M
L-L
3JR
C86
123
285.
040.
8527
.78
0.49
1.17
0.49
−410
AT
SR-M
CD
45A
110
016
110
64.0
10.
6795
.18
0.37
0.93
0.73
−459
AT
SR-L
3JR
C10
012
321
51.7
50.
8321
4.24
0.50
1.66
0.92
−487
Not
es:C
ombi
ned
prod
ucts
are
acti
vefir
epr
oduc
tsth
atar
eco
nfirm
edby
are
flect
ance
drop
wit
hin
am
onth
.Pix
elar
eare
fers
tosa
telli
tere
solu
tion
,αis
the
over
allb
urnt
area
per
fire
coun
tra
tio
asfo
und
ineq
uati
on(1
),n
the
num
ber
ofav
aila
ble
data
poin
ts(e
ach
data
poin
tis
aye
arfr
omon
eco
untr
y),C
Vsl
opes
the
coef
ficie
ntof
vari
atio
nof
αs
(equ
atio
n(2
))an
dα
t(e
quat
ion
(3))
.The
last
colu
mn
show
sth
eto
tald
iffer
ence
inbu
rnt
area
betw
een
sate
llite
prod
ucts
and
nati
onal
stat
isti
cs,w
ith
the
nega
tive
num
bers
indi
cati
ngan
unde
rest
imat
eof
burn
tar
eaby
the
sate
llite
prod
uct.
Dow
nloa
ded
by [
Ope
n U
nive
rsity
] at
18:
19 1
2 A
pril
2013
Fire products and national statistics in Europe 3661
(α) showed the same trends as in the unfiltered products, but they better approximatedthe pixel area, except for the case of the ATSR products (table 2, figure 1).
The Spearman’s rank coefficients of correlation of yearly burnt area within eachcountry improved for the active fire products, reducing the number of countries withcoefficients below 0.25, but not for the fire scar products (figure 2). Most of the
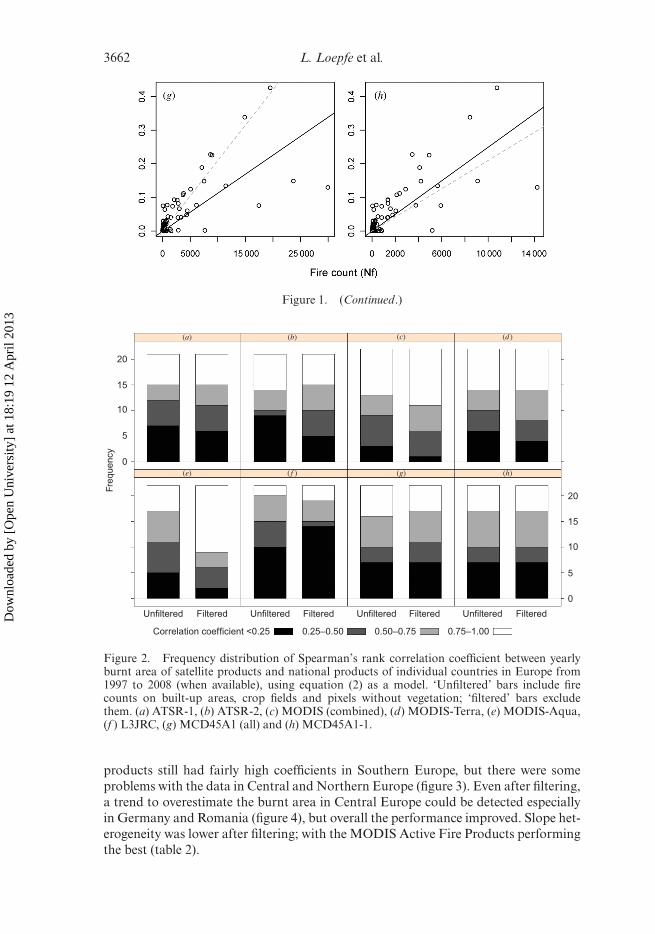
Figure 1. Scattered plots of the fire counts derived from the eight satellite products andthe national statistical data from 22 European countries from 1997 to 2008 (when available).Fire counts on built-up areas, crop fields and pixels without vegetation have been filtered out.The dashed grey line represents pixel area (satellite resolution) multiplied by fire counts. Forpoints below this line, the satellite data overestimate the burnt area compared with nationalstatistics and for points above this line they underestimate it. See table 1 for full names of prod-ucts. (a) ATSR-1, (b) ATSR-2, (c) MODIS (combined), (d) MODIS-Terra, (e) MODIS-Aqua,(f ) L3JRC, (g) MCD45A1 (all) and (h) MCD45A1-1.
Dow
nloa
ded
by [
Ope
n U
nive
rsity
] at
18:
19 1
2 A
pril
2013
3662 L. Loepfe et al.
Figure 1. (Continued.)
Unfiltered Filtered
Correlation coefficient <0.25 0.25–0.50 0.50–0.75 0.75–1.00
Unfiltered Filtered Unfiltered Filtered FilteredUnfiltered
0
5
10
20
15
0
(a)
(e) ( f ) (g) (h)
(b) (c) (d )
Freq
uenc
y
15
20
10
5
Figure 2. Frequency distribution of Spearman’s rank correlation coefficient between yearlyburnt area of satellite products and national products of individual countries in Europe from1997 to 2008 (when available), using equation (2) as a model. ‘Unfiltered’ bars include firecounts on built-up areas, crop fields and pixels without vegetation; ‘filtered’ bars excludethem. (a) ATSR-1, (b) ATSR-2, (c) MODIS (combined), (d) MODIS-Terra, (e) MODIS-Aqua,(f ) L3JRC, (g) MCD45A1 (all) and (h) MCD45A1-1.
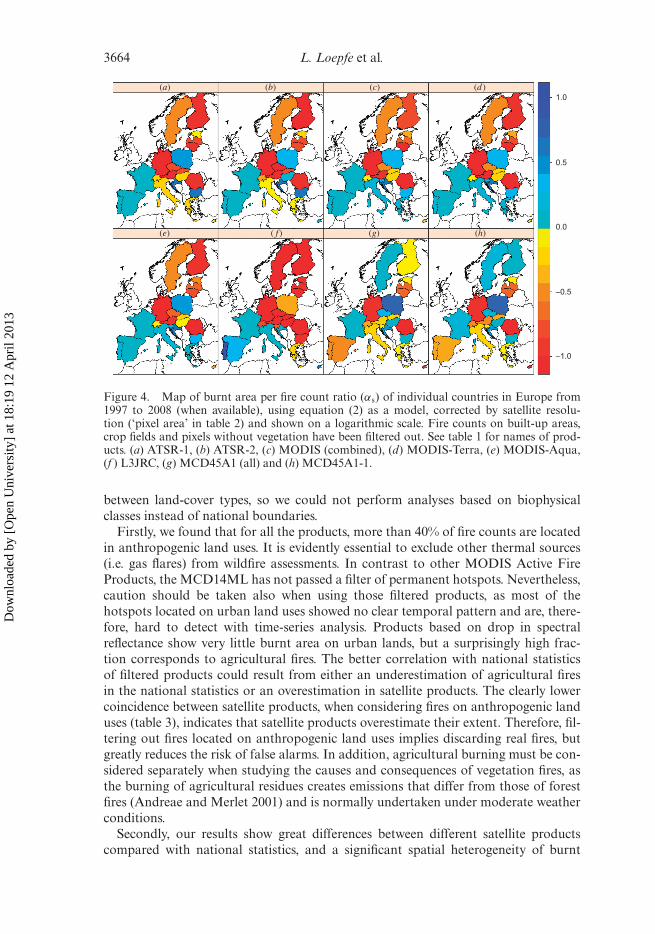
products still had fairly high coefficients in Southern Europe, but there were someproblems with the data in Central and Northern Europe (figure 3). Even after filtering,a trend to overestimate the burnt area in Central Europe could be detected especiallyin Germany and Romania (figure 4), but overall the performance improved. Slope het-erogeneity was lower after filtering; with the MODIS Active Fire Products performingthe best (table 2).
Dow
nloa
ded
by [
Ope
n U
nive
rsity
] at
18:
19 1
2 A
pril
2013
Fire products and national statistics in Europe 3663
(e) ( f ) (g) (h)
0.0
0.2
0.4
0.6
0.8
1.0
(d)(c)(a) (b)
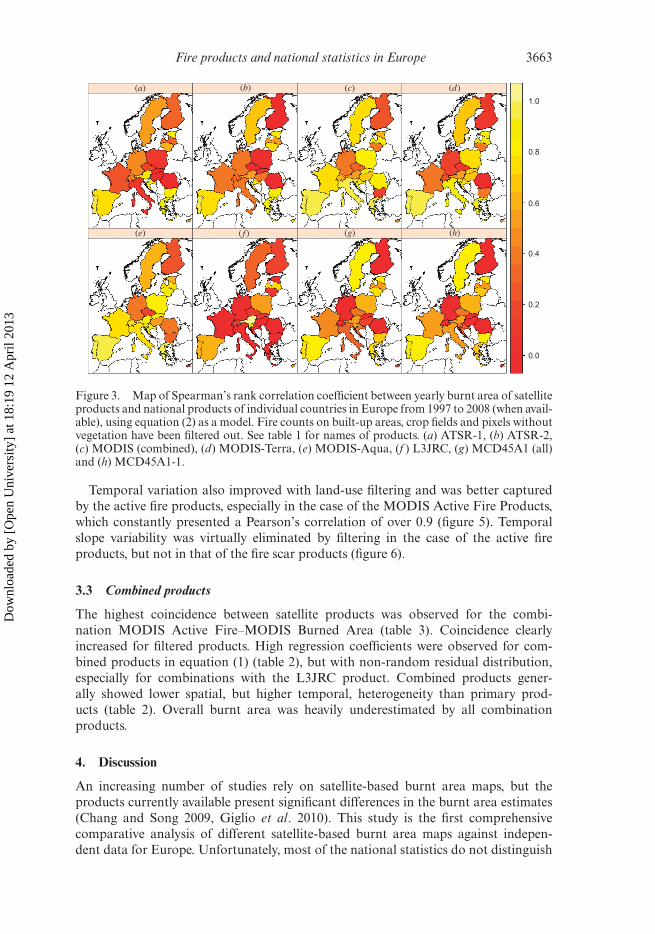
Figure 3. Map of Spearman’s rank correlation coefficient between yearly burnt area of satelliteproducts and national products of individual countries in Europe from 1997 to 2008 (when avail-able), using equation (2) as a model. Fire counts on built-up areas, crop fields and pixels withoutvegetation have been filtered out. See table 1 for names of products. (a) ATSR-1, (b) ATSR-2,(c) MODIS (combined), (d) MODIS-Terra, (e) MODIS-Aqua, (f ) L3JRC, (g) MCD45A1 (all)and (h) MCD45A1-1.
Temporal variation also improved with land-use filtering and was better capturedby the active fire products, especially in the case of the MODIS Active Fire Products,which constantly presented a Pearson’s correlation of over 0.9 (figure 5). Temporalslope variability was virtually eliminated by filtering in the case of the active fireproducts, but not in that of the fire scar products (figure 6).
3.3 Combined products
The highest coincidence between satellite products was observed for the combi-nation MODIS Active Fire–MODIS Burned Area (table 3). Coincidence clearlyincreased for filtered products. High regression coefficients were observed for com-bined products in equation (1) (table 2), but with non-random residual distribution,especially for combinations with the L3JRC product. Combined products gener-ally showed lower spatial, but higher temporal, heterogeneity than primary prod-ucts (table 2). Overall burnt area was heavily underestimated by all combinationproducts.
4. Discussion
An increasing number of studies rely on satellite-based burnt area maps, but theproducts currently available present significant differences in the burnt area estimates(Chang and Song 2009, Giglio et al. 2010). This study is the first comprehensivecomparative analysis of different satellite-based burnt area maps against indepen-dent data for Europe. Unfortunately, most of the national statistics do not distinguish
Dow
nloa
ded
by [
Ope
n U
nive
rsity
] at
18:
19 1
2 A
pril
2013
3664 L. Loepfe et al.
(e) ( f ) (g) (h)
–1.0
–0.5
0.0
0.5
1.0(d )(c)(a) (b)
Figure 4. Map of burnt area per fire count ratio (αs) of individual countries in Europe from1997 to 2008 (when available), using equation (2) as a model, corrected by satellite resolu-tion (‘pixel area’ in table 2) and shown on a logarithmic scale. Fire counts on built-up areas,crop fields and pixels without vegetation have been filtered out. See table 1 for names of prod-ucts. (a) ATSR-1, (b) ATSR-2, (c) MODIS (combined), (d) MODIS-Terra, (e) MODIS-Aqua,(f ) L3JRC, (g) MCD45A1 (all) and (h) MCD45A1-1.
between land-cover types, so we could not perform analyses based on biophysicalclasses instead of national boundaries.
Firstly, we found that for all the products, more than 40% of fire counts are locatedin anthropogenic land uses. It is evidently essential to exclude other thermal sources(i.e. gas flares) from wildfire assessments. In contrast to other MODIS Active FireProducts, the MCD14ML has not passed a filter of permanent hotspots. Nevertheless,caution should be taken also when using those filtered products, as most of thehotspots located on urban land uses showed no clear temporal pattern and are, there-fore, hard to detect with time-series analysis. Products based on drop in spectralreflectance show very little burnt area on urban lands, but a surprisingly high frac-tion corresponds to agricultural fires. The better correlation with national statisticsof filtered products could result from either an underestimation of agricultural firesin the national statistics or an overestimation in satellite products. The clearly lowercoincidence between satellite products, when considering fires on anthropogenic landuses (table 3), indicates that satellite products overestimate their extent. Therefore, fil-tering out fires located on anthropogenic land uses implies discarding real fires, butgreatly reduces the risk of false alarms. In addition, agricultural burning must be con-sidered separately when studying the causes and consequences of vegetation fires, asthe burning of agricultural residues creates emissions that differ from those of forestfires (Andreae and Merlet 2001) and is normally undertaken under moderate weatherconditions.
Secondly, our results show great differences between different satellite productscompared with national statistics, and a significant spatial heterogeneity of burnt
Dow
nloa
ded
by [
Ope
n U
nive
rsity
] at
18:
19 1
2 A
pril
2013
Fire products and national statistics in Europe 3665
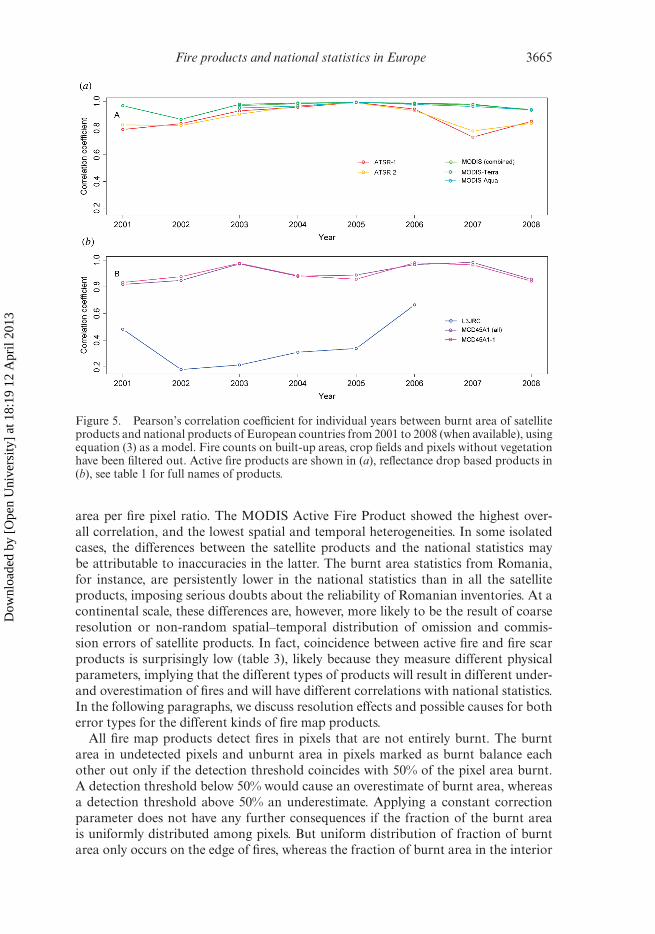
Figure 5. Pearson’s correlation coefficient for individual years between burnt area of satelliteproducts and national products of European countries from 2001 to 2008 (when available), usingequation (3) as a model. Fire counts on built-up areas, crop fields and pixels without vegetationhave been filtered out. Active fire products are shown in (a), reflectance drop based products in(b), see table 1 for full names of products.
area per fire pixel ratio. The MODIS Active Fire Product showed the highest over-all correlation, and the lowest spatial and temporal heterogeneities. In some isolatedcases, the differences between the satellite products and the national statistics maybe attributable to inaccuracies in the latter. The burnt area statistics from Romania,for instance, are persistently lower in the national statistics than in all the satelliteproducts, imposing serious doubts about the reliability of Romanian inventories. At acontinental scale, these differences are, however, more likely to be the result of coarseresolution or non-random spatial–temporal distribution of omission and commis-sion errors of satellite products. In fact, coincidence between active fire and fire scarproducts is surprisingly low (table 3), likely because they measure different physicalparameters, implying that the different types of products will result in different under-and overestimation of fires and will have different correlations with national statistics.In the following paragraphs, we discuss resolution effects and possible causes for botherror types for the different kinds of fire map products.
All fire map products detect fires in pixels that are not entirely burnt. The burntarea in undetected pixels and unburnt area in pixels marked as burnt balance eachother out only if the detection threshold coincides with 50% of the pixel area burnt.A detection threshold below 50% would cause an overestimate of burnt area, whereasa detection threshold above 50% an underestimate. Applying a constant correctionparameter does not have any further consequences if the fraction of the burnt areais uniformly distributed among pixels. But uniform distribution of fraction of burntarea only occurs on the edge of fires, whereas the fraction of burnt area in the interior
Dow
nloa
ded
by [
Ope
n U
nive
rsity
] at
18:
19 1
2 A
pril
2013
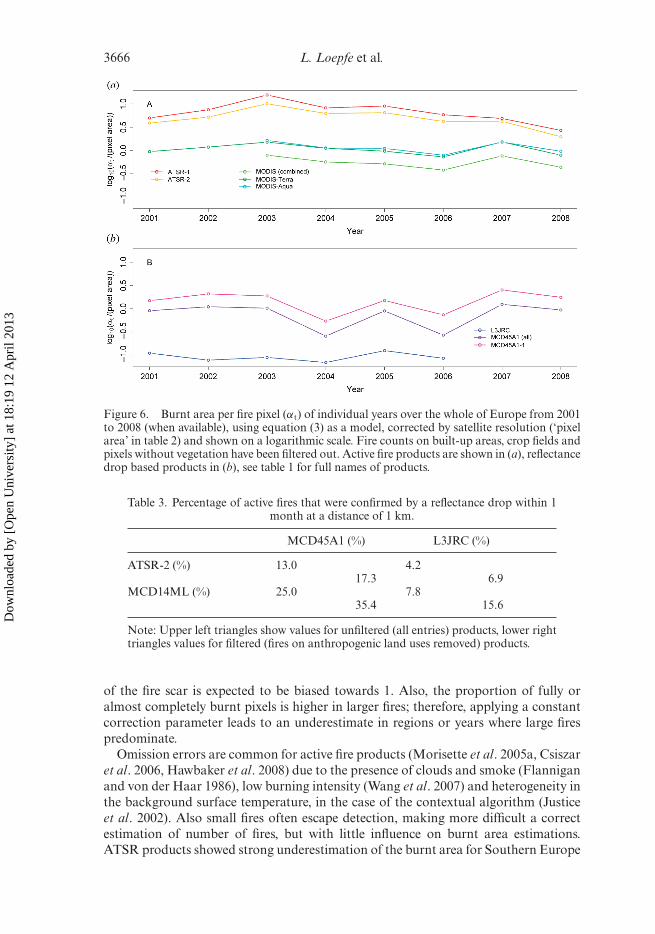
3666 L. Loepfe et al.
Figure 6. Burnt area per fire pixel (αt) of individual years over the whole of Europe from 2001to 2008 (when available), using equation (3) as a model, corrected by satellite resolution (‘pixelarea’ in table 2) and shown on a logarithmic scale. Fire counts on built-up areas, crop fields andpixels without vegetation have been filtered out. Active fire products are shown in (a), reflectancedrop based products in (b), see table 1 for full names of products.
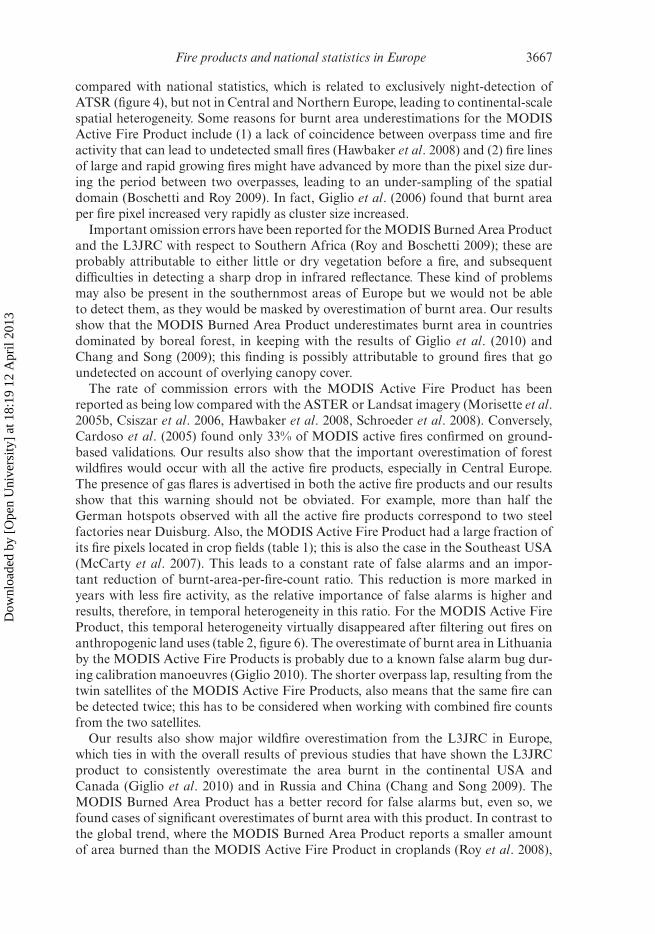
Table 3. Percentage of active fires that were confirmed by a reflectance drop within 1month at a distance of 1 km.
MCD45A1 (%) L3JRC (%)
ATSR-2 (%) 13.0 4.217.3 6.9
MCD14ML (%) 25.0 7.835.4 15.6
Note: Upper left triangles show values for unfiltered (all entries) products, lower righttriangles values for filtered (fires on anthropogenic land uses removed) products.
of the fire scar is expected to be biased towards 1. Also, the proportion of fully oralmost completely burnt pixels is higher in larger fires; therefore, applying a constantcorrection parameter leads to an underestimate in regions or years where large firespredominate.
Omission errors are common for active fire products (Morisette et al. 2005a, Csiszaret al. 2006, Hawbaker et al. 2008) due to the presence of clouds and smoke (Flanniganand von der Haar 1986), low burning intensity (Wang et al. 2007) and heterogeneity inthe background surface temperature, in the case of the contextual algorithm (Justiceet al. 2002). Also small fires often escape detection, making more difficult a correctestimation of number of fires, but with little influence on burnt area estimations.ATSR products showed strong underestimation of the burnt area for Southern Europe
Dow
nloa
ded
by [
Ope
n U
nive
rsity
] at
18:
19 1
2 A
pril
2013
Fire products and national statistics in Europe 3667
compared with national statistics, which is related to exclusively night-detection ofATSR (figure 4), but not in Central and Northern Europe, leading to continental-scalespatial heterogeneity. Some reasons for burnt area underestimations for the MODISActive Fire Product include (1) a lack of coincidence between overpass time and fireactivity that can lead to undetected small fires (Hawbaker et al. 2008) and (2) fire linesof large and rapid growing fires might have advanced by more than the pixel size dur-ing the period between two overpasses, leading to an under-sampling of the spatialdomain (Boschetti and Roy 2009). In fact, Giglio et al. (2006) found that burnt areaper fire pixel increased very rapidly as cluster size increased.
Important omission errors have been reported for the MODIS Burned Area Productand the L3JRC with respect to Southern Africa (Roy and Boschetti 2009); these areprobably attributable to either little or dry vegetation before a fire, and subsequentdifficulties in detecting a sharp drop in infrared reflectance. These kind of problemsmay also be present in the southernmost areas of Europe but we would not be ableto detect them, as they would be masked by overestimation of burnt area. Our resultsshow that the MODIS Burned Area Product underestimates burnt area in countriesdominated by boreal forest, in keeping with the results of Giglio et al. (2010) andChang and Song (2009); this finding is possibly attributable to ground fires that goundetected on account of overlying canopy cover.
The rate of commission errors with the MODIS Active Fire Product has beenreported as being low compared with the ASTER or Landsat imagery (Morisette et al.2005b, Csiszar et al. 2006, Hawbaker et al. 2008, Schroeder et al. 2008). Conversely,Cardoso et al. (2005) found only 33% of MODIS active fires confirmed on ground-based validations. Our results also show that the important overestimation of forestwildfires would occur with all the active fire products, especially in Central Europe.The presence of gas flares is advertised in both the active fire products and our resultsshow that this warning should not be obviated. For example, more than half theGerman hotspots observed with all the active fire products correspond to two steelfactories near Duisburg. Also, the MODIS Active Fire Product had a large fraction ofits fire pixels located in crop fields (table 1); this is also the case in the Southeast USA(McCarty et al. 2007). This leads to a constant rate of false alarms and an impor-tant reduction of burnt-area-per-fire-count ratio. This reduction is more marked inyears with less fire activity, as the relative importance of false alarms is higher andresults, therefore, in temporal heterogeneity in this ratio. For the MODIS Active FireProduct, this temporal heterogeneity virtually disappeared after filtering out fires onanthropogenic land uses (table 2, figure 6). The overestimate of burnt area in Lithuaniaby the MODIS Active Fire Products is probably due to a known false alarm bug dur-ing calibration manoeuvres (Giglio 2010). The shorter overpass lap, resulting from thetwin satellites of the MODIS Active Fire Products, also means that the same fire canbe detected twice; this has to be considered when working with combined fire countsfrom the two satellites.
Our results also show major wildfire overestimation from the L3JRC in Europe,which ties in with the overall results of previous studies that have shown the L3JRCproduct to consistently overestimate the area burnt in the continental USA andCanada (Giglio et al. 2010) and in Russia and China (Chang and Song 2009). TheMODIS Burned Area Product has a better record for false alarms but, even so, wefound cases of significant overestimates of burnt area with this product. In contrast tothe global trend, where the MODIS Burned Area Product reports a smaller amountof area burned than the MODIS Active Fire Product in croplands (Roy et al. 2008),
Dow
nloa
ded
by [
Ope
n U
nive
rsity
] at
18:
19 1
2 A
pril
2013
3668 L. Loepfe et al.
in Europe the MODIS Burned Area Product reports a very high fraction of fires incrop fields (table 1). For instance, the unfiltered burnt area of France in 2003 was indi-cated as just over 500 000 ha by the MODIS Burned Area Product, compared withthe mere 73 000 ha of the national statistics. More than 90% of those MODIS BurnedArea Product fire pixels lay in crop fields. In summer 2003, an exceptional heat wavein (Central) Europe caused major drought-induced vegetation dieback, especially incrop fields (Ciais et al. 2005), leading to a persistent drop in NIR-reflectance that trig-gered the MODIS Burned Area Product detection algorithm. In some areas, such asAndalusia in Spain and Puglia in Italy, this product detects large supposedly burntareas in crop fields almost every year. Again, a constant rate of false alarms could bethe reason of temporal heterogeneity in burnt-area-per-fire-count ratio, but in the caseof fire scar products, this heterogeneity was reduced to a lesser degree by filtering outfires on anthropogenic land uses.
Such non-randomly distributed overestimation and underestimation of wildfireslead to a spatial and temporal heterogeneity in the burnt-area-per-fire count. One wayof avoiding these problems is a combination of active fire and burnt area products, inwhich a pixel has to fulfil both the criteria (thermal emission and infrared reflectancedrop) to be considered burnt. A similar approach has been used by Giglio et al. (2009).In our case, this combination does not improve the results obtained with the filteredactive fire products, and entails wildfires underestimation. However, this procedureensures an almost complete absence of false alarms, which can be an important crite-rion when analysing spatio-temporal patterns of fire occurrence. The MODIS ActiveFire–MODIS Burned Area combination is also recommended when agricultural firesare to be included in the study.
5. Conclusions
Our results show important differences between different satellite-based fire mapsand national statistics, most likely a product of coarse resolution and non-randomerror distribution of satellite products. Filtering out fire pixels located on land foranthropogenic use greatly improved the coincidence between satellite products andnational statistics. Theoretically, this could be due to underestimations of rural firesin national statistics, but manual inspection showed that this difference is mainlyattributable to gas flares in industrial areas, in the case of active fire products, anddrought-induced vegetation dieback, in that of fire scar maps. This argument is rein-forced by the lower coincidence between satellite products including anthropogenicland uses. Once fires located on anthropogenic land uses are filtered out, some satelliteproducts, especially the MODIS Active Fire Product, show a high enough coincidencewith national statistics to act as a proxy for burnt area in Europe and are appropriatefor analysing spatio-temporal patterns of fire occurrence. If absence of false alarms isprioritized over total burnt area estimation or agricultural fires are to be considered,the combination of MODIS Active Fire and MODIS Burned Area products is a goodchoice.
AcknowledgementsWe thank Jordi Martinez-Vilalta for his help on this manuscript. This studywas supported by the Spanish Ministry of Science and Innovation (projectMONTES, Consolider-Ingenio 2010) and the Generalitat de Catalunya (AGAUR,SGR2009-247).
Dow
nloa
ded
by [
Ope
n U
nive
rsity
] at
18:
19 1
2 A
pril
2013
Fire products and national statistics in Europe 3669
ReferencesANDREAE, M.O. and MERLET, P., 2001, Emission of trace gases and aerosols from biomass
burning. Global Biogeochemical Cycles, 15, pp. 955–966.ARCHIBALD, S., ROY, D.P., VAN WILGEN, B.W. and SCHOLES, R.J., 2009, What limits fire? An
examination of drivers of burnt area in Southern Africa. Global Change Biology, 15, pp.613–630.
ARINO, O., SIMON, M., PICCOLONI, I. and ROSAZ, J., 2001, The ERS-2 ATSR-2 world fire atlasand the ERS-2 ATSR-2 world burnt surface atlas projects. In Proceedings of the 8thISPRS conference on Physical Measurement and Signatures in Remote Sensing, 8–12January 2001, Aussois, France.
BARBOSA, P.M., GRÉGOIRE, J. and PEREIRA, J.M.C., 1999, An algorithm for extracting burnedareas from time series of AVHRR GAC data applied at a continental scale. RemoteSensing of Environment, 69, pp. 253–263.
BELWARD, A.S., ESTES, J.E. and KLINE, K.D., 1999, The IGBP-DIS global 1-km landcover dataset DISCover – a project overview. Photogrammetric Engineering and Remote Sensing,65, pp. 1013–1020.
BOSCHETTI, L., EVA, H.D., BRIVIO, P.A. and GRÉGOIRE, J.M., 2004, Lessons to be learnedfrom the comparison of three satellite-derived biomass burning products. GeophysicalResearch Letters, 31, pp. 1–4.
BOSCHETTI, L. and ROY, D.P., 2009, Strategies for the fusion of satellite fire radiative power withburned area data for fire radiative energy derivation. Journal of Geophysical Research,114, pp. 1–10.
BOWMAN, D.M.J.S., BALCH, J.K., ARTAXO, P., BOND, W.J., CARLSON, J.M., COCHRANE,M.A., D’ANTONIO, C.M., DEFRIES, R.S., DOYLE, J.C., HARRISON, S.P., JOHNSTON,F.H., KEELEY, J.E., KRAWCHUK, M.A., KULL, C.A., MARSTON, J.B., MORITZ, M.A.,PRENTICE, I.C., ROOS, C.I., SCOTT, A.C., SWETNAM, T.W., VAN DER WERF, G.R. andPYNE, S.J., 2009, Fire in the Earth system. Science, 324, pp. 481–484.
CARDOSO, M.F., HURTT, G.C., MOORE III, B., NOBRE, C.A. and BAIN, H., 2005, Field workand statistical analyses for enhanced interpretation of satellite fire data. Remote Sensingof Environment, 96, pp. 212–227.
CARMONA-MORENO, C., BELWARD, A., MALINGREAU, J.-P., HARTLEY, A., GARCIA-ALEGRE,M., ANTONOVSKIY, M., BUCHSHTABER, V. and PIVOVAROV, V., 2005, Characterizinginterannual variations in global fire calendar using data from Earth observing satellites.Global Change Biology, 11, pp. 1537–1555.
CARVALHO, A., FLANNIGAN, M., LOGAN, K., GOWMAN, L., MIRANDA, A. and BORREGO, C.,2010, The impact of spatial resolution on area burned and fire occurrence projectionsin Portugal under climate change. Climatic Change, 98, pp. 177–197.
CHANG, D. and SONG, Y., 2009, Comparison of L3JRC and MODIS global burnedarea products from 2000 to 2007. Journal of Geophysical Research, 114, D16106,doi:10.1029/2008JD011361.
CHUVIECO, E., GIGLIO, L. and JUSTICE, C., 2008, Global characterization of fire activity:toward defining fire regimes from Earth observation data. Global Change Biology, 14,pp. 1488–1502.
CIAIS, P., REICHSTEIN, M., VIOVY, N., GRANIER, A., OGEE, J., ALLARD, V., AUBINET, M.,BUCHMANN, N., BERNHOFER, C., CARRARA, A., CHEVALLIER, F., DE NOBLET, N.,FRIEND, A.D., FRIEDLINGSTEIN, P., GRUNWALD, T., HEINESCH, B., KERONEN, P.,KNOHL, A., KRINNER, G., LOUSTAU, D., MANCA, G., MATTEUCCI, G., MIGLIETTA, F.,OURCIVAL, J.M., PAPALE, D., PILEGAARD, K., RAMBAL, S., SEUFERT, G., SOUSSANA,J.F., SANZ, M.J., SCHULZE, E.D., VESALA, T. and VALENTINI, R., 2005, Europe-widereduction in primary productivity caused by the heat and drought in 2003. Nature, 437,pp. 529–533.
CSISZAR, I.A., MORISETTE, J.T. and GIGLIO, L., 2006, Validation of active fire detection frommoderate-resolution satellite sensors: the MODIS example in northern Eurasia. IEEETransactions on Geoscience and Remote Sensing, 44, pp. 1757–1764.
Dow
nloa
ded
by [
Ope
n U
nive
rsity
] at
18:
19 1
2 A
pril
2013
3670 L. Loepfe et al.
DENNISON, P.E., 2006, Fire detection in imaging spectrometer data using atmospheric carbondioxide absorption. International Journal of Remote Sensing, 27, pp. 3049–3055.
FLANNIGAN, M.D. and VON DER HAAR, T.H., 1986, Forest fire monitoring using NOAAsatellite AVHRR. Canadian Journal of Forest Research, 16, pp. 975–982.
GIGLIO, L., 2010, MODIS collection 5 active fire product user’s guide version 2.4. Availableonline at: http://modis-fire.umd.edu/AF_usermanual.html
GIGLIO, L., DESCLOITRES, J., JUSTICE, C.O. and KAUFMAN, Y.J., 2003, An enhanced contextualfire detection algorithm for MODIS. Remote Sensing of Environment, 87, pp. 273–282.
GIGLIO, L., LOBODA, T., ROY, D.P., QUAYLE, B. and JUSTICE, C.O., 2009, An active-fire basedburned area mapping algorithm for the MODIS sensor. Remote Sensing of Environment,113, pp. 408–420.
GIGLIO, L., RANDERSON, J.T., VAN DER WERF, G.R., KASIBHATLA, P.S., COLLATZ, G.J.,MORTON, D.C. and DEFRIES, R.S., 2010, Assessing variability and long-term trends inburned area by merging multiple satellite fire products. Biogeosciences, 7, pp. 1171–1186.
GIGLIO, L., VAN DER WERF, G.R., RANDERSON, J.T., COLLATZ, G.J. and KASIBHATLA,P., 2006, Global estimation of burned area using MODIS active fire observations.Atmospheric Chemistry and Physics, 6, pp. 957–974.
GOFC-GOLD, 2009, Guidelines for authors. A sourcebook of methods and proceduresfor monitoring and reporting anthropogenic greenhouse gas emissions and removalscaused by deforestation, gains and losses of carbon stocks in forest remainingforests, and forestation. GOFC-GOLD Report version COP15-1. Available online at:http://www.gofc-gold.uni-jena.de/redd/ (accessed 25 September 2010).
HAWBAKER, T.J., RADELOFF, V.C., SYPHARD, A.D., ZHU, Z. and STEWART, S.I., 2008, Detectionrates of the MODIS active fire product in the United States. Remote Sensing ofEnvironment, 112, pp. 2656–2664.
JUSTICE, C.O., GIGLIO, L., KORONTZI, S., OWENS, J., MORISETTE, J.T., ROY, D., DESCLOITRES,J., ALLEAUME, S., PETITCOLIN, F. and KAUFMAN, Y., 2002, The MODIS fire products.Remote Sensing of Environment, 83, pp. 244–262.
KRAWCHUK, M.A., MORITZ, M.A., PARISIEN, M., VAN DORN, J. and HAYHOE, K., 2009,Global Pyrogeography: the current and future distribution of wildfire. PLoS ONE, 4,p. e5102.
LEHSTEN, V., TANSEY, K.J., BALZTER, H., THONICKE, K., SPESSA, A., WEBER, U., SMITH,B. and ARNETH, A., 2008, Estimating carbon emissions from African wildfires.Biogeosciences Discuss, 5, pp. 3091–3122.
MCCARTY, J.L., JUSTICE, C.O. and KORONTZI, S., 2007, Agricultural burning in theSoutheastern United States detected by MODIS. Remote Sensing of Environment, 108,pp. 151–162.
MIEVILLE, A., GRANIER, C., LIOUSSE, C., GUILLAUME, B., MOUILLOT, F., LAMARQUE, J.,GRÉGOIRE, J.-M. and PÉTRON, G., 2010, Emissions of gases and particles from biomassburning during the 20th century using satellite data and an historical reconstruction.Atmospheric Environment, 44, pp. 1469–1477.
MORISETTE, J.T., GIGLIO, L., CSISZAR, I. and JUSTICE, C.O., 2005a, Validation of the MODISactive fire product over Southern Africa with ASTER data. International Journal ofRemote Sensing, 26, pp. 4239–4264.
MORISETTE, J.T., GIGLIO, L., CSISZAR, I., SETZER, A., SCHROEDER, W., MORTON, D. andJUSTICE, C.O., 2005b, Validation of MODIS active fire detection products derived fromtwo algorithms. Earth Interactions, 9, pp. 1–25.
MOTA, B.W., PEREIRA, J.M.C., OOM, D., VASCONCELOS, M.J.P. and SCHULTZ, M., 2006,Screening the ESA ATSR-2 World Fire Atlas (1997–2002). Atmospheric Chemistry andPhysics, 6, pp. 1409–1424.
PAUSAS, J.G., 2004, Changes in fire and climate in the Eastern Iberian Peninsula (MediterraneanBasin). Climatic Change, 63, pp. 337–350.
Dow
nloa
ded
by [
Ope
n U
nive
rsity
] at
18:
19 1
2 A
pril
2013
Fire products and national statistics in Europe 3671
PIÑOL, J., TERRADAS, J. and LLORET, F., 1998, Climate warming, wildfire hazard, and wildfireoccurrence in Coastal Eastern Spain. Climatic Change, 38, pp. 345–357.
PONS, X., 2000, MiraMon Sistema d’Informaciò Geogràfica i Software de Teledetecciò(Bellaterra: Centre de Recerca Ecològica i Aplicacions Forestals, CREAF).
RANDERSON, J.T., VAN DER WERF, G.R., GIGLIO, L., COLLATZ, G.J. and KASIBHATLA, P.S.,2007, Global Fire Emissions Database, Version 2.1. Data set (Oak Ridge, TN: Oak RidgeNational Laboratory Distributed Active Archive Center).
ROY, D.P. and BOSCHETTI, L., 2009, Southern Africa validation of the MODIS, L3JRC,and GlobCarbon burned-area products. IEEE Transactions on Geoscience and RemoteSensing, 47, pp. 1032–1044.
ROY, D.P., BOSCHETTI, L., JUSTICE, C.O. and JU, J., 2008, The collection 5 MODIS burnedarea product – global evaluation by comparison with the MODIS active fire product.Remote Sensing of Environment, 112, pp. 3690–3707.
ROY, D.P., JIN, Y., LEWIS, P.E. and JUSTICE, C.O., 2005, Prototyping a global algorithm forsystematic fire-affected area mapping using MODIS time series data. Remote Sensing ofEnvironment, 97, pp. 137–162.
SCEPAN, J., 1999, Thematic validation of high-resolution global land-cover data sets.Photogrammetric Engineering and Remote Sensing, 65, pp. 1051–1060.
SCHROEDER, W., PRINS, E., GIGLIO, L., CSISZAR, I., SCHMIDT, C., MORISETTE, J. andMORTON, D., 2008, Validation of GOES and MODIS active fire detection productsusing ASTER and ETM+ data. Remote Sensing of Environment, 112, pp. 2711–2726.
SMITH, R., ADAMS, M., MAIER, S., CRAIG, R., KRISTINA, A. and MALING, I., 2007, Estimatingthe area of stubble burning from the number of active fires detected by satellite. RemoteSensing of Environment, 109, pp. 95–106.
TANSEY, K., GRÉGOIRE, J., DEFOURNY, P., LEIGH, R., PEKEL, J., VAN BOGAERT, E.and BARTHOLOMÉ, E., 2008, A new, global, multi-annual (2000–2007) burntarea product at 1 km resolution. Geophysical Research Letters, 35, L01401, doi:10.1029/2007GL031567.
TRIGO, R.M., PEREIRA, J.M.C., PEREIRA, M.G., MOTA, B., CALADO, T.J., DACAMARA, C.C.and SANTO, F.E., 2006, Atmospheric conditions associated with the exceptional fireseason of 2003 in Portugal. International Journal of Climatology, 26, pp. 1741–1757.
VAN DER WERF, G.R., RANDERSON, J.T., GIGLIO, L., COLLATZ, G.J., KASIBHATLA, P.S. andARELLANO JR., A.F., 2006, Interannual variability in global biomass burning emissionsfrom 1997 to 2004. Atmospheric Chemistry and Physics, 6, pp. 3423–3441.
VERAVERBEKE, S., LHERMITTE, S., VERSTRAETEN, W.W. and GOOSSENS, R., 2010, The tem-poral dimension of differenced Normalized Burn Ratio (dNBR) fire/burn severitystudies: the case of the large 2007 Peloponnese wildfires in Greece. Remote Sensing ofEnvironment, 114, pp. 2548–2563.
VIEGAS, D.X., 2006, Forest fires in Portugal in 2005: an overview. Available onlineat: http://www.fire.uni-freiburg.de/iffn/iffn_34/03-IFFN-34-Portugal-Country-Report-2.pdf (accessed 25 September 2010).
WANG, W., QU, J.J., HAO, X., LIU, Y. and SOMMERS, W.T., 2007, An improved algorithm forsmall and cool fire detection using MODIS data: a preliminary study in the southeasternUnited States. Remote Sensing of Environment, 108, pp. 163–170.
Dow
nloa
ded
by [
Ope
n U
nive
rsity
] at
18:
19 1
2 A
pril
2013