Acoustruments: Passive, Acoustically-Driven, Interactive Controls for ...

1
COMPARISON OF AN ACOUSTICALLY OPTIMIZED AND AN AERODYNAMICALLY OPTIMIZED EXIT GUIDE VANE
T. Selic, A. Marn, F. Schönleitner, M.Hoeger¹, D. Broszat¹, F. Heitmeir
Institute for Thermal Turbomachinery and Machine Dynamics, Graz, Austria
¹MTU Aero Engines AG, Munich, Germany
ABSTRACT
Within previous EU projects, possible modifications to the engine architecture have been
investigated, that would allow for an optimized aerodynamic or acoustic design of the exit
guide vanes (EGV) of the turbine exit casing (TEC). However, the engine weight should not be
increased and the aerodynamic performance must be at least the same. In addition, the effect
onto the aeroacoustic field downstream of the EGV needs to be considered.
This paper compares two different EGV designs. The first design is an acoustically
optimized EGV whereas the second EGV is optimized strictly for aerodynamics. The
comparison of the two different EGV configurations is done for an operating condition similar
to the engine operation point approach. The measurements were conducted in the subsonic
test turbine facility (STTF) at the Institute for Thermal Turbomachinery and Machine
Dynamics, Graz University of Technology. The inlet guide vanes, the low pressure turbine
(LPT) stage, and the EGVs have been designed by MTU Aero Engines. The flow field of the
two different designs is being compared, and the difference in aerodynamical losses is show
using 5-Hole probes as well as static surface pressure tabs and oil flow visualisation. In
addition, aeroacoustic investigations were performed using an array of 24 wall-flush mounted
microphones was used to acquire the sound field in the exhaust duct.
NOMENCLATURE
STTF Subsonic Test Turbine Facility EGV Exit guide vane
IGV Inlet Guide Vane LPT Low pressure Turbine
TE Trailing edge TEC Turbine exit casing
SST Shear Stress CDA Controlled diffusion airfoil
𝜔 1/s Angular velocity Ma Mach number
p Pa Pressure A Complex amplitudes
k Integer number; k=-1,0,1,... f Modal shape factor
k Axial wave number SPL dB Sound power level
𝜁 Total pressure loss coefficient i √(−1) V Number of vanes B Number of blades
n Radial mode order m Circumferential mode order
t s time
INTRODUCTION
For state-of-the art design of EGVs structural requirements are more important than the
aerodynamical and/or the acoustical point of view. Today, the EGVs have to support the rear
bearing and the engine mount and therefore they are relatively thick and rigid. However, the EGVs
Proceedings of
11th European Conference on Turbomachinery Fluid dynamics & Thermodynamics
ETC11, March 23-27, 2015, Madrid, Spain
OPEN ACCESS
Downloaded from www.euroturbo.eu Copyright © by the Authors

2
also have to fulfill aerodynamic aspects. Their main aerodynamic purpose is to reduce swirl in the
flow. The goal is to generate a homogeneous LPT exit flow by transforming swirl into thrust for
highest propulsive efficiencies (Koch, et al., 2012). If structural requirements are of minor interest,
for example, if the rear bearing and the engine mount is moving forward near the turbine center
frame supported by the TCF struts, an optimisation of the EGVs may lead to a highly efficient low
Reynolds number EGV (Schreiber, et al., 2004) which in turn enables the LPT designer to increase
the loading of the stage. However, the EGVs downstream of a last stage LPT have to have a large
operating range in order to provide a near axial outflow for all operating points of the turbine.
Ashpis (Ashpis, 1997) has shown that the operating Reynolds number for the LP turbine can drop
below 100000 at high-altitude cruise condition, whereas at ground condition Reyolds number as are
as high as 1000000. Therefore, its operating range is significantly larger than that of a regular
compressor vane. The number of investigations on modern low Reynolds number turbine exit guide
vanes are limited e.g. Sonoda et al. (Sonoda, et al., 2004), Sonoda and Schreiber (Sonoda &
Schreiber, 2007), and Hjärne (Hjärne, 2007). Koch et al. (Koch, et al., 2012) investigated a cross
section at 33% blade height of the acoustically optimized EGVs used in this investigation in a linear
cascade as a baseline design. They experimentally and numerically showed that an
aerodynamically optimized EGV meets all requirements for an EGV. The turning was similar to the
baseline design and for the entire operating range the outlet flow angle was nearly axial. Further,
Koch et al. (Koch, et al., 2012) achieved a significant loss reduction for the optimized airfoil and a
slightly higher pressure rise due to lower losses at a reduced wetted surface.
This paper compares two different EGV configurations at a typical off design point identical to
approach flight condition. The first EGV design is a CDA with a focus on the aerodynamic
optimization of the exit guide vane. These profiles have already been investigated by (Koch, et al.,
2012) for its performance under different incidence angle´s in a linear cascade. The second EGV
design was intended to achieve a low sound power level for the given operating point. This has
already been successfully shown by Broszat et.al (Broszat, et al., 2012) (Broszat, et al., 2013).
Experimental Facility and Instrumentation
Test Facility
The Institute for Thermal Turbomachinery and Machine Dynamics at Graz University of
Technology operates a 3MW compressor station in order to supply a couple of test facilities
continuously with pressurized air. In the described subsonic test facility the maximum pressure ratio
is limited to 2 due to the inlet spiral casing and the maximum mass flow rate is 15 kg/s at a
temperature at stage inlet of 100 C. This inlet temperature can be adjusted by coolers within a wide
range. The pressurized air enters the facility through a spiral inlet casing where the flow turns into
axial direction. Within this spiral inlet casing the front bearing of the overhung-type turbine shaft is
mounted. The shaft is coupled to a water brake, whose cooling water cycle is connected to the re-
cooling plant of the institute. In order to provide well defined and uniform inflow conditions a de-
swirler together with a perforated plate is located upstream of the stage inlet. Further, upstream of
the stage (and downstream of the perforated plate) inlet guide vanes can be found that should
simulate additional wakes of other upstream low pressure turbine stages. The air leaves the rig
through an acoustic measurement section, supporting struts, exhaust casing, and the exhaust stack to
ambient. A detailed description of the STTF is given in (Moser, et al., 2007).
Turbine Stage and EGVs
The aerodynamic design of the low pressure turbine stage, IGVs as well as the EGVs was
performed by MTU Aero Engines. Considerable effort was put into the adjustment of relevant
model parameters to reproduce the full scale LPT situation. The turbine diameter is approximately

3
half of that of a commercial aero engine LPT and therefore the rig is operated at higher rotational
speeds. A meridional section of the rig is shown in Figure 1. The cross section for the inverse cut-
off EGV design as well as the aerodynamically optimized EGV design can be seen in Figure 2.
These two vanes only have a very small difference in terms of axial chord and therefore the rig-
crossection is almost identical for both vanes. The bladings are not drawn to scale. The rig is
characterized by a high aspect ratio unshrouded rotor followed by the EGVs of the TEC. Relevant
geometry parameters can be seen in the upper half of Table 1. For this investigation two different
set-ups have been tested: an acoustically optimized EGV with a higher number of vanes and an
EGV focused on aerodynamic performance. The leading edge is at the same axial position for both
configurations. Details on the EGVs can be found in Table 1.
The acoustically optimized EGV is a scaled down version of a modern low aspect ratio EGV as
used in current engine designs. The number of vanes and the chord length has been adapted in order
to use the so called “inverse-cut off” corridor. This procedure including a comparison between the
original EGV and the acoustically optimized EGV can be found in Broszat et.al (Broszat, et al.,
2012).
The aerodynamically optimized airfoil was designed applying a multi-point optimization
process to the 33% span profile section of the original low aspect ratio EGV. The optimization
process and the results for a 2D-section can be seen in Koch et al. (Koch, et al., 2012). The EGV
has been designed for the required working range using a loss criterion of 1.5 times minimum loss
(compared to e.g 2 times minimum loss requirement suggested in the NASA) to take into account
possible real engine effects as e.g. manufacturing tolerances and engine aging.
Figure 1: Meridional section of the STTF
Figure 2: Meridional section of the STTF for the inverse cutoff EGV as well as the
aerodynamically optimized EGV including measurement planes
EGV

4
Operating Conditions
Based on the intended use of the LPT rig for both acoustic and aerodynamic investigations, the
main operating points are selected according to the typical noise certification points. They have
been defined using an aero design point of the last stage LPT, derived from current LPT design
practice using scaling along reduced speed, reduced mass flow (both referred to 288.15 K and
101325 Pa) and pressure ratio. For this investigation the operating point approach was chosen. The
Reynolds number of the EGVs is defined using the midspan conditions at rotor exit as well as the
axial chord of the vanes. The right half of Table 1 shows the operating conditions. These conditions
are valid for both EGVs. The Reynolds number is defined using the axial chord of the EGV. Since
the difference in axial chord for both EGV configurations is only 5%, the Reynolds number given is
valid for both EGVs.
Table 1 Geometry details and operating conditions
Geometry details Operating conditions
Number of blades/vanes Reduced mass flow 6.94kg/s
IGV/Stator/Rotor/ 83/96/72 Reduced rotational speed 3653rpm
EGV inverse cut-off (inv.) >40 Stage pressure ratio 1.16
EGV high loading (hl.) 32 Stage total inlet temperature 100 C
EGV Reynolds number 130000
Rotor tip gap to blade height ratio 1.0%
EGV Hub to tip radius ratio ≈2/3
Instrumentation
Five-hole-probes (IST, RWTH Aachen) with a probe head of 2.5 mm diameter were applied in
measurement plane C and D (see Figure 1b). The probes are calibrated for Mach numbers between
0.1 and 0.8, yaw angles between –20 deg and +20 deg, pitch angles between –16 deg and +20 deg.
Negative values of the yaw angle indicate a counter-rotating flow and negative values of the pitch
angle indicate the flow direction towards the hub. The correlation between the calibration
characteristics and the value to be measured is given by a multi- parameter approximation.
The axial positions of measurement planes can be seen in Figure 2. Plane C is located 60% axial
rotor blade chord length downstream of the rotor TE. The plane D0 is located 55% axial chord
length downstream of the EGV trailing edge (TE) for both configurations. The measurement grid in
each plane consists of 21 points in radial direction for both EGVs and 16 points in circumferential
direction for inverse cut-off TEC/ 19 points for the aerodynamically optimized EGV. The grid
covers one EGV pitch and about 95% passage height. Traversing was done along radial lines. Static
pressure taps are located at several axial positions along the suction and pressure surface at 20%,
30%, 50%, and 80% channel height.
In order to estimate the sound power propagating downstream 12 flush mounted condenser
microphones (1/4”) at the hub and 12 at the casing are located in the 360deg rotatable acoustic
measurement section. The distance between the EGV trailing edge and the first microphone is
approximately 280mm. In addition to these microphones, 1 microphone was mounted at a fixed
position downstream of the EGV’s TE as a reference. The complete sound field was detected at the
hub and the casing by traversing the section 360deg in steps of 2deg. Some more detailed
information about the acoustic measurement section is given in (Moser, et al., 2009).

5
Acoustic Measurement and Modal Analysis
A decomposition of a variable in time and space was provided by Tyler and Sofrin (Tyler &
Sofrin, 1962). The circumferential (azimuthal) mode orders excited by the relevant airfoil
interactions can be calculated as follows:
With the vane and blade counts B and V, respectively, the harmonic order n, and the integer
index k as well as an additional similar equation describing the scattering of acoustic modes when
interacting with a following vane.
In order to describe the sound generating mechanisms, Tyler and Sofrin wrote the pressure
fluctuations at any circumferential positions downstream of the compressor stage as a sum of
harmonics. The theoretical model they proposed has been verified by numerous aeroacoustic
experimental investigations and it is also valid for turbines (e.g. Moser et al. (Moser, et al., 2009)).
The theory of the acoustic data analysis used in this work is well described in Enghardt et al.
(Enghardt, et al., 2001) and Enghardt et al. (Enghardt, et al., 2005). In cylindrical coordinates and
for a single frequency component 𝝎 the solution of the wave equation is given by a linear
superposition of modal terms as can be seen in the equation below.
For hard-walled acoustic boundary conditions the modal shape factor is reported in Tapken et al.
(Tapken & Enghardt, 2006). Tapken et al. also describe the calculation of radial mode amplitudes
𝐀𝐦𝐧± as an inverse problem of the equation above, which is also applied in this work.
Results and Discussion
EGV Inlet flow
The EGV inlet conditions are shown in Figure 3, where the Mach number as well as the yaw
angle upstream of the vane is shown. Structures belonging to the rotor appear as circumferential
bands that are modulated by the structures from the upstream stator. The figure shows a region of
low Mach number close to the casing that is due to the tip leakage flow present for this
configuration. This can also be identified via the strong under turning that can be seen in the yaw
angle distribution in Figure 4 where the circumferentially averaged values for Mach number and
yaw angle are shown for both EGV geometries .The radial structures visible are due to the wakes of
the upstream stator. Close to the hub the effect of the secondary flows dominating this region can be
identified. A small variation of the inlet conditions for the two EGVs can be identified from Figure
4.
− −1 1 (1.)
− −1 1 (2.)
( ) ∑ ∑( ±
± )
(3.)

6
Figure 3: Mach number and yaw angle upstream of the EGV
Figure 4: Circumferentially averaged Mach number and yaw angle
Oil Flow Visualisation
The following section shows the evolution of the flow within the vane passage. A mixture of
motor oil and titanium-oxide is used to cover the endwalls as well as the suction and pressure side.
Attention was paid on reaching the operation point as fast as possible to avoid run up effects. The
operating point was held for about 2 hours. The shut-down procedure was again as fast as possible
in order to protect the flow structures from being vanished. Figure 5 and Figure 6 present the oil
flow visualization for the inverse cut-off EGV, whereas Figure 7 and Figure 8 present the
aerodynamically optimized geometry.
A region of low shear stress (L-SST) on the suction side is visible for both configurations up to
about 80% channel height. Above 80% this region cannot be seen anymore. Both configurations
show radial inward flow on the suction side at the casing and a radial outward flow at the hub. This
is due to the cross passage flow rolling up into the upper and lower passage vortex. When
comparing the suction side of both EGVs the radial inward flow is stronger for the high loaded
EGV. Another region of low shear stress can be identified at the leading pressure side of the inverse
0.0
0.1
0.2
0.3
0.4
0.5
0.6
0.7
0.8
0.9
1.0
0.00 0.10 0.20 0.30
Re
lati
ve C
han
ne
l He
igh
t [-
]
Mach number
Inv. Cut-Off EGV
High LiftEGV
0.0
0.1
0.2
0.3
0.4
0.5
0.6
0.7
0.8
0.9
1.0
-40 -30 -20 -10 0 10 20 30 40
Re
lati
ve C
han
ne
l He
igh
t [-
]
Yaw Angle [deg]
Inv. Cut-OffEGV
High Lift EGV
10 deg 0.1

7
cutoff EGV. In addition to that, a vertical structure (V) can is located at the casing close to the
leading edge of the vane. This structure can be an effect of the untypical rotor tip gap present in this
rig, that would not occur downstream of a LPT with shroud.
Figure 5: Pressure side (left) and suction side (right) of the inverse cutoff EGV
Figure 6: casing (left) and hub (right) of the inverse cutoff EGV
At the endwalls the cross passage flow is clearly visible for both of the EGVs (Figure 6 and
Figure 8). The cross passage gradient pushes the fluid towards the pressure side of the vane and
promotes the formation of a corner separation on the suction side.
The pressure side of the high loaded EGV a region of low shear stress at approximately 25%
axial chord reaching from the hub to approximately 80% span marked with a dotted line on the left
side of Figure 7. The reason for this region of low shear stress is unknown. The vane pressure
distribution shown later does not show any evidence of a separation bubble or similar effects that
would explain a behavior leading to a region of low shear stress explaining an accumulation of oil
in this particular region.

8
Figure 7: Pressure side (left) and suction side (right) of aerodynamically optimized EGV
Figure 8: casing (left) and hub (right) of the aerodynamically optimized EGV
Surface Pressure Distribution
The static pressure coefficient for the vane surface is calculated according to the following
equation using static wall pressure tabs.
The subscript in equation 4 relates to the local position and C refers to the measurement plane C
at EGV inlet. Figure 9 shows the static pressure coefficient distribution at 30% span. For both
setups the chord length is given in percent. Considering that fact it is clear that the fluid undergoes a
steeper adverse pressure gradient from peak suction to the TE. The same pressure rise has to be
achieved in a shorter vane. While the high lift vane shows an increase in overall pressure difference
between suction and pressure side, the maximum velocity at suction peak is lower than for the
inverse cutoff EGV.
− −
(4.)
L-SST

9
Figure 9: Pressure distribution at 30% (left) and 80% (right) span
The influence of the tip leakage flow can be seen when looking at the pressure distribution at
80% span. Due to the difference in yaw angle the stagnation point moves towards the pressure side
of the vane. The design of the high lift EGV shows a lower loading for this particular reason,
whereas the inverse cutoff EGV shows a very strong suction peak at approximately 35% chord.
EGV Outlet flow – Plane D0
The following section shows the presents the flow-field downstream of the EGV. The plane D0
is located 55% axial chord downstream of the TE of the vane. Figure 10 shows the Mach number
(left) and yaw angle distribution (right) for the inverse-cutoff EGV. From the Mach number
distribution the wake can clearly be identified as a radial region of low flow speed. Close to the hub
and casing two distinct low Mach regions can be identified. The region close to the casing can be
associated with the tip leakage flow from the upstream LPT stage. This structure can also be
identified from the yaw angle distribution in the right of Figure 10 where a region of positive yaw
angle that is due to the under-turning of the rotor in the tip leakage region can be identified as a
region of positive yaw angle. Another small vertical structure can be identified close to the suction
side endwall corner of the vane. This is a result of the horseshoe vortex of the vane interacting with
the tip leakage flow. The leakage flow causes a downwash on the vane resulting in said vertical
structure as explained in (Selic, et al., 2012). Close to the hub, another region of low Mach number
can be identified that is due to the corner separation that occurs in this particular region of the EGV
as well as the hub secondary flow occurring in this region.
The flow field in plane D0 for the aerodynamically optimized EGV can be seen in Figure 11.
The influence of the tip leakage flow can again be identified by the low Mach region as well as the
region of positive yaw angle close to the casing. Close to the hub, the secondary flow due to the
pressure gradient of the vane can be seen. In addition, one is still able to identify the traces of the
upstream stator in the flow-field downstream of the EGV. These traces can be identified by the
leaned regions of low Mach number that can be seen in the midspan region where the 2d-flow is
dominant. This can also identified in Figure 10 but due to the higher number of vanes the structures
are easier identifiable in Figure 11.
-50.000
-40.000
-30.000
-20.000
-10.000
0.000
10.000
0 50 100
Cp
/|C
pm
|
Axial Chord Length [% ]
30% span
High Lift TEC SS
High Lift TEC PS
Inv. Cut-Off TEC SS
Inv. Cut-Off TEC PS-1.00E+01
-8.00E+00
-6.00E+00
-4.00E+00
-2.00E+00
0.00E+00
2.00E+00
4.00E+00
0 50 100
Cp
/|C
pm
|
Axial Chord Length [% ]
80% span

10
Figure 10: Mach number (left) and yaw angle (right) distribution inverse cut-off EGV
When comparing the flow field of the two EGVs the secondary flow close to the hub is less
pronounced for the inverse cut-off EGV. This is due to the fact that the aerodynamically optimized
EGV consists of fewer vanes, therefore has to provide a higher loading in order to achieve the same
deflection. This results in stronger secondary flows as can be seen when comparing Figure 11 and
Figure 10.
Figure 11: Mach number (left) and yaw angle (right) distribution high loaded EGV
Loss Estimation
Equation 5 gives a rough estimation of the total pressure loss coefficient from plane C upstream
of the EGVs to plane D downstream of the EGVs. The total pressure has been mass averaged by
means of the five-hole-probe data.
Table 2 compares the total pressure loss of both configurations. The values have been
normalized with the total pressure loss coefficient of the inverse cutoff EGV in Plane D0. The table
also shows the total pressure loss in plane D that is not presented in this paper. It can be seen that
the high loading EGV reduces the total pressure loss in plane D0 by 40% with respect to the total
pressure loss of the inverse cutoff EGV. Between plane D0 and D only mixing takes place,
𝜁 −
−
(5.)
11
increasing the total pressure loss by a further 34% for the inverse cutoff EGV and 39% for the high
loading configuration.
Table 2 Total pressure loss
Total pressure loss 𝛇
𝛇𝐫𝐞𝐟
Configuration C-D0 C-D
Inverse Cut-Off TEC 1.00 1.34
High Loading EGV 0.61 0.85
Sound Power Level
Table 3 shows the azimuthal interaction mode orders calculated according the equation of Tyler
and Sofrin. According to their formula the modes propagable are +10 from the rotor/IGV interaction
as well as the mode m=-8, a rotor/EGV interaction for the high loading EGV.
Table 3 Airfoil interaction modes m at 1 BPF
Configuration IGV-Rotor Vane-Rotor Rotor-TEC
Inv. Cut-Off +11 Cut-Off Cut-Off
High Loading +11 Cut-Off -8
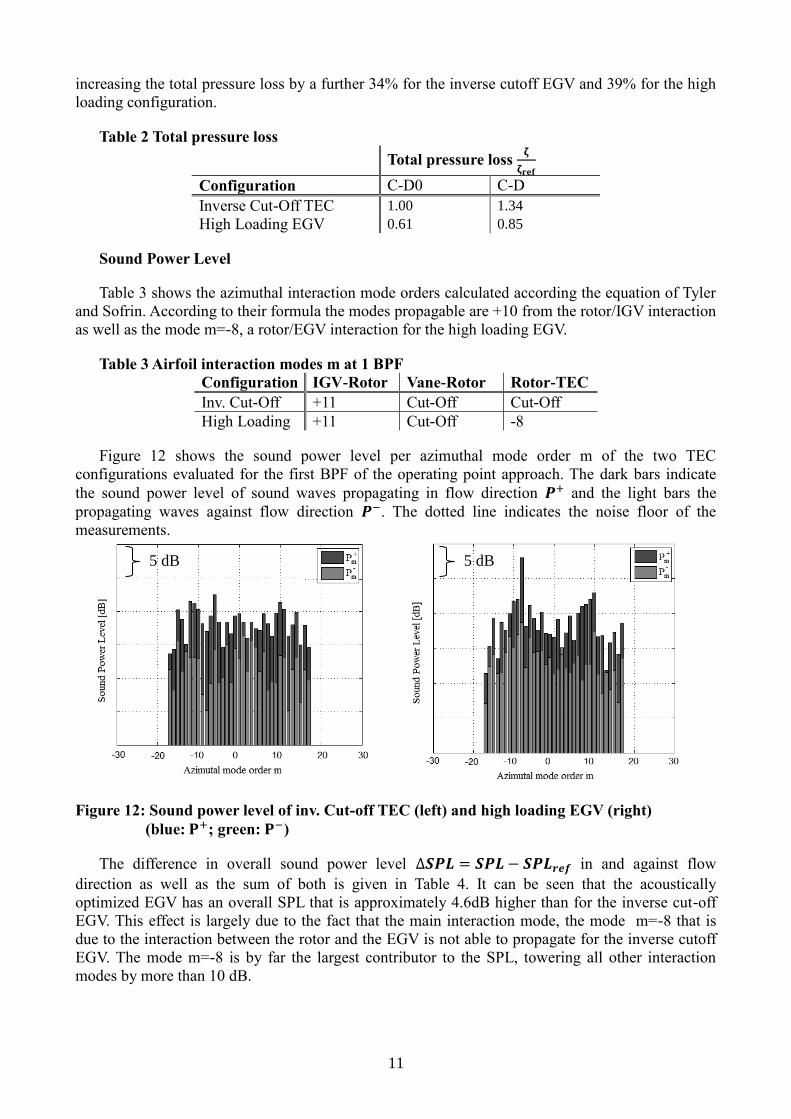
Figure 12 shows the sound power level per azimuthal mode order m of the two TEC
configurations evaluated for the first BPF of the operating point approach. The dark bars indicate
the sound power level of sound waves propagating in flow direction 𝑷+ and the light bars the
propagating waves against flow direction 𝑷 . The dotted line indicates the noise floor of the
measurements.
Figure 12: Sound power level of inv. Cut-off TEC (left) and high loading EGV (right)
(blue: 𝐏+; green: 𝐏 )
The difference in overall sound power level ∆𝑺𝑷𝑳 𝑺𝑷𝑳 − 𝑺𝑷𝑳𝒓𝒆𝒇 in and against flow
direction as well as the sum of both is given in Table 4. It can be seen that the acoustically
optimized EGV has an overall SPL that is approximately 4.6dB higher than for the inverse cut-off
EGV. This effect is largely due to the fact that the main interaction mode, the mode m=-8 that is
due to the interaction between the rotor and the EGV is not able to propagate for the inverse cutoff
EGV. The mode m=-8 is by far the largest contributor to the SPL, towering all other interaction
modes by more than 10 dB.
5 dB 5 dB

12
Table 4 Overall sound power level change for 1 BPF
∑𝑆𝑃𝐿+ ∑𝑆𝑃𝐿 ∑𝑆𝑃𝐿±
Inv. Cut-off EGV 0 [dB] 0 [dB] 0 [dB]
High loaded EGV +4.6 [dB] +3.0 [dB] 5.0 [dB]
CONCLUSIONS
A comparison of two different EGV designs for a LPT has been shown within this paper. The
two geometries have different approaches: the inverse-cutoff EGV focuses on minimizing the sound
power level of the LPT exit flow, whereas the so called high loading EGV focuses on aerodynamic
loss optimization, resulting in different vane numbers for both configurations.
Comparing the aerodynamical effects of the EGVs it can be seen that the resulting flow field of
the aerodynamically optimized EGV has a 39% lower total pressure loss for the EGV, though it has
to be taken into account, that the difference in wetted area is approximately 30% for the two
geometries. The flow field itself shows similar effects for both geometries, yet due to the fact that
the high lift EGV has a larger vane loading, the effects of secondary flows are more distinct for this
design.
In terms of acoustic SPL of the resulting flow field, the inverse cutoff EGV results in a 4.6 dB
lower sound power level. This is a result of the fact that the main interaction mode between the
rotor and the EGV according to the formula of Tyler and Sofrin doe propagate for the
aerodynamically optimized EGV but not for the inverse cut-off EGV. This mode m=8 that is able to
propagate causes this large difference in SPL.
ACKNOWLEDGEMENTS
The authors would like to thank H.P. Pirker and E. Göttlich for operating the compressor station.
Also Ulf Tapken, Mirko Spitalny and Lars Enghardt from the DLR Institute of Propulsion
Technology, Engine Acoustic Department, are gratefully acknowledged for supporting the acoustic
data evaluation. Further, the EU project VITAL (AIP4-CT-2004-012271) is acknowledged in which
2 TEC configurations have been designed, manufactured and operated.
This work has been carried out in the framework of the German Aeronautical Research Program
(LuFo) within the joint research project MASSIF-EeffkT (“Maßnahmen zur Schallpegelsenkung im
Flugverkehr-Effektive Triebwerkslärmreduzierung = Measure for aircraft noise reduction - effective
engine noise reduction). The support of the German Federal Ministry of Economics and
Technologies (BMWi) is gratefully acknowledged.
Bibliography Ashpis, D., 1997. The NASA Low-Pressure Turbine Flow Physics Program, Minnowbrook II:
Workshop on Boundary Layer Transition in Turbomachines.
Broszat, D., Selic, T. & Marn, A., 2012. Verification of the Inverse Cut-off Effect in a
Turbomachinery Stage Part 1 - Numerical Results. Colorado Springs, Colorado, AIAA-2012-2306
Broszat, D., Selic, T. & Marn, A., 2013. Verification of the Inverse Cut-off Effect in a
Turbomachinery Stage Part 2 - Comparison to experimental results. Berlin, Germany, AIAA-2013-
2103
Enghardt, L., Tapken, U., Koronow, O. & Kennepohl, F., 2005. Acoustic Mode Decomposition of
Compressor Noise Under Consideration of Radial Flow Profiles, AIAA-2005-2833

13
Enghardt, L. et al., 2001. Turbine Blade/Vane Interaction Noise: Acoustic Mode Analysis Using In-
Duct Sensor Arrays, Paper No. AIAA-2001-2153
Hjärne, J., 2007. Turbine Outlet Guide Vane Flows. Göteborg: Chalmers University of Technology.
PhD Thesis
Koch, H., Hoeger, M. & Kozulovic, D., 2012. Outlet Guide Vane Airfoil For Low Pressure Turbine
Configurations. New Orleans, AIAA-2012-2979
Moser, M., Kahl, G., Kuhlanek, G. & Heitmeir, F., 2007. Construction of a subsonic test turbine
facility for experimental investigations of sound generation and propagation for low pressure
turbines. Beijin, Paper No. ISABE-2007-1366,
Moser, M., Tapken, U., Enghardt, L. & Neuhaus, L., 2009. An Investigation of Low Pressure
Turbine Blade-Vane Interaction Noise: Measurements in a 1.5-Stage Rig. Proceedings of the
Institution of Mechanical Engineers, Part A: Journal of Power and Energy, Issue 223(6), pp. 687-
695.
Schreiber, H.-A., Steinert, W., Sonoda, T. & Arima, T., 2004. Advanced Hig-Turning Compressor
Airfoils for Low Reynolds Number Condition - PartII: Experimental and Numerical Analysis.
Journal of Turbomachinery, Volume 126.
Selic, T., Lengani, D., Marn, A. & Heitmeir, F., 2012. Aerodynamic Effects of an unshrouded low
pressure turbine on a low aspect ratio exit guide vane. Copenhagen, Denmark, ASME Paper No.
GT2012-68981
Sonoda, T. & Schreiber, H.-A., 2007. Aerodynamic Characteristics of Supercritical Outlet Guide
Vanes at Low Rynolds Number Conditions. Journal of Turbomachinery, Volume 129., pp.694-704
Sonoda, T. et al., 2004. Advanced High Turning Compressor Airfoils for Low Reynolds Number
Conditions - Part I: Design and Optimization. Journal of Turbomachinery, Volume 126., pp 350-
359
Tapken, U. & Enghardt, L., 2006. Optimisation of Sensor Arrays for Radial Mode Analysis in Flow
Ducts, Cambridge, MA (USA), AIAA-2006-2638
Tyler, J. & Sofrin, T., 1962. Axial Flow Compressor Noise Studies. SAE Transactions, Issue 70, pp.
309-332.


![An Acoustically-Linked Deep-Ocean Observatory · data rates (~600 bps) and near-real time uplink capability via Iridium satellite data link [5]. The acoustically-linked observatory](https://static.fdocuments.us/doc/165x107/5e7a34ee4b8a1d005f5223d6/an-acoustically-linked-deep-ocean-observatory-data-rates-600-bps-and-near-real.jpg)


![2005 An Acoustically-Linked Deep-Ocean Observatory · data rates (-600 bps) and near-real time uplink capability via Iridium satellite data link [5]. The acoustically-linked observatory](https://static.fdocuments.us/doc/165x107/5e7a34ee4b8a1d005f5223d7/2005-an-acoustically-linked-deep-ocean-observatory-data-rates-600-bps-and-near-real.jpg)