Comparison of air kerma and absorbed dose to water ...I)/EUROMET-RI(I... · Comparison of air kerma...
100
Final report EURAMET project 813 1/46 Comparison of air kerma and absorbed dose to water measurements of 60 Co radiation beams for radiotherapy Report on EUROMET project no. 813, identifiers in the BIPM key comparison database (KCDB) are EUROMET.RI(I)-K1 and EUROMET.RI(I)-K4 I. Csete* (a) , A. G. Leiton (b) , V. Sochor (c) , A. Lapenas (d) , J.-E Grindborg (e) , I. Jokelainen (f) , H. Bjerke (g) , J. Dobrovodsky (h) , A. Megzifene (i) , C.J. Hourdakis (j) , R. Ivanov (k) , B. Vekic (l) , J. , Kokocinski (m) , J. Cardoso (n) , L.Buermann (o) , W. Tiefenboeck (p) G. Stucki (q) , E. van Dijk (r) , M. P. Toni (s) , R. Minniti (t) , J. P. McCaffrey (u) , C. N. M. Silva (v) , I. Kharitonov (w) , D Webb (x) , M. Saravi (y) , F. Delaunay (z) (a) National Office of Measures (OMH) (pilot laboratory and corresponding author), Hungary (* The new name is MKEH from 1 January 2007) (b) Research Centre for Energy, Environment and Technology (CMRI-CIEMAT), Spain (c) Czech Metrology Institute(CMI), Czech Republic (d) Latvian National Metrology Center (LNMC-RMTC), Latvia (e) Swedish Radiation Protection Authority (SSI), , Sweden (** The new name is Swedish Radiation Safety Authority SSM) (f) Radiation and Nuclear Safety Authority (STUK), Finland (g) Norwegian Radiation Protection Authority (NRPA), Norway (h) Slovak Institute of Metrology (SMU), Slovakia (i) International Atomic Energy Agency (IAEA), Vienna (j) Hellenic Atomic Energy Committee (HAEC-HIRCL), Greece (k) National Centre of Metrology (NCM), Bulgaria ( The new name is BIM from September 2007) (l) Rudjer Boskovic Institute (IRB),Croatia (m) Central Office of Measures (GUM), Poland (n) Institute for Nuclear Technology (ITN-LMRIR), Portugal (o) Physikalisch Technische Bundesanstalt (PTB), Germany (p) Bundesamt für Eich und Vermesungswesen (BEV), Austria (q) Bundesamt für Metrologie (METAS), Switzerland (r) NMi Van Swinden Laboratorium (NMi), The Netherlands (The new name from 1 March 2009 is VSL) (s) ENEA-CR Istituto Nazionale di Metrologia delle Radiazioni Ionizzanti (ENEA), Italy (t) National Institute of Standards and Technology (NIST), USA (u) National Research Council Canada (NRC), Canada (v) National Metrology Laboratory of Ionizing Radiation (LNMRI-IRD), Brazil (w) D. I. Mendeleyev Institute for Metrology (VNIIM), Russia (x) Australian Radiation Protection and Nuclear Safety Agency (ARPANSA), Australia (y) National Atomic Energy Commission (CNEA-CAE), Argentina (z) Laboratoire National Henri Becquerel (LNE-LNHB), France Metrologia 47 (2010) Tech. Suppl. 06012
Transcript of Comparison of air kerma and absorbed dose to water ...I)/EUROMET-RI(I... · Comparison of air kerma...

Final report EURAMET project 813 1/46
Comparison of air kerma and absorbed dose to water measurements of 60Co radiation beams for radiotherapy
Report on EUROMET project no. 813, identifiers in the BIPM key comparison database (KCDB) are EUROMET.RI(I)-K1 and EUROMET.RI(I)-K4
I. Csete* (a), A. G. Leiton(b) , V. Sochor(c) , A. Lapenas(d), J.-E Grindborg (e) , I. Jokelainen(f) , H. Bjerke(g) , J. Dobrovodsky(h) , A. Megzifene(i) , C.J. Hourdakis(j), R. Ivanov(k) , B. Vekic(l) , J. , Kokocinski(m), J. Cardoso(n) , L.Buermann(o) , W. Tiefenboeck(p) G. Stucki(q) , E. van Dijk(r) , M. P. Toni(s) , R. Minniti(t) , J. P. McCaffrey(u) , C. N. M. Silva(v) , I. Kharitonov(w) , D Webb(x) , M. Saravi(y) , F. Delaunay(z)
(a) National Office of Measures (OMH) (pilot laboratory and corresponding author), Hungary (* The new name is MKEH from 1 January 2007)
(b) Research Centre for Energy, Environment and Technology (CMRI-CIEMAT), Spain
(c) Czech Metrology Institute(CMI), Czech Republic (d) Latvian National Metrology Center (LNMC-RMTC), Latvia (e) Swedish Radiation Protection Authority (SSI), , Sweden (** The new name
is Swedish Radiation Safety Authority SSM) (f) Radiation and Nuclear Safety Authority (STUK), Finland (g) Norwegian Radiation Protection Authority (NRPA), Norway (h) Slovak Institute of Metrology (SMU), Slovakia (i) International Atomic Energy Agency (IAEA), Vienna (j) Hellenic Atomic Energy Committee (HAEC-HIRCL), Greece (k) National Centre of Metrology (NCM), Bulgaria ( The new name is BIM
from September 2007) (l) Rudjer Boskovic Institute (IRB),Croatia (m) Central Office of Measures (GUM), Poland (n) Institute for Nuclear Technology (ITN-LMRIR), Portugal (o) Physikalisch Technische Bundesanstalt (PTB), Germany (p) Bundesamt für Eich und Vermesungswesen (BEV), Austria (q) Bundesamt für Metrologie (METAS), Switzerland (r) NMi Van Swinden Laboratorium (NMi), The Netherlands (The new name
from 1 March 2009 is VSL) (s) ENEA-CR Istituto Nazionale di Metrologia delle Radiazioni Ionizzanti
(ENEA), Italy (t) National Institute of Standards and Technology (NIST), USA (u) National Research Council Canada (NRC), Canada (v) National Metrology Laboratory of Ionizing Radiation (LNMRI-IRD),
Brazil (w) D. I. Mendeleyev Institute for Metrology (VNIIM), Russia (x) Australian Radiation Protection and Nuclear Safety Agency (ARPANSA),
Australia (y) National Atomic Energy Commission (CNEA-CAE), Argentina (z) Laboratoire National Henri Becquerel (LNE-LNHB), France
Metrologia 47 (2010) Tech. Suppl. 06012

Final report EURAMET project 813 2/46
Abstract The results of an unprecedented international effort involving 26 countries are reported. The EUROMET.RI(I)-K1 and EUROMET.RI(I)-K4 key comparisons were conducted with the goal of supporting the relevant calibration and measurement capabilities (CMC) planned for publication by the participant laboratories. The measured quantities were the air kerma (Kair) and the absorbed dose to water (Dw) in 60Co radiotherapy beams. The comparison was conducted by the pilot laboratory MKEH (Hungary), in a star-shaped arrangement from January 2005 to December 2008. The calibration coefficients of four transfer ionization chambers were measured using two electrometers. The largest deviation between any two calibration coefficients for the four chambers in terms of air kerma and absorbed dose to water was 2.7% and 3.3% respectively. An analysis of the participant uncertainty budgets enabled the calculation of degrees of equivalence (DoE), in terms of the deviations of the results and their associated uncertainties. As a result of this EUROMET project 813 comparison, the BIPM key comparison database (KCDB) will include eleven new Kair and fourteen new Dw DoE values of European secondary standard dosimetry laboratories (SSDLs), and the KCDB will be updated with the new DoE values of the other participant laboratories. The pair-wise degrees of equivalence of participants were also calculated. In addition to assessing calibration techniques and uncertainty calculations of the participants, these comparisons enabled the experimental determinations of NDw/NKa ratios in the 60Co gamma radiation beam for the four radiotherapy transfer chambers.
1 Introduction In October 1999, National Metrology Institutes (NMI) worldwide signed the
Mutual Recognition Arrangement ('Arrangement on the mutual recognition of the
equivalence of national standards and of calibration certificates issued by national
metrology institutes') established by the International Committee of Weights and
Measures (CIPM) and known as the CIPM MRA [1] with the aim of establishing a
basis for the mutual recognition of calibration and measurement capabilities (CMCs).
In Appendix C of the CIPM MRA, a part of the key comparison database (KCDB),
the BIPM has been publishing lists of these (CMCs) provided by the NMIs that have
signed the CIPM MRA. Calibration services can, however, only be included in this
database if a quality management system according to the ISO standard 17025 has
been established. Quality assurance and confidence in the capabilities of other
laboratories is usually ensured by the participation in comparisons in which the
degrees of equivalences with other National Metrology Institutes or designated
calibration laboratories have been determined.
The laboratories having primary standards regularly take part in the ongoing
BIPM.RI(I)-K1 and BIPM.RI(I)-K4 key comparisons, but these are comparisons only
of primary standards and not of secondary standards that are used for the
dissemination of the quantities. The degrees of equivalence of national standards of
air kerma and absorbed dose to water have already been published in the KCDB of
the CIPM MRA. http://kcdb.bipm.org/appendixB
Metrologia 47 (2010) Tech. Suppl. 06012

Final report EURAMET project 813 3/46
2 Procedure 2.1 Object of the comparisons
The results of this comparison are used by both primary and secondary
laboratories to support their relevant CMC claims. For this reason, the instruments
that were chosen to conduct this comparison were a representation of what the
participating facilities receive routinely as part of their calibration service. A total of
four chambers and two electrometers were shipped to each participating facility. In
these two regional key comparisons, the air kerma and absorbed dose to water
calibration coefficients, NKair and NDw, of the transfer chambers were determined.
Furthermore, these measurements enabled the determination of the degrees of
equivalence for each participant to be established. The reference class chambers used
were of high quality which resulted in low measurement uncertainties. Such high
quality measurements allow the calibration capabilities and the realization of the air
kerma and absorbed dose to water quantities to be assessed appropriately at each
participating facility.
An additional benefit from this comparison was the fact that one of the
electrometers, the PAM 20011, contained an internal temperature and pressure
transducer calibrated at the MKEH. This enabled each participant to check their own
instruments for measuring temperature, pressure and electrical current against the
values obtained with the UNIDOS and PAM 2001 electrometers supplied. The ratio
of the absorbed dose to water and the air kerma calibration coefficient, NDw / NKair,
and its corresponding uncertainty, could be determined for each chamber by all
26 participating countries. This information is of great value for hospitals that use 60Co radiotherapy beams under the same reference conditions that are used in this
work.
2.2 Transfer instruments
The main technical data of the transfer chambers are listed in Table 1. These
chambers are recognized by the medical community for their high stability [2]. Each
chamber has its own build-up cap for calibration in terms of air kerma. Two of the
chambers, the NE 2561 and the PTW 30001, required the use of a 1mm wall PMMA2
1 Certain commercial equipment, instruments, and materials are identified in this paper to foster understanding. Such identification does not imply recommendation or endorsement by any NMI, nor does it imply that the materials and/or equipment are the best available for the purpose. 2 Polymethyl-methacrylate
Metrologia 47 (2010) Tech. Suppl. 06012
Final report EURAMET project 813 4/46
sleeve for immersing the chambers in water for the absorbed dose to water
calibrations. The PMMA sleeve fits tightly around the chamber. The other two
chambers, (Wellhöffer FC-65 G and ND 1006) were waterproof. Adaptors and
extension cables were provided for the chambers and electrometers’ signal and high
voltage connections. The reference points of the chambers are the geometrical centre
of the sensitive volumes. Each chamber was aligned in the 60Co beam established
according to the ISO 4037 standard [3] with the black cross (marking the middle of
the sensitive volume length) facing the radiation source.
The measurement of the ionization current for each chamber was made using two
electrometers. One was the PTW UNIDOS (model 2.30 and serial number 20381) and
the other was a Hungarian reference class PAM (model 2001, serial number 2306).
Both electrometers were interfaced to a notebook computer and operated remotely
using their associated data acquisition software (DAS). The DAS used with both
electrometers generated text files containing relevant measurement parameters such
as the direct measured ionization currents from the chambers, the temperature and
pressure near the chambers and the exposure time. The readings of temperature and
pressure recorded by the DAS of the PAM 2001 electrometer were obtained from the
internal barometer and from the external waterproof PT 200 temperature probe that is
attached to the electrometer. The PTW UNIDOS electrometer did not measure
temperature and pressure internally. However, the data acquisition software, supplied
by the pilot laboratory, allowed manual entry of the values of temperature and
pressure obtained from an external meter. The values of temperature and pressure
used by each participant was obtained from the standard thermometer and barometer
used at each facility when the UNIDOS electrometer was used. Both electrometers
included internal power supplies that were used to supply the high voltage applied to
the chambers. All four chambers were calibrated using both the UNIDOS and PAM
electrometers. The text files generated by the DAS for each electrometer were stored
on the hard disk of the notebook (NEC Model Versa AXK6-2, SN R316900059) that
was supplied during the comparison. These text files were visible to the participants.
Additional hidden files containing all the measurement details were also stored on the
hard disk. The hidden files were only accessible to the pilot laboratory (MKEH) for
validation and quality control purposes. Photographs showing the electrometers and
chambers with the appropriate attachments (build-up cap, sleeve and adaptor) are
shown in Appendix D.
Metrologia 47 (2010) Tech. Suppl. 06012

Final report EURAMET project 813 5/46
Table 1. Main technical data of the transfer chambers
Type serial
number
Nom. NDw
/ (Gy/μC)
Nom. volume /cm3
Collecting potentiala
/V
Wall material
Wall thickness /(g/cm2)
Head diam. /mm
Stem diam./length
/mm
Water-proof
NE 2561 # 084 101 0.33 + 200 Graphite 0.090 8.4 12.6/180 No
PTW 30001 #2118
54 0.60 + 400 PMMA 0.045 7.0 12.6/130 No
Wellhöffer FC-65 G
#518 45 0.65 + 300 Graphite 0.068 7.0 8.6/80 Yes
ND 1006 #8503 120 0.28 + 250 Delrin 0.07 8.0 10.0/300 Yes
a the central electrode is positive
2.3 Participants and operation of the comparisons
The status and technical details of the comparison project described in this work,
entitled EUROMET project 813, were discussed and finalized at the EUROMET IR
TC Contact Persons meeting in September 2004. At this meeting it was proposed to
combine two key dosimetry comparisons in parallel as part of the EUROMET project
813. The two key comparisons are entitled EUROMET.RI(I)-K1 and
EUROMET.RI(I)-K4 and encompass the comparison among all participating
laboratories of the radiation quantities air kerma and absorbed dose to water
respectively. This was facilitated in part by the fact that both key comparisons have
similarities in the way the measurements are performed and therefore can be
described by a common protocol.
National Metrology Institutes around the world are grouped into five
geographical regions, each group being recognized as a Regional Metrology
Organization (RMO). The RMOs include the Asia-Pacific Metrology Program (
APMP), the Euro-Asian Cooperation of National Metrological Institutes (COOMET),
the European Collaboration on Measurement Standards (EUROMET)3, the Inter-
American Metrology System (SIM), while the Middle East - North African
Cooperation in Metrology (MENAMET) and the South African Development
Community Cooperation in Measurement Traceability (SADCMET) are part of the
3 Now known as the European Association of National Metrology Institutes (EURAMET)
Metrologia 47 (2010) Tech. Suppl. 06012

Final report EURAMET project 813 6/46
expanded Intra-Africa Metrology System AFRIMET . Representatives from the SIM,
APMP and the COOMET were invited and encouraged to participate in the
EUROMET project 813 comparison. In addition to the member countries of the
EUROMET organization, Argentina, Brazil, Canada and United Sates participated
from the SIM organization, Russia from the COOMET and Australia from the APMP.
The successor of EUROMET from 2007 is the European Association of National
Metrology Institutes, EURAMET:.
The schedule of participation gave priority to European secondary standard
laboratories to support their relevant CMC claims that have already been published or
submitted for publication. The EUROMET project 813 comparison was conducted
following a star-shaped circulation pattern for the shipment of the instruments
between the pilot laboratory, MKEH, and the participant laboratories. István Csete,
from the pilot laboratory at the MKEH, was the coordinator of the EUROMET
Project 813 comparison and responsible for calibrating the chambers over a period of
four years that started in January of the year 2005. During the four year period, the
chambers were calibrated every time the chambers were returned from each one of
the participant laboratories to the MKEH, and prior to shipping them to the next
participant. Ronaldo Minniti from the NIST assisted in this effort during the second
part of the year 2007 by coordinating the comparison among the SIM participants
within the American continent. After the instruments were received at the NIST from
the MKEH, they were shipped between the NIST and SIM participants (Canada and
Brazil only) in a star shape pattern. Similarly to the process followed by the MKEH
among the EURAMET participants, the NIST calibrated the chambers each time they
were returned form these two SIM participants. Although Argentina was originally
planned to be part of the star shaped pattern coordinated by the NIST, they had to
postpone their participation to a later time. Once the participation of all the SIM
participants was completed, the instruments were shipped from the NIST back to the
MKEH. The MKEH then continued shipping the instruments following a star shape
pattern among the remaining participants until the comparison was completed in
December of 2008, Argentina being the final participant.
Each of the 26 participants was allotted no longer than 3 weeks to perform all the
measurements. Each facility had to perform a total of 16 air kerma measurements as
a result of repeating twice the calibration of each of the four chambers with the two
electrometers supplied by the pilot laboratory. In addition, each facility had to
perform a total of 8 absorbed dose to water measurements resulting from repeating
twice the calibration of each of the four chambers with only one of the supplied
Metrologia 47 (2010) Tech. Suppl. 06012

Final report EURAMET project 813 7/46
electrometers. For the absorbed dose to water measurements, the chambers
PTW 30001 and Wellhöffer FC65-G were calibrated with the UNIDOS electrometer,
while the NE 2561 and OMH ND 1006 chambers were calibrated using the
PAM 2001 electrometer.
The averages of four NKair and two NDw calibration coefficients for each of the
four chambers were the accepted comparison results. The results of each participant
were reported to the MKEH within four weeks of the calibrations. To facilitate the
reporting of the calibration results, two spreadsheets were prepared by the pilot
laboratory (MKEH). Additional spreadsheets were provided to the participants to
collect information about the national standards, including traceability and
uncertainty of the measurements performed. The technical protocol, including the
schedule of measurements, was prepared on the basis of the EUROMET and CIPM
Guidelines [4,5]. and approved by the CCRI(I) in December 2004 The list of the
actual participants and the dates of measurements are listed in Table 2. The NPL
performed the measurements in April 2007 according to the original schedule but was
not able to deliver the results within the required schedule. By August 2008 a delay of
six months had been accumulated relative to the originally planned schedule of this
international comparison. The main reasons for the six month delay were the
difficulties encountered with the customs agencies during the shipments from and to
Brazil and Argentina. The LNE-LNHB, as a primary dosimetry laboratory, was
accepted in 2005 by the participants to be the reserve linking laboratory, if necessary
following technical or data evaluation difficulties. Consequently, the LNE-LNHB,
repeated the calibrations of the transfer chambers as a closure of the comparison
program.
Metrologia 47 (2010) Tech. Suppl. 06012
Final report EURAMET project 813 8/46
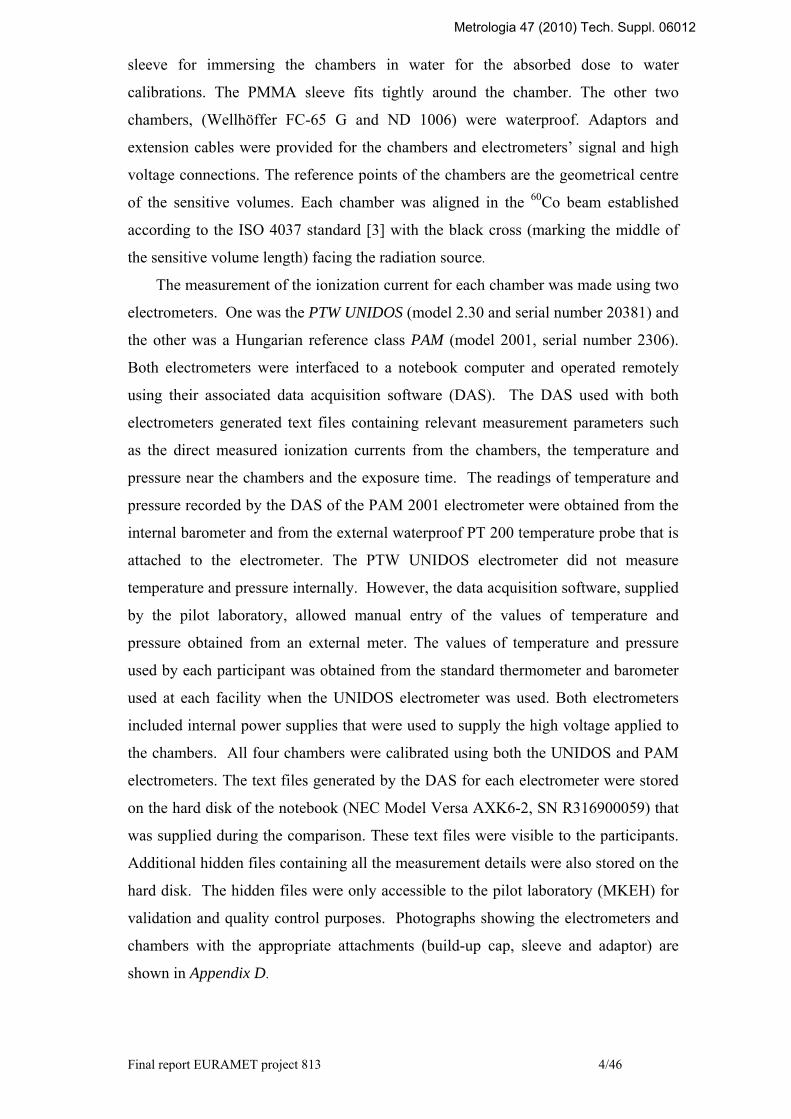
Table 2. List of the 26 participants and dates of measurements
Contact person Country Institute Measurement date
(day/month/year) István Csete Hungary OMH (MKEH)a 08/02/2005-11/12/2008
Frank Delaunay France LNE-LNHBb 09/03/2005-24/03/2005 16/04/2008-30/04/2008
Anna G. Leiton Spain LMRI-CIEMAT 18/04/2005-06/05/2005
Vladimir Sochor Czech Republic
CMI 07/06/2005-18/06/2005
Antons Lapenas Latvia LNMC-RMTC 20/07/2005-24/07/2005
Jan-Erik Grindborg Sweden SSM (SSI) 06/09/2005-09/09/2005
Ilkka Jokelainen Finland STUK 12/10/2005-20/10/2005
Hans Bjerke Norway NRPA 18/11/2005-27/11/2005
Josef Dobrovodsky Slovakia SMU 09/01/2006-13/01/2006
Ahmed Meghzifene International org. IAEA 03/02/2006-24/02/2006
Hourdakis J. Costas Greece HAEC-HIRCL 05/04/2006-12/04/2006
Juliana Mintcheva Rosen Ivanov
Bulgaria BIM (NCM)c 09/05/2006-19/05/2006
Branko Vekic Croatia IRB 05/06/2006-22/06/2006
Jerzy Kokocinski Poland GUMc 31/07/2006-11/08/2006
Joao Cardoso, Portugal ITN-LMRIR 02/10/2006-06/10/2006
Ludwig Buermann Germany PTB 23/10/2006-02/11/2006
Wilhelm Tiefenboeck Austria BEV 26/11/2006-06/12/2006
Gerhard Stucki Switzerland METAS 11/01/2007-26/01/2007
Eduard van Dijk Netherlands VSL(NMi) 16/03/2007-23/03/2007
Maria Pia Toni Italy ENEA 24/05/2007-04/06/2007
Ronaldo Minniti USA NISTd 01/08/2007-13/08/2007
John P. McCaffrey Canada NRC 05/09/2007-14/09/2007
Cosme N. M. da Silva Brazil LNMRI-IRD 09/11/2007-28/11/2007
Igor Kharitonov Russia VNIIMc 21/03/2008-24/03/2008
David Webb Australia ARPANSA 30/05/2008-20/06/2008
Margarita Saraví Argentina CNEA-CAE 22/08/2008-19/09/2008
Notes: a Pilot and linking laboratory to the BIPM Key Comparisons Reference Values b Reserve linking laboratory c Participate in air kerma comparison only d Pilot lab for SIM participants
Metrologia 47 (2010) Tech. Suppl. 06012

Final report EURAMET project 813 9/46
2.4 Calibration conditions at participating laboratories
Each chamber was positioned with its reference point, at the depth of 5 g/cm2 in a
water phantom or, free in air at the reference distance in the 60Co beam, where the
conventional true values of reference absorbed dose to water rate, wD& , or air kerma
rate, airK& respectively, had been established by the national standard. The calibration
coefficients are NDw = wD& /Icorr and NKair = airK& /Icorr where Icorr is the measured
ionization current corrected for influence quantities, corresponding to the reference
conditions for the calibration.
The collimated 60Co radiation beam dose rates used by all participants ranged
from 0.18 mGy/s to 34.8 mGy/s. The dose rates, along with the published CMC
uncertainty and linking traceability, are listed in Table 3. The beam field size at the
reference distance, for which the maximum intensity at the beam centre drops to 50%
of its value, is 100 cm2. The source detector reference distance (SDD) to the
reference point of each chamber from the center of the 60Co source was 100 cm at all
participating laboratories except at the RMTC, CMI and the CNEA-CAE where the
SDD for the air kerma measurements was 80 cm. At the STUK and the CMI, the
absorbed dose to water measurements were made at SDDs of 105 cm and 129 cm
respectively. Each participating laboratory used their own ISO standard 30 dm3 cubic
phantom for the absorbed dose to water measurements. The phantom consists of a
cubic shaped tank filled with water and with walls made of PMMA [2]. The
calibration coefficients of the transfer chambers were given in terms of absorbed dose
to water or air kerma per charge, in units of Gy/μC, normalized to the standard
conditions of air temperature, pressure and relative humidity of T = 293.15 K,
P = 101.325 kPa and h = 50 % respectively. The dose rates used in this comparison
resulted in negligible differences for incomplete charge collection (so no collection
efficiency correction was applied) for the small volume chambers used. Furthermore,
each laboratory maintained a relative air humidity between 20 % and 80 % resulting
in negligible air humidity corrections.
Metrologia 47 (2010) Tech. Suppl. 06012

Final report EURAMET project 813 10/46
Table 3. The uncertainty values, traceability information, and dose rates published as the CMC for each participant.
Participant CMC uncertainty (k = 2) Traceability Applied dose rate
(mGy/s) Ka Dw Ka Dw Ka Dw MKEH 0.8 1.0 MKEH MKEH 9.45 9.31 LNE-LNHB 0.9 1.3 LNHB LNHB 10.1 10.2 CIEMAT 0.8 1.1 BIPM BIPM 5.44 5.43 CMI 2.0 3.5 BEV BIPM 4 5.9/2.04 RMTC 1.6 2.0 BIPM BIPM 10.7 10.5 SSM 0.8 1.0 BIPM BIPM 6.8 6.78 STUK 1.0 1.2 BIPM BIPM 3.7 3.35 NRPA 0.9 1.0 BIPM BIPM 2.56 2.57 SMU 1.3 2.4 SMU PTB 5.43 5.55 IAEA 0.8 1.0 BIPM BIPM 4.91 4.93 HAEC-HIRCL ------- ------- BIPM BIPM 3.72 3.71 BIM 1.0 BIM ------- 0.18 ------ IRB ------- ------- PTB PTB 1.85 1.82 GUM 1.0 GUM ------ 0.46 ------ ITN-LMRIR 0.9 1.7 LMRIR BIPM 2.6 2.58 PTB 0.6 0.5 PTB PTB 15.96 15.66 BEV 0.8 0.9 BEV BEV 4.76 4.71 METAS 0.9 1.0 BIPM METAS 14.4 14.4 VSL 1.0 0.9 VSL VSL 7.25 34.8 ENEA 1.4 1.4 ENEA ENEA 9.58 9.6 NIST 1.4 1.2 NIST NIST 2.91 2.99 NRC 1.0 1.0 NRC NRC 10.7 9.5 LNMRI-IRD 1.4 1.5 BIPM BIPM 3.4 3.1 VNIIM 1.5 VNIIM ----- 6.5 ----- ARPANSA 0.8 0.7 ARPANSA ARPANSA 1.2 1 CNEA-CAE ------- ------- BIPM BIPM 2.55 2.58
3 Results
3.1 Stability of the transfer instruments
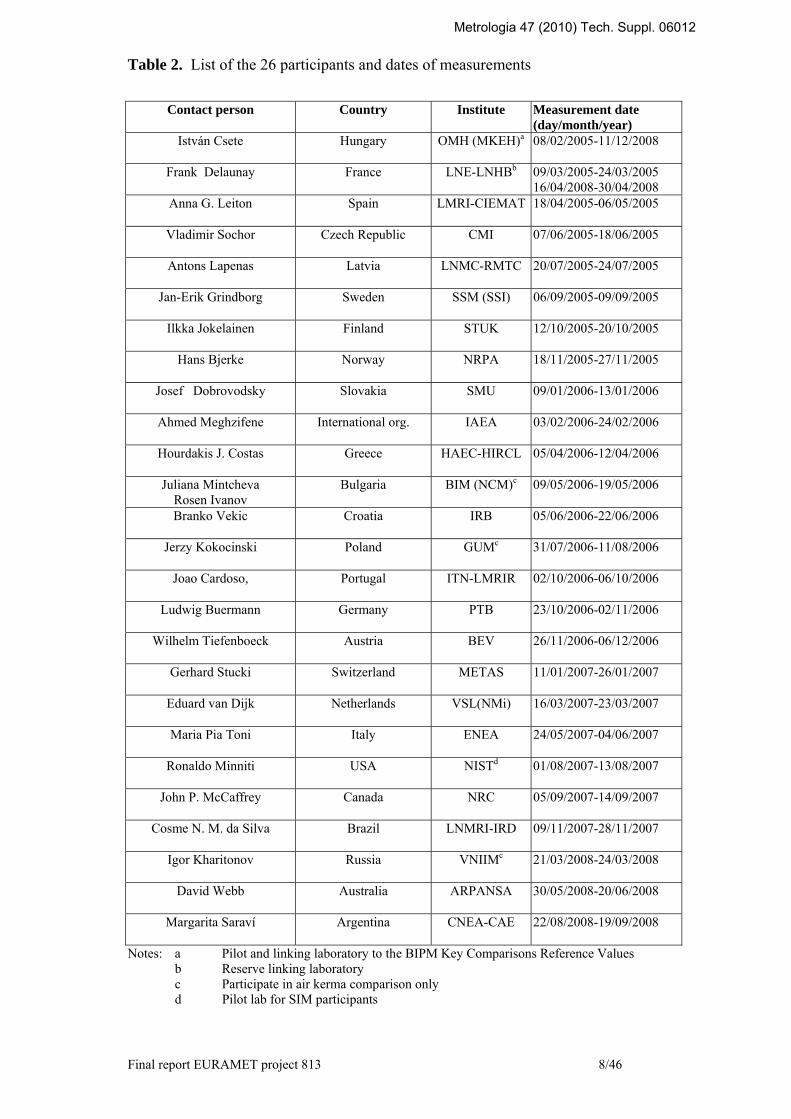
Stability measurements were performed at the MKEH after each participant's
measurements. The first was performed on 17 April 2005 the last was on
25 November 2008. Twenty-seven recalibration series were made during these
42 months for each chamber in terms of air kerma, and fourteen recalibration series in
terms of absorbed dose to water, using both electrometers. The two series of air kerma
recalibrations, performed at the NIST were normalized with the MKEH/NIST ratio
for each chamber. The 178 NKair and 88 NDw calibration coefficients for the four
transfer chambers were normalized to their averages and can be seen in Figure 1.
Metrologia 47 (2010) Tech. Suppl. 06012
Final report EURAMET project 813 11/46
0.9980
0.9985
0.9990
0.9995
1.0000
1.0005
1.0010
1.0015
1.0020
1.0025
1.0030
NE 2651 PTW 30001 Wellhöfer FC 65 ND 1006transfer chambers
Nor
mal
ised
cal
ibra
tion
coef
ficie
nts
NK(PAM) NK(UNIDOS) NDw(PAM) NDw(UNIDOS)
Figure 1. Results of the stability measurements of the four transfer chambers using
the PAM and UNIDOS electrometers in terms of air kerma and absorbed dose to water
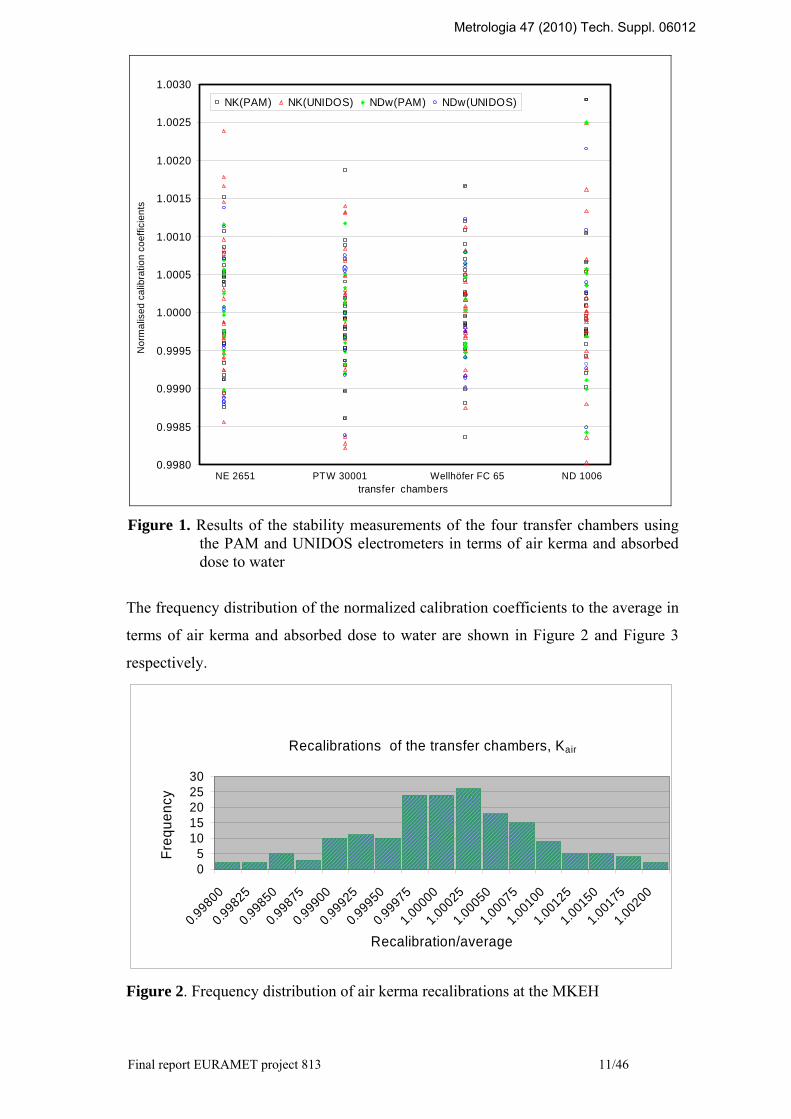
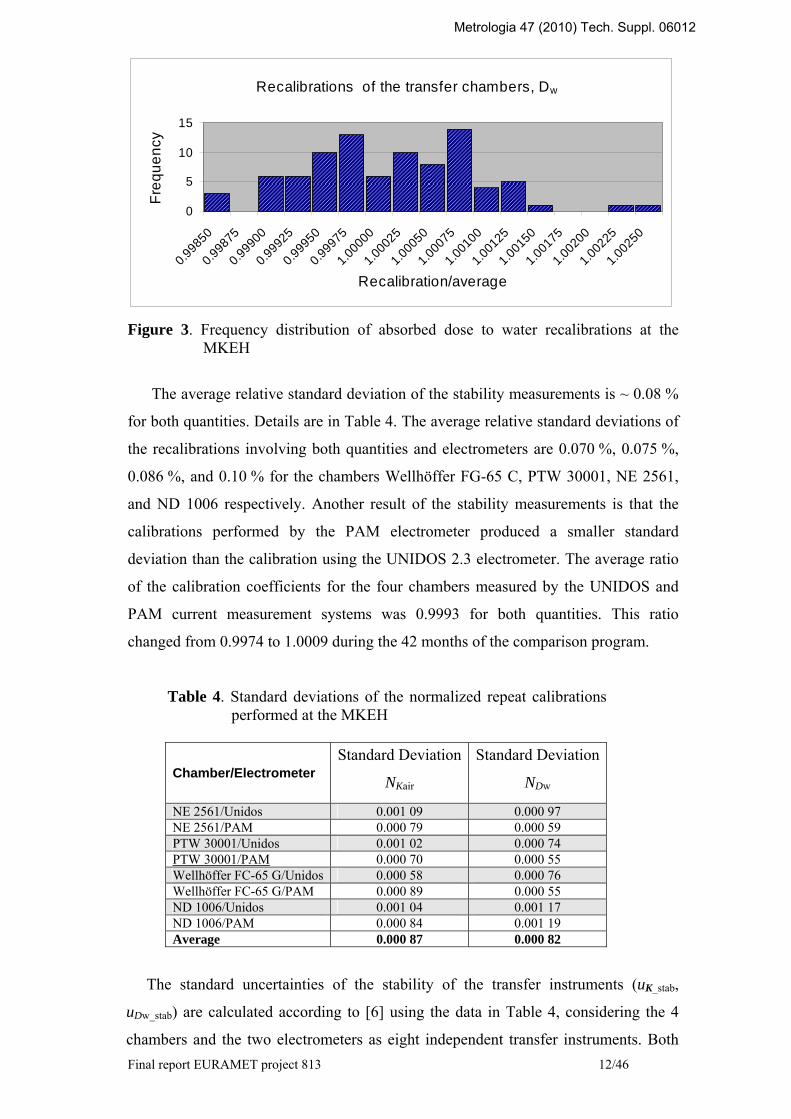
The frequency distribution of the normalized calibration coefficients to the average in
terms of air kerma and absorbed dose to water are shown in Figure 2 and Figure 3
respectively.
Recalibrations of the transfer chambers, Kair
05
1015202530
0.99800
0.99825
0.99850
0.99875
0.99900
0.99925
0.99950
0.99975
1.00000
1.00025
1.00050
1.00075
1.00100
1.00125
1.00150
1.00175
1.00200
Recalibration/average
Freq
uenc
y
Figure 2. Frequency distribution of air kerma recalibrations at the MKEH
Metrologia 47 (2010) Tech. Suppl. 06012
Final report EURAMET project 813 12/46
Recalibrations of the transfer chambers, Dw
0
5
10
15
0.998
50
0.998
75
0.999
00
0.999
25
0.999
50
0.999
75
1.000
00
1.000
25
1.000
50
1.000
75
1.001
00
1.001
25
1.001
50
1.001
75
1.002
00
1.002
25
1.002
50
Recalibration/average
Freq
uenc
y
Figure 3. Frequency distribution of absorbed dose to water recalibrations at the
MKEH
The average relative standard deviation of the stability measurements is ~ 0.08 %
for both quantities. Details are in Table 4. The average relative standard deviations of
the recalibrations involving both quantities and electrometers are 0.070 %, 0.075 %,
0.086 %, and 0.10 % for the chambers Wellhöffer FG-65 C, PTW 30001, NE 2561,
and ND 1006 respectively. Another result of the stability measurements is that the
calibrations performed by the PAM electrometer produced a smaller standard
deviation than the calibration using the UNIDOS 2.3 electrometer. The average ratio
of the calibration coefficients for the four chambers measured by the UNIDOS and
PAM current measurement systems was 0.9993 for both quantities. This ratio
changed from 0.9974 to 1.0009 during the 42 months of the comparison program.
Table 4. Standard deviations of the normalized repeat calibrations performed at the MKEH
Chamber/Electrometer Standard Deviation
NKair
Standard Deviation
NDw
NE 2561/Unidos 0.001 09 0.000 97 NE 2561/PAM 0.000 79 0.000 59 PTW 30001/Unidos 0.001 02 0.000 74 PTW 30001/PAM 0.000 70 0.000 55 Wellhöffer FC-65 G/Unidos 0.000 58 0.000 76 Wellhöffer FC-65 G/PAM 0.000 89 0.000 55 ND 1006/Unidos 0.001 04 0.001 17 ND 1006/PAM 0.000 84 0.001 19 Average 0.000 87 0.000 82
The standard uncertainties of the stability of the transfer instruments (uK_stab,
uDw_stab) are calculated according to [6] using the data in Table 4, considering the 4
chambers and the two electrometers as eight independent transfer instruments. Both
Metrologia 47 (2010) Tech. Suppl. 06012

Final report EURAMET project 813 13/46
determinations recommended in [6] ∑=
=8
12
_2
11i istabstab uu
; 8_ stab
stabuaverage
u = deliver
the same values within 2 × 10⁻⁵ for both quantities so the average values in the Table
4 divided by 8 are used to establish uK_stab = 0.000 31 and uDw_stab = 0.000 29. These
values include not only the transfer chamber stability, but the uncertainty of
reproducibility of the whole calibration procedure at the MKEH including the
statistical uncertainties of the normalized ionization current measurements and the
setup procedure.
Unfortunately, the waterproof ND 1006 chamber leaked when remaining
underwater in a water phantom on two occasions. At first in March of 2007, the
drying procedure at the MKEH was successful without any change of sensitivity.
However, in February of 2008, the drying procedure was unsuccessful, resulting in an
erratic chamber response and a continual exponential decrease in the calibration
coefficient. The measured NKair and NDw values by the VNIIM, LNE-LNHB,
ARPANSA and the CNEA-CAE were corrected to ensure coherent data evaluation to
account for the change in the sensitivity. These correction factors in the range from
0.4 % to 1.5 % were interpolated in terms of the measurement date using a curve
fitting program based on the twelve repeated calibrations at the MKEH. The
additional uncertainty from these correction factors is negligible.
An additional stability check of current measurements made by the UNIDOS and
PAM 2001 electrometers consisted of three comparison measurements to the MKEH
current measurement system featuring the following equipment: a Keithley 263
current generator, a Keithley 616 electrometer using external feedback capacitor and a
Keithley 642 electrometer. The deviations from ten reference current values in the
range from 10 pA to 250 pA were less than ± 0.07 % and ± 0.15 % for the PAM 2001
and the UNIDOS electrometers, respectively. However, the UNIDOS electrometer
has shown a fluctuation of leakage current, ≤ 50 fA, at some laboratories, perhaps
caused by instability of the initial internal temperature and stress in the insulator
material of the signal cable connection.
The pressure and temperature probes of the PAM electrometer were calibrated at
the MKEH against the appropriate national standard before the project started and
their stabilities were re-checked before each recalibration of the ionization chambers.
Both probes have shown excellent stabilities, well within the stated uncertainties. In
summary, the stability investigation of the transfer instruments indicates reliable
stability during the course of the comparison.
Metrologia 47 (2010) Tech. Suppl. 06012

Final report EURAMET project 813 14/46
3.2 Results of participants
As described previously a total of four NKair and two NDw calibration coefficients
were determined for each chamber. Recall for example that for the air kerma
calibrations each chamber was calibrated twice with a given electrometer and both
electrometers were used for each chamber. These four values of NKair were used to
determine the average air kerma calibration coefficient shown in Table 5 for each
chamber. Similarly, the two values of NDw obtained for each chamber were used to
determine the average absorbed dose to water calibration coefficient shown in
Table 6. The MKEH results are the initial calibration results measured in February
2005 and deposited with the TC chair and the CCRI(I) Secretary. As mentioned
previously, no corrections were applied for collection efficiency, polarity or the use of
the sleeve for the non waterproof chambers. The uncertainty of the calibration
reported by each participant is listed in the last column of Table 5 and Table 6. In
these tables, the ratio of the calibration coefficients obtained with the UNIDOS and
PAM electrometers are also listed (denoted as UNIDOS/PAM) by averaging all the
available data from the participants.
Metrologia 47 (2010) Tech. Suppl. 06012

Final report EURAMET project 813 15/46
Table 5 Average measured air kerma calibration coefficients of the participants
Average NKair values in units of Gy/µC measured by the UNIDOS and PAM electrometers
participant NE 2561 #084
PTW 30001 #2118
Wellhöffer FG-65 C
#518 ND 1006
#8503 UNIDOS/PAM
(on average) uc(NK)
(%) Ref. Value a 93.786 49.825 43.828 112.983
Traceable to the BIPM CIEMAT 93.623 49.637 43.816 113.097 0.9980 0.24
LNMC-RMTC 93.791 49.605 43.836 112.595 0.9976 0.50 SSM 93.828 49.739 43.959 113.348 0.9945 0.40
STUK 93.672 49.528 43.790 112.780 0.9967 0.39 NRPA 94.308 49.959 44.069 113.836 0.9984 0.38 IAEA 93.662 49.759 43.888 113.380 0.9953 0.40
HAEC-HIRCL 94.127 49.841 44.061 114.215 1.0004 0.61 BIM 93.502 49.365 43.805 111.753 0.9910 0.67 GUM 92.905 49.047 43.272 111.236 0.9964 0.88
ITN-LMRIR 93.792 49.785 43.833 112.696 ---- 0.33 METAS 93.576 49.783 43.783 112.972 1.0010 0.27
LNMRI-IRD 94.001 49.974 43.960 112.979 0.9970 0.70 CNEA-CAEb 93.867 49.698 43.979 114.082 0.9998 0.52
average 93.743 49.671 43.850 112.998 standard dev 0.34 0.25 0.20 0.85 avr./ref. value 0.9995 0.9969 1.0005 1.0001
Traceable to other primary standard LNE-LNHB_1c 93.668 49.649 43.783 112.427 0.9972 0.40
CMI 93.589 49.323 43.702 111.035 0.9981 0.78 SMU 94.039 50.012 44.151 114.110 0.9996 0.35 IRB 94.221 49.886 44.061 113.506 0.9986 0.38 PTB 94.502 50.253 44.195 114.121 0.9999 0.20 BEVc 94.289 50.065 44.046 113.916 0.9992 0.42
VSLc 93.361 49.703 43.657 112.654 0.9975 0.47 ENEAc 93.739 49.752 43.816 112.679 0.9970 0.40 NIST 94.200 49.970 43.982 113.092 0.9989 0.36 NRCc 94.096 50.065 44.020 113.541 0.9969 0.27
VNIIMb 93.695 49.809 43.804 112.807 0.9997 0.23 LNE-LNHB_2b,c 93.680 49.847 43.691 112.480 0.9994 0.40
ARPANSAb,c 93.689 49.776 43.786 112.877 0.9974 0.52 MKEH 94.263 50.014 44.028 113.602 1.0000 0.23
MKEHc,d 94.271 49.993 44.025 113.506 0.9993 0.23 average 93.931 49.866 43.909 113.081 0.9979
standard dev 0.34 0.23 0.18 0.83 avr./ref. value 1.0015 1.0008 1.0018 1.0007
a Reference value is defined in section 3.3 b Interpolated value for ND 1006 chamber see section 3.1 c Linking laboratories, see section 3.3 d Average values measured over the 4 years recalibrations
Metrologia 47 (2010) Tech. Suppl. 06012

Final report EURAMET project 813 16/46
Table 6. Average measured absorbed dose to water calibration coefficients of the participants
Average NDw values in units of Gy/µC measured by the UNIDOS and PAM electrometers
participant PTW 30001 #2118
Wellhöffer FG-65 C
#518 NE 2561
#084 ND 1006
#8503 UNIDOS/PAM (on average)
uc(ND)(%)
ref. valuea 54.267 47.874 101.928 122.444 Traceable to the BIPM
CIEMAT 53.883 47.675 101.575 122.389 0.37 CMI 54.158 48.044 100.095 120.375 0.9984 1.18
LNMC-RMTC 53.808 47.761 121.994 0.9977 0.60 SSM 53.965 47.893 102.068 122.894 0.50
STUK 53.934 47.706 101.810 122.193 0.43 NRPA 54.372 48.032 102.298 123.480 0.44 IAEA 54.170 47.947 101.707 122.700 0.9949 0.50
HAEC-HIRCL 54.392 48.024 102.307 122.932 0.62 ITN-LMRIR 54.057 47.459 101.189 120.518 0.65 LNMRI-IRD 54.298 47.824 102.257 123.446 0.75 CNEA_CAEb 54.614 48.685 103.856 122.044 1.0013 0.81
average 54.150 47.914 101.916 122.270 standard dev 0.25 0.31 0.96 1.03 avr./ref. value 0.9979 1.0008 0.9999 0.9986
Traceable to other primary standard LNHB_1c 53.985 47.742 101.517 121.334 0.9970 0.47
SMU 54.000 47.731 100.994 122.488 1.20 IRB 53.767 47.544 101.777 121.804 0.97 PTBc 54.064 47.633 101.746 122.358 0.22 BEVc 54.118 47.804 101.763 122.792 0.45
METASc 54.265 47.866 102.055 122.880 0.44 VSLc 54.086 47.599 101.940 0.44
ENEAc 54.243 47.895 101.540 121.829 0.9976 0.38 NIST 54.382 47.779 121.441 0.9985 0.47 NRCc 54.191 47.771 101.696 122.314 0.43
**LNE-LNHB_2b,c 53.969 47.646 101.449 121.180 1.0003 0.47 ARPANSAb 54.436 48.023 101.927 122.511 0.9986 0.40
MKEH 54.144 47.791 101.543 122.054 1.0000 0.49 MKEHc,d 54.118 47.780 101.506 122.047 0.9993 0.49 average 54.127 47.756 101.662 122.082
standard dev 0.18 0.13 0.28 0.57 avr./ref. value 0.9973 0.9981 0.9959 0.9968
a Reference value is defined in section 3.3 b Interpolated value for ND 1006 chamber see section 3.1 c Linking laboratories, see section 3.3 d Average values measured over the 4 years recalibrations
As shown in Tables 5 and 6, the average UNIDOS/PAM ratios are less than one.
This ratio provides a measure of the possible differences between the measurement
systems used. The calibration coefficients were obtained with two different measuring
systems as mentioned previously. One system made use of the PAM electrometer and
Metrologia 47 (2010) Tech. Suppl. 06012
Final report EURAMET project 813 17/46
its internal barometer and thermometer. The other measurement system made use of
the reference thermometer and barometers used at each participant’s facility. Ideally,
if the UNIDOS/PAM ratios shown in Tables 5 and 6 would be equal to unity, it would
imply that there are no differences between the two measurements systems.
Furthermore, this would reflect that the thermometer and barometer used at a given
participants’ facility would measure identically to the ones provided with the
calibrated PAM system, if the UNIDOS measured the same current as the PAM
electrometer at each participant’s facility. During the recalibrations at the MKEH a
small systematic deviation from unity of the UNIDOS/PAM ratio was observed
similar to the ones measured by the participants. So, in addition to the stability
measurements mentioned in section 3.1, some PSDL participants were also asked to
check the UNIDOS current measurement system separately. Unfortunately, these
additional check measurements with current sources did not reveal any stable
systematic deviation between the two electrometers. Finally no corrections were
applied to account for the response of the UNIDOS system, particularly because the
transfer chamber and electrometer together were considered to be a compact therapy
dosimeter.
3.3 Reference value determinations
The CCRI(I) took the decision at its meeting in 1999 to use the BIPM
determination of air kerma and absorbed dose to water as the basis of the key
comparison reference values (KCRV) [7]. The formalism to calculate the degree of
equivalence in terms of the two components, the difference of the result from the
KCRV and its associated uncertainty, (Di, Ui), for dosimetry comparisons was agreed
at the meeting of the Key Comparison Working Group of CCRI(I) in April 2008 and
published [8] . The Di is defined as the relative difference between the air kerma or
absorbed dose to water measured by a National Metrology Institute (NMI), and the
appropriate KCRV, KBIPM or Dw,BIPM, divided by the KCRV in units of milligray per
gray (mGy/Gy). Thus,
DK,NMI = (KNMI – KBIPM )/KBIPM = KNMI/KBIPM –1 = R’K –1 (1)
DDw,NMI = (DwNMI – Dw,BIPM )/Dw,BIPM = Dw,NMI /Dw,BIPM –1 = R’D –1 . (2)
The R’K and R’
D ratios represent the key comparison results for NMIs having
primary standards. These ratios are known and are accessible from the BIPM.RI(I)-
K1 and BIPM.RI(I)-K4 key comparison reports published in the KCDB
Metrologia 47 (2010) Tech. Suppl. 06012
Final report EURAMET project 813 18/46
(http://kcdb.bipm.org/appendixB). An NMI that holds primary standards that
participated in this EUROMET project 813 comparison and also has compared
directly in the past with the BIPM, can act as so-called linking laboratory. A linking
laboratory enables the link or comparison of the result of a NMI with that of the
BIPM. The R’K and R’
D ratios will hereafter be referred to as the R’link values for the
case of NMIs that qualified as linking laboratories during this comparison.
Furthermore, the calibration coefficients from these specific laboratories are referred
throughout the text as Nlink. Several laboratories qualified as linking laboratories in
this comparison and will be discussed later in the text. The corresponding calibration
coefficients Nlink for these labs are listed in Tables 5 and 6.
As a first step in evaluating the results from each participant, the RNMI values were
determined using the following expression: RNMI = R’link × NNMI/Nlink where N can be
the calibration coefficient of a transfer chamber in either air kerma or absorbed dose
to water [6]. The Nlink/R’link values will hereafter be referred to as reference
calibration coefficients (Nref) for each transfer chamber, thus RNMI = NNMI/Nref.
As a first approach to establish the reference calibration coefficient refN consider
MKEH, the pilot laboratory, to be the linking laboratory. For this, the Nref values
should be taken for each transfer chamber as the average value of the calibration
coefficients, (NKair,MKEH and NDw,MKEH), measured at the pilot linking laboratory (listed
in Table 5 and Table 6) then divided by the published linking ratios
R’MKEH = KMKEH/KBIPM = 1.0109 and DwMKEH/DwBIPM = 0.9983. These key comparison
results were measured in 2006 and 2002 for air kerma and absorbed dose to water
respectively [9,10]. However, the KBIPM reference value for 60Co radiation increased
by 1.0054 in November 2007 after the CCRI approval of the re-evaluation of the
BIPM standard, hence the new KMKEH/KBIPM ratio is 1.0055; more details can be found
in references [11] and [12]. The associated relative combined standard uncertainties
of NKair,MKEH and NDw,MKEH are 0.23 % (from Table 5) and 0.49 % (from Table 6)
respectively. These values differ by only a negligible amount for the different transfer
chambers. The Nref,MKEH value acquired through the use of a MKEH secondary
standard chamber, NE 2561 has previous traceability to the BIPM [10]. The average
value of the calibration coefficients of the NE 2561 #084 chamber resulting from the
repeat calibrations at MKEH (over the 4 year period) divided by the R’MKEH ratios,
give practically the same values as measured at the BIPM in 2002 for both quantities,
when the BIPM air kerma reference was revised as indicated above;
(NKa,MKEH/R’Ka,MKEH/NKa,BIPM = 1.00004; and ND,MKEH/R’D,MKEH/ND,BIPM = 1.0005)
validating the calibration techniques of the NE 2561 chamber in terms of both
Metrologia 47 (2010) Tech. Suppl. 06012

Final report EURAMET project 813 19/46
quantities at the MKEH. The Nref,MKEH values for the transfer chambers are shown in
Table 7. However, using the approach of Nref = Nref,MKEH some systematic calibration
procedure errors for a single link laboratory could be uncovered.
The second approach to establish the Nref values could be to use only the average
NKair,LNHB and NDw,LNHB values of the two series measured in 2005 and 2008 by LNE-
LNHB, initially chosen as a reserve link laboratory. LNE-LNHB is one, out of the
several participants listed in Table 7, that qualify as a reserve linking laboratory. The
values of R’K,link = 0.9981 and R’D,link = 0.9970 are from the key comparison results
measured in 2003 [13, 14]. The Nref,LNHB/Nref,MKEH values are in Table 7. In the ideal
case these ratios should be unity. In practice, the average values for the four transfer
chambers, 1.0006 and 0.9985 for air kerma and absorbed dose to water respectively,
are well within the standard uncertainties, hence the calibration measurements at the
MKEH and LNE-LNHB are consistent. The average of the Nref,MKEH and Nref,LNHB
values could also be used to establish the Nref values. However, the chamber to
chamber variation of these MKEH/LNHB ratios falls in a relatively large range, of
approximately 0.5 %. Such variation can result perhaps from some set-up differences
between the two laboratories, particularly in the case of the ND 1006 chamber
measured in water. Note that this chamber produced the lowest stability value during
the repeat calibrations at the MKEH and its calibration coefficients, as measured by
all the participants. This ND 1006 chamber also had the largest variation amongst the
four chambers. Considering the various approaches for the establishment of the most
reliable reference values, refN , for each chamber and for the identification of
appropriate weighting factors required for the calculation of mean values for the
four chambers, the evaluation technique of ‘round-robin’ type of comparison is
considered to be optimal, even though a star-shaped comparison program was
performed.
This ‘round-robin’ approach uses all the available NKa and NDw values of the
participating NMIs having primary standards. Furthermore their results in this
comparison are coherent with their previous published key comparison results found
in references [12] and the BIPM.RI(I)-K4. In this way the Nref values can be
established for each chamber as n
NN
n
iilinkref
ref
∑== 1
,,
, the un-weighted mean of , Nref,link
, where n is the number of linking laboratories. Weighting factors could be the
variances of the key comparison results, but both methods give practically the same
mean values since the BIPM key comparison uncertainties of all candidate NMIs are
Metrologia 47 (2010) Tech. Suppl. 06012
Final report EURAMET project 813 20/46
very similar. To judge the coherence of the candidate participants to act as link
laboratories two criteria were established to contribute to the Nref, value calculation:
1. The measured NKa and NDw values for the four chambers should be within the
standard uncertainty stated by the NMI.
2. The standard uncertainties of the key comparison result, uc (R’) and the present
comparison result, uc ( NMIR ) calculated with the Nref,MKEH values should
overlap.
The list of NMI’s meeting the two requirements for both quantities are listed in
the first column of Table 7. The calculated final NK,ref and ND,ref values are shown in
Table 7 in units of Gy/µC. The final NK,ref values results from the average of the 7
linking laboratories listed in the first part of Table 7, while the final ND,ref values
results from the average of the 9 linking laboratories listed in the second part of Table
7. As observed in Table 7, these N,ref values are slightly different than the N,ref,MKEH
values. To further analyse the linking laboratories results and to check the first and
second approaches for the calculation of Nref, the Nref,link / Nref,,MKEH ratios of the
linking laboratories were calculated for each chamber and are also given in Table 7.
From the discussion in the paragraphs above, the average values of Nref,link / Nref,,MKEH
for the NE 2561 chamber for air kerma and absorbed dose to water are expected to be
1.0000 and 1.0005 respectively. However, as shown in the row labelled ‘average’ in
Table 7, these ratios for the NE 2561 chamber are 1.0003 and 1.0024 for air kerma
and absorbed dose to water respectively. This represents an excellent agreement for
the value of the air kerma reference calibration coefficient NK,ref . However, not quite
such a good agreement is obtained for the value of the absorbed dose to water
reference calibration coefficient ND,ref,. In general for all four chambers the Nref values
are higher than the Nref,,MKEH values. The average differences for all chambers
between the Nref and Nref,MKEH values, derived from the last column of Table 7, are
0.11% and 0.13% for air kerma and absorbed dose to water respectively. The (Nref –
Nref,MKEH) differences are higher than the standard deviations of the Nref, values for air
kerma for the PTW 30001 chamber and for absorbed dose to water for the NE 2561
chamber.
Similary, a comparison can be made between the final Nref and Nref,LNHB values.
For this case also the final Nref values are higher than the Nref,LNHB values listed in
Table 7. The average differences for all chambers between the final Nref and Nref,LNHB
values, derived from the last column of Table 7, are 0.05% and 0.28% for air kerma
and absorbed dose to water respectively. Further investigation of the calibration
Metrologia 47 (2010) Tech. Suppl. 06012
Final report EURAMET project 813 21/46
techniques of each participant may explain the similar differences evaluated in
Table 7.
Although, the unweighted mean value n
NN
n
iilinkref
ref
∑== 1
,,
was used to establish the
reference calibration coefficient of each transfer chamber, a weighted mean value of
the transfer chambers was used for determining the comparison ratio NMIR . The
standard deviations of the Nlink/NMKEH ratios shown in Table 7 as a measure of
stability of the transfer chambers were used as the weighting factors in the
calculation of the weighted mean values , NMIR . The mean comparison ratios NMIR
calculated in this way, constitute the final comparison ratios for each NMI for the
both quantities, air kerma and absorbed dose to water.
Metrologia 47 (2010) Tech. Suppl. 06012

Final report EURAMET project 813 22/46
Table 7. Selected linking laboratories and their Nref,link /Nref,MKEH ratios for the transfer chambers for both quantities. Also shown are the standard deviations of the ratios. The Nref,MKEH and Nref calibration coefficients are in Gy/µC.
NK, ref,link / NK,ref,MKEH ratios for the transfer chambers for air kerma
linking laboratory
NE 2561 #084
PTW 30001 #2118
Wellhöffer FG-65 C
#518
ND 1006 #8503
average for the
chambers 1 MKEH 1.0000 1.0000 1.0000 1.0000 1.0000 2 LNE-LNHB 1.0010 1.0025 1.0008 0.9981 1.0006 3 ENEA 1.0001 1.0009 1.0010 0.9985 1.0001 4 ARPANSA 1.0019 1.0037 1.0026 1.0025 1.0027 5 NRC 1.0011 1.0044 1.0029 1.0033 1.0029 6 BEV 1.0002 1.0014 1.0005 1.0036 1.0014 7 VSL 0.9979 1.0018 0.9992 1.0000 0.9997
average NK,ref,link / NK, MKEH 1.0003 1.0021 1.0010 1.0009 1.0011
standard dev. NK,ref,link / NK, MKEH 0.0013 0.0016 0.0013 0.0023
NK,MKEH a 93.755 49.720 43.784 112.886
NK,ref a 93.786 49.825 43.828 112.983
ND,,link / ND, ,MKEH ratios for the transfer chambers for absorbed dose to water
linking laboratory
NE 2561 #084
PTW 30001 #2118
Wellhöffer FG-65 C
#518
ND 1006 #8503
average for the
chambers 1 MKEH 1.0000 1.0000 1.0000 1.0000 1.0000 2 LNHB 1.0011 0.9987 0.9995 0.9948 0.9985 3 PTB 1.0046 1.0012 0.9991 1.0048 1.0024 4 ENEA 1.0017 1.0037 1.0038 0.9996 1.0022 5 ARPANSA 1.0000 1.0017 1.0010 0.9997 1.0006 6 NRC 1.0026 1.0020 1.0005 1.0029 1.0020 7 BEV 1.0018 0.9993 0.9998 1.0054 1.0016 8 METAS 1.0038 1.0011 1.0002 1.0052 1.0026 9 VSL 1.0064 1.0015 0.9983 1.0021
average ND,ref,link / ND, MKEH 1.0024 1.0010 1.0002 1.0016 1.0013
standard dev ND,ref,link / ND, MKEH 0.0021 0.0015 0.0015 0.0037
ND,ref,MKEH a 101.679 54.211 47.862 122.254
ND,ref a 101.928 54.267 47.874 122.444
a calibration coefficients in unit of Gy/µC
For the final NMIR comparison ratios for each participant , the RNMI = NNMI/Nref
ratios were evaluated using the data from Table 5, Table 6 (for the NNMI values) and
Table 7 (for the Nref values). As mentioned previously, the standard deviations of the
Nlink/NMKEH values listed in Table 7 were used as weighting factors in the final
comparison rations NMIR . However a comparison was made of this chosen approach
Metrologia 47 (2010) Tech. Suppl. 06012

Final report EURAMET project 813 23/46
with a second approach using the 1/u2stab values for each chamber as weighting
factors. In what follows a summary of these two approaches is discussed. The ustab
values are pure statistical uncertainties that result from calculating the standard
deviation of the repeat calibration performed at the pilot linking laboratory
summarized in Table 4. Since the results from more than one linking laboratory were
used to establish the reference values for each chamber, the standard deviation of the
NK,ref,link/NK,ref,MKEH values in Table 7 provides an alternative measuring parameter of
the stability of the transfer chamber. If this latter parameter is used instead to quantify
the stability of the ND 1006 chamber, then this chamber would contribute less to the
calculation of the weighted mean NMIR . As a result this would suppress the advantage
of the fact that the pilot laboratory uses regularly the ND 1006 chamber. However, a
smaller weighting factor is consistent with the fact that this particular chamber is
different from the others since it has a perpendicular stem. Therefore, the use of the
non-statistical uncertainty seems more realistic. A comparison evaluation of both
approaches shows that the differences between the two NMIR values using the data in
Table 4 or in Table 7 for u2stab value are in the range of 0.01 % to 0.05 % for both
quantities depending on the deviation of the NMIs’ results for the ND 1006 chamber
from its reference calibration coefficients.
The RNMI and NMIR values can be seen in Figure 4 and in Figure 5. The
uncertainty bars of the average values are the relative standard uncertainties of the
laboratories as they were reported. The detailed uncertainty budgets of each
laboratory for both quantities are calculated according to the GUM [15] and given
in Appendix E
Metrologia 47 (2010) Tech. Suppl. 06012

Final report EURAMET project 813 24/46
Normalised air kerma calibration coefficients of the transfer chambers
MK
EH
CN
EA_C
AE
LNE-
LNH
B_1
CIE
MA
T
CM
I
RM
TC
SSM
STU
K
NR
PA
SMU
IAE
A
HAE
C-H
IRC
L
NC
M
IRB
GU
M
ITN
-LM
RIR
PTB
BEV
ME
TAS
VSL
ENEA
NIS
T
NR
C
LNM
RI
VNIIM
LNE-
LNH
B_2
AR
PAN
SA
0.975
0.980
0.985
0.990
0.995
1.000
1.005
1.010
1.015
Participant laboratories
NK
,lab/N
,K,re
f
PTW 30001 Wellhöffer FC-65 G NE2561 ND 1006 w.mean
Figure 4. Graph of the normalized average air kerma calibration coefficients of the
transfer chambers, and the weighted mean, NMIR , values of participants. (The bold-text participants are traceable to primary standard other than the BIPM standard.)
Normalised absorbed dose to water calibration coefficients of the transfer chambers
CN
EA
_CA
E
LNE-
LNH
B_1
CIE
MA
T
CM
I*
RM
TC
SSM ST
UK
NR
PA
SMU
IAE
A
HA
EC-H
IRC
L
IRB
ITN
-LM
RIR
PTB
BEV MET
AS
VSL
ENEA
NIS
T
NR
C
LNM
RI
LNE-
LNH
B_2
AR
PAN
SA
MK
EH
0.980
0.985
0.990
0.995
1.000
1.005
1.010
1.015
1.020
1.025
Participant laboratories
NK
,lab/N
, K,re
f
PTW 30001 Welföffer FC-65G NE 2561 ND 1006 w. mean
Figure 5.Graph of the normalized average absorbed dose to water calibration coefficients of the transfer chambers, and the weighted mean, NMIR , values of participants. (The bold-text participants are traceable to primary standard other than the BIPM standard.)
Metrologia 47 (2010) Tech. Suppl. 06012
Final report EURAMET project 813 25/46
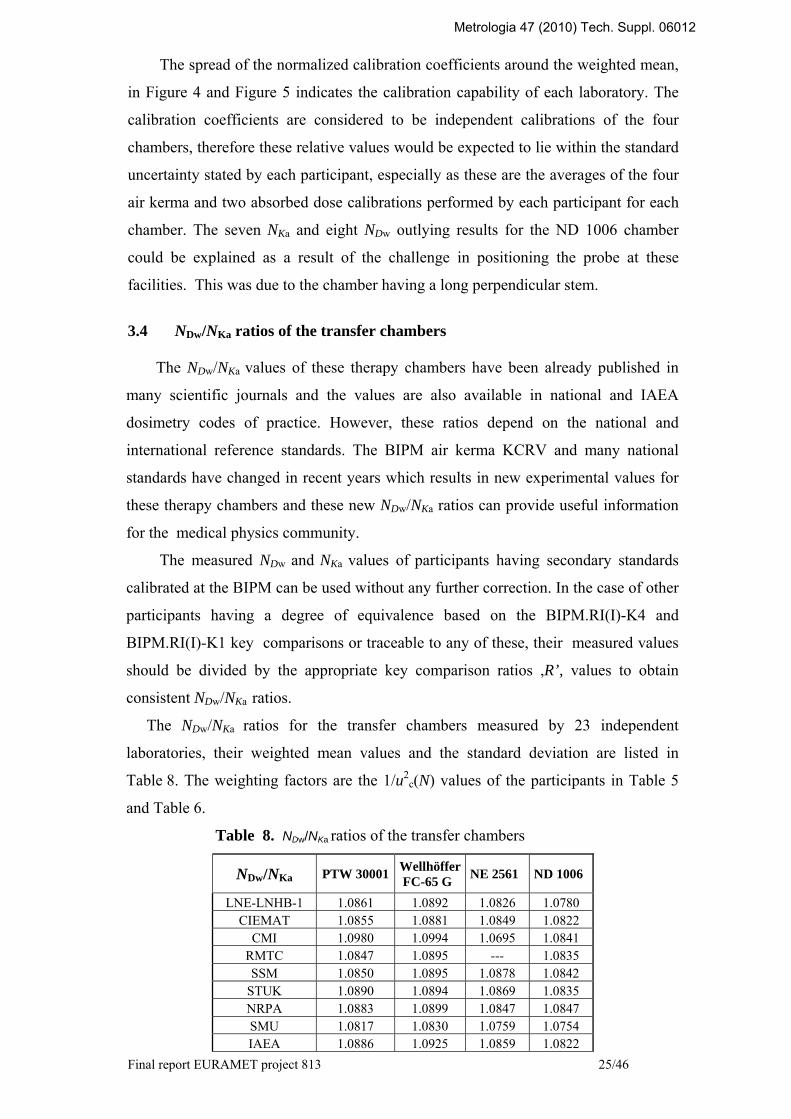
The spread of the normalized calibration coefficients around the weighted mean,
in Figure 4 and Figure 5 indicates the calibration capability of each laboratory. The
calibration coefficients are considered to be independent calibrations of the four
chambers, therefore these relative values would be expected to lie within the standard
uncertainty stated by each participant, especially as these are the averages of the four
air kerma and two absorbed dose calibrations performed by each participant for each
chamber. The seven NKa and eight NDw outlying results for the ND 1006 chamber
could be explained as a result of the challenge in positioning the probe at these
facilities. This was due to the chamber having a long perpendicular stem.
3.4 NDw/NKa ratios of the transfer chambers
The NDw/NKa values of these therapy chambers have been already published in
many scientific journals and the values are also available in national and IAEA
dosimetry codes of practice. However, these ratios depend on the national and
international reference standards. The BIPM air kerma KCRV and many national
standards have changed in recent years which results in new experimental values for
these therapy chambers and these new NDw/NKa ratios can provide useful information
for the medical physics community.
The measured NDw and NKa values of participants having secondary standards
calibrated at the BIPM can be used without any further correction. In the case of other
participants having a degree of equivalence based on the BIPM.RI(I)-K4 and
BIPM.RI(I)-K1 key comparisons or traceable to any of these, their measured values
should be divided by the appropriate key comparison ratios ,R’, values to obtain
consistent NDw/NKa ratios.
The NDw/NKa ratios for the transfer chambers measured by 23 independent
laboratories, their weighted mean values and the standard deviation are listed in
Table 8. The weighting factors are the 1/u2c(N) values of the participants in Table 5
and Table 6.
Table 8. NDw/NKa ratios of the transfer chambers
NDw/NKa PTW 30001 Wellhöffer FC-65 G NE 2561 ND 1006
LNE-LNHB-1 1.0861 1.0892 1.0826 1.0780 CIEMAT 1.0855 1.0881 1.0849 1.0822
CMI 1.0980 1.0994 1.0695 1.0841 RMTC 1.0847 1.0895 --- 1.0835 SSM 1.0850 1.0895 1.0878 1.0842
STUK 1.0890 1.0894 1.0869 1.0835 NRPA 1.0883 1.0899 1.0847 1.0847 SMU 1.0817 1.0830 1.0759 1.0754 IAEA 1.0886 1.0925 1.0859 1.0822
Metrologia 47 (2010) Tech. Suppl. 06012

Final report EURAMET project 813 26/46
HAEC-HIRCL 1.0913 1.0899 1.0869 1.0763 IRB 1.0869 1.0882 1.0893 1.0822
ITN-LMRIR 1.0858 1.0827 1.0789 1.0694 PTB 1.0849 1.0869 1.0857 1.0812 BEV 1.0880 1.0924 1.0863 1.0849
METAS 1.0901 1.0934 1.0907 1.0878 VSL 1.0900 1.0922 1.0938 ---
ENEA 1.0933 1.0962 1.0863 1.0842 NIST 1.0934 1.0914 --- 1.0789 NRC 1.0877 1.0905 1.0861 1.0826
LNMRI-IRD 1.0865 1.0879 1.0878 1.0926 LNHB_2 1.0815 1.0893 1.0817 1.0768
ARPANSA 1.0882 1.0913 1.0825 1.0806 CNEA-CAE 1.0989 1.1070 1.1064 1.0787
MKEH 1.0903 1.0931 1.0845 1.0830 weighted mean 1.0878 1.0903 1.0860 1.0819
st.dev. 0.0009 0.0010 0.0015 0.0009
These mean values are not recommended as replacements for measured NDw
calibration coefficients in therapy practice, since the variation of the NDw/NKa ratios of
series of these chambers has been reported to be significantly higher [4] than the
standard deviation for a single chamber of each type as in Table 8.
Metrologia 47 (2010) Tech. Suppl. 06012

Final report EURAMET project 813 27/46
3.5 Proposal for the degrees of equivalence
The degree of equivalence for each participant NMI, DNMI, with respect to the
reference value is expressed as a difference and the uncertainty of that difference (see
section 3.3). The differences are
1- = NMI,NMI, KK RD (3a)
1-= NMI,NMI DD, R D (3b) for air kerma ,(1a), and absorbed dose to water (3b),
where NMI,KR is the weighted mean of the
RK,NMI=(NK,NMI/NK,ref) (4a)
ratios measured for the four transfer chambers
and NMI,DR is the weighted mean of the
RD,NMI=(ND,NMI/ ND,ref) (4b)
ratios measured for the four transfer chambers.
The expanded uncertainties (k = 2) for the degrees of equivalence are
UK,NMI = 2u NMI,KR (5a)
UD,NMI = 2u NMI,DR (5b)
for air kerma ,(5a), and absorbed dose to water (5b).
The variance of the average ratio, NMI,KR is:
( )⎟⎟⎠
⎞⎜⎜⎝
⎛+−+++= ∑
=1
2222222R
2 )()()()()()(NMIK,
iBIPMairiNMIairiistabKairlinkKairBIPMairNMIKair KuKufNuNuKuNuu &
(6a)
and the variance of the average ratio, NMID,R is:
( )⎟⎠
⎞⎜⎝
⎛+−+++= ∑
=
2
1
2222222R
2 )()()()()()(NMID,
iBIPMwiNMIwiistabDwlinkDwBIPMwNMIDw DuDufNuNuDuNuu
(6b)
where the five components in (6a) are:
1. NMIair )( KNu values are in the last column of Table 5.
2. BIPMair )(Ku & = 0.15 %. [11]
3. linkair )( KNu is determined as n
Nu meanlinkKairj ,)(where n = number of the linking
laboratories, meanlinkKairj Nu ,)( the average )( Kairj Nu values of the linking
laboratories , and )( Kairj Nu comprises on the following components:
a) Statistical uncertainty of the air kerma determinations at the linking laboratory
j.
Metrologia 47 (2010) Tech. Suppl. 06012
Final report EURAMET project 813 28/46
b) Statistical uncertainty of the air kerma determination of the linking laboratory
j at the BIPM.
c) Statistical uncertainty of the transfer instrument calibrations at the linking
laboratory j.
d) The non statistical uncertainties of current measurements at the linking
laboratory j.
The above mentioned uncertainty components of )( airKj Nu were obtained from
the BIPM reports on the key comparisons of the seven link laboratories and the
reported uncertainty budget of this comparison program. The calculated value of
linkair )( KNu = 0.041 %
4. The average standard deviation of the recalibrations of the four transfer chambers
performed at MKEH, stabKairNu )( = 0.031 % (see section 2.4).
5. The NMIairi Ku )( and BIPMairi Ku )( terms denote the correlated uncertainty
components. Five uncertainties are fully correlated (f i = 1) [ρair; (μen/ρ)a,c; sc,a,&
W/e; g; kh] in the air kerma determination between the BIPM and each participant.
The summation of these for the BIPM standard is 0.00122. The same value was
used for all participants except for LNHB, VSL, BEV and GUM for which
0.00282, 0.00262 , 0.342 % and 0.342 % were used respectively. Regarding the
uncertainty of the cavity chamber wall correction (kwall), a value of f i = 0.8
recommended by the CCRI(I) is used. This is due to the fact that the wall
correction is calculated by all primary laboratories using similar Monte Carlo
methods. For the case of NMIs that are traceable to the BIPM, the non statistical
uncertainty components used for determining the air kerma the BIPM, are
considered to be correlated with f i = 1, so the summation is 2 × 0.00152.
In the equation (4b) the NMIDwNu )( values are in the last column of Table 6, and
the BIPMwDu )( =0.0029 [11]. The linkDwNu )( calculation is similar to the linkKairNu )(
calculation being based on the nine linking laboratories and its value is given by
linkDwNu )( =0.05%. For the calculation of the four (a. to d.) components for )( Dwj Nu
values, the primary standard calorimeters, having higher statistical uncertainty
components, were supposed to establish the reference absorbed dose to water. The
stabDwNu )( = 0.029%. (see section 2.4).
The correlated uncertainty components )( wi Du between the participants having a
graphite calorimeter, and the BIPM having graphite cavity chamber, are the u(1+ε)w,c
and u(μen/ρ)w,c with correlation coefficients taken as (fi = 0.7) and (fi = 0.95),
Metrologia 47 (2010) Tech. Suppl. 06012

Final report EURAMET project 813 29/46
respectively [11]. For the rest of the participants there are no further correlated
components for the absorbed dose to water determination. For an NMI traceable to
the BIPM, all of the non-statistical uncertainty components of absorbed dose to water
determinations at the BIPM are correlated with f i = 1, so the summation is
2 × 0.00212
The calculated degrees of equivalence using equations 3a, 4a, 5a, 6a for air
kerma are in Table 9 and illustrated in Figure 6. The calculated degrees of
equivalence using equations 3b, 4b, 5b, 6b for absorbed dose to water are in Table 10
and illustrated in Figure 7.
Table 9. Degrees of equivalence, in terms of the difference Di, with respect to the
key comparison reference value and its associated expanded (k = 2) uncertainty, U(Di), for air kerma. (The bold-text participants are traceable to a primary standard other than the BIPM standard.)
Participants
Di (mGy/Gy)
U(Di) (mGy/Gy
aLNE-LNHB -1.9 4.8 CIEMAT -1.5 3.9
CMI -5.8 14.1 RMTC -1.3 9.6 SSM 1.0 7.5
STUK -2.3 7.3 NRPA 5.1 7.1 SMU 5.2 6.5 IAEA 0.0 7.5
HAEC-HIRCL 4.2 11.9 BIM -4.5 13.0 IRB 4.1 7.2
GUM -12.5 17.4 ITN-LMRIR -0.4 6.0
PTB 8.3 3.4 BEV 5.4 5.0
METAS -1.3 4.6 VSL -3.7 7.8
ENEA -0.9 7.6 NIST 3.4 6.4 NRC 4.2 4.8
LNMRI-IRD 2.4 13.7 VNIIM -0.8 4.0
ARPANSA -1.0 10.6 CNEA-CAE 1.8 10.0
bMKEH 4.7 4.0 a Average of the two sets of measurements b Based on the first measurement performed on February 2005
Metrologia 47 (2010) Tech. Suppl. 06012

Final report EURAMET project 813 30/46
Degrees of equivalence for air kerma
EN
EA
MK
EH
CN
EA_
CA
E
AR
PA
NS
A
VNIIM
LNM
RI
NR
C
NIS
T
VSL
ME
TAS
BE
V
PTB
ITN
-LM
RIR
GU
M
IRB
BIM
HAE
C-H
IRC
L
IAE
A
SMU
NR
PA
STU
K
SS
M
RM
TC
CM
I
CIE
MA
T
LNE
Í-LN
HB
-35,0
-30,0
-25,0
-20,0
-15,0
-10,0
-5,0
0,0
5,0
10,0
15,0
20,0
Participant laboratories
Di (
mG
y/G
y)
Di=(Xi-XRi)/XRi (mGy/Gy)
Figure 6. Degrees of equivalence for air kerma Table 10. Degrees of equivalence in terms of the difference Di, with respect to the key
comparison reference value and its expanded (k = 2) uncertainty, U(Di), for absorbed dose to water. (The bold-text participants are traceable to a primary standard other than the BIPM standard.)
Participants
Di
(mGy/Gy) U(Di)
(mGy/Gy) aLNE-LNHB -4.8 10.3
CIEMAT -4.9 7.3 CMI -4.0 23.6
RMTC -5.3 12.0 SSM -1.4 10.0
STUK -3.9 8.5 NRPA 3.2 8.8 SMU -4.7 24.7 IAEA -0.4 10.0
HAEC-HIRCL 3.0 12.4 IRB -6.6 20.3
ITN-LMRIR -7.1 13.0 PTB -3.6 7.4 BEV -1.7 10.1
METAS 0.4 10.6 VSL -3.4 8.5
ENEA -1.1 8.3 NIST -0.6 11.1 NRC -1.8 10.4
LNMRI-IRD 1.0 15.0 ARPANSA 2.4 9.1 CNEA-CAE 12.0 17.9
bMKEH -2.4 9.6 a Average of the two series of measurements b Based on the first measurement performed on February 2005
Metrologia 47 (2010) Tech. Suppl. 06012
Final report EURAMET project 813 31/46
Degrees of equivalence for absorbed dose to water
MK
EH
CN
EA
_CA
E
ARPA
NS
A
LNM
RI
NR
C
NIS
T
EN
EA
VS
L
ME
TAS
BEV
CIE
MA
T
LNE-
LNH
B
CM
I
RM
TC
SS
M
STU
K
NR
PA
SM
U
IAEA
HA
EC
-HIR
CL
IRB
ITN
PTB
-35,0
-30,0
-25,0
-20,0
-15,0
-10,0
-5,0
0,0
5,0
10,0
15,0
20,0
25,0
30,0
Participant laboratories
Di (
mG
y/G
y)Di=(Xi-XRi)/XRi (mGy/Gy)
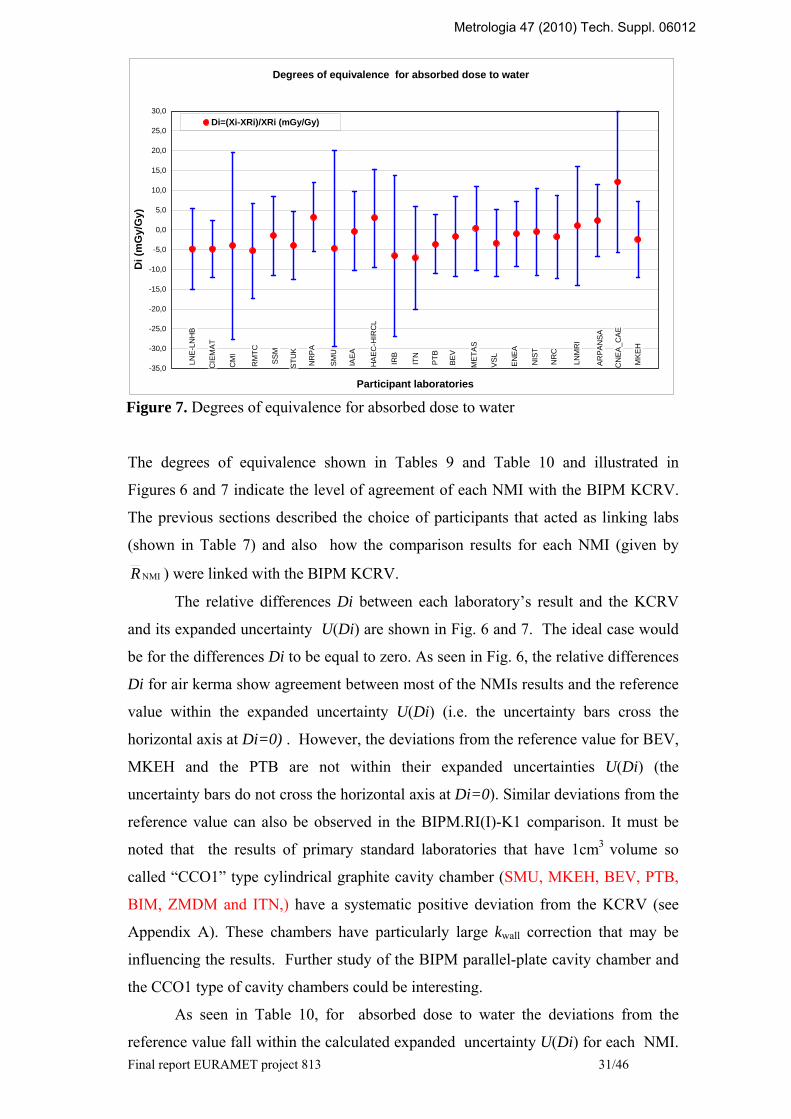
Figure 7. Degrees of equivalence for absorbed dose to water The degrees of equivalence shown in Tables 9 and Table 10 and illustrated in
Figures 6 and 7 indicate the level of agreement of each NMI with the BIPM KCRV.
The previous sections described the choice of participants that acted as linking labs
(shown in Table 7) and also how the comparison results for each NMI (given by
NMIR ) were linked with the BIPM KCRV.
The relative differences Di between each laboratory’s result and the KCRV
and its expanded uncertainty U(Di) are shown in Fig. 6 and 7. The ideal case would
be for the differences Di to be equal to zero. As seen in Fig. 6, the relative differences
Di for air kerma show agreement between most of the NMIs results and the reference
value within the expanded uncertainty U(Di) (i.e. the uncertainty bars cross the
horizontal axis at Di=0) . However, the deviations from the reference value for BEV,
MKEH and the PTB are not within their expanded uncertainties U(Di) (the
uncertainty bars do not cross the horizontal axis at Di=0). Similar deviations from the
reference value can also be observed in the BIPM.RI(I)-K1 comparison. It must be
noted that the results of primary standard laboratories that have 1cm3 volume so
called “CCO1” type cylindrical graphite cavity chamber (SMU, MKEH, BEV, PTB,
BIM, ZMDM and ITN,) have a systematic positive deviation from the KCRV (see
Appendix A). These chambers have particularly large kwall correction that may be
influencing the results. Further study of the BIPM parallel-plate cavity chamber and
the CCO1 type of cavity chambers could be interesting.
As seen in Table 10, for absorbed dose to water the deviations from the
reference value fall within the calculated expanded uncertainty U(Di) for each NMI.
Metrologia 47 (2010) Tech. Suppl. 06012

Final report EURAMET project 813 32/46
An interesting point is that the Di values for all European SSDLs, except for HAEC-
HIRCL (Greece) and NRPA (Norway), have negative values between -1.5 mGy/Gy
and -7.2 mGy/Gy. All these SSDLs are traceable directly to the BIPM.
It is interesting to compare the results reported here with previously published
BIPM and the available RMO key comparison results BIPM.RI(I)-K4, [12,16]. For
this purpose, the available RMO air kerma and absorbed dose to water key
comparisons are shown in Fig. 8 and Fig. 9 (Appendix A). Note that these values are
indicative only, as the accepted degrees of equivalence are those published in the
KCDB, (the COOMET results are under publication) being one result per NMI. The
laboratories that participated in BIPM key comparisons are indicated in Fig. 8 and
Fig. 9 by adding the word “key” next to the name of the NMI. The data for all the
other laboratories shown in the Fig. 8 and Fig. 9 result from RMO key comparisons.
While comparing the results shown in Fig.8 and Fig. 9 one should keep in mind that
the reference value determination of an RMO key comparison involves one or more
linking laboratories and transfer instruments. As a result, larger uncertainties values
U(Di) are expected for RMO key comparison relative to the BIPM key comparisons.
3.6 Proposal for the degrees of equivalence between pairs of participants
For the air kerma standard for each pair of NMIs i and j, Di,j = iK,R - jK,R and its
variance is
⎟⎠
⎞⎜⎝
⎛++−+= ∑
=stabKairkjk
kkikjKairiKairji NuKufKufNuNuu )(2))()(()()( 22
.2
6
1
2.
2222, (7a)
when the participants, i and j are traceable to different primary standards.
The uk(K) means the uncertainties of the fully (fk = 1) correlated constants for the air
kerma determination [ρair; (μen/ρ)a,c; sc,a, and W/e; g; kh] between the participants i
and j. and u(kwall)correction with f 6 = 0.8 if both i and j participant used Monte
Carlo methods for its calculation.
When both i and j are traceable to the same laboratory, e.g. the BIPM,
( )stabKairBIPMairjKairiKairji NuKuNuNuu )(2)(2)()( 22222, +−+= & (7b)
For the absorbed dose to water standard for each pair i and j, Di,j= iD,R - jD,R and its
variance is ( )stabDwjDiDji NuNuNuuww
)(2)()( 2222, ++= (8a)
when one participant is traceable to a water calorimeter and the other is traceable to
the BIPM graphite cavity standard or to a graphite calorimeter.
When one participant is traceable to a graphite calorimeter and the other is traceable
to the BIPM graphite cavity standard the variance is
Metrologia 47 (2010) Tech. Suppl. 06012

Final report EURAMET project 813 33/46
⎟⎠
⎞⎜⎝
⎛+−−+= ∑∑
==stabDw
kjwkk
kiwkkjDiDji NuDufDufNuNuu
ww)(2))(())(()()( 2
2
1
22
1
2222, (8b)
where f1=0.95; u1=u((μen/ρ)w,c and f2=0.7; u2=u(1+ε)w,c
When both i and j participants have the same water or graphite calorimeter the
variance is
⎟⎠
⎞⎜⎝
⎛+−−+= ∑∑ stabDwj
kwkki
kwkkjDiDji NuDufDufNuNuu
ww)(2))(())(()()( 222222
, (8c)
where the (fkuk)i and (fkuk)j values are published in the Final report for BIPM.RI-K4 [17] When both i and j are traceable to the same laboratory e.g. the BIPM, the variance is
( )stabDwBIPMwjDiDji NuDuNuNuuww
)(2)(2)()( 22222, +−+= & (8d)
The correlated uncertainty components between NMIs, being traceable to the BIPM
in equations (7b) and (8d) can be estimated with the u BIPMairK )( & and u BIPMwD )( & terms
since only the uncertainties of the current measurements are uncorrelated, but these
are normally negligible. The calculated pair-wise degrees of equivalence, (Dij) and its
expanded uncertainties, (Uij), using equations 7a, 7b and 8a-8d for air kerma and
absorbed dose to water, are in the Appendices B and C. 4 Summary and conclusion
An unprecedented international comparison involving 26 countries was conducted
for the purpose of linking the measurement standards for air kerma and absorbed dose
to water to each other. High stability transfer instruments were used for this work
which enabled each participant to establish the degrees of equivalence, DoE, of their
national standards for air kerma and absorbed dose to water. This international effort
allowed participating SSDLs to obtain for the first time their degrees of equivalence
to be included in the BIPM KCDB. A total of 11 new air kerma and 14 new absorbed
dose to water degrees of equivalence values will be added to the KCDB.
Furthermore, these new values can be used to support the relevant CMC claims of
each of these participants. The average calibration coefficient values, used for the
calculations made in this work, indicated that the deviations from the key comparison
reference values are within the calculated expanded uncertainty U(Di) (k = 2) for
each participant for both quantities except for the BEV, PTB and the MKEH only in
terms of air kerma, similar to their BIPM.RI(I)- K1 results.
Metrologia 47 (2010) Tech. Suppl. 06012

Final report EURAMET project 813 34/46
This work was beneficial for all the participants. One of the benefits was that
they could validate their calibration techniques. This was achieved by having to
calibrate four high quality transfer instruments at each facility using two independent
current measuring devices. Furthermore, each participant had to review their
uncertainty analysis and this will have a direct impact on the uncertainties stated in
every participants’ CMC claims.
This regional key comparison was the first to make use of a complete dosemeter
system (chamber, electrometer and data acquisition system) that was shipped to all
participants. Considering the resulting values of degrees of equivalence, the
robustness of the EURAMET.RI(I)-K1 and EURAMET.RI(I)-K4 key comparisons
are comparable with the respective BIPM.RI(I)-K1 and BIPM.RI(I)-K4 key
comparisons.
Acknowledgements
The significant contribution to the measurement set-up of Mr. G. Machula, the PC
based data collection and recording of A. Szögi at MKEH, the co-pilot activity of
Ronaldo Minniti at NIST, and the improvements to the report suggested by members
of CCRI(I) particularly P. J. Allisy and D.T. Burns are gratefully acknowledged.
5. References 1. MRA : Mutual recognition of national measurement standards and of calibration
and measurement certificates issued by national metrology institutes, International
Committee for Weights and measures, 1999, MRA_2003.pdf
2. IAEA TRS No. 398, Absorbed Dose Determination in External Beam
Radiotherapy
3. ISO International Organisation for Standardisation (1996). “X and gamma
reference radiation for calibrating dosemeters and dose rate meters and for
determining their response as a function of photon energy – Part 1: Radiation
characteristics and production methods.” ISO 4037-1:1996(E).
4. EUROMET Guide 3 Version 2.7“Guidelines on Conducting Comparisons”
5. CIPM, “Guidelines for CIPM key comparisons” modified in October 2003
6. D. T. Burns, P.J. Allisy Roberts, The evaluation of degrees of equivalence of
regional dosimetry comparisons, CCRI(I)/07-04,
7. Comité Consultatif des Rayonnements Ionisants, 16th meeting (1999), 1999, 203
Metrologia 47 (2010) Tech. Suppl. 06012

Final report EURAMET project 813 35/46
8. Allisy P.J., Burns D.R., Andreo P., 2009, International framework of traceability
for radiation dosimetry quantities, Metrologia, 46(2), S1-S8
9. Kessler C., Roger P., Burns D.T., Allisy P.J., Machula G., Csete I., Rabus H.,
Comparison of the standards for air kerma of the MKEH and the BIPM for 60Co
gamma radiation, Rapport BIPM-2006/07, 14 pp
10. Allisy-Roberts P.J., Burns D.T., Csete I., Comparison of the standards of absorbed
dose to water of the MKEH and the BIPM for 60Co γ rays, Rapport BIPM-
2003/08, 11 pp
11. D. T. Burns P.J. Allisy Roberts and C. Kessler, 2007, Re-evaluation of the BIPM
international standard for air kerma in Co-60 gamma radiation, Metrologia ,
44(6), L53-L56
12. Allisy-Roberts P.J., Burns D.T., Kessler C., 2007, Summary of the BIPM.RI(I)-
K1 comparison for air kerma in 60Co gamma radiation, Metrologia, 44, Tech.
Suppl., 06006
13. P.J. Allisy-Roberts, D.T. Burns. C. Kessler, F. Delanuay and E. Leroy,
Comparison of the standards for air kerma of the BNM-LNHB and the BIPM for
60Co γ rays, Rapport-BIPM-2006/02
14. P.J. Allisy-Roberts, D.T. Burns. C. Kessler, F. Delanuay and E. Leroy,
Comparison of the standards for absorbed dose to water of the BNM-LNHB and
the BIPM for 60Co γ rays Rapport BIPM-2005/12
15. International Organisation for Standardisation (1993). “Guide to the Expression of
Uncertainty in Measurement. Geneva, ISBN 92-67-10188-9.GUM-pdf
16. C. K. Ross and K. R. Shortt, Final report of the SIM Co-60 air kerma
comparison SIM RI(I)-K1 SIM.RI(I)-K1_and Final Report of the SIM Co-60
Absorbed dose to water Comparison (KCDB Entry SIM.RI(I)-K4), 2008,
SIM.RI(I)-K4_
17. C. Kessler, P.J. Allisy-Roberts, D.T. Burns, P. Roger, L.A. de Prez, J.A. de
Pooter, P.M.G.Damen, Comparison of the standard for absorbed dose to water of
the VSL and the BIPM for 60Co gamma rays Metrologia, 46, Tech. Suppl. 06009
Metrologia 47 (2010) Tech. Suppl. 06012

Final report EURAMET project 813 36/46
Appendix A
Results of EURAMET.RI(I)-K1, SIM.RI(I)-K1 and COOMET.RI(I)-K1 air kerma key comparisonsIn case of the PSDL participants the (key) denotes their DoE values used in the EURAMET.RI(I)-K1comparison
LNE
-LN
HB
(key
)LN
E-L
NH
B
SM
U
SM
U (k
ey)
BIM
B
IM (k
ey)
PTB
P
TB (k
ey)
BE
VB
EV
(key
)M
KE
HM
KE
H (k
ey)
ME
TAS
VS
LV
SL
(key
)E
NE
AE
NE
A (k
ey)
ITN
-LM
RIR
ITN
(key
)N
IST
NIS
T (k
ey)
NIS
T (S
IM)
NR
CN
RC
(key
)V
NIIM
V
NIIM
(key
)A
RP
AN
SA
A
RP
AN
SA
(key
)LN
MR
I LN
MR
I (ke
y)LN
MR
I (S
IM)
ZMD
M (k
ey)
NM
IJ (k
ey)
CIE
MA
TC
MI
RM
TCR
MTC
(CO
OM
ET)
Bel
grim
(CO
OM
ET)
SS
MS
TUK
NR
PA
IAE
A
IAE
A (S
IM)
HA
EC
-HIR
CL
IRB
GU
MC
NE
A_C
AE
C
NE
A_C
AE
(SIM
)C
PH
R (C
OO
ME
T)IN
IN (S
IM)
LSC
D (S
IM)
-20,0
-15,0
-10,0
-5,0
0,0
5,0
10,0
15,0
20,0
Laboratories
Di=(Xi-XRi)/XRi (mGy/Gy)
Figure 8. Results of EURAMET.RI(I)-K1, SIM.RI(I)-K1 and COOMET.RI(I)-K1 air kerma key comparisons. The (key) denotes the DoE values of PSDL participants used in the EURAMET.RI(I)-K1comparison
Metrologia 47 (2010) Tech. Suppl. 06012
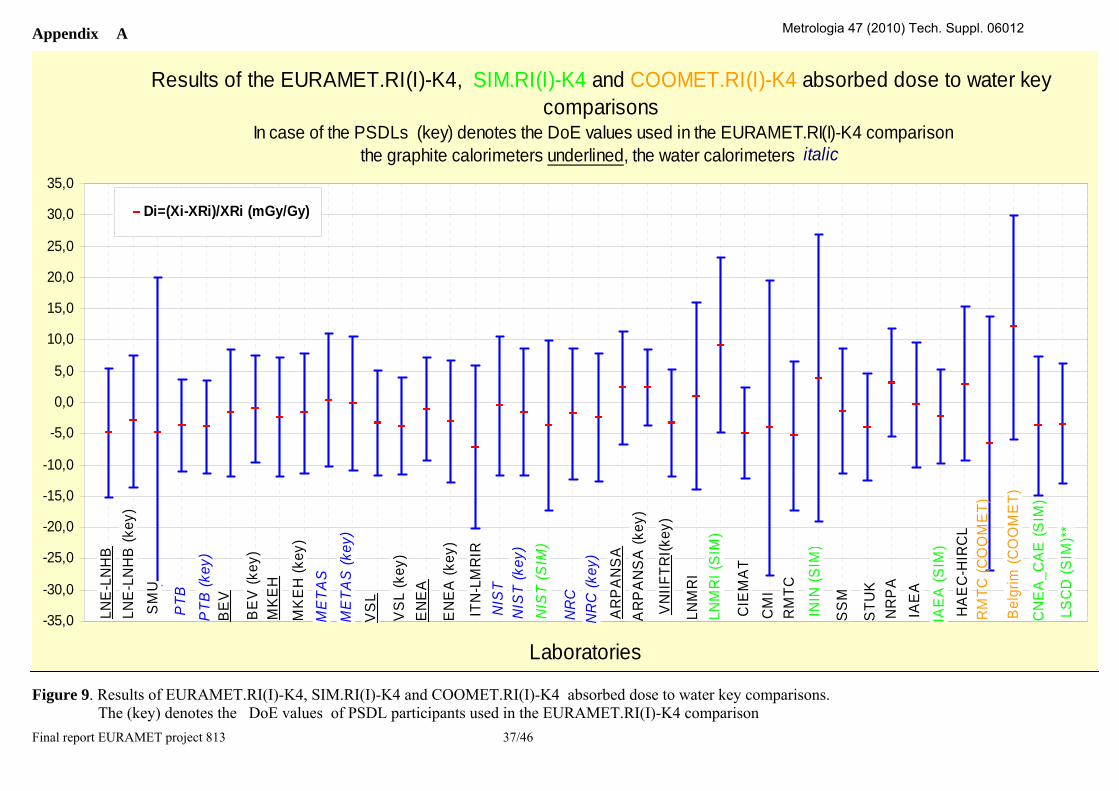
Final report EURAMET project 813 37/46
Appendix A
LSC
D (S
IM)*
*
CN
EA
_CA
E (S
IM)
Bel
grim
(CO
OM
ET)
RM
TC (C
OO
ME
T)H
AE
C-H
IRC
LIA
EA
(SIM
)IA
EA
N
RP
AS
TUK
SS
M
ININ
(SIM
)
RM
TCC
MI
CIE
MA
T
LNM
RI (
SIM
)LN
MR
I
VN
IIFTR
I (key
)
AR
PA
NS
A (k
ey)
AR
PA
NS
AN
RC
(key
)N
RC
NIS
T (S
IM)
NIS
T (k
ey)
NIS
TIT
N-L
MR
IR
EN
EA
(key
)
EN
EA
VS
L (k
ey)
VS
LM
ETA
S (k
ey)
ME
TAS
MK
EH
(key
)
MK
EH
BE
V (k
ey)
BE
VP
TB (k
ey)
PTB
SM
U
LNE
-LN
HB
LNE
-LN
HB
(key
)
-35,0
-30,0
-25,0
-20,0
-15,0
-10,0
-5,0
0,0
5,0
10,0
15,0
20,0
25,0
30,0
35,0
Laboratories
Di=(Xi-XRi)/XRi (mGy/Gy)
Results of the EURAMET.RI(I)-K4, SIM.RI(I)-K4 and COOMET.RI(I)-K4 absorbed dose to water key comparisons
In case of the PSDLs (key) denotes the DoE values used in the EURAMET.RI(I)-K4 comparisonthe graphite calorimeters underlined, the water calorimeters italic
Figure 9. Results of EURAMET.RI(I)-K4, SIM.RI(I)-K4 and COOMET.RI(I)-K4 absorbed dose to water key comparisons. The (key) denotes the DoE values of PSDL participants used in the EURAMET.RI(I)-K4 comparison
Metrologia 47 (2010) Tech. Suppl. 06012

Final report EURAMET project 813 38/46
Appendix B Pair-wise degrees of equivalence, Dij, with its expanded uncertainty, U(Dij) for air kerma standards lab i lab j
air kerma Di (mGy/Gy)
U(Di) (mGy/Gy) Di,j U(Di,j) Di,j U(Di,j) Di,j U(Di,j) Di,j U(Di,j) Di,j U(Di,j) Di,j U(Di,j) Di,j U(Di,j)
LNE-LNHB -1.9 4.8 --- --- -0.48 6.10 3.91 14.81 -0.60 10.68 -2.97 8.84 0.35 8.66 -7.02 8.52CIEMAT -1.5 3.9 0.48 6.10 --- --- 4.39 14.62 -0.13 10.41 -2.49 8.51 0.82 8.32 -6.54 8.18
CMI -5.8 14.1 -3.91 14.81 -4.39 14.62 --- --- -4.51 17.05 -6.88 15.96 -3.56 15.86 -10.93 15.78LNMC-RMTC -1.3 9.6 0.60 10.68 0.13 10.41 4.51 17.05 --- --- -2.37 12.22 0.95 12.09 -6.41 12.00
SSM 1.0 7.5 2.97 8.84 2.49 8.51 6.88 15.96 2.37 12.22 --- --- 3.32 10.50 -4.05 10.39STUK -2.3 7.3 -0.35 8.66 -0.82 8.32 3.56 15.86 -0.95 12.09 -3.32 10.50 --- --- -7.36 10.24NRPA 5.1 7.1 7.02 8.52 6.54 8.18 10.93 15.78 6.41 12.00 4.05 10.39 7.36 10.24 --- ---SMU 5.2 6.5 7.11 7.89 6.64 7.52 11.02 15.45 6.51 11.55 4.15 9.87 7.46 9.71 0.10 9.59IAEA 0.0 7.5 1.97 8.84 1.50 8.51 5.88 15.96 1.37 12.22 -0.99 10.65 2.32 10.50 -5.04 10.39
HAEC-HIRCL 4.2 11.9 6.11 12.77 5.63 12.54 10.02 18.42 5.50 15.31 3.14 14.08 6.45 13.97 -0.91 13.88BIM -4.5 13.0 -2.61 13.84 -3.08 13.64 1.30 19.19 -3.21 16.22 -5.58 15.07 -2.26 14.96 -9.62 14.88IRB 4.1 7.2 5.98 8.45 5.51 8.11 9.90 15.75 5.38 11.95 3.02 10.33 6.33 10.18 -1.03 10.06
GUM -12.5 17.4 -10.60 18.04 -11.07 17.88 -6.69 22.40 -11.20 19.92 -13.56 18.99 -10.25 18.91 -17.61 18.85ITN-LMRIR -0.4 6.0 1.52 7.59 1.05 7.21 5.43 15.30 0.92 11.36 -1.44 9.64 1.87 9.48 -5.49 9.35
PTB 8.3 3.4 10.28 5.58 9.80 5.04 14.19 14.41 9.68 10.12 7.31 8.15 10.63 7.95 3.26 7.81BEV 5.4 5.0 7.36 6.70 6.88 6.26 11.27 14.88 6.76 10.78 4.39 8.96 7.70 8.78 0.34 8.64
METAS -1.3 4.6 0.62 6.58 0.15 6.13 4.53 14.82 0.02 10.70 -2.34 8.86 0.97 8.68 -6.39 8.55VSL -3.7 7.8 -1.75 9.00 -2.22 8.68 2.16 16.05 -2.35 12.34 -4.71 10.79 -1.40 10.64 -8.76 10.53
ENEA -0.9 7.6 1.03 8.79 0.56 8.46 4.94 15.93 0.43 12.19 -1.93 10.61 1.38 10.46 -5.98 10.34NIST 3.4 6.4 5.34 7.76 4.86 7.38 9.25 15.38 4.74 11.47 2.37 9.77 5.69 9.61 -1.68 9.49NRC 4.2 4.8 6.10 6.51 5.63 6.06 10.01 14.79 5.50 10.66 3.13 8.81 6.45 8.63 -0.91 8.50
LNMRI 2.4 13.7 4.35 14.50 3.88 14.30 8.26 19.66 3.75 16.78 1.39 15.67 4.70 15.56 -2.66 15.49VNIIM -0.8 4.0 1.18 5.97 0.70 5.48 5.09 14.56 0.58 10.34 -1.79 8.42 1.53 8.23 -5.84 8.09
ARPANSA -1.0 10.6 0.94 11.63 0.46 10.95 4.85 17.36 0.34 14.03 -2.03 12.68 1.29 12.56 -6.08 12.46CNEA_CAE 1.8 10.0 3.77 11.06 3.30 10.80 7.68 17.28 3.17 13.91 0.80 12.55 4.12 12.43 -3.24 12.33
MKEH 4.7 4.0 6.60 5.97 6.12 5.48 10.51 14.56 6.00 10.34 3.63 8.42 6.95 8.23 -0.42 8.09
LNMC-RMTC SSM STUK NRPACMICIEMATLNE-LNHB
The bolded NMIs are traceable to other primary standard than the BIPM
Metrologia 47 (2010) Tech. Suppl. 06012

Final report EURAMET project 813 39/46
Appendix B Pair-wise degrees of equivalence, Dij, with its expanded uncertainty, U(Dij) for air kerma standards lab i lab j
air kerma Di (mGy/Gy)
U(Di) (mGy/Gy)
LNE-LNHB -1.9 4.8CIEMAT -1.5 3.9
CMI -5.8 14.1LNMC-RMTC -1.3 9.6
SSM 1.0 7.5STUK -2.3 7.3NRPA 5.1 7.1SMU 5.2 6.5IAEA 0.0 7.5
HAEC-HIRCL 4.2 11.9BIM -4.5 13.0IRB 4.1 7.2
GUM -12.5 17.4ITN-LMRIR -0.4 6.0
PTB 8.3 3.4BEV 5.4 5.0
METAS -1.3 4.6VSL -3.7 7.8
ENEA -0.9 7.6NIST 3.4 6.4NRC 4.2 4.8
LNMRI 2.4 13.7VNIIM -0.8 4.0
ARPANSA -1.0 10.6CNEA_CAE 1.8 10.0
MKEH 4.7 4.0
Di,j U(Di,j) Di,j U(Di,j) Di,j U(Di,j) Di,j U(Di,j) Di,j U(Di,j) Di,j U(Di,j) Di,j U(Di,j)
-7.11 7.89 -1.97 8.84 -6.11 12.77 2.61 13.84 -5.98 8.45 10.60 18.04 -1.52 7.59-6.64 7.52 -1.50 8.51 -5.63 12.54 3.08 13.64 -5.51 8.11 11.07 17.88 -1.05 7.21
-11.02 15.45 -5.88 15.96 -10.02 18.42 -1.30 19.19 -9.90 15.75 6.69 22.40 -5.43 15.30-6.51 11.55 -1.37 12.22 -5.50 15.31 3.21 16.22 -5.38 11.95 11.20 19.92 -0.92 11.36-4.15 9.87 0.99 10.65 -3.14 14.08 5.58 15.07 -3.02 10.33 13.56 18.99 1.44 9.64-7.46 9.71 -2.32 10.50 -6.45 13.97 2.26 14.96 -6.33 10.18 10.25 18.91 -1.87 9.48-0.10 9.59 5.04 10.39 0.91 13.88 9.62 14.88 1.03 10.06 17.61 18.85 5.49 9.35
--- --- 5.14 9.87 1.01 13.50 9.72 14.53 1.13 9.53 17.71 18.57 5.59 8.78-5.14 9.87 --- --- -4.13 14.08 4.58 15.07 -4.01 10.33 12.57 18.99 0.45 9.64-1.01 13.50 4.13 14.08 --- --- 8.71 17.66 0.12 13.84 16.70 21.11 4.58 13.33-9.72 14.53 -4.58 15.07 -8.71 17.66 --- --- -8.59 14.84 7.99 21.78 -4.13 14.37-1.13 9.53 4.01 10.33 -0.12 13.84 8.59 14.84 --- --- 16.58 18.82 4.46 9.29
-17.71 18.57 -12.57 18.99 -16.70 21.11 -7.99 21.78 -16.58 18.82 --- --- -12.12 18.45-5.59 8.78 -0.45 9.64 -4.58 13.33 4.13 14.37 -4.46 9.29 12.12 18.45 --- ---3.16 7.11 8.30 8.15 4.17 12.30 12.89 13.42 4.29 7.73 20.87 17.71 8.75 6.780.24 8.02 5.38 8.96 1.25 12.85 9.97 13.92 1.37 8.58 17.95 18.10 5.83 7.73
-6.49 7.92 -1.35 8.86 -5.48 12.78 3.23 13.86 -5.36 8.48 11.22 18.05 -0.90 7.62-8.86 10.02 -3.72 10.79 -7.85 14.18 0.86 15.16 -7.73 10.47 8.85 19.07 -3.27 9.79-6.08 9.83 -0.94 10.61 -5.07 14.05 3.64 15.03 -4.95 10.29 11.63 18.97 -0.49 9.59-1.78 8.92 3.37 9.77 -0.77 13.43 7.95 14.46 -0.65 9.43 15.93 18.51 3.82 8.66-1.01 7.86 4.13 8.81 0.00 12.75 8.71 13.83 0.12 8.43 16.70 18.03 4.58 7.56-2.76 15.15 2.38 15.67 -1.75 18.17 6.96 18.95 -1.63 15.45 14.95 22.20 2.83 15.00-5.94 7.42 -0.80 8.42 -4.93 12.48 3.79 13.58 -4.81 8.02 11.77 17.84 -0.35 7.11-6.18 12.08 -1.03 12.68 -5.17 15.67 3.55 16.57 -5.05 12.38 11.53 20.20 -0.58 11.85-3.34 11.90 1.80 12.55 -2.33 15.57 6.38 16.47 -2.21 12.29 14.37 20.12 2.25 11.71-0.52 7.42 4.63 8.42 0.49 12.48 9.21 13.58 0.61 8.02 17.19 17.84 5.08 7.11
BIM IRB ITN-LMRIRGUMHAEC-HIRCLSMU IAEA
The bolded NMIs are traceable to other primary standard than the BIPM
Metrologia 47 (2010) Tech. Suppl. 06012

Final report EURAMET project 813 40/46
Appendix B Pair-wise degrees of equivalence, Dij, with its expanded uncertainty, U(Dij) for air kerma standards lab i lab j
air kerma Di (mGy/Gy)
U(Di) (mGy/Gy)
LNE-LNHB -1.9 4.8CIEMAT -1.5 3.9
CMI -5.8 14.1LNMC-RMTC -1.3 9.6
SSM 1.0 7.5STUK -2.3 7.3NRPA 5.1 7.1SMU 5.2 6.5IAEA 0.0 7.5
HAEC-HIRCL 4.2 11.9BIM -4.5 13.0IRB 4.1 7.2
GUM -12.5 17.4ITN-LMRIR -0.4 6.0
PTB 8.3 3.4BEV 5.4 5.0
METAS -1.3 4.6VSL -3.7 7.8
ENEA -0.9 7.6NIST 3.4 6.4NRC 4.2 4.8
LNMRI 2.4 13.7VNIIM -0.8 4.0
ARPANSA -1.0 10.6CNEA_CAE 1.8 10.0
MKEH 4.7 4.0
Di,j U(Di,j) Di,j U(Di,j) Di,j U(Di,j) Di,j U(Di,j) Di,j U(Di,j) Di,j U(Di,j) Di,j U(Di,j)
-10.28 5.58 -7.36 6.70 -0.62 6.58 1.75 9.00 -1.03 8.79 -5.34 7.76 -6.10 6.51-9.80 5.04 -6.88 6.26 -0.15 6.13 2.22 8.68 -0.56 8.46 -4.86 7.38 -5.63 6.06
-14.19 14.41 -11.27 14.88 -4.53 14.82 -2.16 16.05 -4.94 15.93 -9.25 15.38 -10.01 14.79-9.68 10.12 -6.76 10.78 -0.02 10.70 2.35 12.34 -0.43 12.19 -4.74 11.47 -5.50 10.66-7.31 8.15 -4.39 8.96 2.34 8.86 4.71 10.79 1.93 10.61 -2.37 9.77 -3.13 8.81
-10.63 7.95 -7.70 8.78 -0.97 8.68 1.40 10.64 -1.38 10.46 -5.69 9.61 -6.45 8.63-3.26 7.81 -0.34 8.64 6.39 8.55 8.76 10.53 5.98 10.34 1.68 9.49 0.91 8.50-3.16 7.11 -0.24 8.02 6.49 7.92 8.86 10.02 6.08 9.83 1.78 8.92 1.01 7.86-8.30 8.15 -5.38 8.96 1.35 8.86 3.72 10.79 0.94 10.61 -3.37 9.77 -4.13 8.81-4.17 12.30 -1.25 12.85 5.48 12.78 7.85 14.18 5.07 14.05 0.77 13.43 0.00 12.75
-12.89 13.42 -9.97 13.92 -3.23 13.86 -0.86 15.16 -3.64 15.03 -7.95 14.46 -8.71 0.00-4.29 7.73 -1.37 8.58 5.36 8.48 7.73 10.47 4.95 10.29 0.65 9.43 -0.12 8.43
-20.87 17.71 -17.95 18.10 -11.22 18.05 -8.85 19.07 -11.63 18.97 -15.93 18.51 -16.70 18.03-8.75 6.78 -5.83 7.73 0.90 7.62 3.27 9.79 0.49 9.59 -3.82 8.66 -4.58 7.56
--- --- 2.92 5.76 9.65 5.62 12.02 8.33 9.24 8.09 4.94 6.96 4.18 5.54-2.92 5.76 --- --- 6.73 6.74 9.10 9.12 6.32 8.90 2.02 7.89 1.26 6.67-9.65 5.62 -6.73 6.74 --- --- 2.37 9.03 -0.41 8.81 -4.71 7.79 -5.48 6.54
-12.02 8.33 -9.10 9.12 -2.37 9.03 --- --- -2.78 10.74 -7.09 9.92 -7.85 8.98-9.24 8.09 -6.32 8.90 0.41 8.81 2.78 10.74 --- --- -4.30 9.72 -5.07 8.76-4.94 6.96 -2.02 7.89 4.71 7.79 7.09 9.92 4.30 9.72 --- --- -0.76 7.73-4.18 5.54 -1.26 6.67 5.48 6.54 7.85 8.98 5.07 8.76 0.76 7.73 --- ----5.92 14.09 -3.00 14.57 3.73 14.51 6.10 15.76 3.32 15.64 -0.98 15.08 -1.75 14.48-9.10 4.89 -6.18 6.14 0.55 6.01 2.92 8.60 0.14 8.37 -4.16 7.28 -4.92 5.93-9.34 10.62 -6.42 11.27 0.31 11.23 2.69 12.80 -0.10 12.68 -4.40 12.19 -5.16 11.23-6.51 10.52 -3.59 11.15 3.15 11.08 5.52 13.49 2.74 12.52 -1.57 11.82 -2.33 11.04-3.68 4.89 -0.76 6.14 5.97 6.01 8.35 8.60 5.56 8.37 1.26 7.28 0.50 5.93
NRCMETAS VSL ENEA NISTPTB BEV
The bolded NMIs are traceable to other primary standard than the BIPM
Metrologia 47 (2010) Tech. Suppl. 06012

Final report EURAMET project 813 41/46
Appendix B Pair-wise degrees of equivalence, Dij, with its expanded uncertainty, U(Dij) for air kerma standards lab i lab j
air kerma Di (mGy/Gy)
U(Di) (mGy/Gy)
LNE-LNHB -1.9 4.8CIEMAT -1.5 3.9
CMI -5.8 14.1LNMC-RMTC -1.3 9.6
SSM 1.0 7.5STUK -2.3 7.3NRPA 5.1 7.1SMU 5.2 6.5IAEA 0.0 7.5
HAEC-HIRCL 4.2 11.9BIM -4.5 13.0IRB 4.1 7.2
GUM -12.5 17.4ITN-LMRIR -0.4 6.0
PTB 8.3 3.4BEV 5.4 5.0
METAS -1.3 4.6VSL -3.7 7.8
ENEA -0.9 7.6NIST 3.4 6.4NRC 4.2 4.8
LNMRI 2.4 13.7VNIIM -0.8 4.0
ARPANSA -1.0 10.6CNEA_CAE 1.8 10.0
MKEH 4.7 4.0
Di,j U(Di,j) Di,j U(Di,j) Di,j U(Di,j) Di,j U(Di,j) Di,j U(Di,j)
-4.35 14.50 -1.18 5.97 -0.94 11.63 -3.77 11.06 -6.60 5.97-3.88 14.30 -0.70 5.48 -0.46 10.95 -3.30 10.80 -6.12 5.48-8.26 19.66 -5.09 14.56 -4.85 17.36 -7.68 17.28 -10.51 14.56-3.75 16.78 -0.58 10.34 -0.34 14.03 -3.17 13.91 -6.00 10.34-1.39 15.67 1.79 8.42 2.03 12.68 -0.80 12.55 -3.63 8.42-4.70 15.56 -1.53 8.23 -1.29 12.56 -4.12 12.43 -6.95 8.232.66 15.49 5.84 8.09 6.08 12.46 3.24 12.33 0.42 8.092.76 15.15 5.94 7.42 6.18 12.08 3.34 11.90 0.52 7.42
-2.38 15.67 0.80 8.42 1.03 12.68 -1.80 12.55 -4.63 8.421.75 18.17 4.93 12.48 5.17 15.67 2.33 15.57 -0.49 12.48
-6.96 18.95 -3.79 13.58 -3.55 16.57 -6.38 16.47 -9.21 13.581.63 15.45 4.81 8.02 5.05 12.38 2.21 12.29 -0.61 8.02
-14.95 22.20 -11.77 17.84 -11.53 20.20 -14.37 20.12 -17.19 17.84-2.83 15.00 0.35 7.11 0.58 11.85 -2.25 11.71 -5.08 7.115.92 14.09 9.10 4.89 9.34 10.62 6.51 10.52 3.68 4.893.00 14.57 6.18 6.14 6.42 11.27 3.59 11.15 0.76 6.14
-3.73 14.51 -0.55 6.01 -0.31 11.23 -3.15 11.08 -5.97 6.01-6.10 15.76 -2.92 8.60 -2.69 12.80 -5.52 13.49 -8.35 8.60-3.32 15.64 -0.14 8.37 0.10 12.68 -2.74 12.52 -5.56 8.370.98 15.08 4.16 7.28 4.40 12.19 1.57 11.82 -1.26 7.281.75 14.48 4.92 5.93 5.16 11.23 2.33 11.04 -0.50 5.93
--- --- 3.18 14.25 3.42 17.11 0.58 17.02 -2.25 14.25-3.18 14.25 --- --- 0.24 10.86 -2.59 10.71 -5.42 3.63-3.42 17.11 -0.24 10.86 --- --- -2.83 14.32 -5.66 10.86-0.58 17.02 2.59 10.71 2.83 14.32 --- --- -2.83 9.332.25 14.25 5.42 3.63 5.66 10.86 2.83 9.33 --- ---
MKEHVNIIM ARPANSA CNEA_CAELNMRI
The bolded NMIs are traceable to other primary standard than the BIPM
Metrologia 47 (2010) Tech. Suppl. 06012

Final report EURAMET project 813 42/46
Appendix C. Pair-wise degrees of equivalence, Dij, with its expanded uncertainty, U(Dij), for absorbed dose to water standards lab i
Absorbed dose to waterd
Di (mGy/Gy)
U(Di) (mGy/Gy) Di,j U(Di,j) Di,j U(Di,j) Di,j U(Di,j) Di,j U(Di,j) Di,j U(Di,j) Di,j U(Di,j) Di,j U(Di,j)
LNE-LNHB -4.8 10.3 --- --- 0.03 11.22 -0.84 25.07 0.47 14.72 -3.40 13.14 -0.90 12.07 -8.03 12.23CIEMAT -4.9 7.3 -0.03 11.22 --- --- -0.87 23.30 0.44 11.43 -3.43 9.31 -0.93 7.73 -8.06 7.98
CMI -4.0 23.6 0.84 25.07 0.87 23.30 --- --- 1.31 25.17 -2.56 24.28 -0.06 23.72 -7.19 23.80LNMC-RMTC -5.3 12.0 -0.47 14.72 -0.44 11.43 -1.31 25.17 --- --- -3.87 13.32 -1.37 12.27 -8.50 12.43
SSM -1.4 10.0 3.40 13.14 3.43 9.31 2.56 24.28 3.87 13.32 --- --- 2.50 10.32 -4.63 10.51STUK -3.9 8.5 0.90 12.07 0.93 7.73 0.06 23.72 1.37 12.27 -2.50 10.32 --- --- -7.14 9.14NRPA 3.2 8.8 8.03 12.23 8.06 7.98 7.19 23.80 8.50 12.43 4.63 10.51 7.14 9.14 --- ---SMU -4.7 24.7 0.16 25.79 0.19 25.10 -0.68 33.66 0.63 26.85 -3.24 26.01 -0.74 25.49 -7.87 25.57IAEA -0.4 10.0 4.45 13.14 4.48 9.31 3.61 24.28 4.92 13.32 1.05 11.55 3.55 10.32 -3.58 10.51
HAEC-HIRCL 3.0 12.4 7.83 15.05 7.86 11.85 7.00 25.36 8.30 15.20 4.44 13.68 6.94 12.66 -0.20 12.81IRB -6.6 20.3 -1.76 21.57 -1.73 20.74 -2.60 30.55 -1.30 22.83 -5.16 21.84 -2.66 21.22 -9.80 21.31
ITN-LMRIR -7.1 13.0 -2.27 15.54 -2.24 12.48 -3.11 25.66 -1.80 15.70 -5.67 14.23 -3.17 13.25 -10.30 13.39PTB -3.6 7.4 1.22 10.41 1.25 8.56 0.38 24.00 1.68 12.81 -2.18 10.96 0.32 9.65 -6.82 9.85BEV -1.7 10.1 3.16 12.38 3.19 11.03 2.32 24.99 3.62 14.57 -0.24 12.97 2.26 11.89 -4.88 12.05
METAS 0.4 10.6 5.24 12.90 5.27 11.46 4.41 25.18 5.71 14.90 1.84 13.35 4.35 12.30 -2.79 12.45VSL -3.4 8.5 1.49 11.13 1.52 9.51 0.65 24.35 1.96 13.46 -1.91 11.71 0.59 10.50 -6.54 10.68
ENEA -1.1 8.3 3.79 11.02 3.82 9.34 2.95 24.29 4.26 13.34 0.39 11.57 2.89 10.35 -4.24 10.53NIST -0.6 11.1 4.29 13.32 4.32 11.93 3.45 25.40 4.75 15.27 0.89 13.75 3.39 12.73 -3.75 12.89NRC -1.8 10.4 3.04 12.77 3.07 11.31 2.20 25.11 3.50 14.79 -0.36 13.21 2.14 12.15 -5.00 12.31
LNMRI 1.0 15.0 5.84 17.25 5.87 14.55 5.00 26.73 6.31 17.39 2.44 16.07 4.94 15.21 -2.19 15.34ARPANSA 2.4 9.1 7.20 11.72 7.23 10.06 6.36 24.57 7.67 13.85 3.80 12.16 6.30 11.00 -0.84 11.17CNEA_CAE 12.0 17.9 16.90 18.31 16.93 15.78 16.06 27.42 17.36 18.43 13.50 17.20 16.00 16.40 8.86 16.52
MKEH -2.4 9.6 2.43 11.93 2.46 10.44 1.59 24.73 2.90 14.13 -0.97 12.48 1.53 11.35 -5.60 11.52
LNE-LNHB CIEMAT CMI LNMC-RMTC SSM STUK NRPAlab j
The bolded NMIs are traceable to other primary standard than the BIPM, graphite calorimeters are marked with underline, water calorimeters are marked with italic
Metrologia 47 (2010) Tech. Suppl. 06012

Final report EURAMET project 813 43/46
Appendix C. Pair-wise degrees of equivalence, Dij, with its expanded uncertainty, U(Dij), for absorbed dose to water standards
lab iAbsorbed dose to waterd
Di (mGy/Gy)
U(Di) (mGy/Gy)
LNE-LNHB -4.8 10.3CIEMAT -4.9 7.3
CMI -4.0 23.6LNMC-RMTC -5.3 12.0
SSM -1.4 10.0STUK -3.9 8.5NRPA 3.2 8.8SMU -4.7 24.7IAEA -0.4 10.0
HAEC-HIRCL 3.0 12.4IRB -6.6 20.3
ITN-LMRIR -7.1 13.0PTB -3.6 7.4BEV -1.7 10.1
METAS 0.4 10.6VSL -3.4 8.5
ENEA -1.1 8.3NIST -0.6 11.1NRC -1.8 10.4
LNMRI 1.0 15.0ARPANSA 2.4 9.1CNEA_CAE 12.0 17.9
MKEH -2.4 9.6
lab j
Di,j U(Di,j) Di,j U(Di,j) Di,j U(Di,j) Di,j U(Di,j) Di,j U(Di,j) Di,j U(Di,j) Di,j U(Di,j)
-0.16 25.79 -4.45 13.14 -7.83 15.05 1.76 21.57 2.27 15.54 -1.22 10.41 -3.16 12.38-0.19 25.10 -4.48 9.31 -7.86 11.85 1.73 20.74 2.24 12.48 -1.25 8.56 -3.19 11.030.68 33.66 -3.61 24.28 -7.00 25.36 2.60 30.55 3.11 25.66 -0.38 24.00 -2.32 24.99
-0.63 26.85 -4.92 13.32 -8.30 15.20 1.30 22.83 1.80 15.70 -1.68 12.81 -3.62 14.573.24 26.01 -1.05 11.55 -4.44 13.68 5.16 21.84 5.67 14.23 2.18 10.96 0.24 12.970.74 25.49 -3.55 10.32 -6.94 12.66 2.66 21.22 3.17 13.25 -0.32 9.65 -2.26 11.897.87 25.57 3.58 10.51 0.20 12.81 9.80 21.31 10.30 13.39 6.82 9.85 4.88 12.05
--- --- -4.29 26.01 -7.68 27.03 1.92 10.02 2.43 27.31 -1.06 24.41 -3.00 25.654.29 26.01 --- --- -3.38 13.68 6.21 21.84 6.72 14.23 3.23 10.96 1.29 12.977.68 27.03 3.38 13.68 --- --- 9.60 23.04 10.10 16.00 6.62 13.18 4.68 14.90
-1.92 10.02 -6.21 21.84 -9.60 23.04 --- --- 0.50 23.37 -2.98 19.42 -4.92 21.40-2.43 27.31 -6.72 14.23 -10.10 16.00 -0.50 23.37 --- --- -3.48 13.75 -5.42 15.411.06 24.41 -3.23 10.96 -6.62 13.18 2.98 19.42 3.48 13.75 --- --- -1.94 10.053.00 25.65 -1.29 12.97 -4.68 14.90 4.92 21.40 5.42 15.41 1.94 10.05 --- ---5.09 25.15 0.79 13.35 -2.59 15.23 7.01 20.80 7.51 15.72 4.03 8.71 2.09 12.611.33 25.58 -2.96 11.71 -6.34 13.82 3.26 21.32 3.76 14.36 0.28 9.87 -1.66 10.853.63 25.18 -0.66 11.57 -4.04 13.70 5.55 20.84 6.06 14.25 2.58 8.80 0.63 10.744.13 25.37 -0.16 13.75 -3.55 15.58 6.05 21.07 6.55 16.06 3.07 9.31 1.13 13.042.88 25.08 -1.41 13.21 -4.80 15.11 4.80 20.72 5.30 15.61 1.82 8.51 -0.12 12.485.68 28.31 1.39 16.07 -1.99 17.67 7.61 24.54 8.11 18.09 4.63 15.65 2.68 17.137.04 25.31 2.75 12.16 -0.64 14.20 8.96 21.00 9.46 14.73 5.98 9.17 4.04 11.45
16.74 28.97 12.45 17.20 9.06 18.70 18.66 25.29 19.16 19.10 15.68 16.81 13.74 18.192.27 25.94 -2.02 12.48 -5.40 14.47 4.19 21.75 4.70 16.30 1.22 10.77 -0.73 11.67
ITN-LMRIR PTB BEVIAEA HAEC-HIRCL IRBSMU
The bolded NMIs are traceable to other primary standard than the BIPM, graphite calorimeters are marked with underline, water calorimeters are marked with italic
Metrologia 47 (2010) Tech. Suppl. 06012

Final report EURAMET project 813 44/46
Appendix C. Pair-wise degrees of equivalence, Dij, with its expanded uncertainty, U(Dij), for absorbed dose to water standards
lab iAbsorbed dose to waterd
Di (mGy/Gy)
U(Di) (mGy/Gy)
LNE-LNHB -4.8 10.3CIEMAT -4.9 7.3
CMI -4.0 23.6LNMC-RMTC -5.3 12.0
SSM -1.4 10.0STUK -3.9 8.5NRPA 3.2 8.8SMU -4.7 24.7IAEA -0.4 10.0
HAEC-HIRCL 3.0 12.4IRB -6.6 20.3
ITN-LMRIR -7.1 13.0PTB -3.6 7.4BEV -1.7 10.1
METAS 0.4 10.6VSL -3.4 8.5
ENEA -1.1 8.3NIST -0.6 11.1NRC -1.8 10.4
LNMRI 1.0 15.0ARPANSA 2.4 9.1CNEA_CAE 12.0 17.9
MKEH -2.4 9.6
lab j
Di,j U(Di,j) Di,j U(Di,j) Di,j U(Di,j) Di,j U(Di,j) Di,j U(Di,j) Di,j U(Di,j) Di,j U(Di,j)
-5.24 12.90 -1.49 11.13 -3.79 11.02 -4.29 13.32 -3.04 12.77 -5.84 17.25 -7.20 11.72-5.27 11.46 -1.52 9.51 -3.82 9.34 -4.32 11.93 -3.07 11.31 -5.87 14.55 -7.23 10.06-4.41 25.18 -0.65 24.35 -2.95 24.29 -3.45 25.40 -2.20 25.11 -5.00 26.73 -6.36 24.57-5.71 14.90 -1.96 13.46 -4.26 13.34 -4.75 15.27 -3.50 14.79 -6.31 17.39 -7.67 13.85-1.84 13.35 1.91 11.71 -0.39 11.57 -0.89 13.75 0.36 13.21 -2.44 16.07 -3.80 12.16-4.35 12.30 -0.59 10.50 -2.89 10.35 -3.39 12.73 -2.14 12.15 -4.94 15.21 -6.30 11.002.79 12.45 6.54 10.68 4.24 10.53 3.75 12.89 5.00 12.31 2.19 15.34 0.84 11.17
-5.09 25.15 -1.33 25.58 -3.63 25.18 -4.13 25.37 -2.88 25.08 -5.68 28.31 -7.04 25.31-0.79 13.35 2.96 11.71 0.66 11.57 0.16 13.75 1.41 13.21 -1.39 16.07 -2.75 12.162.59 15.23 6.34 13.82 4.04 13.70 3.55 15.58 4.80 15.11 1.99 17.67 0.64 14.20
-7.01 20.80 -3.26 21.32 -5.55 20.84 -6.05 21.07 -4.80 20.72 -7.61 24.54 -8.96 0.00-7.51 15.72 -3.76 14.36 -6.06 14.25 -6.55 16.06 -5.30 15.61 -8.11 18.09 -9.46 14.73-4.03 8.71 -0.28 9.87 -2.58 8.80 -3.07 9.31 -1.82 8.51 -4.63 15.65 -5.98 9.17-2.09 12.61 1.66 10.85 -0.63 10.74 -1.13 13.04 0.12 12.48 -2.68 17.13 -4.04 11.45
--- --- 3.75 12.47 1.45 11.64 0.96 11.45 2.21 10.81 -0.60 17.41 -1.95 11.92-3.75 12.47 --- --- -2.30 9.27 -2.79 12.90 -1.54 12.33 -4.35 16.19 -5.70 10.09-1.45 11.64 2.30 9.27 --- --- -0.50 12.10 0.75 11.49 -2.05 16.09 -3.41 9.97-0.96 11.45 2.79 12.90 0.50 12.10 --- --- 1.25 11.30 -1.55 17.72 -2.91 12.37-2.21 10.81 1.54 12.33 -0.75 11.49 -1.25 11.30 --- --- -2.81 17.31 -4.16 11.770.60 17.41 4.35 16.19 2.05 16.09 1.55 17.72 2.81 17.31 --- --- -1.36 16.521.95 11.92 5.70 10.09 3.41 9.97 2.91 12.37 4.16 11.77 1.36 16.52 --- ---
11.65 18.45 15.40 17.31 13.11 17.22 12.61 18.75 13.86 18.36 11.05 20.51 9.70 17.62-2.81 13.20 0.94 10.34 -1.36 10.22 -1.86 13.60 -0.60 13.06 -3.41 16.76 -4.77 10.97
ARPANSANRC LNMRIMETAS VSL ENEA NIST
The bolded NMIs are traceable to other primary standard than the BIPM, graphite calorimeters are marked with underline, water calorimeters are marked with italic
Metrologia 47 (2010) Tech. Suppl. 06012

Final report EURAMET project 813 45/46
Appendix C. Pair-wise degrees of equivalence, Dij, with its expanded uncertainty, U(Dij), for absorbed dose to water standards
lab iAbsorbed dose to waterd
Di (mGy/Gy)
U(Di) (mGy/Gy)
LNE-LNHB -4.8 10.3CIEMAT -4.9 7.3
CMI -4.0 23.6LNMC-RMTC -5.3 12.0
SSM -1.4 10.0STUK -3.9 8.5NRPA 3.2 8.8SMU -4.7 24.7IAEA -0.4 10.0
HAEC-HIRCL 3.0 12.4IRB -6.6 20.3
ITN-LMRIR -7.1 13.0PTB -3.6 7.4BEV -1.7 10.1
METAS 0.4 10.6VSL -3.4 8.5
ENEA -1.1 8.3NIST -0.6 11.1NRC -1.8 10.4
LNMRI 1.0 15.0ARPANSA 2.4 9.1CNEA_CAE 12.0 17.9
MKEH -2.4 9.6
lab j
Di,j U(Di,j) Di,j U(Di,j)
-16.90 18.31 -2.43 11.93-16.93 15.78 -2.46 10.44-16.06 27.42 -1.59 24.73-17.36 18.43 -2.90 14.13-13.50 17.20 0.97 12.48-16.00 16.40 -1.53 11.35-8.86 16.52 5.60 11.52
-16.74 28.97 -2.27 25.94-12.45 17.20 2.02 12.48-9.06 18.70 5.40 14.47
-18.66 25.29 -4.19 21.75-19.16 19.10 -4.70 16.30-15.68 16.81 -1.22 10.77-13.74 18.19 0.73 11.67-11.65 18.45 2.81 13.20-15.40 17.31 -0.94 10.34-13.11 17.22 1.36 10.22-12.61 18.75 1.86 13.60-13.86 18.36 0.60 13.06-11.05 20.51 3.41 16.76-9.70 17.62 4.77 10.97
--- --- 14.46 17.84-14.46 17.84 --- ---
CNEA_CAE MKEH
The bolded NMIs are traceable to other primary standard than the BIPM, graphite calorimeters are marked with underline, water calorimeters are marked with italic
Metrologia 47 (2010) Tech. Suppl. 06012
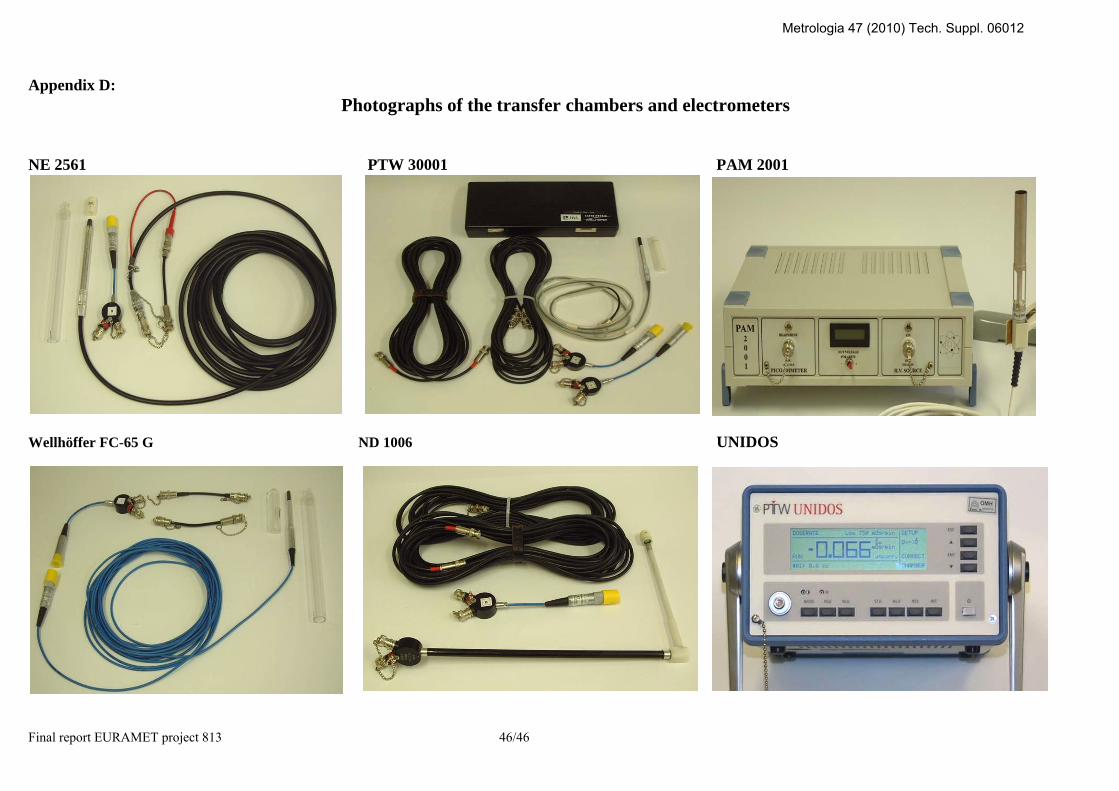
Final report EURAMET project 813 46/46
Appendix D: Photographs of the transfer chambers and electrometers
NE 2561 PTW 30001 PAM 2001
Wellhöffer FC-65 G ND 1006 UNIDOS
Metrologia 47 (2010) Tech. Suppl. 06012
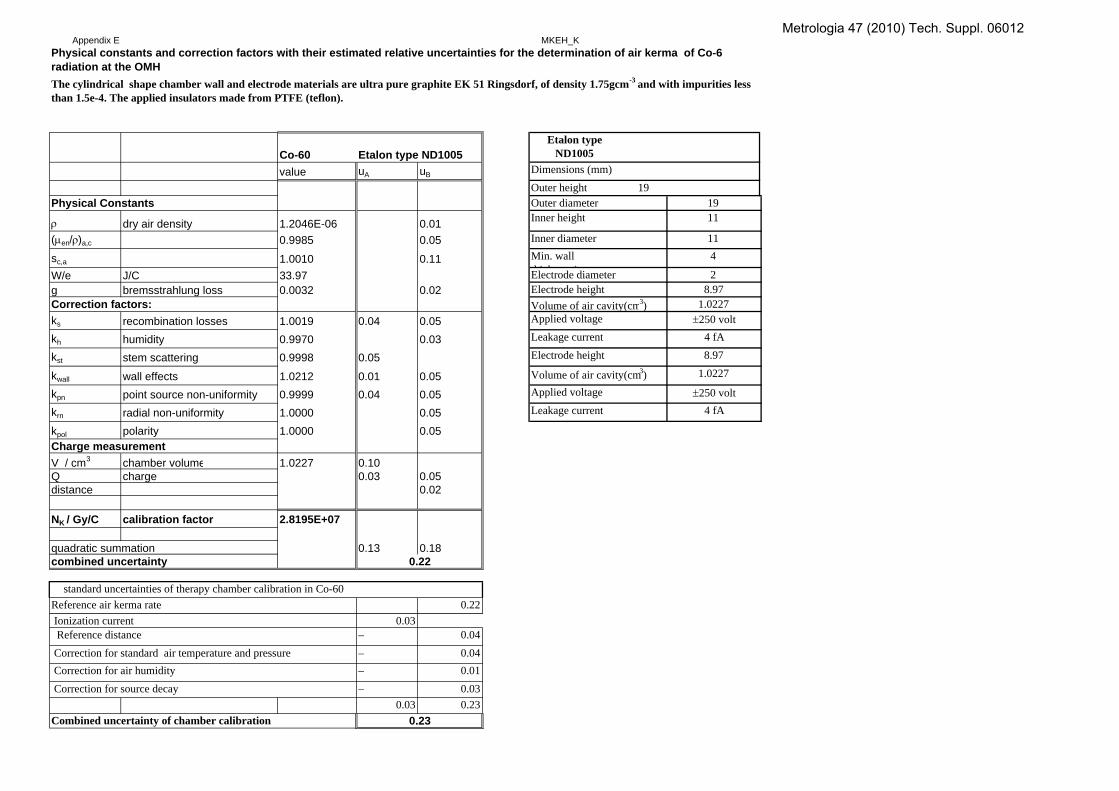
Appendix E MKEH_K
Co-60 Etalon type ND1005Etalon type
ND1005
value uA uB Dimensions (mm)Outer height 19
Physical Constants Outer diameter 19
ρ dry air density 1.2046E-06 0.01 Inner height 11
(μen/ρ)a,c 0.9985 0.05 Inner diameter 11
sc,a 1.0010 0.11 Min. wall thi k *
4
W/e J/C 33.97 Electrode diameter 2g bremsstrahlung loss 0.0032 0.02Correction factors:ks recombination losses 1.0019 0.04 0.05kh humidity 0.9970 0.03kst stem scattering 0.9998 0.05kwall wall effects 1.0212 0.01 0.05kpn point source non-uniformity 0.9999 0.04 0.05krn radial non-uniformity 1.0000 0.05kpol polarity 1.0000 0.05Charge measurementV / cm3 chamber volume 1.0227 0.10Q charge 0.03 0.05distance 0.02
NK / Gy/C calibration factor 2.8195E+07
quadratic summation 0.13 0.18combined uncertainty
0.220.03
– 0.04– 0.04– 0.01– 0.03
0.03 0.23
0.22
Electrode height 8.97Volume of air cavity(cm3) 1.0227
Leakage current 4 fA
Electrode height 8.97
Volume of air cavity(cm3) 1.0227
The cylindrical shape chamber wall and electrode materials are ultra pure graphite EK 51 Ringsdorf, of density 1.75gcm-3 and with impurities less than 1.5e-4. The applied insulators made from PTFE (teflon).
Physical constants and correction factors with their estimated relative uncertainties for the determination of air kerma of Co-6radiation at the OMH
Applied voltage ±250 volt
Applied voltage ±250 voltLeakage current 4 fA
0.23
Ionization current Reference distance
standard uncertainties of therapy chamber calibration in Co-60
Correction for standard air temperature and pressure Correction for air humidity Correction for source decay
Combined uncertainty of chamber calibration
Reference air kerma rate
Metrologia 47 (2010) Tech. Suppl. 06012
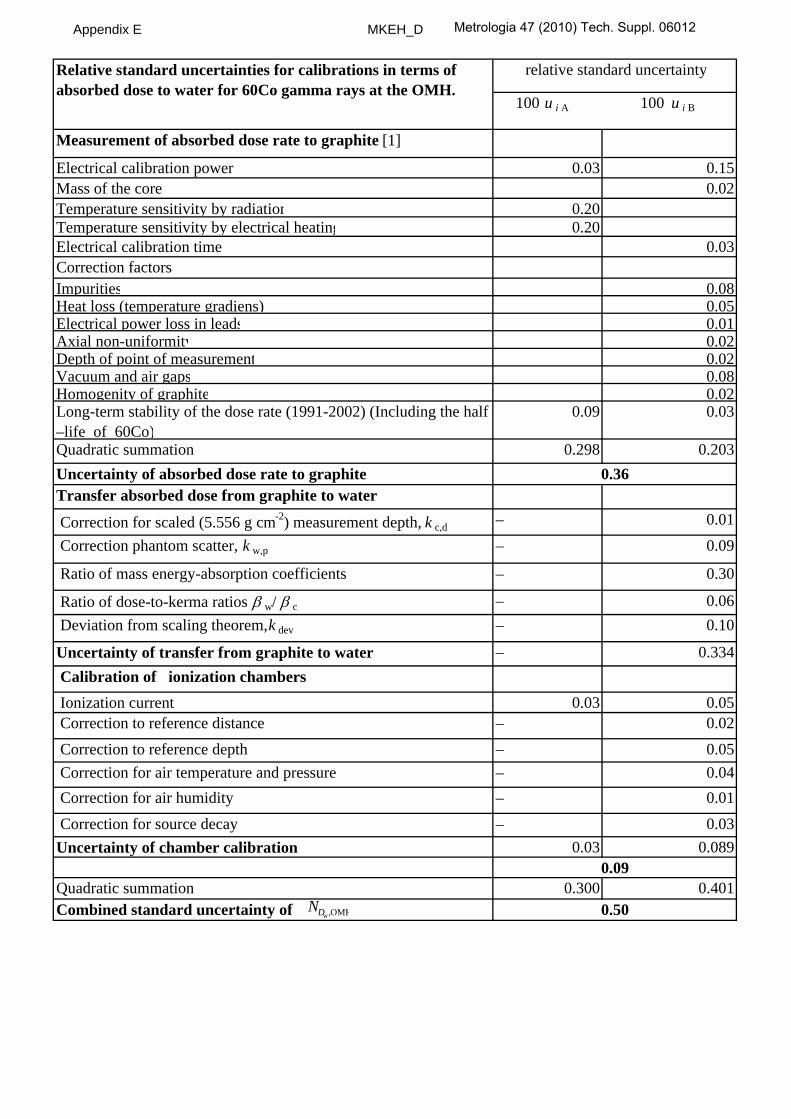
Appendix E MKEH_D
Measurement of absorbed dose rate to graphite [1]
Electrical calibration power 0.03 0.15Mass of the core 0.02Temperature sensitivity by radiation 0.20Temperature sensitivity by electrical heating 0.20Electrical calibration time 0.03Correction factorsImpurities 0.08Heat loss (temperature gradiens) 0.05Electrical power loss in leads 0.01Axial non-uniformity 0.02Depth of point of measurement 0.02Vacuum and air gaps 0.08Homogenity of graphite 0.02Long-term stability of the dose rate (1991-2002) (Including the half –life of 60Co)
0.09 0.03
Quadratic summation 0.298 0.203Uncertainty of absorbed dose rate to graphiteTransfer absorbed dose from graphite to water
Correction for scaled (5.556 g cm-2) measurement depth, k c,d – 0.01 Correction phantom scatter, k w,p – 0.09
Ratio of mass energy-absorption coefficients – 0.30
Ratio of dose-to-kerma ratios β w/ β c – 0.06 Deviation from scaling theorem, k dev – 0.10
Uncertainty of transfer from graphite to water – 0.334 Calibration of ionization chambers Ionization current 0.03 0.05 Correction to reference distance – 0.02
Correction to reference depth – 0.05 Correction for air temperature and pressure – 0.04 Correction for air humidity – 0.01 Correction for source decay – 0.03Uncertainty of chamber calibration 0.03 0.089
Quadratic summation 0.300 0.401Combined standard uncertainty of
0.09
0.50
Relative standard uncertainties for calibrations in terms of absorbed dose to water for 60Co gamma rays at the OMH.
relative standard uncertainty
100 u i A 100 u i B
0.36
OMH,wDN
Metrologia 47 (2010) Tech. Suppl. 06012
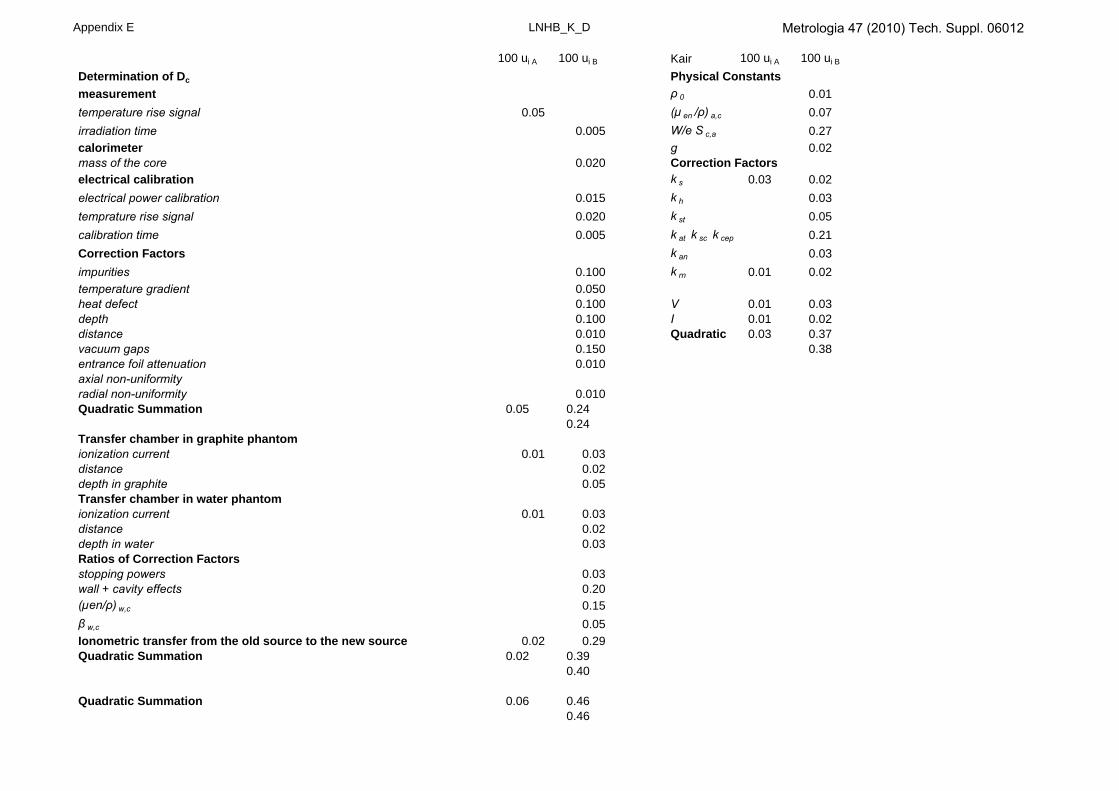
Appendix E LNHB_K_D
100 ui A 100 ui B Kair 100 ui A 100 ui B
Determination of Dc Physical Constantsmeasurement ρ 0 0.01temperature rise signal 0.05 (µ en /ρ) a,c 0.07irradiation time 0.005 W/e S c,a 0.27calorimeter g 0.02mass of the core 0.020 Correction Factorselectrical calibration k s 0.03 0.02electrical power calibration 0.015 k h 0.03temprature rise signal 0.020 k st 0.05calibration time 0.005 k at k sc k cep 0.21Correction Factors k an 0.03impurities 0.100 k rn 0.01 0.02temperature gradient 0.050heat defect 0.100 V 0.01 0.03depth 0.100 I 0.01 0.02distance 0.010 Quadratic 0.03 0.37vacuum gaps 0.150 0.38entrance foil attenuation 0.010axial non-uniformityradial non-uniformity 0.010Quadratic Summation 0.05 0.24
0.24Transfer chamber in graphite phantomionization current 0.01 0.03distance 0.02depth in graphite 0.05Transfer chamber in water phantomionization current 0.01 0.03distance 0.02depth in water 0.03Ratios of Correction Factorsstopping powers 0.03wall + cavity effects 0.20(µen/ρ) w,c 0.15β w,c 0.05Ionometric transfer from the old source to the new source 0.02 0.29Quadratic Summation 0.02 0.39
0.40
Quadratic Summation 0.06 0.460.46
Metrologia 47 (2010) Tech. Suppl. 06012

Appendix E CIEMAT_K
RELATIVE STANDARD UNCERTAINTIES OF THE AIR KERMA RATE FOR Co-60 GAMMA RADIATION (CIEMAT NATIONAL LABORATORY, SPAIN)
si x 102 uj x 102
Ionization current 0.015 0.09
Air pressure 0.055
Air temperature 0.02
Correction for 50 % R.H. 0.003Calibration coefficient, N K, BIPM 0.04 0.17
Beam spectral difference CIEMAT-BIPM 0.1
Long term stability of Shonka chambers 0.058Ratio (k s ) CIEMAT /(k s ) BIPM 0.01Ratio (k rn ) CIEMAT /(k rn ) BIPM 0.05
Correction to FDD=100 cm 0.033
Thermal expansion correction 0.004
Quadratic sum 0.043 0.240
Combined uncertainty 0.24
MINISTERIO DE EDUCACIÓNY CIENCIA Centro de Investigaciones
Energéticas, Medioambientalesy Tecnológicas
Metrologia 47 (2010) Tech. Suppl. 06012
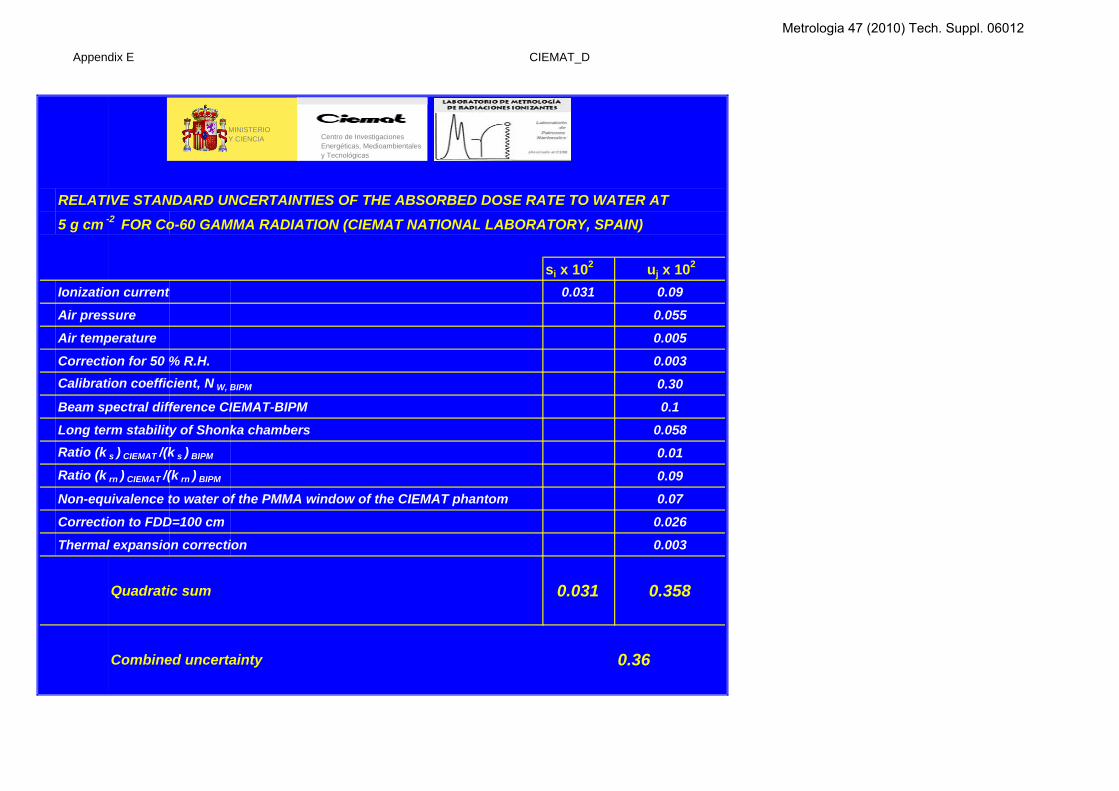
Appendix E CIEMAT_D
RELATIVE STANDARD UNCERTAINTIES OF THE ABSORBED DOSE RATE TO WATER AT5 g cm -2 FOR Co-60 GAMMA RADIATION (CIEMAT NATIONAL LABORATORY, SPAIN)
si x 102 uj x 102
Ionization current 0.031 0.09
Air pressure 0.055
Air temperature 0.005
Correction for 50 % R.H. 0.003Calibration coefficient, N W, BIPM 0.30
Beam spectral difference CIEMAT-BIPM 0.1
Long term stability of Shonka chambers 0.058Ratio (k s ) CIEMAT /(k s ) BIPM 0.01Ratio (k rn ) CIEMAT /(k rn ) BIPM 0.09
Non-equivalence to water of the PMMA window of the CIEMAT phantom 0.07
Correction to FDD=100 cm 0.026
Thermal expansion correction 0.003
Quadratic sum 0.031 0.358
Combined uncertainty 0.36
MINISTERIO DE EDUCACIÓNY CIENCIA Centro de Investigaciones
Energéticas, Medioambientalesy Tecnológicas
Metrologia 47 (2010) Tech. Suppl. 06012
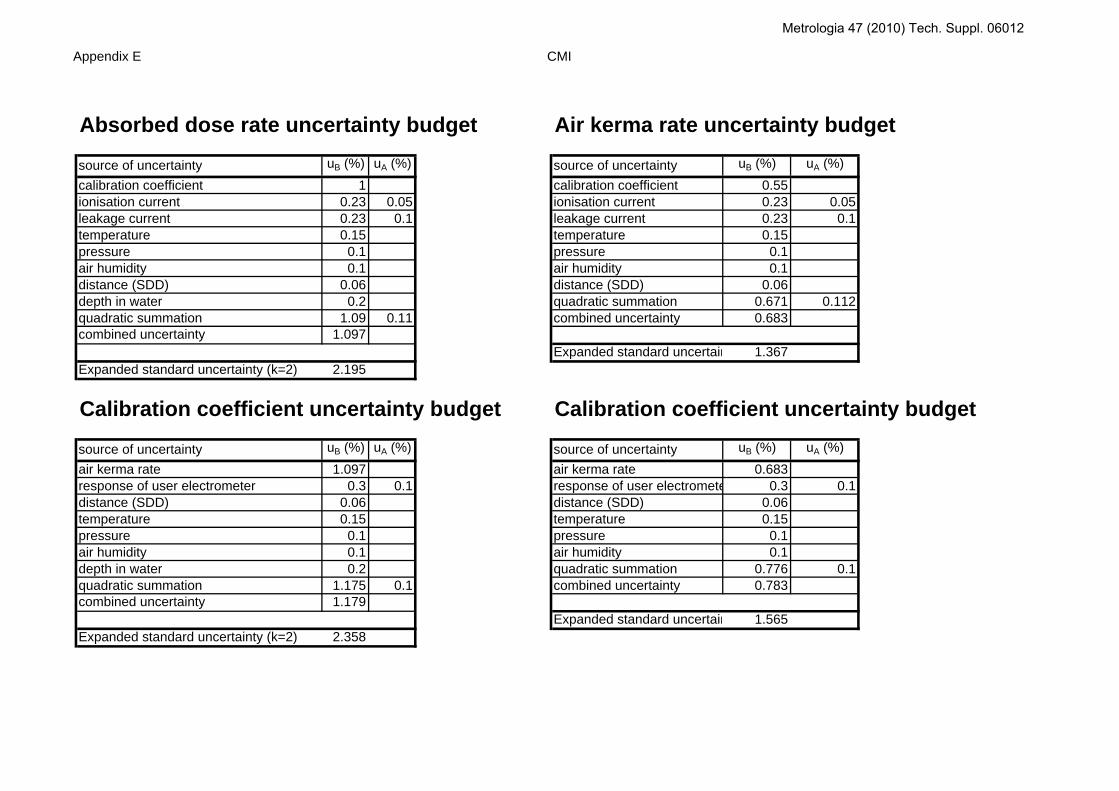
Appendix E CMI
Absorbed dose rate uncertainty budget Air kerma rate uncertainty budget
source of uncertainty uB (%) uA (%) source of uncertainty uB (%) uA (%)calibration coefficient 1 calibration coefficient 0.55ionisation current 0.23 0.05 ionisation current 0.23 0.05leakage current 0.23 0.1 leakage current 0.23 0.1temperature 0.15 temperature 0.15pressure 0.1 pressure 0.1air humidity 0.1 air humidity 0.1distance (SDD) 0.06 distance (SDD) 0.06depth in water 0.2 quadratic summation 0.671 0.112quadratic summation 1.09 0.11 combined uncertainty 0.683combined uncertainty 1.097
Expanded standard uncertain 1.367Expanded standard uncertainty (k=2) 2.195
Calibration coefficient uncertainty budget Calibration coefficient uncertainty budget
source of uncertainty uB (%) uA (%) source of uncertainty uB (%) uA (%)air kerma rate 1.097 air kerma rate 0.683response of user electrometer 0.3 0.1 response of user electromete 0.3 0.1distance (SDD) 0.06 distance (SDD) 0.06temperature 0.15 temperature 0.15pressure 0.1 pressure 0.1air humidity 0.1 air humidity 0.1depth in water 0.2 quadratic summation 0.776 0.1quadratic summation 1.175 0.1 combined uncertainty 0.783combined uncertainty 1.179
Expanded standard uncertain 1.565Expanded standard uncertainty (k=2) 2.358
Metrologia 47 (2010) Tech. Suppl. 06012
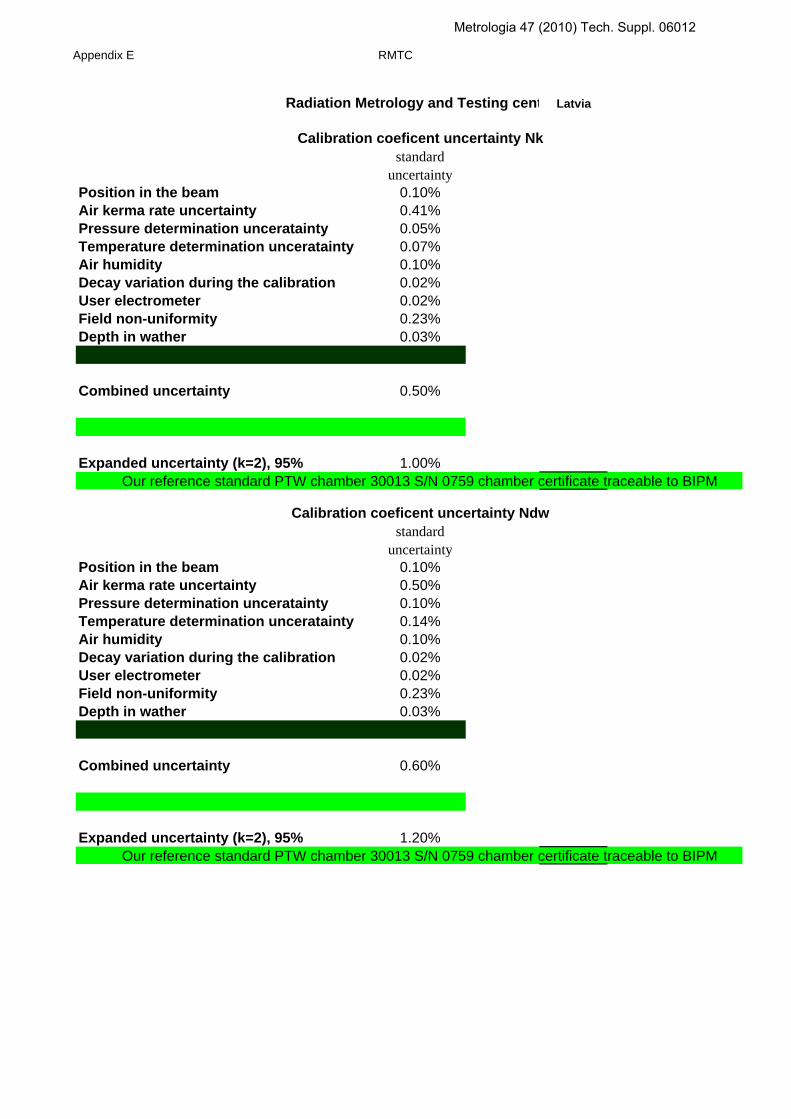
Appendix E RMTC
Radiation Metrology and Testing cent Latvia
Calibration coeficent uncertainty Nkstandard
uncertaintyPosition in the beam 0.10%Air kerma rate uncertainty 0.41%Pressure determination unceratainty 0.05%Temperature determination unceratainty 0.07%Air humidity 0.10%Decay variation during the calibration 0.02%User electrometer 0.02%Field non-uniformity 0.23%Depth in wather 0.03%
Combined uncertainty 0.50%
Expanded uncertainty (k=2), 95% 1.00%Our reference standard PTW chamber 30013 S/N 0759 chamber certificate traceable to BIPM
Calibration coeficent uncertainty Ndwstandard
uncertaintyPosition in the beam 0.10%Air kerma rate uncertainty 0.50%Pressure determination unceratainty 0.10%Temperature determination unceratainty 0.14%Air humidity 0.10%Decay variation during the calibration 0.02%User electrometer 0.02%Field non-uniformity 0.23%Depth in wather 0.03%
Combined uncertainty 0.60%
Expanded uncertainty (k=2), 95% 1.20%Our reference standard PTW chamber 30013 S/N 0759 chamber certificate traceable to BIPM
Metrologia 47 (2010) Tech. Suppl. 06012
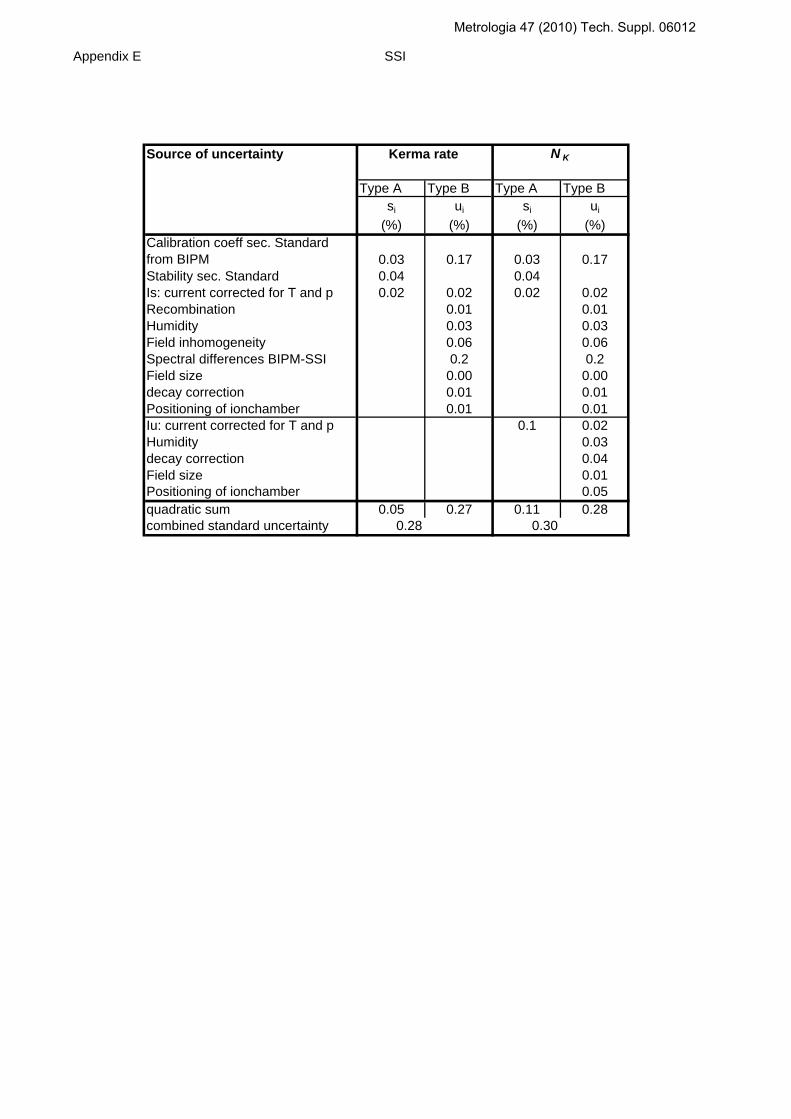
Appendix E SSI
Source of uncertainty
Type A Type B Type A Type Bsi ui si ui
(%) (%) (%) (%)Calibration coeff sec. Standard from BIPM 0.03 0.17 0.03 0.17Stability sec. Standard 0.04 0.04Is: current corrected for T and p 0.02 0.02 0.02 0.02Recombination 0.01 0.01Humidity 0.03 0.03Field inhomogeneity 0.06 0.06Spectral differences BIPM-SSI 0.2 0.2Field size 0.00 0.00decay correction 0.01 0.01Positioning of ionchamber 0.01 0.01Iu: current corrected for T and p 0.1 0.02Humidity 0.03decay correction 0.04Field size 0.01Positioning of ionchamber 0.05quadratic sum 0.05 0.27 0.11 0.28combined standard uncertainty 0.28 0.30
N KKerma rate
Metrologia 47 (2010) Tech. Suppl. 06012

Appendix E SSI_D
Source of uncertainty N Dw
Type A Type B Type A Type Bsi ui si ui
(%) (%) (%) (%)Calibration coeff. Second. standard from BIPM 0.2 0.22 0.22 0.22Stability sec. Standard 0.04 0.04Is: current corrected for T and p 0.004 0.02 0.004 0.02Recombination 0.01 0.01Humidity 0.03 0.03front wall correction 0.01 0.01spectral differences, BIPM SSI 0.2 0.2Inhomogeneity 0.06 0.06decay correction 0.012 0.012Field size 0.003 0.003positioning of the phantom 0.010 0.010positioning of the ionchamber 0.013 0.013water level 0.000 0.000water density 0.002 0.002Iu: corrected for T and p 0.02 0.02Humidity 0.03decay correction 0.038Field size 0.014positioning of the phantom 0.046positioning of the ionchamber 0.047water level 0.001water density 0.008quadratic sum 0.2 0.3 0.2 0.3combined standard uncertainty 0.37 0.39
Absorbed dose to water rate
Metrologia 47 (2010) Tech. Suppl. 06012

Appendix E STUK_K
EUROMET 813Air kerma rate in 60Co beam at 1m distance, uncertainty budget according to GUM 1st measurement (NE 2561 062) 12.10.2005
Model function:
1 NKair(std) 9.462E+07 Gy C-1 3.1209E+05 Gy C-1 0.33 Combined uncertainty 3.914E-08 mC s-1 1.222E-02 mGy s-1 Air kerma calibration factor for ionisation chamber NE 2561 S/N 062 (standard) calibrated at STUK in 2005
2 k(stab,std) 1.000 0.0017 0.17 Rectangular (TypeB) 3.703E+00 mGy s-1 6.296E-03 mGy s-1 Stability for the standard 3 dQcorr 2.1527E-09 C 1.448E-12 C 0.067 Combined uncertainty 1.720E+09 mGy s-1C-1 2.491E-03 mGy s-1 Measured ionisation current. Corrected with leakage current.4 dt 55 s 5.500E-03 s 0.01 Rectangular (TypeB) 6.733E-02 mGy s-2 3.703E-04 mGy s-1 Uncertainty of timer (electrometer internal cklok)5 k(pT) 1.000 0.0008 0.08 Rectangular (TypeB) 3.703E+00 mGy s-1 2.963E-03 mGy s-1 Temperature and air pressure correction
Kair (rate) 3.703 mGy s-1 - - - 1.4282E-02 mGy s-1 0.39 standard uncertainty, k = 12.8563E-02 mGy s-1 0.77 standard uncertainty, k = 2
*) Used for the determination of the standard uncertainty**) Mean ionization current is corrected for 293,15 K and 101,325 kPa. Not with leakage, but uncertainty of measured current is combined uncertainty of charge and time and includes contribution of leakage current (<10fA).
Icorr = dQcorr/dtdQcorr = dQ*kpT
EUROMET 813Air kerma rate in 60Co beam at 1m distance, uncertainty budget according to GUM 2nd measurement (NE 2561 062) 18.10.2005
Model function:
1 NKair(std) 9.462E+07 Gy C-1 3.1209E+05 Gy C-1 0.33 Combined uncertainty 3.914E-08 mC s-1 1.222E-02 mGy s-1 Air kerma calibration factor for ionisation chamber NE 2561 S/N 062 (standard) calibrated at STUK in 2005
2 k(stab,std) 1.000 0.0017 0.17 Rectangular (TypeB) 3.703E+00 mGy s-1 6.296E-03 mGy s-1 Stability for the standard 3 dQcorr 2.1469E-09 C 1.238E-12 C 0.058 Combined uncertainty 1.725E+09 mGy s-1C-1 2.135E-03 mGy s-1 Measured ionisation current. Corrected with leakage current.4 dt 55 s 5.500E-03 s 0.01 Rectangular (TypeB) 6.733E-02 mGy s-2 3.703E-04 mGy s-1 Uncertainty of timer (electrometer internal cklok)5 k(pT) 1.000 0.0008 0.08 Rectangular (TypeB) 3.703E+00 mGy s-1 2.963E-03 mGy s-1 Temperature and air pressure correction
Kair (rate) 3.693 mGy s-1 - - - 1.4224E-02 mGy s-1 0.39 standard uncertainty, k = 12.8448E-02 mGy s-1 0.77 standard uncertainty, k = 2
*) Used for the determination of the standard uncertainty**) Mean ionization current is corrected for 293,15 K and 101,325 kPa. Not with leakage, but uncertainty of measured current is combined uncertainty of charge and time and includes contribution of leakage current (<10fA).
Icorr = dQcorr/dtdQcorr = dQ*kpT
% remarks% probability distribution *) sensitivity coefficient contribution to the
standard uncertaintyNo.quantity or group of
quantitiesestimated value standard uncertainty
% remarks% probability distribution *) sensitivity coefficient contribution to the
standard uncertaintyNo.quantity or group of
quantitiesestimated value standard uncertainty
pTstdKairair kdtdQNK ⋅⋅=&
pTstdKairair kdtdQNK ⋅⋅=&
Metrologia 47 (2010) Tech. Suppl. 06012

Appendix E STUK_D
EUROMET 813Dose to water rate in 60Co beam at 50mm depth uncertainty budget according to GUM 1st measurement (NE 2561 sno. 097) 19.10.2005
Model function:
1 1) Nw(std) 1.0248E+08 Gy C-1 3.0469E+05 Gy C-1 0.30 Combined uncertainty 3.278E-08 mC s-1 9.988E-03 mGy s-1 Dose to water calibration factor for ionisation chamber NE 2561 S/N 062 (standard) calibrated at STUK in 2005
2 k(stab,std) 1.000 0.0017 0.17 Rectangular (TypeB) 3.359E+00 mGy s-1 5.711E-03 mGy s-1 Stability for the standard 3 dQcorr 1.8030E-09 C 1.115E-12 C 0.062 Combined uncertainty 1.863E+09 mGy s-1C-1 2.078E-03 mGy s-1 Measured ionisation current. Corrected with leakage current.4 dt 55 s 5.500E-03 s 0.01 Rectangular (TypeB) 6.108E-02 mGy s-2 3.359E-04 mGy s-1 Uncertainty of timer (electrometer internal cklok)6 k(pT) 1.000 0.0008 0.08 Rectangular (TypeB) 3.359E+00 mGy s-1 2.688E-03 mGy s-1 Temperature and air pressure correction
Dw (rate) 3.359 mGy s-1 - - - 1.2001E-02 mGy s-1 0.36 standard uncertainty, k = 12.4003E-02 mGy s-1 0.71 standard uncertainty, k = 2
*) Used for the determination of the standard uncertainty1) Secondary standard NE 2561 (097) calibrated in PSDL (BIPM).
EUROMET 813Dose to water rate in 60Co beam at 50mm depth uncertainty budget according to GUM 2nd measurement (NE 2561 sno. 062) 20.10.2005
Model function:
1 2) Nw(std) 1.0326E+08 Gy C-1 4.4832E+05 Gy C-1 0.43 Combined uncertainty 3.249E-08 mC s-1 1.457E-02 mGy s-1 Dose to water calibration factor for ionisation chamber NE 2561 S/N 062 (standard) calibrated at STUK in 2005
2 k(stab,std) 1.000 0.0017 0.17 Rectangular (TypeB) 3.355E+00 mGy s-1 5.704E-03 mGy s-1 Stability for the standard
3 dQcorr 1.7871E-09 C 8.980E-13 C 0.050 Combined uncertainty 1.877E+09 mGy s-1C-1 1.686E-03 mGy s-1 Measured ionisation current. Corrected with leakage current.
4 dt 55 s 5.500E-03 s 0.01 Rectangular (TypeB) 6.100E-02 mGy s-2 3.355E-04 mGy s-1 Uncertainty of timer (electrometer internal cklok)
6 k(pT) 1.000 0.0008 0.08 Rectangular (TypeB) 3.355E+00 mGy s-1 2.684E-03 mGy s-1 Temperature and air pressure correction
Dw (rate) 3.355 mGy s-1 - - - 1.5965E-02 mGy s-1 0.48 standard uncertainty, k = 13.1930E-02 mGy s-1 0.95 standard uncertainty, k = 2
*) Used for the determination of the standard uncertainty**) Mean ionization current is corrected for 293,15 K and 101,325 kPa. Not with leakage, but uncertainty of measured current is combined uncertainty of charge and time and includes contribution of leakage current (<10fA).
Icorr = dQcorr/dtdQcorr = dQ*kpT
2) Working standard NE 2561 (062) calibrated in SSDL-Helsinki (STUK). Tracebility of calibration factor to primary dosimetry laboratory BIPM.
% remarks
% remarks
No.quantity or group of
quantitiesestimated value standard uncertainty % probability distribution
*) sensitivity coefficient contribution to the standard uncertainty
% probability distribution *) sensitivity coefficient contribution to the
standard uncertaintyNo.quantity or group of
quantitiesestimated value standard uncertainty
pTstdDww kdtdQND ⋅⋅=&
pTstdDww kdtdQND ⋅⋅=&
Metrologia 47 (2010) Tech. Suppl. 06012

Appendix E NRPA_K
Cobolt-60 air Kerma Uncertaintybudget Doslab NRPA
Utarbeidet av Rev. Nr./Dato Dokument nr.Berit Sundby Avset Hans Bjerke 02/05.01.2006 V-3-03-01
Source of uncertainty Quantity Estimate Deviation rel. st. uncProb. dist. Sens. Coeff.X i x i u c u(x i ) c i u(x i ) %
1 1.1 kspec 1 0 0.0000 1 0.001.2 kinhom 1 0.0010 0.0010 N 1 0.101.3 NK [Gy/µC] 45.78 0.08 0.0017 N 1 0.171.4 45.76 0.0447 0.0010 N 1 0.10
0.05uc(y) % 0.22
2 2.1 kelec 1 0.0005 N 1 0.052.2 I [pA] 50 0.026 0.0001 N 1 0.012.3 ΔI [pA] 0.01 0.002 0.0000 N 0.02 0.002.4 ks 1 0.0014 0.0008 R 1 0.082.5 kpol 1 0.0005 0.0003 R 1 0.032.6 kT 1 0.0006 0.0006 N 1 0.062.7 kP 1 0.0001 0.0001 N 1 0.012.8 kh 1 0.0004 0.0002 R 1 0.022.9 1 0.0008 0.0005 R 1 0.052.10 1 0.0008 0.0008 N 1 0.082.1 1 0.0001 0.0001 R 1 0.01
0.02uc(y) % 0.15
3 Total uncertainty determination of air kerma rateQuadratic sum 0.07Combined uncertainty uc(y) % 0.27Expanded uncertainty (k=2) 0.54
43.1 kelec 1 0.0000 N 13.2 I [pA] 50 0.026 0.0001 N 13.3 ΔI [pA] 0.01 0.002 0.0000 N 0.023.4 ks 1 0.0014 0.0008 R 1 0.083.5 kpol 1 0.0005 0.0003 R 1 0.033.6 kT 1 0.0006 0.0006 N 13.7 kP 1 0.0001 0.0001 N 13.8 kh 1 0.0004 0.0002 R 1 0.023.9 1 0.0008 0.0005 R 1 0.053.10 1 0.0008 0.0008 N 1 0.083.1 1 0.0001 0.0001 R 1 0.01
Quadratic sum 0.02Combined uncertainty uc(y) % 0.13
5 Total uncertainty air kerma calibration coefficientQuadratic sum 0.09Combined uncertainty uc(y) % 0.30Expanded uncertainty (k=2) 0.60
Factors due to radiation field, set-up and calibration:Differences in energy spectra of radiation beamsField inhomogeneityUncertainty of the calibration coefficient reported by PSDLConstancy of the calibration coefficientQuadratic sumCombined uncertainty
Factors influencing the reference standard:Calibration factor of electrometerIonization current (pA)Leakage currentRecombinationPolarity effectTemperature (K)Pressure (kPa)Humidity
Factors influencing the transfer chamberCalibration factor of electrometer Separate input in the res
Combined uncertainty
Chamber orientationReproduction of source to chamber distanceStem effect and reproduction of field size (10 cm x 10 cm).Quadratic sum
Reproduction of source to chamber distanceStem effect and reproduction of field size (10 cm x 10 cm).
RecombinationPolarity effectTemperature (K) Separate input input in the resultsPressure (kPa) Separate input input in the results
Leakage current Separate input input in the resultsIonization current (pA) Separate input in the results
HumidityChamber orientation
Metrologia 47 (2010) Tech. Suppl. 06012
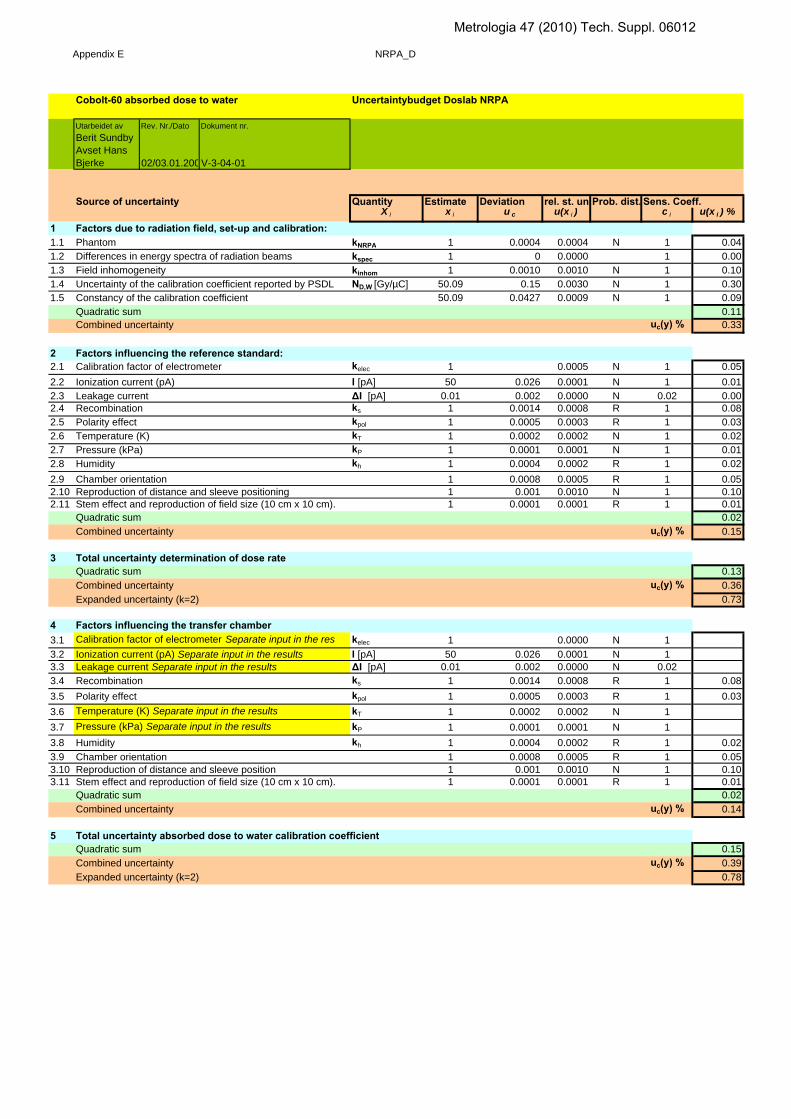
Appendix E NRPA_D
Cobolt-60 absorbed dose to water Uncertaintybudget Doslab NRPA
Utarbeidet av Rev. Nr./Dato Dokument nr.Berit Sundby Avset Hans Bjerke 02/03.01.200V-3-04-01
Source of uncertainty Quantity Estimate Deviation rel. st. uncProb. dist. Sens. Coeff.X i x i u c u(x i ) c i u(x i ) %
1 1.1 kNRPA 1 0.0004 0.0004 N 1 0.041.2 kspec 1 0 0.0000 1 0.001.3 kinhom 1 0.0010 0.0010 N 1 0.101.4 ND,W [Gy/µC] 50.09 0.15 0.0030 N 1 0.301.5 50.09 0.0427 0.0009 N 1 0.09
0.11uc(y) % 0.33
2 2.1 kelec 1 0.0005 N 1 0.052.2 I [pA] 50 0.026 0.0001 N 1 0.012.3 ΔI [pA] 0.01 0.002 0.0000 N 0.02 0.002.4 ks 1 0.0014 0.0008 R 1 0.082.5 kpol 1 0.0005 0.0003 R 1 0.032.6 kT 1 0.0002 0.0002 N 1 0.022.7 kP 1 0.0001 0.0001 N 1 0.012.8 kh 1 0.0004 0.0002 R 1 0.022.9 1 0.0008 0.0005 R 1 0.052.10 1 0.001 0.0010 N 1 0.102.11 1 0.0001 0.0001 R 1 0.01
0.02uc(y) % 0.15
3 Total uncertainty determination of dose rateQuadratic sum 0.13Combined uncertainty uc(y) % 0.36Expanded uncertainty (k=2) 0.73
43.1 kelec 1 0.0000 N 13.2 I [pA] 50 0.026 0.0001 N 13.3 ΔI [pA] 0.01 0.002 0.0000 N 0.023.4 ks 1 0.0014 0.0008 R 1 0.083.5 kpol 1 0.0005 0.0003 R 1 0.033.6 kT 1 0.0002 0.0002 N 13.7 kP 1 0.0001 0.0001 N 13.8 kh 1 0.0004 0.0002 R 1 0.023.9 1 0.0008 0.0005 R 1 0.053.10 1 0.001 0.0010 N 1 0.103.11 1 0.0001 0.0001 R 1 0.01
Quadratic sum 0.02Combined uncertainty uc(y) % 0.14
5 Total uncertainty absorbed dose to water calibration coefficientQuadratic sum 0.15Combined uncertainty uc(y) % 0.39Expanded uncertainty (k=2) 0.78
Factors due to radiation field, set-up and calibration:PhantomDifferences in energy spectra of radiation beamsField inhomogeneityUncertainty of the calibration coefficient reported by PSDLConstancy of the calibration coefficientQuadratic sumCombined uncertainty
Factors influencing the reference standard:Calibration factor of electrometerIonization current (pA)Leakage currentRecombinationPolarity effectTemperature (K)Pressure (kPa)
Quadratic sumCombined uncertainty
HumidityChamber orientationReproduction of distance and sleeve positioningStem effect and reproduction of field size (10 cm x 10 cm).
Factors influencing the transfer chamberCalibration factor of electrometer Separate input in the resIonization current (pA) Separate input in the resultsLeakage current Separate input in the resultsRecombinationPolarity effectTemperature (K) Separate input in the resultsPressure (kPa) Separate input in the resultsHumidityChamber orientationReproduction of distance and sleeve positionStem effect and reproduction of field size (10 cm x 10 cm).
Metrologia 47 (2010) Tech. Suppl. 06012

Appendix E SMU_K
SMUPhysical constants and correction factors with their estimated relative uncertainty for the determination of air kerma in 60Co radiation at SMU.Ionisation chamber is the cylindrical shape chamber, wall and electrode materials are made of ultra pure graphite.
Characteristics of the SMU standard of air kerma SMU values
Typeu A u B Nominal
valuesPhysical constants Outer height [mm] 19
Outer diameter [mm] 19
(μ en/ρ )a,c 0.9985 - 0.05 Inner diameter [mm] 11
stopping power ratio 1.001 0 Wall thickness [mm] 4
W/e [J C–1] (J⋅C-1) 33.97 Electrode Diameter [mm] 2
fraction of energy lost by bremsstrahlung
0.003 2 - 0.02 Height [mm] 10
Air cavity [cm3] 1.0185Correction factors relative uncertainty [cm3] 0.0019
k s recombination losses 1.001 7 0.01 0.03 Wall Material ultra pure graphite
k h humidity 0.997 0 - 0.03 Density [g⋅cm−3] 1.71k st stem scattering 0.999 7 0.01 - Impurity fraction < 1.5 × 10⁻⁴
k wall wall effects 1.0191 0.03 0.08 Applied tension Voltage [ V] 300
k an axial non-uniformity 0.9998 - 0.01k rn radial non-uniformity 1.0003 - 0.01k pol polarity 0.9989 0.08
Measurement of I /vρv volume [cm3] 1.0185 0.19 0.10I ionization current 0.02 0.05distance 0.02
long term stability 0.11
Nk [Gy/C] calibration factor 2.8215+E07
Uncertaintyquadratic summation 0.19 0.23combined uncertainty
- 0.11
Volume
0.30
relative (1) uncertainty [%]
ND1005/A - 8111
Chamber
ρ dry air density [kg·m−3 ] (for reference conditions)
1.2048 - 0.01
ac,s
g
Metrologia 47 (2010) Tech. Suppl. 06012

Appendix E SMU_K
(1) Expressed as one standard deviation.
SMUCalibration factor uncertainty Nk
Quantiy Value UncertaintyProbability distributio
nDivisor ci ui νi
Air kerma rate, primary standard [m 5.55E-03 0.30% normal 1.000 1 0.300 ∞
Mean ionisation current of calibrate 111.106 0.009 normal 1.000 1 0.008 9Mean background reading of calibr 0.007 0.001 normal 1.000 1 0.001 9Recombination - calibrated chamber 0.10% rectangular 1.732 1 0.058 ∞
Polarity efect - calibrated chamber 0.10% normal 1.000 1 0.080 ∞
Electrometer stability 0.10% rectangular 1.732 1 0.058 ∞
Air pressure [kPa] 100.625 0.1 rectangular 1.732 1 0.057 ∞
Temperature measured [°C] 20.18 0.2 rectangular 1.732 1 0.039 ∞
Real temperature inside the chamb 20.18 0.3 rectangular 1.732 1 0.059 ∞
Air relative humidity 0.05% rectangular 1.732 1 0.029 ∞
FDD [mm] 1000 0.3 rectangular 1.732 1 0.035 ∞
Variation of air kerma during the day 0.04% rectangular 1.732 1 0.023 ∞
Field non-uniformity 0.05% normal 1.000 1 0.050
uc Relative combined uncertainty [%] 0.35 85
U Expanded standard uncertainty (k = 2) 0.70
Metrologia 47 (2010) Tech. Suppl. 06012
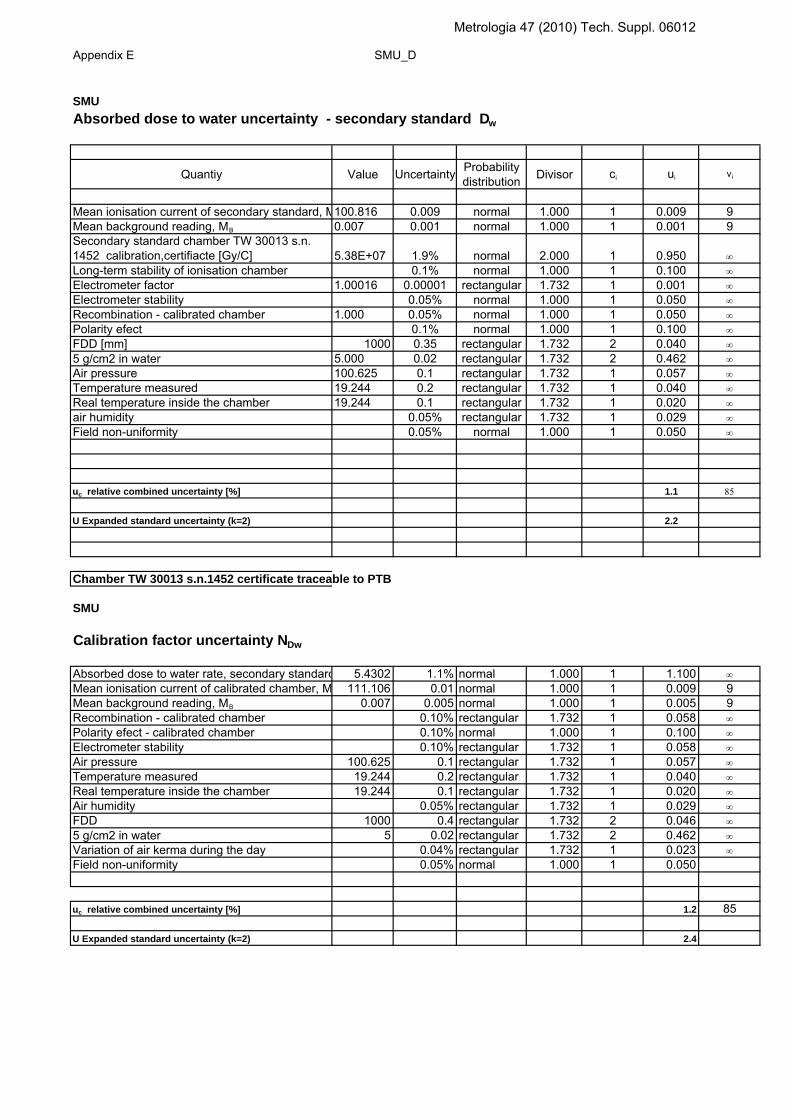
Appendix E SMU_D
SMUAbsorbed dose to water uncertainty - secondary standard Dw
Quantiy Value Uncertainty Probability distribution Divisor ci ui νi
Mean ionisation current of secondary standard, M100.816 0.009 normal 1.000 1 0.009 9Mean background reading, MB 0.007 0.001 normal 1.000 1 0.001 9Secondary standard chamber TW 30013 s.n. 1452 calibration,certifiacte [Gy/C] 5.38E+07 1.9% normal 2.000 1 0.950 ∞
Long-term stability of ionisation chamber 0.1% normal 1.000 1 0.100 ∞
Electrometer factor 1.00016 0.00001 rectangular 1.732 1 0.001 ∞
Electrometer stability 0.05% normal 1.000 1 0.050 ∞
Recombination - calibrated chamber 1.000 0.05% normal 1.000 1 0.050 ∞
Polarity efect 0.1% normal 1.000 1 0.100 ∞
FDD [mm] 1000 0.35 rectangular 1.732 2 0.040 ∞
5 g/cm2 in water 5.000 0.02 rectangular 1.732 2 0.462 ∞
Air pressure 100.625 0.1 rectangular 1.732 1 0.057 ∞
Temperature measured 19.244 0.2 rectangular 1.732 1 0.040 ∞
Real temperature inside the chamber 19.244 0.1 rectangular 1.732 1 0.020 ∞
air humidity 0.05% rectangular 1.732 1 0.029 ∞
Field non-uniformity 0.05% normal 1.000 1 0.050 ∞
uc relative combined uncertainty [%] 1.1 85
U Expanded standard uncertainty (k=2) 2.2
Chamber TW 30013 s.n.1452 certificate traceable to PTB
SMU
Calibration factor uncertainty NDw
Absorbed dose to water rate, secondary standard 5.4302 1.1% normal 1.000 1 1.100 ∞
Mean ionisation current of calibrated chamber, M 111.106 0.01 normal 1.000 1 0.009 9Mean background reading, MB 0.007 0.005 normal 1.000 1 0.005 9Recombination - calibrated chamber 0.10% rectangular 1.732 1 0.058 ∞
Polarity efect - calibrated chamber 0.10% normal 1.000 1 0.100 ∞
Electrometer stability 0.10% rectangular 1.732 1 0.058 ∞
Air pressure 100.625 0.1 rectangular 1.732 1 0.057 ∞
Temperature measured 19.244 0.2 rectangular 1.732 1 0.040 ∞
Real temperature inside the chamber 19.244 0.1 rectangular 1.732 1 0.020 ∞
Air humidity 0.05% rectangular 1.732 1 0.029 ∞
FDD 1000 0.4 rectangular 1.732 2 0.046 ∞
5 g/cm2 in water 5 0.02 rectangular 1.732 2 0.462 ∞
Variation of air kerma during the day 0.04% rectangular 1.732 1 0.023 ∞
Field non-uniformity 0.05% normal 1.000 1 0.050
uc relative combined uncertainty [%] 1.2 85
U Expanded standard uncertainty (k=2) 2.4
Metrologia 47 (2010) Tech. Suppl. 06012

Appendix E IAEA_K
IAEA Secondary Standards
Air kerma is realized at the IAEA with a secondary standard NE-2561 ion chamber calibrated at the BIPM. The Voltemeter and capacitor are calibrated at BEV. Temperature and pressure sensors are calibrated at BEV.
Uncertainty budget - 60Co NK Working
Notes Influence quantity Value Unit Expanded uncertainty
Distribution
Uncertainty Type
Confidence level
Coverage factor
Standard uncertainty
Sensitivity coefficient
Uncertainty component
Effective degrees
of freedom
U i k u i c i c i u i ν eff (c i u i ) 2
measurement of absorbed dose to water rate1 calibration at
BIPMmGy/nC 0.22% normal Type B 68% 1.00 0.22% 1.00 0.22% 50 4.84E-06
2 stability of DOL reference instrument
1 0.25% normal Type A 68% 1.00 0.25% 1.00 0.25% 50 6.25E-06
measurement with the reference instrument3 mean reading pA 0.10% normal Type A 68% 1.00 0.10% 1.00 0.10% 50 1.00E-06
4 current pA 0.10% rectang. Type B 68% 1.73 0.06% 1.00 0.06% 8 3.34E-07temperature measurments during reference measurement
5 resolution deg 0.20% Type B 100% 1.73 0.12% 0.08 0.01% 1000 8.53E-09pressure measurments during reference measurement
6 resolution kPa 0.10% Type B 100% 1.73 0.06% 0.27 0.02% 1000 2.43E-08chamber positioning
7 deviation in chamber depth in phantom
mm 0.04% Type B 100% 1.73 0.02% 1.00 0.02% 1000 5.35E-08
current measurement with the instrument to be calibrated8 mean reading 0.02% Type A 68% 1.00 0.02% 1.00 0.02% 8 4.00E-08
9 resolution 0.10% Type B 100% 1.73 0.06% 1.00 0.06% 8 3.33E-07
temperature measurments during user measurement10 resolution deg 0.20% Type B 100% 1.73 0.12% 0.08 0.01% 1000 8.53E-09
11diff (ion chamb.cavity & amb)
deg 0.50% Type B 100% 1.73 0.29% 0.08 0.02% 1000 5.33E-08
pressure measurments during user measurement12 resolution kPa 0.10% Type B 100% 1.73 0.06% 1.00 0.06% 1000 3.33E-0713 field non-
uniformity0.10% Type B 68% 1.00 0.10% 1.00 0.10% 8 1.00E-06
calibration result14 calibration
coefficient of user instrument
- 0.8% Combined 95% 2 0.38% 157 1.43E-05
Air kerma
The calibrations are based on a measurement of air-kerma rate with the IAEA reference chamber, at the position of the chamber’s reference point. In the first step, the IAEA chamber is placed at a reference point in air. In the second step, the EUROMET cha
Metrologia 47 (2010) Tech. Suppl. 06012
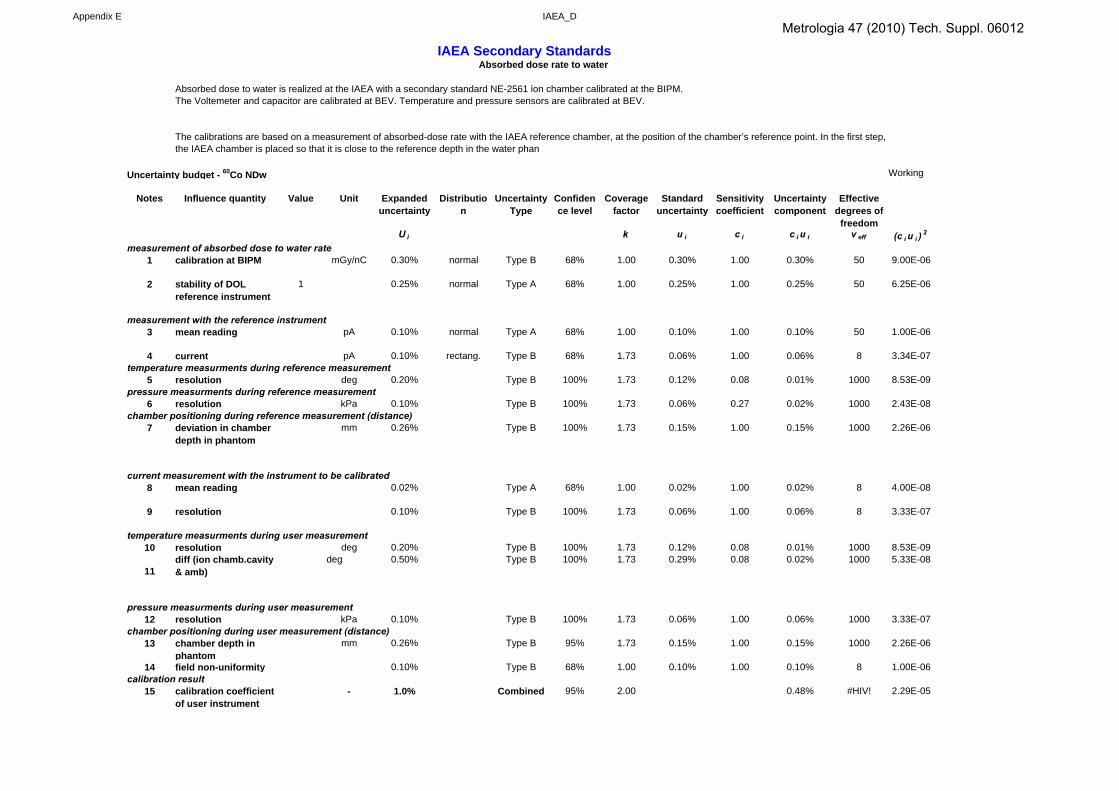
Appendix E IAEA_D
IAEA Secondary Standards
Absorbed dose to water is realized at the IAEA with a secondary standard NE-2561 ion chamber calibrated at the BIPM. The Voltemeter and capacitor are calibrated at BEV. Temperature and pressure sensors are calibrated at BEV.
Uncertainty budget - 60Co NDw Working
Notes Influence quantity Value Unit Expanded uncertainty
Distribution
Uncertainty Type
Confidence level
Coverage factor
Standard uncertainty
Sensitivity coefficient
Uncertainty component
Effective degrees of
freedomU i k u i c i c i u i ν eff (c i u i )
2
measurement of absorbed dose to water rate1 calibration at BIPM mGy/nC 0.30% normal Type B 68% 1.00 0.30% 1.00 0.30% 50 9.00E-06
2 stability of DOL reference instrument
1 0.25% normal Type A 68% 1.00 0.25% 1.00 0.25% 50 6.25E-06
measurement with the reference instrument3 mean reading pA 0.10% normal Type A 68% 1.00 0.10% 1.00 0.10% 50 1.00E-06
4 current pA 0.10% rectang. Type B 68% 1.73 0.06% 1.00 0.06% 8 3.34E-07temperature measurments during reference measurement
5 resolution deg 0.20% Type B 100% 1.73 0.12% 0.08 0.01% 1000 8.53E-09pressure measurments during reference measurement
6 resolution kPa 0.10% Type B 100% 1.73 0.06% 0.27 0.02% 1000 2.43E-08chamber positioning during reference measurement (distance)
7 deviation in chamber depth in phantom
mm 0.26% Type B 100% 1.73 0.15% 1.00 0.15% 1000 2.26E-06
current measurement with the instrument to be calibrated8 mean reading 0.02% Type A 68% 1.00 0.02% 1.00 0.02% 8 4.00E-08
9 resolution 0.10% Type B 100% 1.73 0.06% 1.00 0.06% 8 3.33E-07
temperature measurments during user measurement10 resolution deg 0.20% Type B 100% 1.73 0.12% 0.08 0.01% 1000 8.53E-09
11diff (ion chamb.cavity & amb)
deg 0.50% Type B 100% 1.73 0.29% 0.08 0.02% 1000 5.33E-08
pressure measurments during user measurement12 resolution kPa 0.10% Type B 100% 1.73 0.06% 1.00 0.06% 1000 3.33E-07
chamber positioning during user measurement (distance)13 chamber depth in
phantommm 0.26% Type B 95% 1.73 0.15% 1.00 0.15% 1000 2.26E-06
14 field non-uniformity 0.10% Type B 68% 1.00 0.10% 1.00 0.10% 8 1.00E-06calibration result
15 calibration coefficient of user instrument
- 1.0% Combined 95% 2.00 0.48% #HIV! 2.29E-05
The calibrations are based on a measurement of absorbed-dose rate with the IAEA reference chamber, at the position of the chamber’s reference point. In the first step, the IAEA chamber is placed so that it is close to the reference depth in the water phan
Absorbed dose rate to water
Metrologia 47 (2010) Tech. Suppl. 06012

Appendix E HIRC_K
Nk Type A Type B Calc COMMENTS% % Distr
Measurements of Kair by SSDchamberNk from BIPM 0.17 0.168 : +/- from BIPM cerificateNk stability (from Kair reproducibility) 0.26 from stability of Kair measurElectrometer inaccuracy 0.29 0.5 % from Electr. Specifications unless is included in NkScale reading / resolution 0.00 0.00 0.000 A: SD =0,0, B: scale / measurement eg 0,01pC / 8500 pCUniformity of radiation beam 0.06 0.058 Co60 uniformity is < 0.1 %Difference in Co60 energy spectra (PSSD / SSDL) 0.05 ? Taken from litterartureTemperature & Pressure measurements 0.17 0.08 0.50 Change in temp during measurements - D12 -> Ι5 - See H-J columnsTemperature difference at thermo & chamber 0.05 0.00 : thermometer very close & chamber left for > 2 hrsChamber Positioning in distance 0.231 2.0 Distance indicator - detector size +/- 2 mm at FDD 1000 mmElectrometer Built-In timer 0.00 From measurements & included in Nk stabilityLeakage current 0.00 Measured < 0.1 pC for nC measurementRecombination loss 0.00 Measured for Co60 0Humidity 0.00
Kair QUADRATIC SUM 0.31 0.420.52
User chamber measurementsReproducibility of measurement 0.05 %SD of succesive measurementsScale reading / resolution * 0.00 0.000 A: SD =0,0, B: scale / measurement eg 0,01pC / 8500 pCPositioning in same distance 0.231 2.0 Distance indicator - detector size +/- 2 mm at FDD 1000 mmUniformity of radiation beam (for different chamb) 0.06 Co60 uniformity is < 0.1 % & SSDL & user chamber at same beamTemperature & Pressure 0.17 0.08 0.50 Change in temp during measurements - D12 -> Ι5 - See H-J columnsDifference in Temperature at two places 0.05 0.00 : thermometer very close & chamber left for > 2 hrsLeakage current 0.00 Measured < 0.1 pC for nC measurementRadiation background 0.00 Measured & taken the % acceptable valueElectrometer accuracy Included in calibration factorElectrometer built-in timer * 0.00 Included in calibration factorHumidity 0.00 Taken from litterartureRecombination loss 0.00
User QUADRATIC SUM 0.17 0.260.31
QUADRATIC SUM (ALL) 0.35 0.50COMBINED UNCERTAINTY 0.61 %EXPANDED UNCERTAINTY 1.22 %
Metrologia 47 (2010) Tech. Suppl. 06012
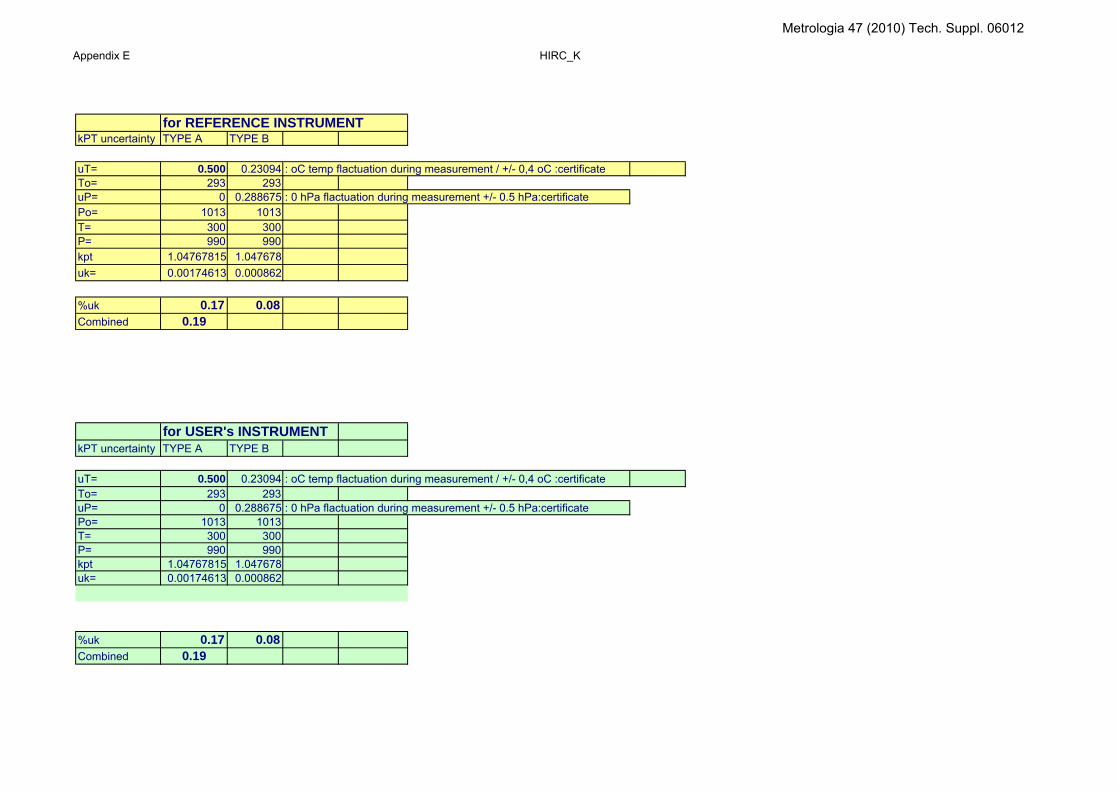
Appendix E HIRC_K
for REFERENCE INSTRUMENT kPT uncertainty TYPE A TYPE B
uT= 0.500 0.23094 : oC temp flactuation during measurement / +/- 0,4 oC :certificateTo= 293 293uP= 0 0.288675 : 0 hPa flactuation during measurement +/- 0.5 hPa:certificatePo= 1013 1013T= 300 300P= 990 990kpt 1.04767815 1.047678uk= 0.00174613 0.000862
%uk 0.17 0.08Combined 0.19
for USER's INSTRUMENT kPT uncertainty TYPE A TYPE B
uT= 0.500 0.23094 : oC temp flactuation during measurement / +/- 0,4 oC :certificateTo= 293 293uP= 0 0.288675 : 0 hPa flactuation during measurement +/- 0.5 hPa:certificatePo= 1013 1013T= 300 300P= 990 990kpt 1.04767815 1.047678uk= 0.00174613 0.000862
%uk 0.17 0.08Combined 0.19
Metrologia 47 (2010) Tech. Suppl. 06012
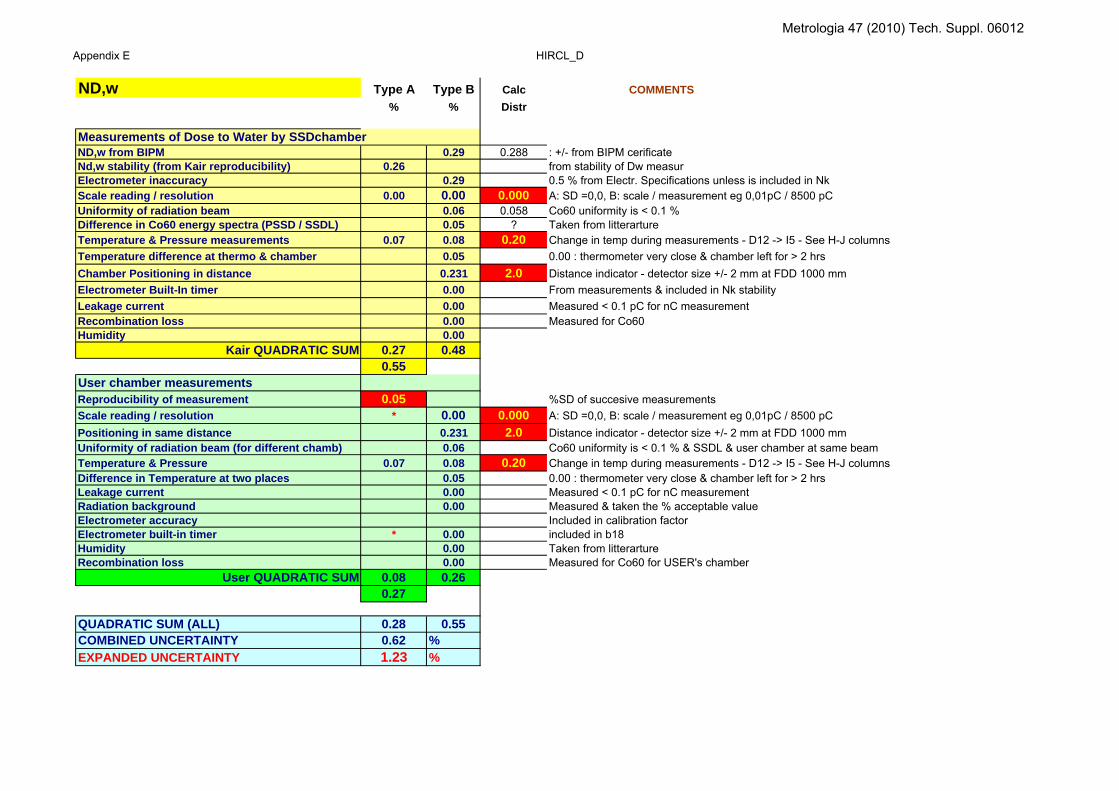
Appendix E HIRCL_D
ND,w Type A Type B Calc COMMENTS% % Distr
Measurements of Dose to Water by SSDchamberND,w from BIPM 0.29 0.288 : +/- from BIPM cerificateNd,w stability (from Kair reproducibility) 0.26 from stability of Dw measurElectrometer inaccuracy 0.29 0.5 % from Electr. Specifications unless is included in NkScale reading / resolution 0.00 0.00 0.000 A: SD =0,0, B: scale / measurement eg 0,01pC / 8500 pCUniformity of radiation beam 0.06 0.058 Co60 uniformity is < 0.1 %Difference in Co60 energy spectra (PSSD / SSDL) 0.05 ? Taken from litterartureTemperature & Pressure measurements 0.07 0.08 0.20 Change in temp during measurements - D12 -> Ι5 - See H-J columnsTemperature difference at thermo & chamber 0.05 0.00 : thermometer very close & chamber left for > 2 hrsChamber Positioning in distance 0.231 2.0 Distance indicator - detector size +/- 2 mm at FDD 1000 mmElectrometer Built-In timer 0.00 From measurements & included in Nk stabilityLeakage current 0.00 Measured < 0.1 pC for nC measurementRecombination loss 0.00 Measured for Co60Humidity 0.00
Kair QUADRATIC SUM 0.27 0.480.55
User chamber measurementsReproducibility of measurement 0.05 %SD of succesive measurementsScale reading / resolution * 0.00 0.000 A: SD =0,0, B: scale / measurement eg 0,01pC / 8500 pCPositioning in same distance 0.231 2.0 Distance indicator - detector size +/- 2 mm at FDD 1000 mmUniformity of radiation beam (for different chamb) 0.06 Co60 uniformity is < 0.1 % & SSDL & user chamber at same beamTemperature & Pressure 0.07 0.08 0.20 Change in temp during measurements - D12 -> Ι5 - See H-J columnsDifference in Temperature at two places 0.05 0.00 : thermometer very close & chamber left for > 2 hrsLeakage current 0.00 Measured < 0.1 pC for nC measurementRadiation background 0.00 Measured & taken the % acceptable valueElectrometer accuracy Included in calibration factorElectrometer built-in timer * 0.00 included in b18Humidity 0.00 Taken from litterartureRecombination loss 0.00 Measured for Co60 for USER's chamber
User QUADRATIC SUM 0.08 0.260.27
QUADRATIC SUM (ALL) 0.28 0.55COMBINED UNCERTAINTY 0.62 %EXPANDED UNCERTAINTY 1.23 %
Metrologia 47 (2010) Tech. Suppl. 06012

Appendix E HIRCL_D
for REFERENCE INSTRUMENT kPT uncertainty TYPE A TYPE B
uT= 0.200 0.23094 : oC temp flactuation during measurement / +/- 0,4 oC :certificateTo= 293 293uP= 0 0.288675 : 0 hPa flactuation during measurement +/- 0.5 hPa:certificatePo= 1013 1013T= 300 300P= 990 990kpt 1.047678 1.047678uk= 0.000698 0.000862
%uk 0.07 0.08Combined 0.11
for USER's INSTRUMENT kPT uncertainty TYPE A TYPE B
uT= 0.200 0.23094 : oC temp flactuation during measurement / +/- 0,4 oC :certificateTo= 293 293uP= 0 0.288675 : 0 hPa flactuation during measurement +/- 0.5 hPa:certificatePo= 1013 1013T= 300 300P= 990 990kpt 1.047678 1.047678uk= 0.000698 0.000862
%uk 0.07 0.08Combined 0.11
Metrologia 47 (2010) Tech. Suppl. 06012
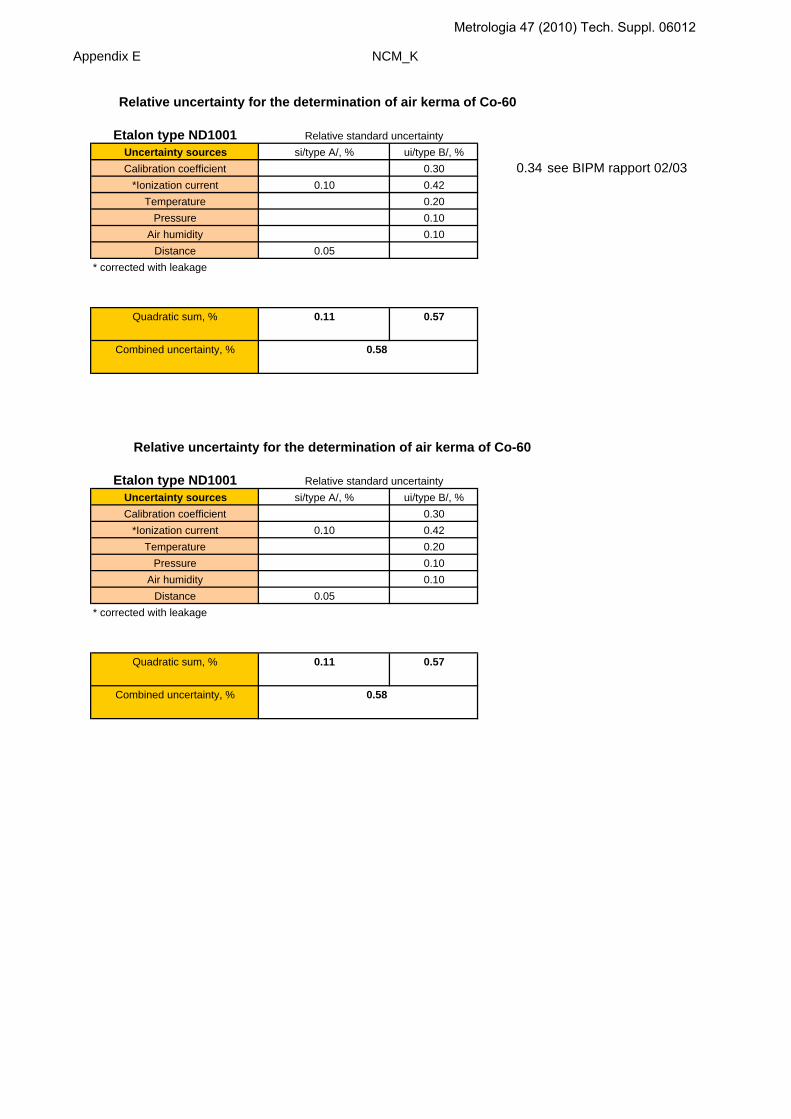
Appendix E NCM_K
Relative uncertainty for the determination of air kerma of Co-60
Etalon type ND1001 Relative standard uncertaintyUncertainty sources si/type A/, % ui/type B/, %Calibration coefficient 0.30 0.34 see BIPM rapport 02/03
*Ionization current 0.10 0.42Temperature 0.20
Pressure 0.10Air humidity 0.10
Distance 0.05* corrected with leakage
Quadratic sum, % 0.11 0.57
Combined uncertainty, % 0.58
Relative uncertainty for the determination of air kerma of Co-60
Etalon type ND1001 Relative standard uncertaintyUncertainty sources si/type A/, % ui/type B/, %Calibration coefficient 0.30
*Ionization current 0.10 0.42Temperature 0.20
Pressure 0.10Air humidity 0.10
Distance 0.05* corrected with leakage
Quadratic sum, % 0.11 0.57
Combined uncertainty, % 0.58
Metrologia 47 (2010) Tech. Suppl. 06012

Appendix E IRB_K_D
1. Standard uncertainty of FDD (%) 0.12. Standard uncertainty of K (%) 0.353. Standard uncertainty kTP (%) 0.0754. Standard uncertainty of (Icorr) (%) 0.039
Standard uncertainty of Nkair 0.375
1. Standard uncertainty of 5g/cm2 in water (%) 0.052. Standard uncertainty of FDD (%) 0.13. Standard uncertainty of D (%) 0.964. Standard uncertainty kTP (%) 0.0755. Standard uncertainty of (Icorr) (%) 0.023
Standard uncertainty of NDw 0.970
Ionization chamber TW30013 (PTW), Serial number 1684, Calibrated at PTB 2005-09-28 Reference No. 6.21-29/05 K
Ionization chamber TW 30013 (PTW), Serial number 1684, calibrated at PTB,2005-09-29 Reference No. 6.62-29/05K
Metrologia 47 (2010) Tech. Suppl. 06012

Appendix E GUM_K
Physical constants and correction factors with their estimated relative uncertainties for the determination of air kerma of Co-60 radiation at the GUM
The material of the chamber wall and collecting electrode is a ultra pure graphite, type EK 50, a production of Ringsdorff, of density 1.71 g cm-3 and with purity higher as 99,985 % and porosity 14 %
Co-60 Etalon type ND 1005/Avalue uA uB
Physical constants Outer height 19ρ (1) dry air density / kg · m3 1.2930 0.01 Outer diameter 19(μ en / ρ ) a, c 0.9985 0.05 Inner height 11s c, a 1.0011 0.30 Inner diameter 11W/e 33.9700 0.15 Min.wall 4g bremsstrahlung loss 0.0032 0.02 Electrode diameter 2Correction factors Electrode height 10k s recombination loss 1.0023 0.02 0.03 Volume of air cavity (cm3) 1.013k h humidity 0.9970 0.03 Applied voltage ±250 voltk st stem scattering 0.9994 0.01 Leakage current 2 fAk sc wall scattering 1.0155 0.01 0.10k CEP mean origin of electrons 0.9955 0.10k an axial non-uniformity 1.0000 0.01k rm radial non-uniformity 1.0003 0.01Current measurementV chamber volume / cm3 1.013 0.20I ionization current 0.03 0.06
quadratic summation 0.04 0.43combined uncertainty
(1) at 101 325 Pa and 273.15 K
Dimensions (mm)Etalon type ND 1005/A
0.43
Metrologia 47 (2010) Tech. Suppl. 06012

Appendix E LMRIR_K
Uncertainty for NE 2561No. quantity estimated value standard uncertainty probability distribution sensitivity coefficient contribution to the standard uncertainty1 conventional true value, Ka 1,564E-01 (Gy) 3,129E-04 (Gy) normal 6,070E+08 (1/C) 0.22 measurement, M 1,668E-09 (C) 6,845E-13 (C) normal -5,692E+16 (Gy/C2) 0.043 distance, d 1000 (mm) 1 (mm) rectangular 0.124 temperature, T 20 (?C) 0,5 (?C) rectangular -3,238E+05 (Gy/C.?K) 0.15 pressure, p 1025,9 (hPa) 2 (hPa) rectangular 9,254E+04 (Gy/C.hPa) 0.1
combined uncertainty 0.3
Uncertainty for PTW 30001No. quantity estimated value standard uncertainty probability distribution sensitivity coefficient contribution to the standard uncertainty1 conventional true value, Ka 1,565E-01 (Gy) 3,130E-04 (Gy) normal 3,210E+08 (1/C) 0.22 measurement, M 3,143E-09 (C) 4,973E-13 (C) normal -1,599E+16 (Gy/C2) 0.023 distance, d 1000 (mm) 1 (mm) rectangular 0.124 temperature, T 20 (?C) 0,5 (?C) rectangular -1,714E+05 (Gy/C.?K) 0.15 pressure, p 1022,4 (hPa) 2 (hPa) rectangular 4,914E+04 (Gy/C.hPa) 0.1
combined uncertainty 0.3
Uncertainty for WS FC65-GNo. quantity estimated value standard uncertainty probability distribution sensitivity coefficient contribution to the standard uncertainty1 conventional true value, Ka 1,565E-01 (Gy) 3,130E-04 (Gy) normal 2,826E+08 (1/C) 0.22 measurement, M 3,570E-09 (C) 1,135E-12 (C) normal -1,239E+16 (Gy/C2) 0.033 distance, d 1000 (mm) 1 (mm) rectangular 0.124 temperature, T 20,2 (?C) 0,5 (?C) rectangular -1,507E+05 (Gy/C.?K) 0.15 pressure, p 1022,8 (hPa) 2 (hPa) rectangular 4,323E+04 (Gy/C.hPa) 0.1
combined uncertainty 0.3
Uncertainty for ND 1006No. quantity estimated value standard uncertainty probability distribution sensitivity coefficient contribution to the standard uncertainty1 conventional true value, Ka 1,564E-01 (Gy) 3,129E-04 (Gy) normal 7,297E+08 (1/C) 0.22 measurement, M 1,388E-9 (C) 3,071E-13 (C) normal -8,222E+16 (Gy/C2) 0.023 distance, d 1000 (mm) 3 (mm) rectangular 0.354 temperature, T 20 (?C) 0,5 (?C) rectangular -3,893E+05 (Gy/C.?K) 0.15 pressure, p 1026,2 (hPa) 2 (hPa) rectangular 1,112E+05 (Gy/C.hPa) 0.1
combined uncertainty 0.4
Metrologia 47 (2010) Tech. Suppl. 06012

Appendix E LMRIR_D
Uncertainty for PTW 30001No. quantity estimated value standard uncertainty probability distribution sensitivity coefficient contribution to the standard uncertainty1 conventional true value, Dw 1,521E-01 (Gy) 6,084E-04 (Gy) normal 3,526E+08 (1/C) 0.42 measurement, M 2,861E-9 (C) 1,642E-12 (C) normal -1,875E+16 (Gy/C2) 0.13 distance, d 1000 (mm) 1 (mm) rectangular 0.124 temperature, T 20,5 (?C) 0,5 (?C) rectangular -1,826E+05 (Gy/C.?K) 0.15 pressure, p 1023.9 2 (hPa) rectangular 5,238E+04 (Gy/C.hPa) 0.16 depth in water 5 (cm) 0,05 (cm) rectangular 0.17
combined uncertainty 0.5
Uncertainty for WS FC65-GNo. quantity estimated value standard uncertainty probability distribution sensitivity coefficient contribution to the standard uncertainty1 conventional true value, Dw 1,549E-01 (Gy) 6,195E-04 (Gy) normal 3,049E+08 (1/C) 0.42 measurement, M 3,263E-9 (C) 1,572E-12 (C) normal -1,447E+16 (Gy/C2) 0.053 distance, d 1000 (mm) 1 (mm) rectangular 0.124 temperature, T 21,4 (?C) 0,5 (?C) rectangular -1,603E+05 (Gy/C.?K) 0.15 pressure, p 1013 2 (hPa) rectangular 4,662E+04 (Gy/C.hPa) 0.16 depth in water 5 (cm) 0,05 (cm) rectangular 0.17
combined uncertainty 0.5
Uncertainty for NE 2561No. quantity estimated value standard uncertainty probability distribution sensitivity coefficient contribution to the standard uncertainty1 conventional true value, Dw 1,548E-01 (Gy) 6,192E-04 (Gy) normal 8,205E+08 (1/C) 0.42 measurement, M 1,530E-9 (C) 1,045E-12 (C) normal -6,678E+16 (Gy/C2) 0.073 distance, d 1000 (mm) 1 (mm) rectangular 0.124 temperature, T 19,2 (?C) 0,5 (?C) rectangular -3,495E+05 (Gy/C.?K) 0.15 pressure, p 1019.8 2 (hPa) rectangular 1,002E+05 (Gy/C.hPa) 0.16 depth in water 5 (cm) 0,05 (cm) rectangular 0.17
combined uncertainty 0.5
Uncertainty for ND 1006No. quantity estimated value standard uncertainty probability distribution sensitivity coefficient contribution to the standard uncertainty1 conventional true value, Dw 1,548E-01 (Gy) 6,192E-04 (Gy) normal 7,828E+08 (1/C) 0.42 measurement, M 1,285E-9 (C) 5,634E-13 (C) normal -9,430E+16 (Gy/C2) 0.043 distance, d 1000 (mm) 2 (mm) rectangular 0.234 temperature, T 20,1 (?C) 0,5 (?C) rectangular -4,132E+05(Gy/C.?K) 0.15 pressure, p 1019.6 2 (hPa) rectangular 1,189E+05 (Gy/C.hPa) 0.16 depth in water 5 (cm) 0,1 (cm) rectangular 0.3
combined uncertainty 0.6
Metrologia 47 (2010) Tech. Suppl. 06012
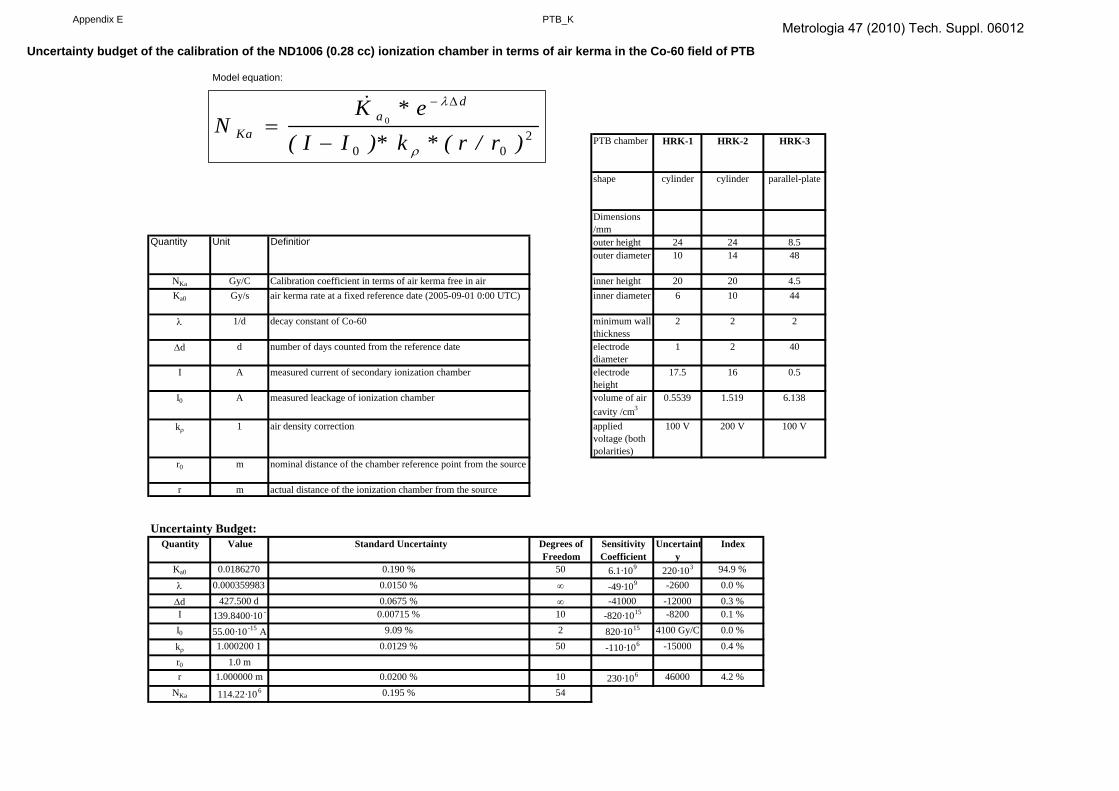
Appendix E PTB_K
Uncertainty budget of the calibration of the ND1006 (0.28 cc) ionization chamber in terms of air kerma in the Co-60 field of PTB
Model equation:
PTB chamber HRK-1 HRK-2 HRK-3
shape cylinder cylinder parallel-plate
Dimensions /mm
Quantity Unit Definition outer height 24 24 8.5outer diameter 10 14 48
NKa Gy/C Calibration coefficient in terms of air kerma free in air inner height 20 20 4.5Ka0 Gy/s air kerma rate at a fixed reference date (2005-09-01 0:00 UTC) inner diameter 6 10 44
λ 1/d decay constant of Co-60 minimum wall thickness
2 2 2
Δd d number of days counted from the reference date electrode diameter
1 2 40
I A measured current of secondary ionization chamber electrode height
17.5 16 0.5
I0 A measured leackage of ionization chamber volume of air cavity /cm3
0.5539 1.519 6.138
kρ 1 air density correction applied voltage (both polarities)
100 V 200 V 100 V
r0 m nominal distance of the chamber reference point from the source
r m actual distance of the ionization chamber from the source
Uncertainty Budget:Quantity Value Standard Uncertainty Degrees of
FreedomSensitivity Coefficient
Uncertainty
Index
Ka0 0.0186270 /
0.190 % 50 6.1·109 220·103 94.9 %
λ 0.000359983/d
0.0150 % ∞ -49·109 -2600 /
0.0 %
Δd 427.500 d 0.0675 % ∞ -41000 -12000 0.3 %I 139.8400·10 - 0.00715 % 10 -820·1015 -8200
/0.1 %
I0 55.00·10-15 A 9.09 % 2 820·1015 4100 Gy/C 0.0 %
kρ 1.000200 1 0.0129 % 50 -110·106 -15000 /
0.4 %r0 1.0 mr 1.000000 m 0.0200 % 10 230·106 46000
/4.2 %
NKa 114.22·106 0.195 % 54
200
0
)r/r(*k)*II(e*K
Nd
aKa
ρ
λ
−=
Δ−&
Metrologia 47 (2010) Tech. Suppl. 06012

Appendix E PTB_K
Physical constants and correction factors with their estimated relative standard uncertainties for the determination of the air kermaat Co-60 gamma radiation at PTB in September 2006:
HRK-1 HRK-2 HRK-3value uA uB value uA uB value uA uB
% % % % % %Physical Constantsρ dry air density / kg cm3 1.2046E-06 0.01 1.2046E-06 0.01 1.2046E-06 0.01(μen/ρ)a,c 0.9985 0.05 0.9985 0.05 0.9985 0.05sc,a 1.0010 0.11 1.0010 0.11 1.0010 0.11W/e J/C 33.97 33.97 33.97g bremsstrahlung loss 0.0032 0.02 0.0032 0.02 0.0032 0.02Correction factors:ks recombination losses 1.0045 0.1 0.05 1.0051 0.1 0.05 1.0017 0.05 0.05kh humidity 0.9970 0.03 0.9970 0.03 0.9970 0.03kst stem scattering 0.9989 0.05 0.9982 0.05 0.9992 0.05kwall * wall effects 1.0097 0.01 0.05 1.0134 0.01 0.05 1.0004 0.01 0.05kpn point source non-uniformity 1.0005 0.03 0.05 1.0002 0.04 0.05 1.0015 0.03 0.05kbn
** beam non-uniformity 1.0005 0.05 1.0005 0.05 1.0028 0.1
Charge measurementV / cm3 chamber volume 0.5539 0.1 1.5190 0.03 6.138 0.08Q charge 0.02 0.02 0.03 0.02 0.03 0.02
NK / Gy/C calibration factor 5.1617E+07 1.8883E+07 4.6187E+06
quadratic summation 0.15 0.16 0.13 0.16 0.12 0.18combined uncertainty 0.22 0.21 0.22
* kwall = kat*ksc*kcep
** In the PTB beam
The conventional true value of the air kerma is the mean value of the results obtained by the three chambers. Correlations are taken into account in the estimation of the combined uncertainty.
u / %HRK-1 0.22HRK-2 0.21HRK-3 0.22Mean 0.19
Metrologia 47 (2010) Tech. Suppl. 06012
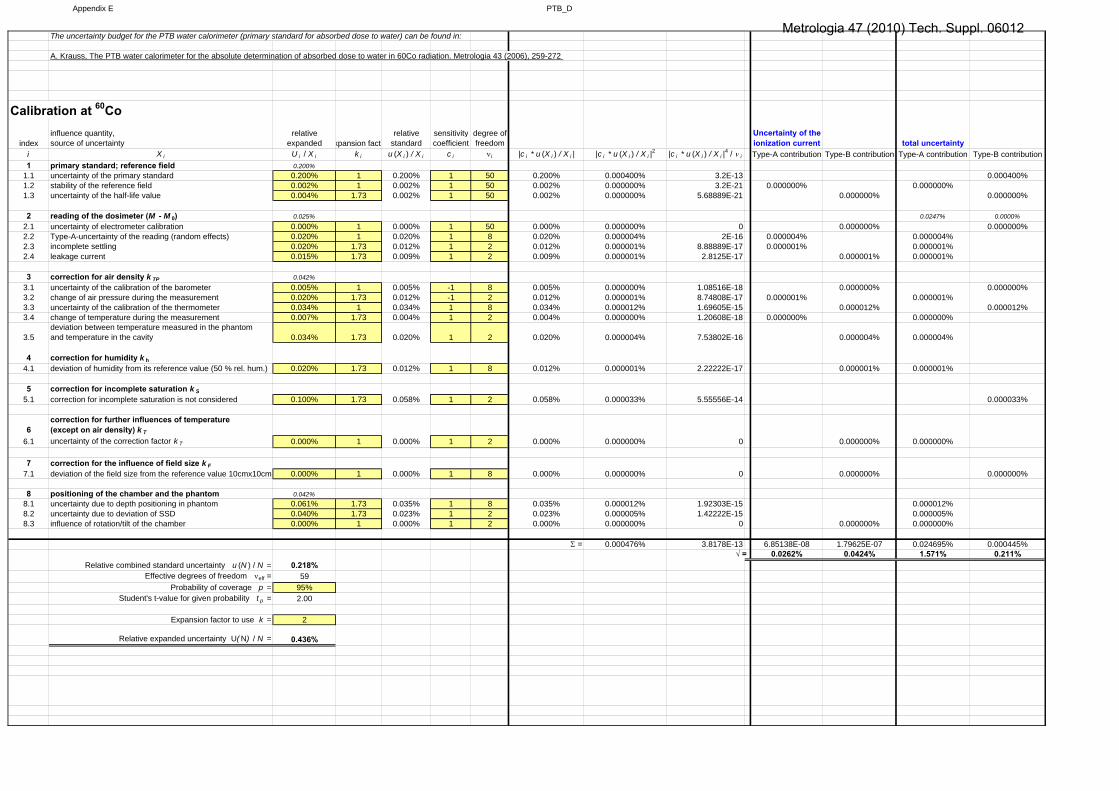
Appendix E PTB_D
The uncertainty budget for the PTB water calorimeter (primary standard for absorbed dose to water) can be found in:
A. Krauss, The PTB water calorimeter for the absolute determination of absorbed dose to water in 60Co radiation. Metrologia 43 (2006), 259-272
Calibration at 60Co
indexinfluence quantity,source of uncertainty
relative expanded xpansion fact
relative standard
sensitivitycoefficient
degree offreedom
Uncertainty of theionization current total uncertainty
i X i U i / X i k i u (X i ) / X i c i νi |c i * u (X i ) / X i | |c i * u (X i ) / X i |2 |c i * u (X i ) / X i |
4 / ν i Type-A contribution Type-B contribution Type-A contribution Type-B contribution1 primary standard; reference field 0.200%
1.1 uncertainty of the primary standard 0.200% 1 0.200% 1 50 0.200% 0.000400% 3.2E-13 0.000400%1.2 stability of the reference field 0.002% 1 0.002% 1 50 0.002% 0.000000% 3.2E-21 0.000000% 0.000000%1.3 uncertainty of the half-life value 0.004% 1.73 0.002% 1 50 0.002% 0.000000% 5.68889E-21 0.000000% 0.000000%
2 reading of the dosimeter (M - M 0) 0.025% 0.0247% 0.0000%
2.1 uncertainty of electrometer calibration 0.000% 1 0.000% 1 50 0.000% 0.000000% 0 0.000000% 0.000000%2.2 Type-A-uncertainty of the reading (random effects) 0.020% 1 0.020% 1 8 0.020% 0.000004% 2E-16 0.000004% 0.000004%2.3 incomplete settling 0.020% 1.73 0.012% 1 2 0.012% 0.000001% 8.88889E-17 0.000001% 0.000001%2.4 leakage current 0.015% 1.73 0.009% 1 2 0.009% 0.000001% 2.8125E-17 0.000001% 0.000001%
3 correction for air density k TP 0.042%
3.1 uncertainty of the calibration of the barometer 0.005% 1 0.005% -1 8 0.005% 0.000000% 1.08516E-18 0.000000% 0.000000%3.2 change of air pressure during the measurement 0.020% 1.73 0.012% -1 2 0.012% 0.000001% 8.74808E-17 0.000001% 0.000001%3.3 uncertainty of the calibration of the thermometer 0.034% 1 0.034% 1 8 0.034% 0.000012% 1.69605E-15 0.000012% 0.000012%3.4 change of temperature during the measurement 0.007% 1.73 0.004% 1 2 0.004% 0.000000% 1.20608E-18 0.000000% 0.000000%
3.5deviation between temperature measured in the phantomand temperature in the cavity 0.034% 1.73 0.020% 1 2 0.020% 0.000004% 7.53802E-16 0.000004% 0.000004%
4 correction for humidity k h4.1 deviation of humidity from its reference value (50 % rel. hum.) 0.020% 1.73 0.012% 1 8 0.012% 0.000001% 2.22222E-17 0.000001% 0.000001%
5 correction for incomplete saturation k S5.1 correction for incomplete saturation is not considered 0.100% 1.73 0.058% 1 2 0.058% 0.000033% 5.55556E-14 0.000033%
6correction for further influences of temperature(except on air density) k T
6.1 uncertainty of the correction factor k T 0.000% 1 0.000% 1 2 0.000% 0.000000% 0 0.000000% 0.000000%
7 correction for the influence of field size k F7.1 deviation of the field size from the reference value 10cmx10cm 0.000% 1 0.000% 1 8 0.000% 0.000000% 0 0.000000% 0.000000%
8 positioning of the chamber and the phantom 0.042%8.1 uncertainty due to depth positioning in phantom 0.061% 1.73 0.035% 1 8 0.035% 0.000012% 1.92303E-15 0.000012%8.2 uncertainty due to deviation of SSD 0.040% 1.73 0.023% 1 2 0.023% 0.000005% 1.42222E-15 0.000005%8.3 influence of rotation/tilt of the chamber 0.000% 1 0.000% 1 2 0.000% 0.000000% 0 0.000000% 0.000000%
Σ = 0.000476% 3.8178E-13 6.85138E-08 1.79625E-07 0.024695% 0.000445%√ = 0.0262% 0.0424% 1.571% 0.211%
Relative combined standard uncertainty u (N ) / N = 0.218%Effective degrees of freedom νeff = 59
Probability of coverage p = 95%Student's t-value for given probability t p = 2.00
Expansion factor to use k = 2
Relative expanded uncertainty U( N) / N = 0.436%
Metrologia 47 (2010) Tech. Suppl. 06012
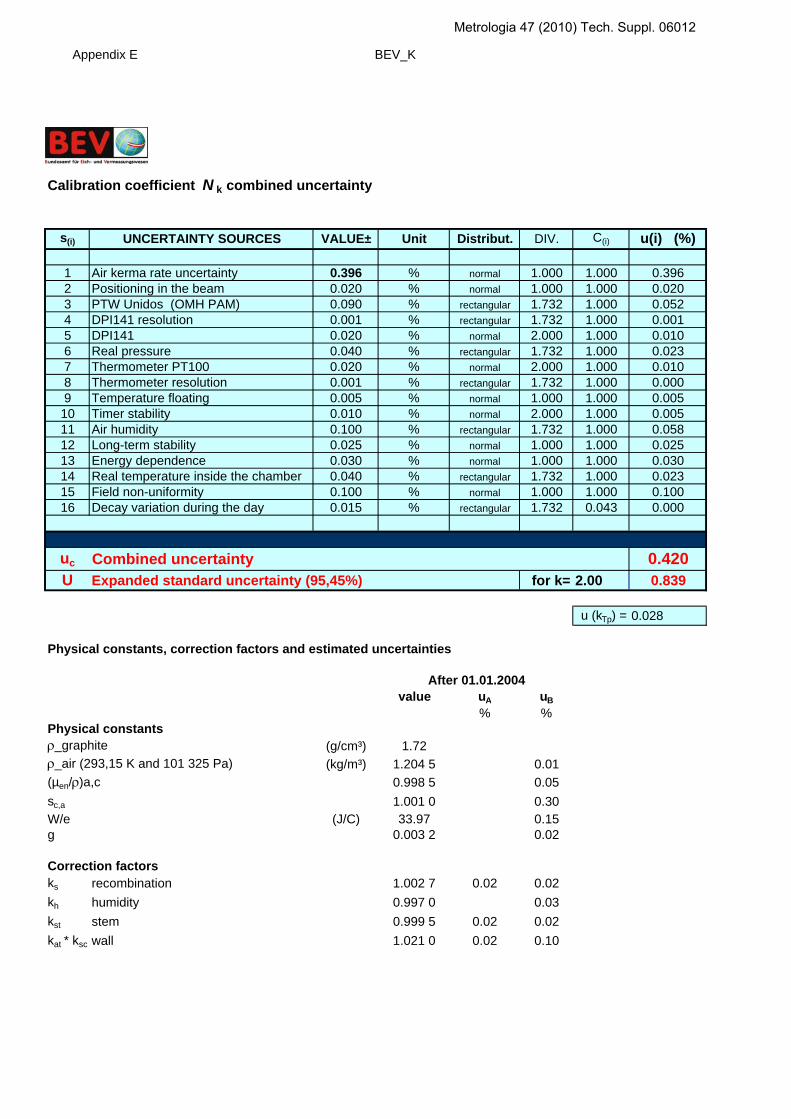
Appendix E BEV_K
Calibration coefficient N k combined uncertainty
s(i) UNCERTAINTY SOURCES VALUE± Unit Distribut. DIV. C(i) u(i) (%)
1 Air kerma rate uncertainty 0.396 % normal 1.000 1.000 0.3962 Positioning in the beam 0.020 % normal 1.000 1.000 0.0203 PTW Unidos (OMH PAM) 0.090 % rectangular 1.732 1.000 0.0524 DPI141 resolution 0.001 % rectangular 1.732 1.000 0.0015 DPI141 0.020 % normal 2.000 1.000 0.0106 Real pressure 0.040 % rectangular 1.732 1.000 0.0237 Thermometer PT100 0.020 % normal 2.000 1.000 0.0108 Thermometer resolution 0.001 % rectangular 1.732 1.000 0.0009 Temperature floating 0.005 % normal 1.000 1.000 0.00510 Timer stability 0.010 % normal 2.000 1.000 0.00511 Air humidity 0.100 % rectangular 1.732 1.000 0.05812 Long-term stability 0.025 % normal 1.000 1.000 0.02513 Energy dependence 0.030 % normal 1.000 1.000 0.03014 Real temperature inside the chamber 0.040 % rectangular 1.732 1.000 0.02315 Field non-uniformity 0.100 % normal 1.000 1.000 0.10016 Decay variation during the day 0.015 % rectangular 1.732 0.043 0.000
uc Combined uncertainty 0.420U Expanded standard uncertainty (95,45%) for k= 2.00 0.839
u (kTp) = 0.028
Physical constants, correction factors and estimated uncertainties
value uA uB% %
Physical constantsρ_graphite (g/cm³) 1.72ρ_air (293,15 K and 101 325 Pa) (kg/m³) 1.204 5 0.01(µen/ρ)a,c 0.998 5 0.05sc,a 1.001 0 0.30W/e (J/C) 33.97 0.15g 0.003 2 0.02
Correction factorsks recombination 1.002 7 0.02 0.02kh humidity 0.997 0 0.03kst stem 0.999 5 0.02 0.02kat * ksc wall 1.021 0 0.02 0.10
After 01.01.2004
Metrologia 47 (2010) Tech. Suppl. 06012

Appendix E BEV_K
kcep mean origin of electrons -kan axial non-uniformity 1.000 0 0.10krn radial non-uniformiy 1.000 0 0.02product ki Πk i 1.020 2
Measurement of I/v*rhov volume (cm³) 1.018 7 0.12I+ ionisation current 0.02 0.05I+ / I- polarity 1.001 2 0.02by quadratic summation 0.045 0.393Combined uncertainty in air kerma, uc%Expanded standard uncertainty in air kerma (k=2), U %
Air kerma rate, BEV teletherapy sourceSDD = 1m, field-size: 10 cm x 10 cm
Reference date 2004.12.31Halflife (d) 1925.5I+ref (20 °C and 101 325 Pa) (pA) 216.6 0kpol polarity 0.999 4
Ka = (I+*kpol) * (ρ[g/cm³]*v[cm³])-1*W/e *(1-g)-1*(µen/ρ)a,c*sc,a*Π ki
X = Ka / 0,008792
Air kerma rate 6.13 0 mGy/s
0.3960.791
=
•
aK
Metrologia 47 (2010) Tech. Suppl. 06012

Appendix E BEV_D
Calibration coefficient N Dw combined uncertainty
s(i) UNCERTAINTY SOURCES VALUE± Unit Distribut. DIV. C(i) u(i) (%)
1 Absorbed dose to water uncertainty 0.371 % normal 1.000 1.000 0.3712 Position in the beam 0.020 % normal 1.000 1.000 0.0203 Depth in water 0.050 % normal 2.000 1.000 0.0254 Phantom front face distortion 0.020 % rectangular 1.732 1.000 0.0125 PTW Unidos (OMH PAM) 0.090 % rectangular 1.732 1.000 0.0526 DPI141 resolution 0.001 % rectangular 1.732 1.000 0.0017 DPI141 0.020 % normal 2.000 1.000 0.0108 Real pressure 0.040 % rectangular 1.732 1.000 0.0239 Thermometer PT100 0.020 % normal 2.000 1.000 0.01010 Thermometer resolution 0.001 % rectangular 1.732 1.000 0.00011 Temperature floating 0.005 % normal 1.000 1.000 0.00512 Real temperature inside the chamber 0.100 % rectangular 1.732 1.000 0.05813 Air humidity 0.100 % rectangular 1.732 1.000 0.05814 Timer stability 0.001 % normal 2.000 1.000 0.00115 Effect of waterproofing sleeves 0.150 % rectangular 1.732 1.000 0.08716 Decay variation during the day 0.015 % rectangular 1.732 0.043 0.00017 Field non-uniformity 0.100 % normal 1.000 1.000 0.10018 Long-term stability 0.025 % normal 1.000 1.000 0.02519 Energy dependence 0.030 % normal 1.000 1.000 0.030
uc Combined uncertainty 0.410U Expanded standard uncertainty (95,45%) for k= 2.00 0.820
u (kTp) = 0.028
60Co gamma radiation of BEV teletherapy sourceAbsorbed dose to water with cylindrical chamber CC01/105
uA uB% %
Determination of Dg (by graphite calorimeter) Method1Electrical power to core 0.15Core mass during irradiation 0.12Irradiation time 0.03Determination of correction for deviation from quasi-isothermal op 0.03 0.01Vacuum and air gaps 0.15Long-term stability of dose rate (including the half-life 60Co) 0.02 0.02Interpolation on depth dose curve 0.03
by quadratic summation 0.036 0.248Combined uncertainty
Relative standard uncertainties for calibrations in terms of absorbed dose to water for 60Co
BEVAfter 01.01.2004
0.251
Metrologia 47 (2010) Tech. Suppl. 06012

Appendix E BEV_D
Conversion to absorbed dose to water Dwmethod 1: by calculationDistance from the source to the phantom 0.20Depths in graphite and in water 0.10Front wall of water phantom 0.05Deviation from scaling theorem
Physical constantsRatio of mass energy-absorption coefficients 0.10Ratio of dose-to-kerma ratios βw / βc 0.10methodby quadratic summation 0.269
Combined uncertainty
method 2: with ionisation chamberMeasurement of ionisation current ratio 0.05 0.03Position of chamber in graphite phantom 0.05Position of chamber in water 0.05Envelope of chamber 0.05Front wall of the water phantom 0.05Replacement factor 0.20Correction for air temperature and pressure 0.03Correction for air humidity 0.05Correction for source decay 0.00
Physical constantsRatio of mass energy-absorption coefficients 0.10Ratio of dose-to-kerma ratios βw / βc 0.10
methodby quadratic summation 0.050 0.273Combined uncertainty
Combined uncertainty in absorbed dose to water, uc%Expanded standard uncertainty in air kerma (k=2), U % 0.742
0.368
0.374
0.371
Metrologia 47 (2010) Tech. Suppl. 06012
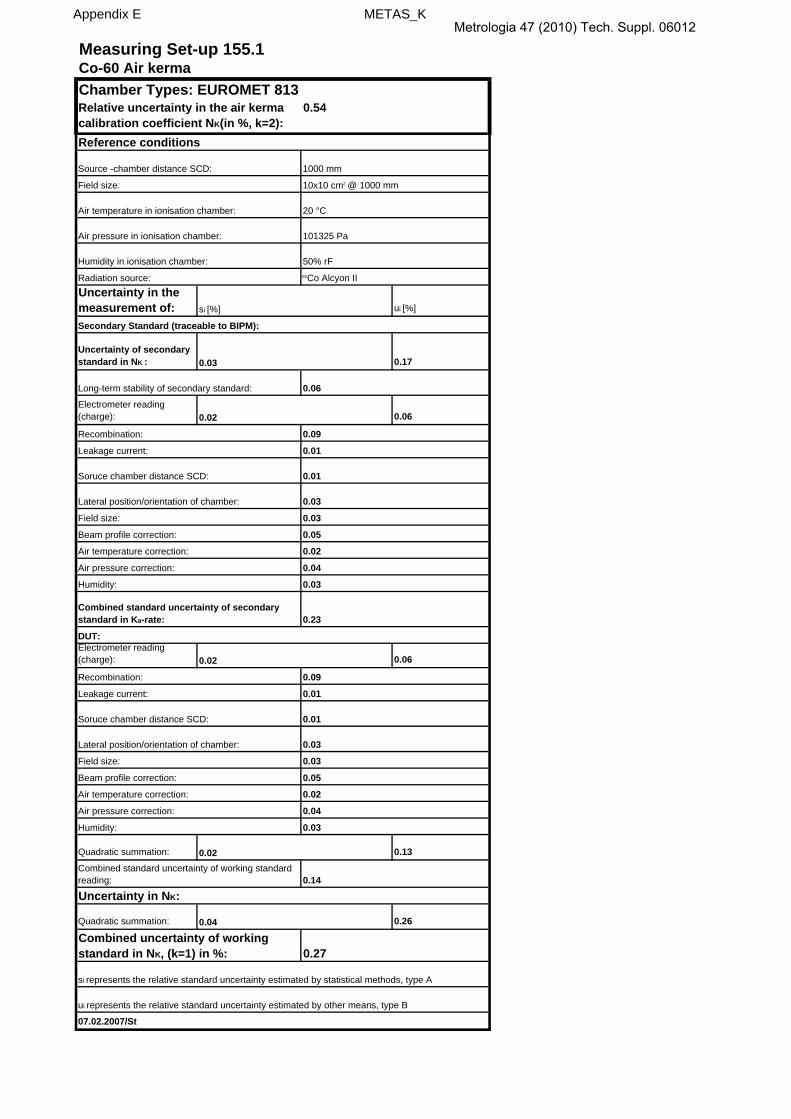
Appendix E METAS_K
Uncertainty in the measurement of: ui [%]
Uncertainty of secondary standard in NK : 0.17
Electrometer reading (charge): 0.06
Electrometer reading (charge): 0.06
Quadratic summation: 0.13
Quadratic summation: 0.26
Measuring Set-up 155.1Co-60 Air kerma Chamber Types: EUROMET 813Relative uncertainty in the air kerma calibration coefficient NK(in %, k=2):
0.54
Reference conditions
Source -chamber distance SCD: 1000 mm
Field size: 10x10 cm2 @ 1000 mm
Air temperature in ionisation chamber: 20 °C
Air pressure in ionisation chamber: 101325 Pa
Humidity in ionisation chamber: 50% rF
Radiation source: 60Co Alcyon II
si [%]
Secondary Standard (traceable to BIPM):
0.03
Long-term stability of secondary standard: 0.06
0.02
Recombination: 0.09
Leakage current: 0.01
Soruce chamber distance SCD: 0.01
Lateral position/orientation of chamber: 0.03
Field size: 0.03
Beam profile correction: 0.05
Air temperature correction: 0.02
Air pressure correction: 0.04
Humidity: 0.03
Combined standard uncertainty of secondary standard in Ka-rate: 0.23
DUT:
0.02
Recombination: 0.09
Leakage current: 0.01
Soruce chamber distance SCD: 0.01
Lateral position/orientation of chamber: 0.03
Field size: 0.03
Beam profile correction: 0.05
Air temperature correction: 0.02
Air pressure correction: 0.04
Humidity: 0.03
0.02Combined standard uncertainty of working standard reading: 0.14
Uncertainty in NK:
ui represents the relative standard uncertainty estimated by other means, type B
07.02.2007/St
0.04
Combined uncertainty of working standard in NK, (k=1) in %: 0.27
si represents the relative standard uncertainty estimated by statistical methods, type A
Metrologia 47 (2010) Tech. Suppl. 06012
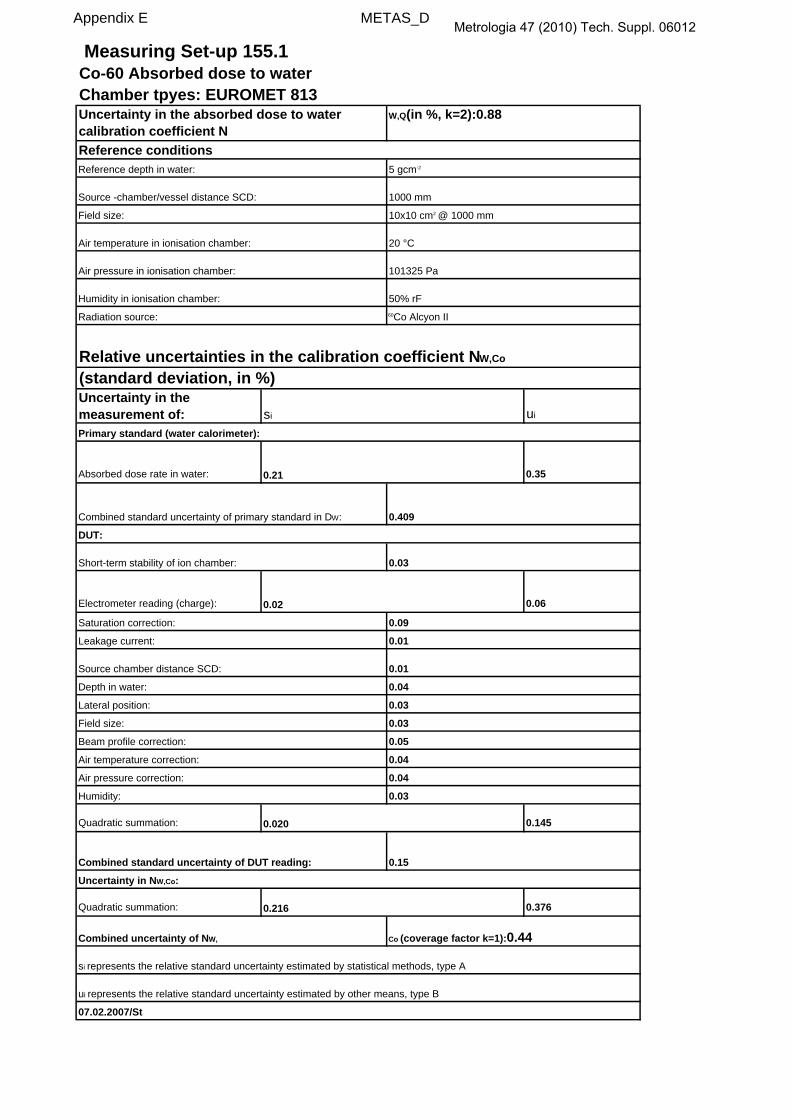
Appendix E METAS_D
Uncertainty in the measurement of: ui
Absorbed dose rate in water: 0.35
Electrometer reading (charge): 0.06
Quadratic summation: 0.145
Quadratic summation: 0.376
Measuring Set-up 155.1Co-60 Absorbed dose to waterChamber tpyes: EUROMET 813Uncertainty in the absorbed dose to water calibration coefficient N
W,Q(in %, k=2):0.88
Reference conditionsReference depth in water: 5 gcm-2
Source -chamber/vessel distance SCD: 1000 mm
Field size: 10x10 cm2 @ 1000 mm
Air temperature in ionisation chamber: 20 °C
Air pressure in ionisation chamber: 101325 Pa
Humidity in ionisation chamber: 50% rF
Radiation source: 60Co Alcyon II
Relative uncertainties in the calibration coefficient NW,Co
(standard deviation, in %)
si
Primary standard (water calorimeter):
0.21
Combined standard uncertainty of primary standard in DW: 0.409
DUT:
Short-term stability of ion chamber: 0.03
0.02
Saturation correction: 0.09
Leakage current: 0.01
Source chamber distance SCD: 0.01
Depth in water: 0.04
Lateral position: 0.03
Field size: 0.03
Beam profile correction: 0.05
Air temperature correction: 0.04
Air pressure correction: 0.04
Humidity: 0.03
0.020
Combined standard uncertainty of DUT reading: 0.15
Uncertainty in NW,Co:
ui represents the relative standard uncertainty estimated by other means, type B
07.02.2007/St
0.216
Combined uncertainty of NW, Co (coverage factor k=1):0.44
si represents the relative standard uncertainty estimated by statistical methods, type A
Metrologia 47 (2010) Tech. Suppl. 06012

Appendix E VSL_K
Estimated uncertainty in the determination of the air-kerma calibration coefficient for gamma radiation of Co-60
Quantity Estimate Standard Probability Sensitivity Uncertaintyuncertainty distribution coefficient contribution
%
1. Realization of the air-kerma with the NMi primary 5 cm3 air-kerma standard
Volume 4.845 cm3 0.10% normal 1 0.10Density of air 1.19656 g/cm3 0.01 g/cm3 normal 1 0.01Stopping power ratio 1.00062 0.20% normal 1 0.20Absorption coefficient ratio 0.999 0.05% normal 1 0.05Energy per ion pair 33.97 J/C 0.15 J/C rectangular 1 0.09Correction for bremstrahlung losses 1.0032 0.03% normal 1 0.03Correction for recombination *) 0.03% normal 1 0.03Correction for stem scatter 0.999 0.05% normal 1 0.05Correction for wall absorption 1.026 0.20% normal 1 0.20Correction for displacement 0.995 0.20% normal 1 0.20Correction for air humidity 0.997 0.05% rectangular 1 0.03Correction for radial nonuniformity 1 0.03% rectangular 1 0.02Correction for radial nonuniformity 1 0.15% rectangular 1 0.09Combined uncertainty 0.40
2. Estimated uncertainty in the reference measurement with the NMi primary 5 cm3 air-kerma standard
Volume fluctuation 0.10% normal 1 0.10Time measurement 1.000 s 0.01 s normal 1 0.01Pressure 100 kPa 0.03% normal 1 0.03Temperature 295 K 0.02% normal 1 0.02Charge measurement (type A) 0.05% normal 1 0.05Distance 100 cm 0.05 cm normal 1 0.10Scattered radiation 0.10% normal 1 0.10Combined uncertainty 0.19
3. Estimated uncertainty in the calibration measurement of the ionization chamber
Pressure 100 kPa 0.03% normal 1 0.03Temperature 295 K 0.02% normal 1 0.02Decay correction 0.02% normal 1 0.02Correction air density 0.04% normal 1 0.04Distance 100 cm 0.05 cm normal 1 0.10Charge meaurement (type A) 0.10% normal 1 0.10Combined uncertainty 0.16Expanded uncertainty (k = 2) in the air-kerma calibration coefficient 0.95
Metrologia 47 (2010) Tech. Suppl. 06012
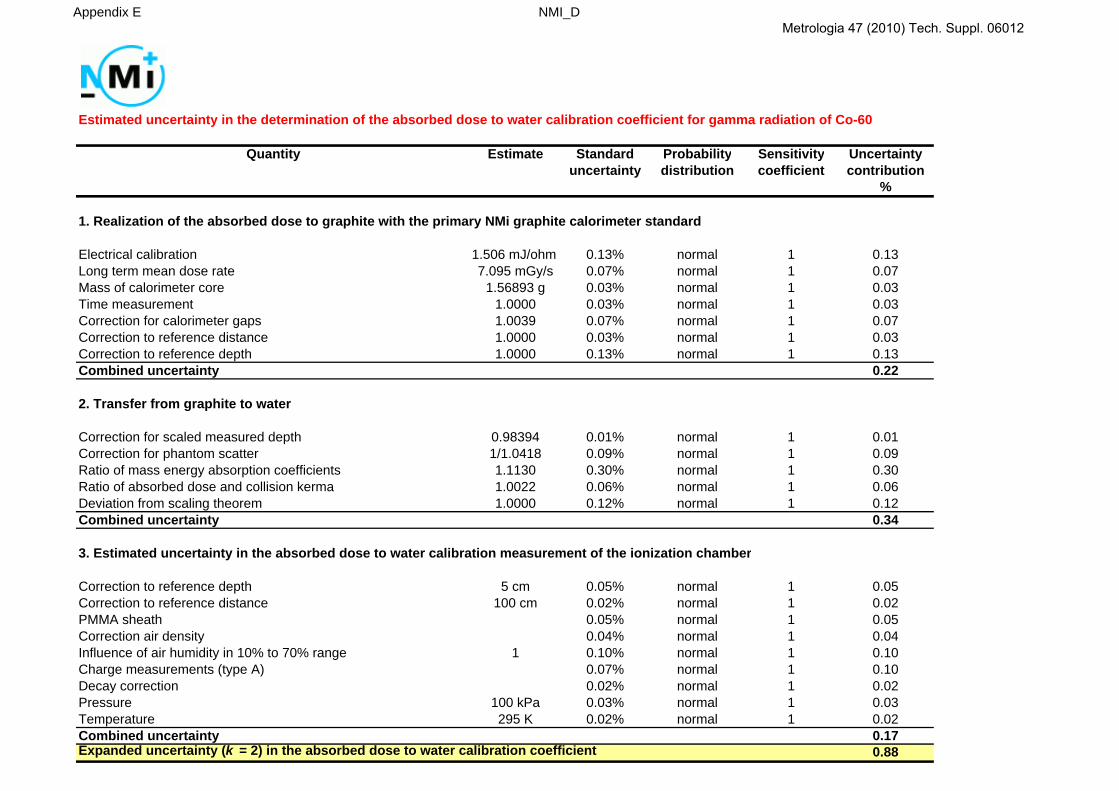
Appendix E NMI_D
Estimated uncertainty in the determination of the absorbed dose to water calibration coefficient for gamma radiation of Co-60
Quantity Estimate Standard Probability Sensitivity Uncertaintyuncertainty distribution coefficient contribution
%
1. Realization of the absorbed dose to graphite with the primary NMi graphite calorimeter standard
Electrical calibration 1.506 mJ/ohm 0.13% normal 1 0.13Long term mean dose rate 7.095 mGy/s 0.07% normal 1 0.07Mass of calorimeter core 1.56893 g 0.03% normal 1 0.03Time measurement 1.0000 0.03% normal 1 0.03Correction for calorimeter gaps 1.0039 0.07% normal 1 0.07Correction to reference distance 1.0000 0.03% normal 1 0.03Correction to reference depth 1.0000 0.13% normal 1 0.13Combined uncertainty 0.22
2. Transfer from graphite to water
Correction for scaled measured depth 0.98394 0.01% normal 1 0.01Correction for phantom scatter 1/1.0418 0.09% normal 1 0.09Ratio of mass energy absorption coefficients 1.1130 0.30% normal 1 0.30Ratio of absorbed dose and collision kerma 1.0022 0.06% normal 1 0.06Deviation from scaling theorem 1.0000 0.12% normal 1 0.12Combined uncertainty 0.34
3. Estimated uncertainty in the absorbed dose to water calibration measurement of the ionization chamber
Correction to reference depth 5 cm 0.05% normal 1 0.05Correction to reference distance 100 cm 0.02% normal 1 0.02PMMA sheath 0.05% normal 1 0.05Correction air density 0.04% normal 1 0.04Influence of air humidity in 10% to 70% range 1 0.10% normal 1 0.10Charge measurements (type A) 0.07% normal 1 0.10Decay correction 0.02% normal 1 0.02Pressure 100 kPa 0.03% normal 1 0.03Temperature 295 K 0.02% normal 1 0.02Combined uncertainty 0.17Expanded uncertainty (k = 2) in the absorbed dose to water calibration coefficient 0.88
Metrologia 47 (2010) Tech. Suppl. 06012

Appendix E ENEA_K
Source of component of relative standarduncertainty 100 si 100 ui
Primary standard 0.35Ionization current 0.03 0.15Recombination loss, Ks 0.05Distance 0.05PressureTemperatureHumidityFinite chamber dimensions 0.05Leakage 0.01Radial non-uniformity 0.01Relative uncertainty on Nk
quadratic sum 0.077 0.389combined uncertainty uc
expanded standard uncertaintyU (95,45%)
Estimated uncertainties, of the secondary standard chambers calibration in terms of air kerma at the INMRI-ENEA
in Co-60 gamma radiation beam
0.79
0.05 0.035
0.397
Metrologia 47 (2010) Tech. Suppl. 06012

Appendix E ENEA_D
Relative standard uncertainty of the ND,w calibration coefficient
Type A Type BAbsorbed dose to water, Dw 100 si 100 ui
calorimetric measurement of Dc 0.15 0.23positioning of the Thick Walled chamber in graphite 0.04measurement of Ic for the Thick Walled chamber 0.02 0.08positioning of the Thick Walled chamber in water 0.06measurement of Iw for the Thick Walled chamber 0.02 0.08ratio of the mean mass energy-absorption coefficients in water and graphite at the measurement point in water 0.02 0.14ratio of the absorbed dose to collision kerma ratios in water and graphite, at the measurement point in water 0.01 0.10ratio of the photon energy fluences in water and in a small mass of graphite, respectively, at the measurement point in water 0.05 0.06ND,w determination for the transfer chamberionization current measurement 0.02 0.06correction for influence quantities, ki 0.06distance 0.02depth in water 0.06
quadratic summation 0.16 0.34combined relative standard uncertainty 0.38
Metrologia 47 (2010) Tech. Suppl. 06012
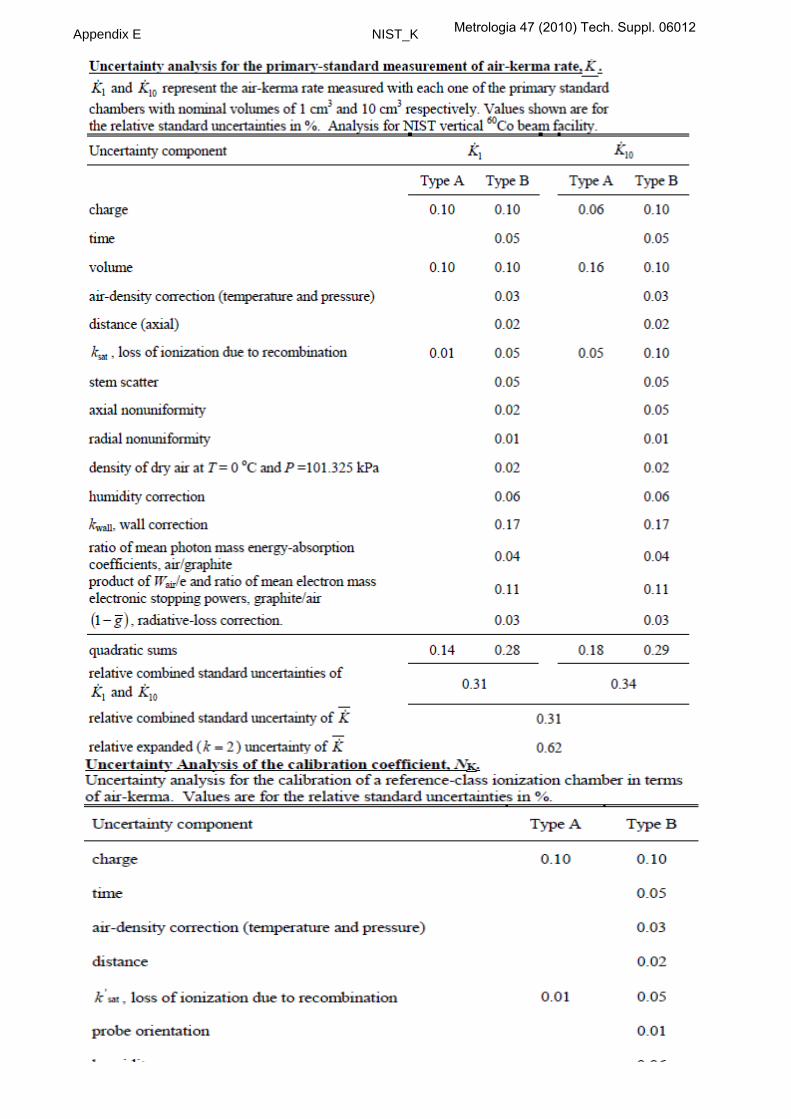
Appendix E NIST_K Metrologia 47 (2010) Tech. Suppl. 06012

Appendix E NIST_K Metrologia 47 (2010) Tech. Suppl. 06012
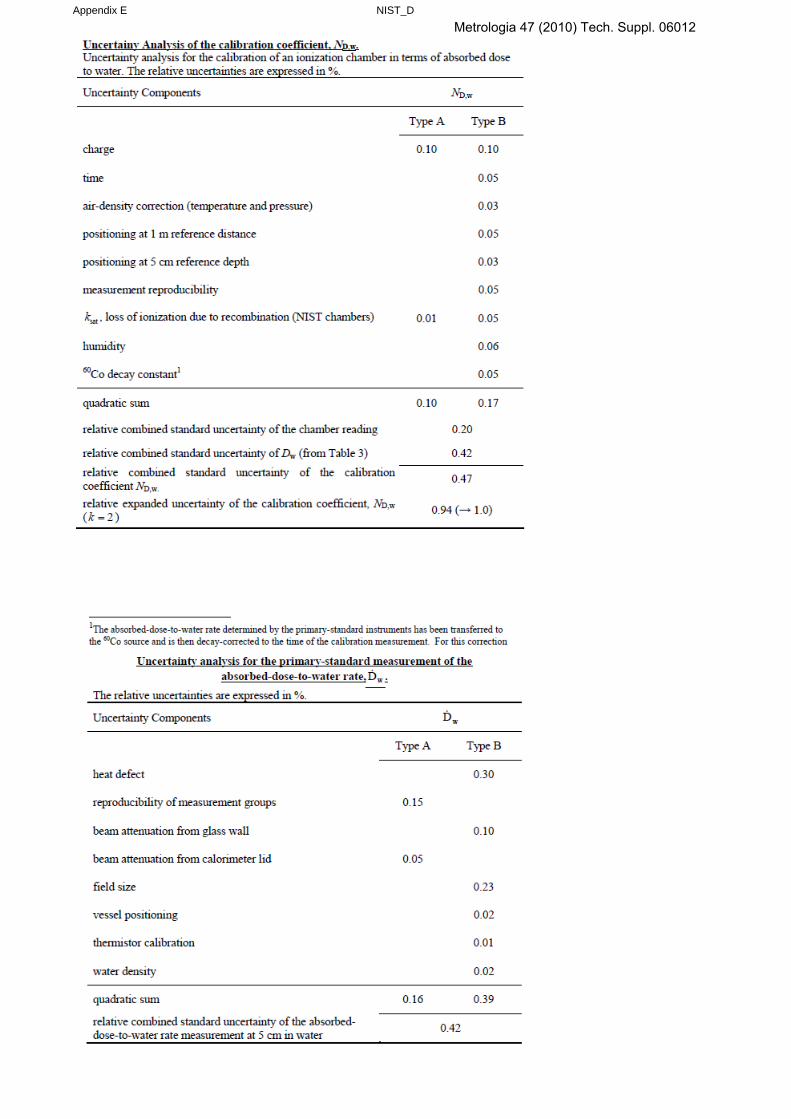
Appendix E NIST_D
Metrologia 47 (2010) Tech. Suppl. 06012

Physical constants and correction factors with their estimated relative uncertainties for the determination of air kerma of 60Co radiation for the NRC 3C Air Kerma Standard
The 3C Air Kerma Standard is a cylindrical graphite ionization chamber.
NRC NRC relative
values uncertainty (1) estimated by statistical methods, type A100 s i 100 u i
Physical Constants estimated by other means, type Bdry air dens 1.2929 - 0.01 (2) at 0o C and 101.325 kPa(μen/ρ)a,c 0.9987 - 0.10 (3) combined uncertainty for the product ( c,a * W/e ) c,a 1.0005 - 0.12(3) (4) combined value for k wall
W/e /(J*C 33.97 - - (5) combined values for k r n k a n
fraction 0.0032 - 0.05 bremsstrahlung
Correction Factorsk s recomb 1.0016 0.03 0.03 Air Kerma Standardk h humidit 0.9970 - 0.05 3Ck a stem sca 0.9960 0.02 - Dimensions (cm)k sc wall sc 1.0220(4)
- 0.03(4)Outer height 3.210
k comp com 1.0046 0.03 0.17 Outer diameter 2.350k a n axial n 1.0004(5) 0.04(5) 0.05(5)
cavity height 1.614k r n radial non-uniformity cavity diameter 1.584
Electrode height 1.200Measurement of I/V ρ Electrode diameter 0.670V volume 2.7552 - 0.09 Sidewall thickness 0.383I ionization current / 0.04 0.06 End cap thickness 0.456
Volume of air cavity (cm 2.7552Relative Standard Uncertainty Graphite density (g/cm 1.66quadratic summation 0.08 0.31 Applied voltage (V) -300combined uncertainty 0.32 Leakage current (fA) 50
(1) s i represents the relative standard uncertainty u(x i )/x i
u i represents the relative standard uncertainty u(x i )/x i
g
ss
Metrologia 47 (2010) Tech. Suppl. 06012

Appendix E NRC_D
Physical constants and correction factors with their estimated relative uncertainties for the determination of absorbed dose to water of 60Co radiation for the NRC Calorimetric Standard
NRC NRC relativeSource of uncertainty values uncertainty (1)
100 s i 100 u i
0.20 -Thermistor calibration - - 0.1Thermistor positioning - - <0.01Specific heat of water / (Jg-1K-1) 4.2048 - 0.15k c heat flow of conduction 0.9986 - <0.01k v heat flow of convection 1.0000 - -k p field perturbation 1.0021 0.05 -k dd lateral dose profile 1.0004 <0.01 <0.01k ρ water density 1.0006 - 0.3Chemical heat defect, h (3 systems) - -Reproducibility of calorimeter response (n-90) - 0.06 -Quadradtic summation 0.21 0.35Combined relative standard uncertainty in DW,NRC 0.41
Metrologia 47 (2010) Tech. Suppl. 06012
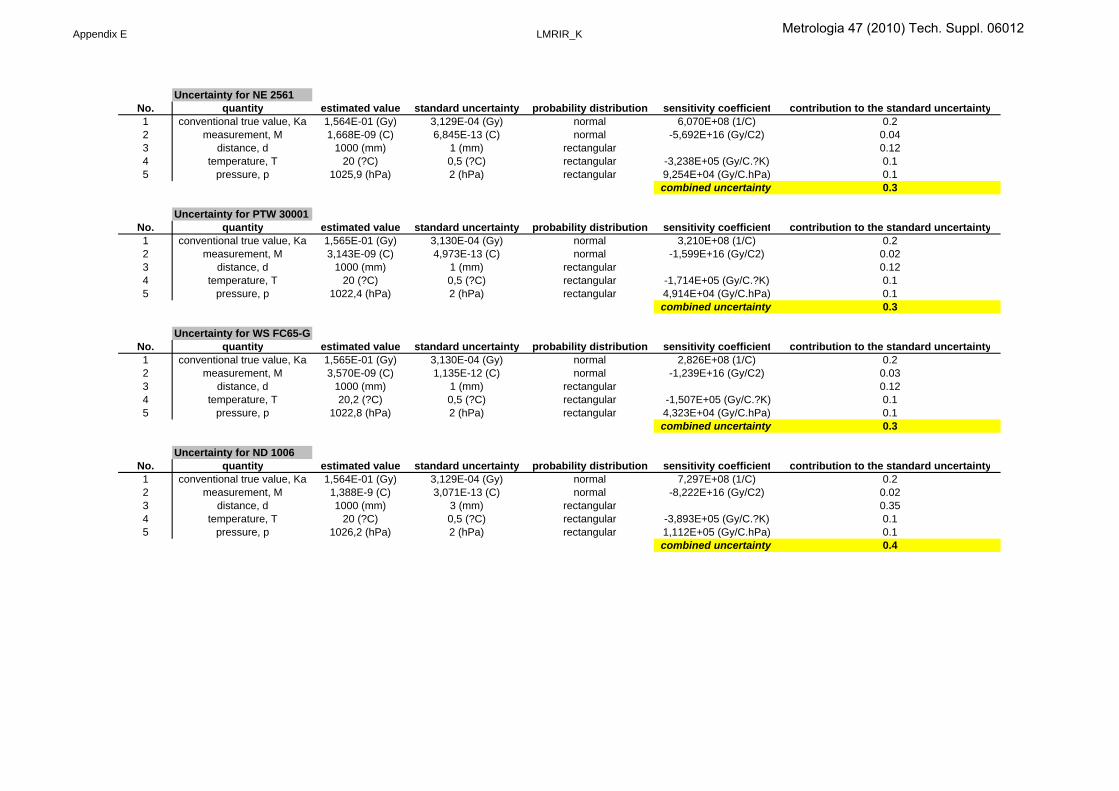
Appendix E LMRIR_K
Uncertainty for NE 2561No. quantity estimated value standard uncertainty probability distribution sensitivity coefficient contribution to the standard uncertainty1 conventional true value, Ka 1,564E-01 (Gy) 3,129E-04 (Gy) normal 6,070E+08 (1/C) 0.22 measurement, M 1,668E-09 (C) 6,845E-13 (C) normal -5,692E+16 (Gy/C2) 0.043 distance, d 1000 (mm) 1 (mm) rectangular 0.124 temperature, T 20 (?C) 0,5 (?C) rectangular -3,238E+05 (Gy/C.?K) 0.15 pressure, p 1025,9 (hPa) 2 (hPa) rectangular 9,254E+04 (Gy/C.hPa) 0.1
combined uncertainty 0.3
Uncertainty for PTW 30001No. quantity estimated value standard uncertainty probability distribution sensitivity coefficient contribution to the standard uncertainty1 conventional true value, Ka 1,565E-01 (Gy) 3,130E-04 (Gy) normal 3,210E+08 (1/C) 0.22 measurement, M 3,143E-09 (C) 4,973E-13 (C) normal -1,599E+16 (Gy/C2) 0.023 distance, d 1000 (mm) 1 (mm) rectangular 0.124 temperature, T 20 (?C) 0,5 (?C) rectangular -1,714E+05 (Gy/C.?K) 0.15 pressure, p 1022,4 (hPa) 2 (hPa) rectangular 4,914E+04 (Gy/C.hPa) 0.1
combined uncertainty 0.3
Uncertainty for WS FC65-GNo. quantity estimated value standard uncertainty probability distribution sensitivity coefficient contribution to the standard uncertainty1 conventional true value, Ka 1,565E-01 (Gy) 3,130E-04 (Gy) normal 2,826E+08 (1/C) 0.22 measurement, M 3,570E-09 (C) 1,135E-12 (C) normal -1,239E+16 (Gy/C2) 0.033 distance, d 1000 (mm) 1 (mm) rectangular 0.124 temperature, T 20,2 (?C) 0,5 (?C) rectangular -1,507E+05 (Gy/C.?K) 0.15 pressure, p 1022,8 (hPa) 2 (hPa) rectangular 4,323E+04 (Gy/C.hPa) 0.1
combined uncertainty 0.3
Uncertainty for ND 1006No. quantity estimated value standard uncertainty probability distribution sensitivity coefficient contribution to the standard uncertainty1 conventional true value, Ka 1,564E-01 (Gy) 3,129E-04 (Gy) normal 7,297E+08 (1/C) 0.22 measurement, M 1,388E-9 (C) 3,071E-13 (C) normal -8,222E+16 (Gy/C2) 0.023 distance, d 1000 (mm) 3 (mm) rectangular 0.354 temperature, T 20 (?C) 0,5 (?C) rectangular -3,893E+05 (Gy/C.?K) 0.15 pressure, p 1026,2 (hPa) 2 (hPa) rectangular 1,112E+05 (Gy/C.hPa) 0.1
combined uncertainty 0.4
Metrologia 47 (2010) Tech. Suppl. 06012

Appendix E LMRIR_D
Uncertainty for PTW 30001No. quantity estimated value standard uncertainty probability distribution sensitivity coefficient contribution to the standard uncertainty1 conventional true value, Dw 1,521E-01 (Gy) 6,084E-04 (Gy) normal 3,526E+08 (1/C) 0.42 measurement, M 2,861E-9 (C) 1,642E-12 (C) normal -1,875E+16 (Gy/C2) 0.13 distance, d 1000 (mm) 1 (mm) rectangular 0.124 temperature, T 20,5 (?C) 0,5 (?C) rectangular -1,826E+05 (Gy/C.?K) 0.15 pressure, p 1023.9 2 (hPa) rectangular 5,238E+04 (Gy/C.hPa) 0.16 depth in water 5 (cm) 0,05 (cm) rectangular 0.17
combined uncertainty 0.5
Uncertainty for WS FC65-GNo. quantity estimated value standard uncertainty probability distribution sensitivity coefficient contribution to the standard uncertainty1 conventional true value, Dw 1,549E-01 (Gy) 6,195E-04 (Gy) normal 3,049E+08 (1/C) 0.42 measurement, M 3,263E-9 (C) 1,572E-12 (C) normal -1,447E+16 (Gy/C2) 0.053 distance, d 1000 (mm) 1 (mm) rectangular 0.124 temperature, T 21,4 (?C) 0,5 (?C) rectangular -1,603E+05 (Gy/C.?K) 0.15 pressure, p 1013 2 (hPa) rectangular 4,662E+04 (Gy/C.hPa) 0.16 depth in water 5 (cm) 0,05 (cm) rectangular 0.17
combined uncertainty 0.5
Uncertainty for NE 2561No. quantity estimated value standard uncertainty probability distribution sensitivity coefficient contribution to the standard uncertainty1 conventional true value, Dw 1,548E-01 (Gy) 6,192E-04 (Gy) normal 8,205E+08 (1/C) 0.42 measurement, M 1,530E-9 (C) 1,045E-12 (C) normal -6,678E+16 (Gy/C2) 0.073 distance, d 1000 (mm) 1 (mm) rectangular 0.124 temperature, T 19,2 (?C) 0,5 (?C) rectangular -3,495E+05 (Gy/C.?K) 0.15 pressure, p 1019.8 2 (hPa) rectangular 1,002E+05 (Gy/C.hPa) 0.16 depth in water 5 (cm) 0,05 (cm) rectangular 0.17
combined uncertainty 0.5
Uncertainty for ND 1006No. quantity estimated value standard uncertainty probability distribution sensitivity coefficient contribution to the standard uncertainty1 conventional true value, Dw 1,548E-01 (Gy) 6,192E-04 (Gy) normal 7,828E+08 (1/C) 0.42 measurement, M 1,285E-9 (C) 5,634E-13 (C) normal -9,430E+16 (Gy/C2) 0.043 distance, d 1000 (mm) 2 (mm) rectangular 0.234 temperature, T 20,1 (?C) 0,5 (?C) rectangular -4,132E+05(Gy/C.?K) 0.15 pressure, p 1019.6 2 (hPa) rectangular 1,189E+05 (Gy/C.hPa) 0.16 depth in water 5 (cm) 0,1 (cm) rectangular 0.3
combined uncertainty 0.6
Metrologia 47 (2010) Tech. Suppl. 06012

Appendix E VNIIM_K
Characteristics, physical constants, correction factors and uncertainties of the VNIIM primary standard cavity chamber C1 in the field of Co-60 gamma radiation
u A , u B , Dimensions, mm% % Outer diameter 19.0
Outer height 19.0ρ density of dry air, kg/m3 1.2930 - 0.01 Inner diameter 11.07
(μ en/ρ )a,c 0.9985 - 0.05 Inner height 11.06sc,a 1.0010 - Electrode diameter 1.98
W/e J/C 33.97 - Electrode height 7.95g fraction of energy lost by
bremsstrahlung0.0032 - 0.02 Wall thickness 4.0
Volume of air cavity, cm 3 1.040
ks recombination losses 1.0021 0.03 0.03 Wall and electrode material ultra pure graphitekh humidity 0.9970 - 0.03 Graphite density, g/cm3 1.634kst stem scattering 0.9994 0.02 0.02 Isolator material polyethylenekwall wall effects 1.0189 0.01 0.07 Polarizing voltage, V ±250 kan axial non-uniformity 1.0004 0.04 0.08 Leakage current, fA 5krn radial non-uniformity 1.0004 0.02 0.05
V chamber volume, cm3 1.040 - 0.12I ionization current - 0.03 0.03R distance - - 0.02
- 0.07 0.22
Physical constants
0.11
Correction factors
Relative standard uncertaintyquadratic summationcombined uncertainty 0.23
ValueStandard chamber C1Cobalt-60 Standard chamber C1
Metrologia 47 (2010) Tech. Suppl. 06012

Appendix E ARPANSA_K
U4. Co-60 air kerma chamber calibrationBy Duncan Butler Calculation of the uncertainty in the calibration factor of an ionization chamber (eg NE2571) calibratedDate 2007.06.28 using the air kerma rate measured by the graphite cavity chamber in a Co-60 therapy beam
NK = calibration coefficient for air kerma at Co-60Model : NK = Kdot . kt / Iref Kdot = air kerma rate as determined by primary standard graphite cavity chamber (CCC)
Iref = current from ionization chamber under test
No Uncertainty component How assessed Reference Standard DOF [ciui]^2 [ciui]^4/DOFu(%)
[1] Primary standard chamber uncertainty Calculated by Rob Huntley Tab A1.2 of ARL/TR126 0.49 413 0.2401 1.40E-04[2] Revised wall correction See spreadsheet U11 Note [2][3] Saturation correction - standard chamber Calculated by Rob Huntley Tab A3.1 of ARL/TR126 0.03 200 0.0009 4.05E-09[4] Radial non-uniformity - standard chamber Calculated by Rob Huntley Tab A3.1 of ARL/TR126 0.05 200 0.0025 3.13E-08[5] Current from standard chamber Calculated for ARPANSA Current Integrator U3 0.07 132 0.0049 1.82E-07[6] TPH correction - standard chamber Calculated for correction to dry air, standard TP U1 0.04 182 0.0016 1.41E-08[7] Current from chamber under test Calculated for ARPANSA Current Integrator U3 0.07 132 0.0049 1.82E-07[8] Correction for background leakage current Measurement of BLB current See Note [8] 0.01 200 0.0001 5.00E-11[9] Correction to reference conditions - chamber uCalculated for standard TP, no H correction U2 0.05 280 0.0025 2.23E-08[10] Radial non-uniformity - chamber under test Calculated by Rob Huntley Tab A3.1 of ARL/TR126 0.05 200 0.0025 3.13E-08[11] Position error relative to standard chamber Based on 0.5 mm at 1 m and inverse square law Note [11] 0.10 200 0.01 5.00E-07[12] Decay correction - half life Uncertainty in half-life and 5 year interval Note [12], U16 0.02 200 0.0004 8.00E-10[13] Decay correction - date Uncertainty in date of measurement 0.5 days Note [13], U16 0.02 200 0.0004 8.00E-10[14] Repeatability From QA data on ARPANSA chambers - Type A FORM-2100F, U18 0.06 40 0.0036 3.24E-07
Sum = 0.2744 0.0001409Combined u = 0.52 %
DOF = 534Conditions for which uncertainty is valid: Normal ambient conditions. Air kerma rates 1 - 10 mGy/s k = 1.96
U (95%)= 1.03 %Notes: [1] The uncertainty in the air kerma determined by the chamber has been calculated by Rob Huntley in ARL/TR126[2] This item is now included in spreadsheet U11[3] This has been calculated as in [1] but appears in a different table (Table A3.1)[4] "[5] See calculation in spreadsheet U3[6] See calculation in spreadsheet U1[7] See calculation in spreadsheet U3[8] ARPANSA current integrator can measure backgrounds of order 10 fA with accuracy of about 5 fA. The resulting uncertainty in a current measurement of
50 pA is 0.01%[9] See calculation in U2[10] From same reference as [3] (given here for NE2571 chamber)[11] Assuming a standard uncertainty of 0.5 mm in 1000 mm SDD, the uncertainty can be found from the inverse square law to be 2*(0.5/1000) = 0.001, or 0.1%[12]- The air kerma rate is determined on a reference date and a decay correction used to work out the rate on the day of the chamber calibration.[13] Co-60 half-life from ISO 3047-1 Table 12: 1925.5 days (no uncertainty given) and IAEA TECDOC 619 value 1925.5 days (standard uncertainty 0.5 days).
The uncertainty arising from the decay correction is given in MR-IRC-SUP-1110A v2 Appendix I.See analysis U16, 0.02% from half-life uncertainty (assuming 5 years correction) and 0.02% from an uncertainty in the date of measurementof half a day.
[14] From QA history of NE2571 chambers (see spreadsheet U18) the stdev of about 20 calibrations of two chambers was 0.06%.Essentially, this component takes into account any random uncertainties not already considered (eg effect of connector box, cables, electronic noise,possible contamination in connectors).
U11. Graphite cavity chamber Co-60 air kerma determinationBy Duncan Butler Calculation of the uncertainty in the air kerma rate in the ARPANSA Co beamDate 2007.06.26 as determined by the graphite cavity chamber
Based on calculation in ARL/TR126Model : K = Iref * correction factors Iref = current from ionization chamber under test
Metrologia 47 (2010) Tech. Suppl. 06012
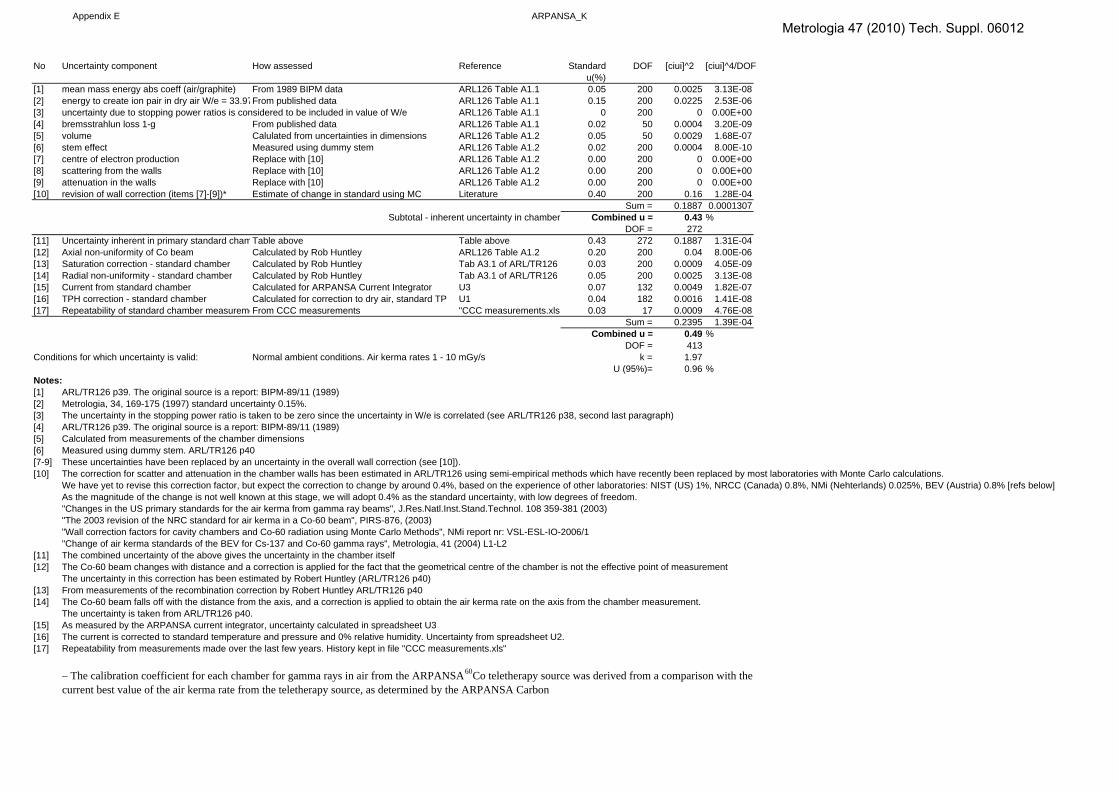
Appendix E ARPANSA_K
No Uncertainty component How assessed Reference Standard DOF [ciui]^2 [ciui]^4/DOFu(%)
[1] mean mass energy abs coeff (air/graphite) From 1989 BIPM data ARL126 Table A1.1 0.05 200 0.0025 3.13E-08[2] energy to create ion pair in dry air W/e = 33.97From published data ARL126 Table A1.1 0.15 200 0.0225 2.53E-06[3] uncertainty due to stopping power ratios is considered to be included in value of W/e ARL126 Table A1.1 0 200 0 0.00E+00[4] bremsstrahlun loss 1-g From published data ARL126 Table A1.1 0.02 50 0.0004 3.20E-09[5] volume Calulated from uncertainties in dimensions ARL126 Table A1.2 0.05 50 0.0029 1.68E-07[6] stem effect Measured using dummy stem ARL126 Table A1.2 0.02 200 0.0004 8.00E-10[7] centre of electron production Replace with [10] ARL126 Table A1.2 0.00 200 0 0.00E+00[8] scattering from the walls Replace with [10] ARL126 Table A1.2 0.00 200 0 0.00E+00[9] attenuation in the walls Replace with [10] ARL126 Table A1.2 0.00 200 0 0.00E+00[10] revision of wall correction (items [7]-[9])* Estimate of change in standard using MC Literature 0.40 200 0.16 1.28E-04
Sum = 0.1887 0.0001307Subtotal - inherent uncertainty in chamber Combined u = 0.43 %
DOF = 272[11] Uncertainty inherent in primary standard chamTable above Table above 0.43 272 0.1887 1.31E-04[12] Axial non-uniformity of Co beam Calculated by Rob Huntley ARL126 Table A1.2 0.20 200 0.04 8.00E-06[13] Saturation correction - standard chamber Calculated by Rob Huntley Tab A3.1 of ARL/TR126 0.03 200 0.0009 4.05E-09[14] Radial non-uniformity - standard chamber Calculated by Rob Huntley Tab A3.1 of ARL/TR126 0.05 200 0.0025 3.13E-08[15] Current from standard chamber Calculated for ARPANSA Current Integrator U3 0.07 132 0.0049 1.82E-07[16] TPH correction - standard chamber Calculated for correction to dry air, standard TP U1 0.04 182 0.0016 1.41E-08[17] Repeatability of standard chamber measuremeFrom CCC measurements "CCC measurements.xls" 0.03 17 0.0009 4.76E-08
Sum = 0.2395 1.39E-04Combined u = 0.49 %
DOF = 413Conditions for which uncertainty is valid: Normal ambient conditions. Air kerma rates 1 - 10 mGy/s k = 1.97
U (95%)= 0.96 %Notes: [1] ARL/TR126 p39. The original source is a report: BIPM-89/11 (1989)[2] Metrologia, 34, 169-175 (1997) standard uncertainty 0.15%.[3] The uncertainty in the stopping power ratio is taken to be zero since the uncertainty in W/e is correlated (see ARL/TR126 p38, second last paragraph)[4] ARL/TR126 p39. The original source is a report: BIPM-89/11 (1989)[5] Calculated from measurements of the chamber dimensions[6] Measured using dummy stem. ARL/TR126 p40[7-9] These uncertainties have been replaced by an uncertainty in the overall wall correction (see [10]).[10] The correction for scatter and attenuation in the chamber walls has been estimated in ARL/TR126 using semi-empirical methods which have recently been replaced by most laboratories with Monte Carlo calculations.
We have yet to revise this correction factor, but expect the correction to change by around 0.4%, based on the experience of other laboratories: NIST (US) 1%, NRCC (Canada) 0.8%, NMi (Nehterlands) 0.025%, BEV (Austria) 0.8% [refs below]As the magnitude of the change is not well known at this stage, we will adopt 0.4% as the standard uncertainty, with low degrees of freedom."Changes in the US primary standards for the air kerma from gamma ray beams", J.Res.Natl.Inst.Stand.Technol. 108 359-381 (2003)"The 2003 revision of the NRC standard for air kerma in a Co-60 beam", PIRS-876, (2003)"Wall correction factors for cavity chambers and Co-60 radiation using Monte Carlo Methods", NMi report nr: VSL-ESL-IO-2006/1"Change of air kerma standards of the BEV for Cs-137 and Co-60 gamma rays", Metrologia, 41 (2004) L1-L2
[11] The combined uncertainty of the above gives the uncertainty in the chamber itself[12] The Co-60 beam changes with distance and a correction is applied for the fact that the geometrical centre of the chamber is not the effective point of measurement
The uncertainty in this correction has been estimated by Robert Huntley (ARL/TR126 p40)[13] From measurements of the recombination correction by Robert Huntley ARL/TR126 p40[14] The Co-60 beam falls off with the distance from the axis, and a correction is applied to obtain the air kerma rate on the axis from the chamber measurement.
The uncertainty is taken from ARL/TR126 p40.[15] As measured by the ARPANSA current integrator, uncertainty calculated in spreadsheet U3[16] The current is corrected to standard temperature and pressure and 0% relative humidity. Uncertainty from spreadsheet U2.[17] Repeatability from measurements made over the last few years. History kept in file "CCC measurements.xls"
– The calibration coefficient for each chamber for gamma rays in air from the ARPANSA 60Co teletherapy source was derived from a comparison with the current best value of the air kerma rate from the teletherapy source, as determined by the ARPANSA Carbon
Metrologia 47 (2010) Tech. Suppl. 06012

Appendix E ARPANSA_D
U5. Co-60 absorbed dose to water chamber calibrationBy Duncan Butler Calculation of the uncertainty in the calibration factor of an ionization chamber (eg NE2571) calibrated in waterDate 2007.06.27 using the absorbed dose rate measured by the graphite calorimeter in a Co-60 therapy beam
ND,w = calibration coefficient for absorbed dose to water at Co-60Model : ND,w = Dw,dot . kt / Iref Dw,dot = absorbed dose to water as determined by primary standard CCC
Iref = current from ionization chamber under test
No Uncertainty component How assessed Reference Standard DOF [ciui]^2 [ciui]^4/DOFu(%)
[1] Calorimeter uncertainty - abs dose to graphite Calculated by Rob Huntley U12 0.24 22 0.0576 1.51E-04[2] Dose ratio conversion to abs dose to water Calculated by Rob Huntley Tab A2.3 of ARL/TR126 0.098 200 0.009604 4.61E-07[3] Correction for front wall of tank Uncertainty in thickness of 0.05 mm in 1.85 mm Note [3] 0.02 200 0.0004 8.00E-10[4] Density of water correction for tempertature In range 17 - 23 degrees, 0.012% Note [4] 0.01 200 0.000144 1.04E-10[5] Waterproofing sheath No correction Note [5] 0 200 0 0.00E+00[6] Current from chamber under test See Spreadsheet U3 U3 0.07 132 0.0049 1.82E-07[7] Correction for background leakage current Measurement of BLB current Note [7] 0.01 200 0.0001 5.00E-11[8] Correction to reference conditions - chamber uCalculated for standard TP, no H correction U2 0.05 280 0.0025 2.23E-08[9] Radial non-uniformity - chamber under test Calculated by Rob Huntley Tab A3.1 of ARL/TR126 0.05 200 0.0025 3.13E-08[10] Position error relative to calorimeter Estimated from geometry Note [10] 0.20 200 0.04 8.00E-06[11] Depth in water Estimated from depth dose gradient Note [11] 0.11 200 0.0121 7.32E-07[12] Decay correction Uncertainty in half-life and 5 year interval U16 0.02 200 0.0004 8.00E-10[13] Decay correction Uncertainty in date of measurement 0.5 days U16 0.02 200 0.0004 8.00E-10[14] Repeatability From QA data on ARPANSA chambers - Type A FORM-2100F, U17 0.17 40 0.0289 2.09E-05
Sum = 0.159548 0.0001811Combined u = 0.40 %
DOF = 141Conditions for which uncertainty is valid: Depth in water = 50 mm, SSD = 1000 mm k = 1.98
17-23 degrees, humidity 20-80%, pressure 97-103 kPa U (95%)= 0.79 %Notes: [1] The uncertainty in the chamber itself has been calculated by Rob Huntley in ARL/TR126 (Table A2.1) and redone in U12[2] As above, in Table A2.3[3] The correction for the non-water equivalence of the thin front wall of the tank (1.85 mm of Perspex) is 0.9988. The uncertainty in this figure is
of order 0.02% (ARL/TR126 Table A3.3)[4] The density of water changes with temperature, but the chamber is always placed with its centre at a depth of 50 mm from the surface of the tank. The resulting
uncertainty is about 0.012% over the temperature range 17 - 23 degrees.[5] Waterproofing sheath (if present) included as part of the chamber - so no uncertainty due to added thickness of sheath[6] See calculation in spreadsheet "U3. ARPANSA Current Integrator Raw Measurement Uncertainty Calculation"[7] ARPANSA current integrator can measure backgrounds of order 10 fA with accuracy of about 5 fA. The resulting uncertainty in a current measurement of
50 pA is 0.01%[8] See calculation in U2[9] Same as [2][10] Assuming a standard uncertainty of 1 mm in 1000 mm SDD, the uncertainty can be found from the inverse square law to be 2*(1/1000) = 0.002, or 0.2%
This is an estimate, including positioning of chamber under test, depth of graphite core in calorimeter, and positioning of calorimeter. Uncertainty due to thephoton fluence scaling theorem is included at item [2].
[11] Assuming uncertainty in 50 mm depth of 0.2 mm and depth dose gradient of -0.55% per mm at 50 mm (See Table A4.2 of ARL/TR126, where the gradientis [(75.8% - 80.4%) / 10 ] / 80.4% x 100 = -0.548%/mm) gives 0.2 x .55% = 0.11%
[12] - The absorbed dose to water rate is determined on a reference date and a decay correction used to work out the rate on the day of the chamber calibration.[13] Co-60 half-life from ISO 3047-1 Table 12: 1925.5 days (no uncertainty given) and IAEA TECDOC 619 value 1925.5 days (standard uncertainty 0.5 days).
The uncertainty arising from the decay correction is given in MR-IRC-SUP-1110A v2 Appendix I.See analysis U16: 0.02% from half-life uncertainty (assuming 5 years correction) and 0.02% from an uncertainty in the date of measurement of half a day
[14] From QA history of NE2571 chambers (see U17) the stdev of about 20 calibrations of two chambers was 0.17%.Essentially, this component takes into account any random uncertainties not already considered (eg effect of connector box, cables, electronic noise,possible contamination in connectors).
Metrologia 47 (2010) Tech. Suppl. 06012

Appendix E ARPANSA_D
U12. Graphite calorimeter Co-60 absorbed dose to graphite determinationBy Duncan Butler Calculation of the uncertainty in the absorbed dose to water rate in the ARPANSA Co beamDate 2007.06.28 as determined by the graphite calorimeter
Based on calculation in ARL/TR126Model : Dc = (P/m) * correction factorsDw = Dc * scaling theorem corrections (see U5)
No Uncertainty component How assessed Reference Standard DOF [ciui]^2 [ciui]^4/DOFu(%)
[1] Vacuum gaps correction ARL/TR126 Table A2.1 Note [1] 0.024 200 0.000576 1.66E-09[2] Correction to graphite reference depth Calculated from measured data Note [2] 0.05 200 0.0025 3.13E-08[3] Correction to reference distance Estimated from inverse square law Note [3] 0.06 200 0.0036 6.48E-08[4] Radial non-uniformity of Co beam ARL/TR126 Table A2.1 Note [4] 0.05 200 0.0025 3.13E-08[5] Axial non-uniformty of Co beam ARL/TR126 Table A2.1 Note [5] 0.05 200 0.0025 3.13E-08[6] Core mass ARL/TR126 Table A2.1 Note [6] 0.001 200 0.000001 5.00E-15[7] Repeatability of dose measurements From history of calorimeter runs Note [7] 0.20 10 0.04 1.60E-04[8] core heater voltage before exposure Model of isothermal mode measurements ARL/126 p41-43 0.02 200 0.000225 2.53E-10[9] (core + Ri) voltage before exposure Model of isothermal mode measurements ARL/126 p41-43 0.02 200 0.0004884 1.19E-09[10] current sense resistance Model of isothermal mode measurements ARL/126 p41-43 0.001 200 0.000001 5.00E-15[11] leads resistance Model of isothermal mode measurements ARL/126 p41-43 0.001 200 1.323E-06 8.75E-15[12] electrical heating off time Model of isothermal mode measurements ARL/126 p41-43 0.00 200 0.000004 8.00E-14[13] drift correction (chart recorder) Model of isothermal mode measurements ARL/126 p41-43 0.08 200 0.0064 2.05E-07[14] chart recorder calibration Model of isothermal mode measurements ARL/126 p41-43 0.001 200 5.776E-07 1.67E-15[15] electrical calibration Model of isothermal mode measurements ARL/126 p41-43 0.001 200 5.041E-07 1.27E-15[16] radiation heating on time Model of isothermal mode measurements ARL/126 p41-43 0.003 200 0.000009 4.05E-13
Sum = 0.0588068 0.0001604Combined u = 0.24 %
DOF = 22Conditions for which uncertainty is valid: Normal ambient conditions. Air kerma rates 1 - 10 mGy/s k = 2.08
U (95%)= 0.50 %Notes: [1] Vaccum gaps are 2.33 +- 0.07 mm. Correction determined by Monte Carlo calculation. Uncertainty from these calculations. (ARPANSA Technical Report 132 pA-5)
For 3.5 cm radius beam correction is 1.00744 with standard uncertainty 0.024%[2] The core depth is 29.92 mm. The scaling theorem requires the dose at the reference depth of 30.98 mm. A correction of 0.9943 is used (from measured
data reported in ARL/126 p43) with an uncertainty of 0.05%.[3] The position of the calorimeter has an uncertainty of about 0.2 mm in 650 mm. The ISL gives an uncertainty of 2*(0.2/650) = 0.06%[4] The calorimeter measures the absorbed dose over the whole of the core. A correction of 1.0026 is applied to take into account that the beam is not uniform over this
region. The correction gives the dose on the axis from the dose averaged over the core. An uncertainty of 0.05% is estimated.[5] As for [4], except that in this case it is the non-linearity in the fall off of the radiation along the beam axis that is corrected. Since the fall off is non-linear, the
dose at the centre of the core is not exactly equal to the average dose. A correction of 1.0005 is applied, with uncertainty 0.05%.[6] From the manufacturers, an uncertainty of 0.01 mg in 1562.2 mg[7] For example, ESDM of last 11 measurements with ARPANSA calorimeter was 0.2% (see RES00119)[8-16] These items calculated for a model of an isothermal measurement in ARL/TR126 p41-43.
– The calibration coefficient for each chamber, in terms of absorbed dose to water from gamma rays from the ARPANSA 60Co teletherapy source, was derived from a comparison with the current best value of the absorbed dose to water rate at the reference poin
– Each ionization chamber, without buildup cap, was placed in a water phantom of dimensions 30 cm x 30 cm x 30 cm. The radiation beam entered the phantom horizontally through a side window of thickness 2 mm. The centre of the chamber was placed 50 mm behi
Metrologia 47 (2010) Tech. Suppl. 06012
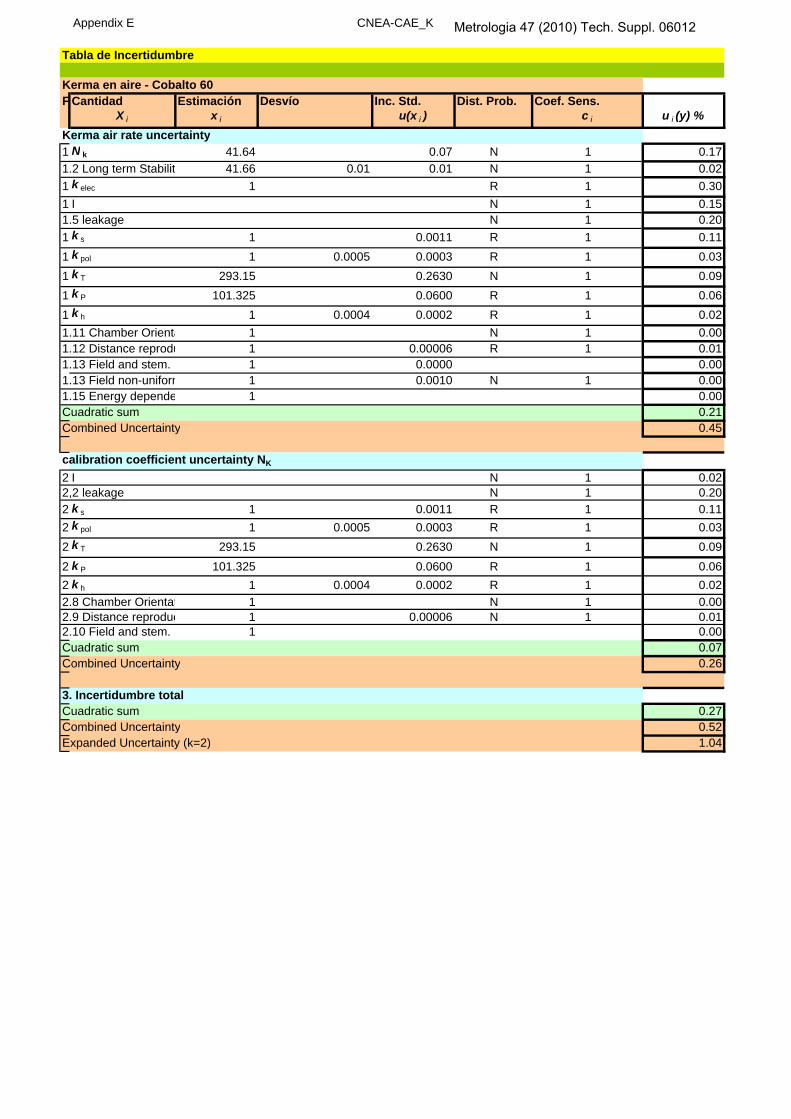
Appendix E CNEA-CAE_K
Tabla de Incertidumbre
Kerma en aire - Cobalto 60F Cantidad Estimación Desvío Inc. Std. Dist. Prob. Coef. Sens.
X i x i u(x i ) c i u i (y) %Kerma air rate uncertainty 1 N k 41.64 0.07 N 1 0.171.2 Long term Stabilit 41.66 0.01 0.01 N 1 0.021 k elec 1 R 1 0.301 I N 1 0.151.5 leakage N 1 0.201 k s 1 0.0011 R 1 0.111 k pol 1 0.0005 0.0003 R 1 0.031 k T 293.15 0.2630 N 1 0.091 k P 101.325 0.0600 R 1 0.061 k h 1 0.0004 0.0002 R 1 0.021.11 Chamber Orienta 1 N 1 0.001.12 Distance reprodu 1 0.00006 R 1 0.011.13 Field and stem. 1 0.0000 0.001.13 Field non-uniform 1 0.0010 N 1 0.001.15 Energy depende 1 0.00Cuadratic sum 0.21Combined Uncertainty 0.45
calibration coefficient uncertainty NK
2 I N 1 0.022,2 leakage N 1 0.202 k s 1 0.0011 R 1 0.112 k pol 1 0.0005 0.0003 R 1 0.032 k T 293.15 0.2630 N 1 0.092 k P 101.325 0.0600 R 1 0.062 k h 1 0.0004 0.0002 R 1 0.022.8 Chamber Orientat 1 N 1 0.002.9 Distance reproduc 1 0.00006 N 1 0.012.10 Field and stem. 1 0.00Cuadratic sum 0.07Combined Uncertainty 0.26
3. Incertidumbre totalCuadratic sum 0.27Combined Uncertainty 0.52Expanded Uncertainty (k=2) 1.04
Metrologia 47 (2010) Tech. Suppl. 06012

Appendix E CNEA-CEA_D
Tabla de Incertidumbre
Dosis absorbida en agua en Cobalto 60FuCantidad Estimación Desvío Inc. Std. Dist. Prob. Coef. Sens.
X i x i u(x i ) c i u i (y) %Absorbed dose rate to water uncertainty1,N D,W 45.72 0.14 N 1 0.311.2 Long term Stabilit 45.81 0.06 0.045 N 1 0.101.k elec 1 R 1 0.301. I N 1 0.041.5 leakage N 1 0.201.k s 1 0.0011 R 1 0.111.k pol 1 0.0005 0.0003 R 1 0.031.k T 293.15 0.2630 N 1 0.091.k P 101.325 0.0600 R 1 0.061.k h 1 0.0004 0.0002 R 1 0.021.11 Chamber Orienta 1 N 1 0.001.12 Deph in water 1 0.004 N 1 0.401.13 Field non-uniform 1 0.0000 0.001.14 Field and stem 1 0.0010 N 1 0.101.15 Energy depende 1 0.00Cuadratic sum 0.43Combined Uncertainty 0.66
calibration coefficient uncertainty ND,w
2, I N 1 0.072,2 leakage N 1 0.202.k s 1 0.0011 R 1 0.112.k pol 1 0.0005 0.0003 R 1 0.032.k T 293.15 0.2630 N 1 0.092.k P 101.325 0.0600 R 1 0.062.k h 1 0.0004 0.0002 R 1 0.022.8 Chamber Orientat 1 N 1 0.002.9 Distance and Dep 1 0.004 N 1 0.402.10 Field and stem. 1 0.00Cuadratic sum 0.23Combined Uncertainty 0.48
3.total uncertaintyCuadratic sum 0.66Combined Uncertainty 0.81Expanded Uncertainty (k=2) 1.63
Metrologia 47 (2010) Tech. Suppl. 06012