
Comparison of Dimensional Repeatability and Accuracy for ...
Journal of Earth Science and Engineering 7 (2017) 230-241 doi: 10.17265/2159-581X/2017.04.04
Comparison of Accuracy of Two Global DEMs, and the Extracted DEM from the Topographic Map of the Tafilah
Governorate
Yusra Al-husban Department of Geography, Faculty of Arts, the University of Jordan, Amman, Jordan Abstract: SRTM DEM (shuttle radar topographic mission digital elevation model) and ASTEMR DEM (advanced space-borne thermal emission and reflection radiometer digital elevation model) are now freely available in two resolutions: 90 m and 30 m. DEM is a computerized representation of the Earth’s relief, and is used in many applications such as hydrology, climatology, geomorphology and ecology. There are some important differences in assessing the accuracy of digital elevation models for specific applications. The purpose of this study is to investigate the errors in digital elevation models obtained globally from DEMs 90 m, 30 m ground resolution, and the extracted DEM from a topographic map by digitized contour lines of 1:50,000 scale in a rugged mountainous region and a heterogeneous landscape, using KS (kernel smoothing) interpolation method. For validation purposes, datasets of 250-GCPs (ground control points) distributed over the study area were used to evaluate and compare the accuracy of the two global Dems and the DEM extracted from TM. The main results showed that the 30 m resolution global (DEM) is the most accurate one among the three. According to the validation results, SRTM with maximum (+) and minimum (-) error elevation is -10_9. M, with mean deviation of KS is -0.00238667, and RMS (root-mean-square) error of 0.98, and currently the most accurate model is 30 m DEM of the study area with no significant differences compared with DEM 90 m. Key words: DEM, accuracy assessment, GPS (global position system), GCP, topographic map, KS.
1. Introduction
DEM (digital elevation model) is a digital file consisting of terrain elevations for ground positions at regularly spaced horizontal intervals [1]. DEM data are an essential tool for many applications such as hydrology, climatology, geomorphology and ecology [2-6]. DEMs can be generated using different methodologies that depend on acquisition procedures and techniques, such as satellite-based techniques, field surveying and topographic maps [7-9]. Two global DEMs with horizontal resolutions of 90 m and 30 m were freely downloaded for the study area along with the TM (topographic map) to achieve the study goal. TM is a type of map characterized by large-scale
Corresponding author: Yusra Al-husban, associated
professor, research fields: physical geography, GIS & RS applications.
details and quantitative representation of relief, usually using contour lines [10]. It is basic to many earth surface processes and finding applications in geomorphology, hydrology and climatology [11]. In this study two global DEMs, and eight TM plates at scale 1:50,000 covered the study area. They were generated by the RJGC (Royal Jordanian Geographic Centre) and scanned individually at 300 DPI (jpg) format. The aim of this study is the comparison of absolute surface heights accuracies of DEMs from global resource data and the DEMs were extracted from TMs, interpolated and validated to determine the best suitable model in the heterogeneous landscape of the Tafilah governorate.
2. Study Area
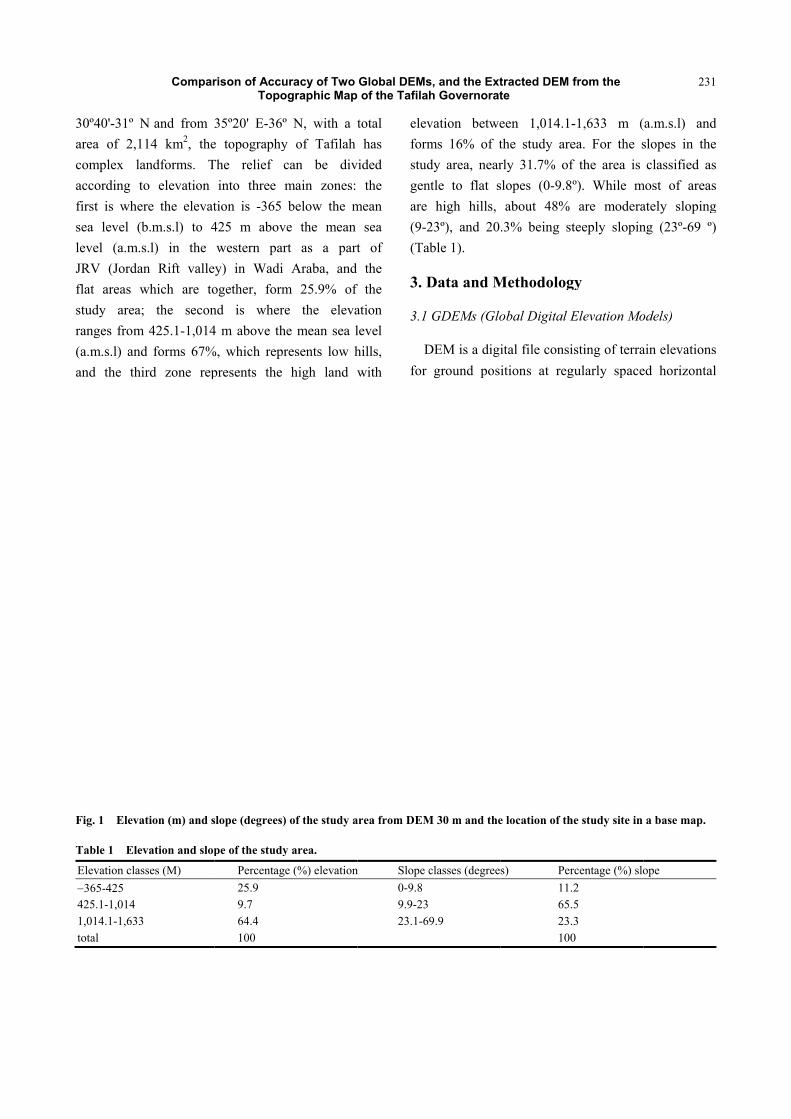
The Tafilah Governorate is located in the south-west part of Jordan (Fig. 1). It extends from
D DAVID PUBLISHING
30º40'-31º Narea of 2,1complex laaccording tfirst is whesea level (blevel (a.m.sJRV (Jordaflat areas wstudy area;ranges from(a.m.s.l) andand the thi
Fig. 1 Eleva
Table 1 Elev
Elevation clas−365-425 425.1-1,014 1,014.1-1,633total
Compar
N and from 14 km2, the
andforms. To elevation re the elevatb.m.s.l) to 4s.l) in the
an Rift vallewhich are to; the secon
m 425.1-1,014d forms 67%ird zone rep
ation (m) and s
vation and slop
sses (M)
3
rison of AccuTopo
35º20' E-36ºe topographyThe relief c
into three mtion is -365 425 m abovwestern pary) in Wadi
ogether, formnd is where4 m above th
%, which reprpresents the
slope (degrees)
pe of the study
Percentage25.9 9.7 64.4 100
uracy of Two ographic Map
º N, with a ty of Tafilah can be divmain zones: below the me the mean rt as a part
Araba, and m 25.9% of e the elevae mean sea lresents low h
high land w
of the study a
y area.
e (%) elevation
Global DEMs of the Tafila
total has
vided the
mean sea
t of the
f the ation level hills, with
elevformstudgenare (9-2(Ta
3. D
3.1
Dfor
area from DEM
n Slope c0-9.89.9-2323.1-6
s, and the Exth Governorat
vation betwems 16% of tdy area, nearntle to flat s
high hills, 23º), and 20able 1).
Data and M
GDEMs (Glo
DEM is a digiground pos
M 30 m and the
classes (degree
9.9
tracted DEM te
een 1,014.1-the study arerly 31.7% ofslopes (0-9.8
about 48% .3% being st
Methodolog
obal Digital E
ital file consiitions at reg
e location of th
s) Per11.65.23.100
from the
-1,633 m (ea. For the sf the area is º). While mare modera
teeply slopin
gy
Elevation Mo
isting of terragularly space
he study site in
rcentage (%) slo.2 .5 .3 0
231
(a.m.s.l) andslopes in theclassified as
most of areasately slopingng (23º-69 º)
odels)
ain elevationsed horizontal
a base map.
ope
d e s s g )
s l
Comparison of Accuracy of Two Global DEMs, and the Extracted DEM from the Topographic Map of the Tafilah Governorate
232
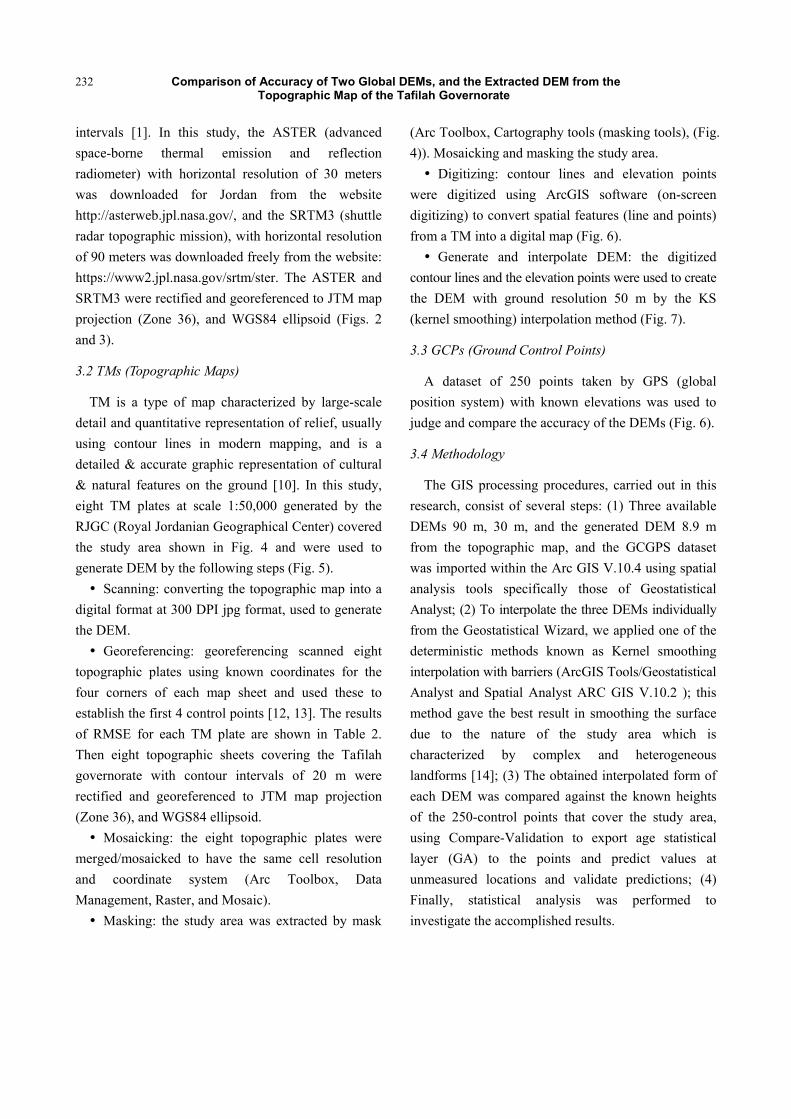
intervals [1]. In this study, the ASTER (advanced space-borne thermal emission and reflection radiometer) with horizontal resolution of 30 meters was downloaded for Jordan from the website http://asterweb.jpl.nasa.gov/, and the SRTM3 (shuttle radar topographic mission), with horizontal resolution of 90 meters was downloaded freely from the website: https://www2.jpl.nasa.gov/srtm/ster. The ASTER and SRTM3 were rectified and georeferenced to JTM map projection (Zone 36), and WGS84 ellipsoid (Figs. 2 and 3).
3.2 TMs (Topographic Maps)
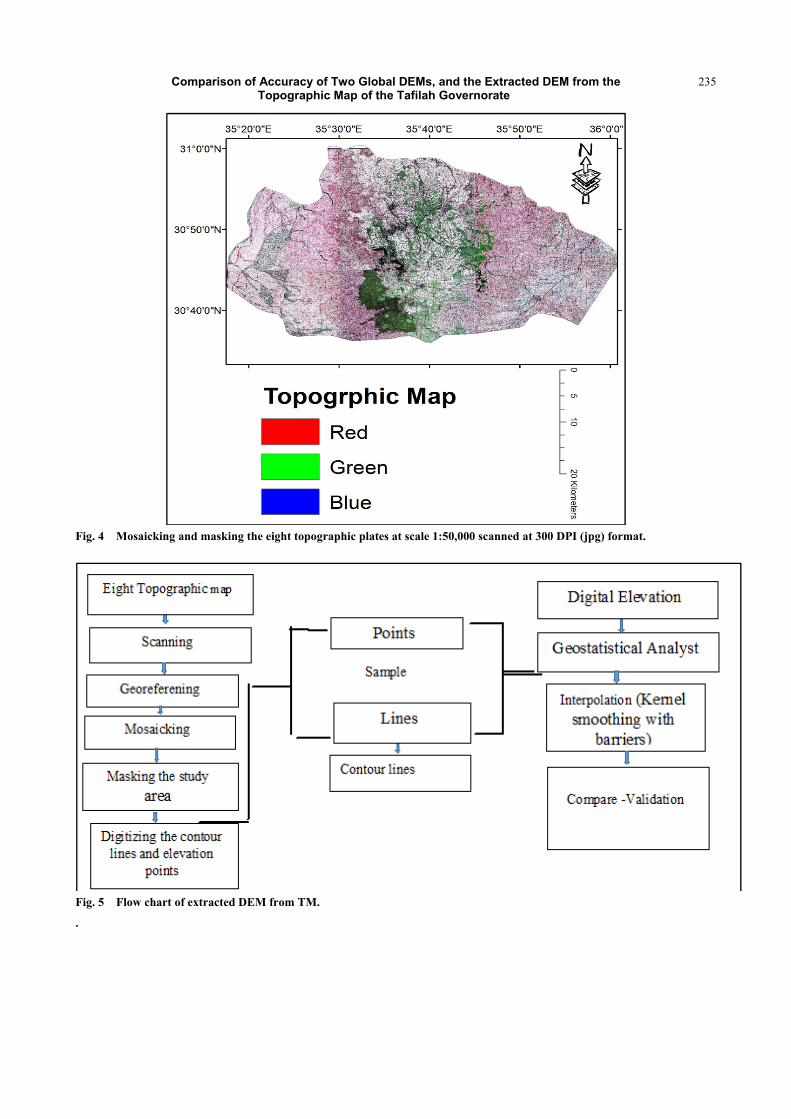
TM is a type of map characterized by large-scale detail and quantitative representation of relief, usually using contour lines in modern mapping, and is a detailed & accurate graphic representation of cultural & natural features on the ground [10]. In this study, eight TM plates at scale 1:50,000 generated by the RJGC (Royal Jordanian Geographical Center) covered the study area shown in Fig. 4 and were used to generate DEM by the following steps (Fig. 5).
Scanning: converting the topographic map into a digital format at 300 DPI jpg format, used to generate the DEM.
Georeferencing: georeferencing scanned eight topographic plates using known coordinates for the four corners of each map sheet and used these to establish the first 4 control points [12, 13]. The results of RMSE for each TM plate are shown in Table 2. Then eight topographic sheets covering the Tafilah governorate with contour intervals of 20 m were rectified and georeferenced to JTM map projection (Zone 36), and WGS84 ellipsoid.
Mosaicking: the eight topographic plates were merged/mosaicked to have the same cell resolution and coordinate system (Arc Toolbox, Data Management, Raster, and Mosaic).
Masking: the study area was extracted by mask
(Arc Toolbox, Cartography tools (masking tools), (Fig. 4)). Mosaicking and masking the study area.
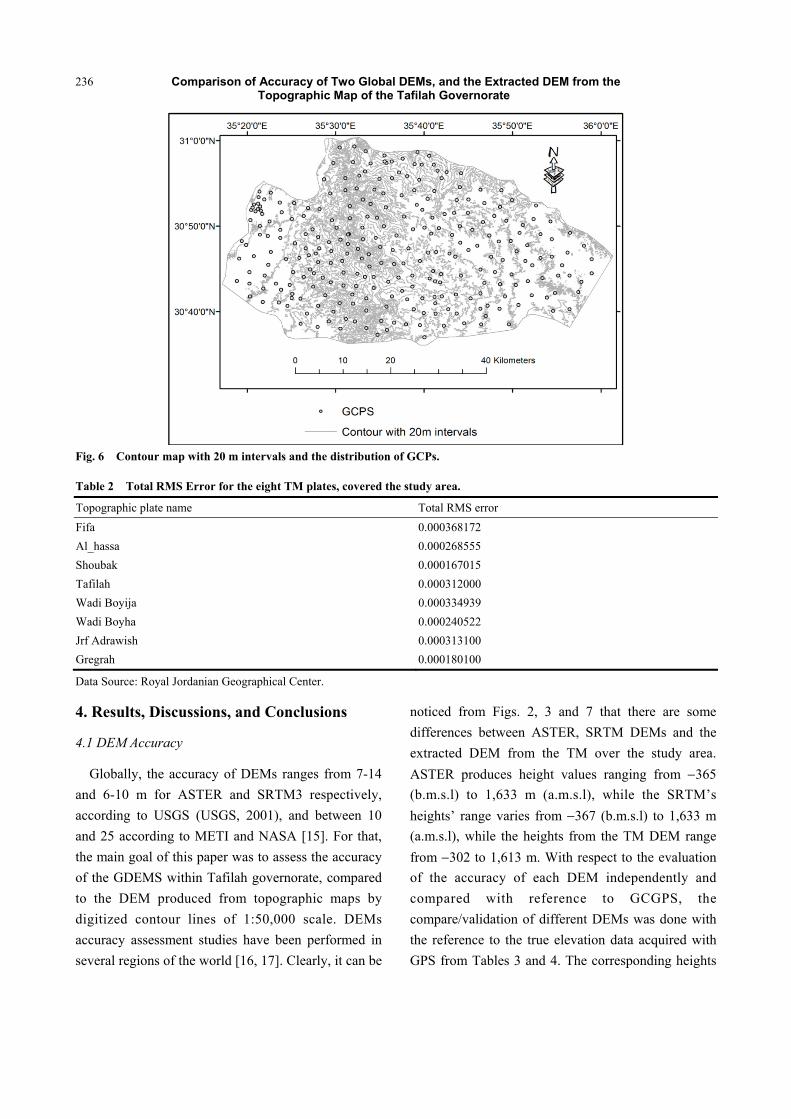
Digitizing: contour lines and elevation points were digitized using ArcGIS software (on-screen digitizing) to convert spatial features (line and points) from a TM into a digital map (Fig. 6).
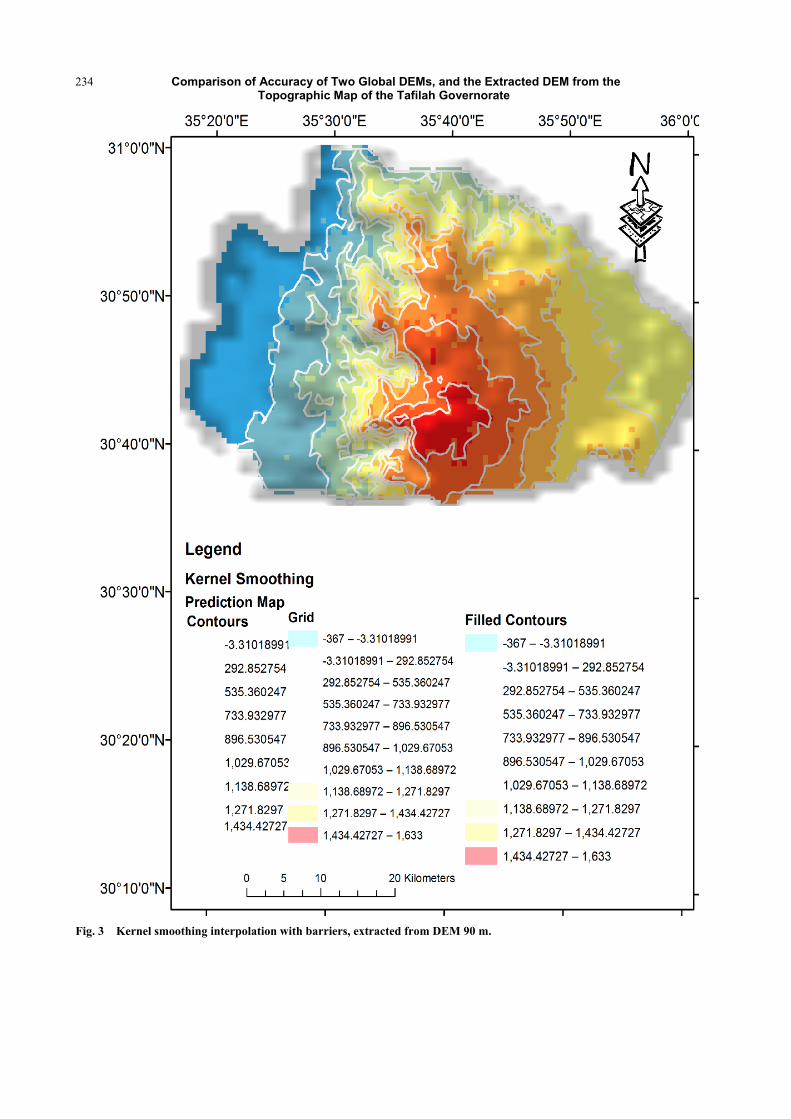
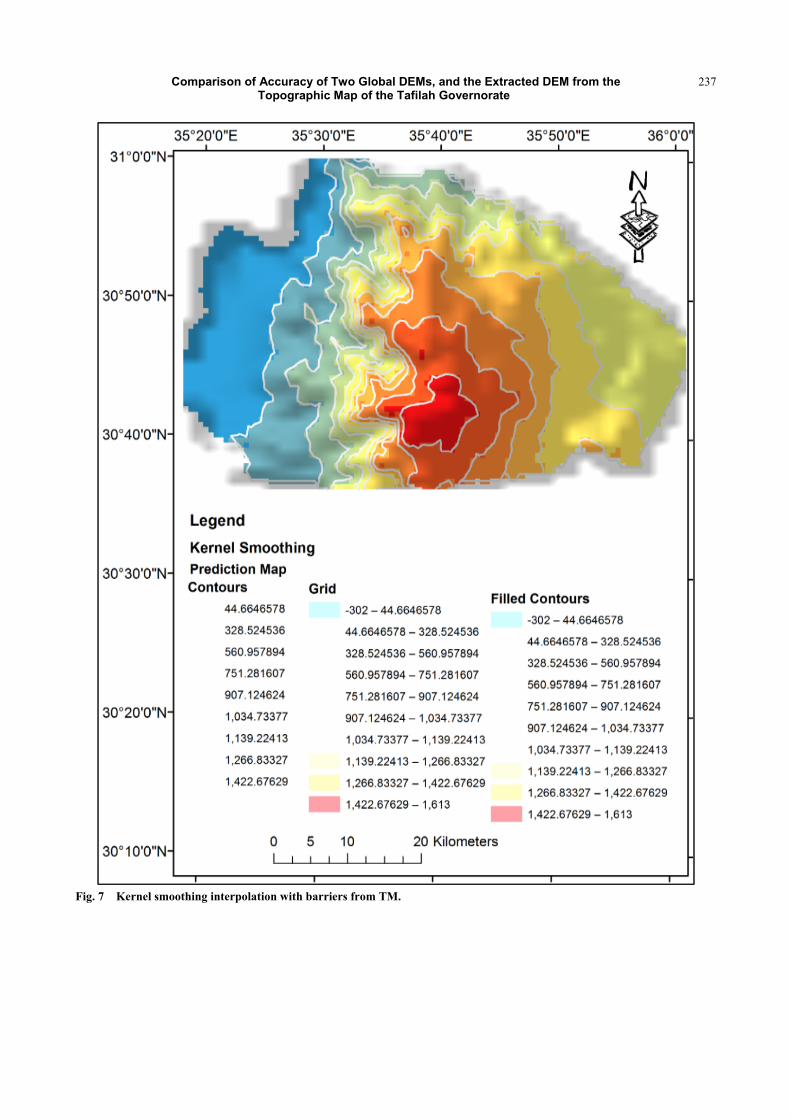
Generate and interpolate DEM: the digitized contour lines and the elevation points were used to create the DEM with ground resolution 50 m by the KS (kernel smoothing) interpolation method (Fig. 7).
3.3 GCPs (Ground Control Points)
A dataset of 250 points taken by GPS (global position system) with known elevations was used to judge and compare the accuracy of the DEMs (Fig. 6).
3.4 Methodology
The GIS processing procedures, carried out in this research, consist of several steps: (1) Three available DEMs 90 m, 30 m, and the generated DEM 8.9 m from the topographic map, and the GCGPS dataset was imported within the Arc GIS V.10.4 using spatial analysis tools specifically those of Geostatistical Analyst; (2) To interpolate the three DEMs individually from the Geostatistical Wizard, we applied one of the deterministic methods known as Kernel smoothing interpolation with barriers (ArcGIS Tools/Geostatistical Analyst and Spatial Analyst ARC GIS V.10.2 ); this method gave the best result in smoothing the surface due to the nature of the study area which is characterized by complex and heterogeneous landforms [14]; (3) The obtained interpolated form of each DEM was compared against the known heights of the 250-control points that cover the study area, using Compare-Validation to export age statistical layer (GA) to the points and predict values at unmeasured locations and validate predictions; (4) Finally, statistical analysis was performed to investigate the accomplished results.
Comparison of Accuracy of Two Global DEMs, and the Extracted DEM from the Topographic Map of the Tafilah Governorate
233
Fig. 2 Kernel smoothing interpolation with barriers, extracted from DEM 30 m.
Comparison of Accuracy of Two Global DEMs, and the Extracted DEM from the Topographic Map of the Tafilah Governorate
234
Fig. 3 Kernel smoothing interpolation with barriers, extracted from DEM 90 m.
Comparison of Accuracy of Two Global DEMs, and the Extracted DEM from the Topographic Map of the Tafilah Governorate
235
Fig. 4 Mosaicking and masking the eight topographic plates at scale 1:50,000 scanned at 300 DPI (jpg) format.
Fig. 5 Flow chart of extracted DEM from TM.
.
Comparison of Accuracy of Two Global DEMs, and the Extracted DEM from the Topographic Map of the Tafilah Governorate
236
Fig. 6 Contour map with 20 m intervals and the distribution of GCPs.
Table 2 Total RMS Error for the eight TM plates, covered the study area.
Topographic plate name Total RMS error Fifa 0.000368172 Al_hassa 0.000268555 Shoubak 0.000167015 Tafilah 0.000312000 Wadi Boyija 0.000334939 Wadi Boyha 0.000240522 Jrf Adrawish 0.000313100 Gregrah 0.000180100
Data Source: Royal Jordanian Geographical Center.
4. Results, Discussions, and Conclusions
4.1 DEM Accuracy
Globally, the accuracy of DEMs ranges from 7-14 and 6-10 m for ASTER and SRTM3 respectively, according to USGS (USGS, 2001), and between 10 and 25 according to METI and NASA [15]. For that, the main goal of this paper was to assess the accuracy of the GDEMS within Tafilah governorate, compared to the DEM produced from topographic maps by digitized contour lines of 1:50,000 scale. DEMs accuracy assessment studies have been performed in several regions of the world [16, 17]. Clearly, it can be
noticed from Figs. 2, 3 and 7 that there are some differences between ASTER, SRTM DEMs and the extracted DEM from the TM over the study area. ASTER produces height values ranging from −365 (b.m.s.l) to 1,633 m (a.m.s.l), while the SRTM’s heights’ range varies from −367 (b.m.s.l) to 1,633 m (a.m.s.l), while the heights from the TM DEM range from −302 to 1,613 m. With respect to the evaluation of the accuracy of each DEM independently and compared with reference to GCGPS, the compare/validation of different DEMs was done with the reference to the true elevation data acquired with GPS from Tables 3 and 4. The corresponding heights
Comparison of Accuracy of Two Global DEMs, and the Extracted DEM from the Topographic Map of the Tafilah Governorate
237
Fig. 7 Kernel smoothing interpolation with barriers from TM.
Comparison of Accuracy of Two Global DEMs, and the Extracted DEM from the Topographic Map of the Tafilah Governorate
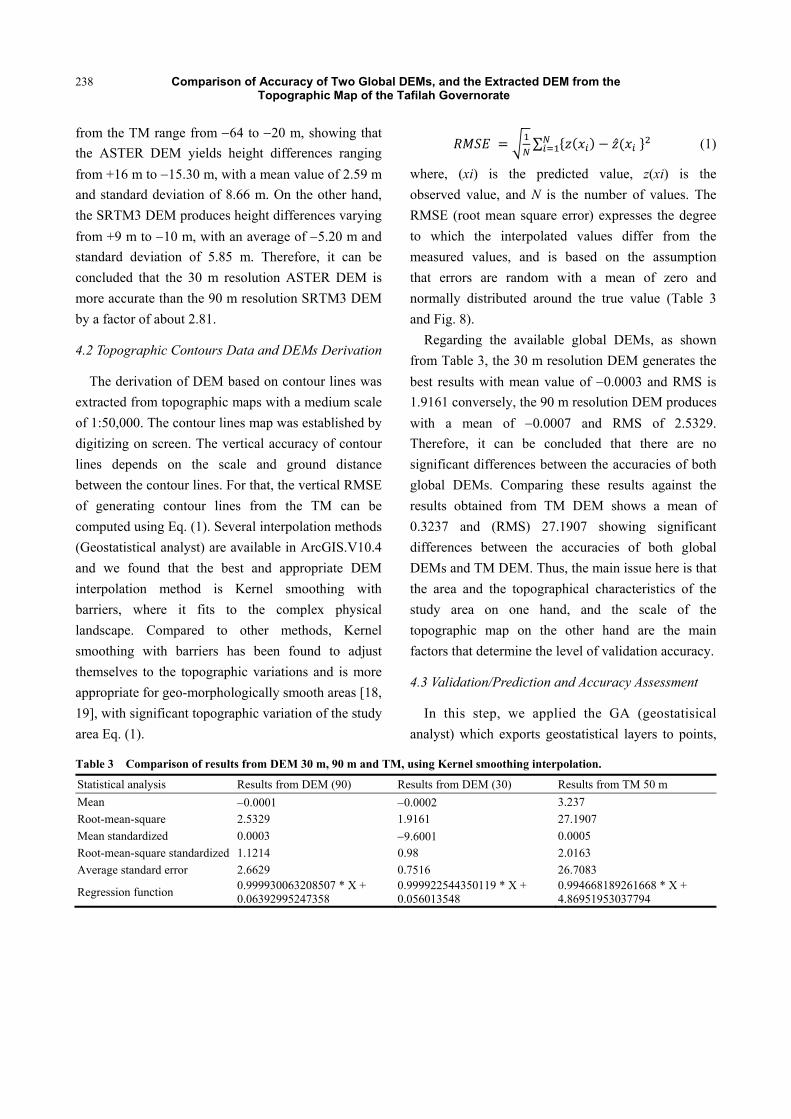
238
from the TM range from −64 to −20 m, showing that the ASTER DEM yields height differences ranging from +16 m to −15.30 m, with a mean value of 2.59 m and standard deviation of 8.66 m. On the other hand, the SRTM3 DEM produces height differences varying from +9 m to −10 m, with an average of −5.20 m and standard deviation of 5.85 m. Therefore, it can be concluded that the 30 m resolution ASTER DEM is more accurate than the 90 m resolution SRTM3 DEM by a factor of about 2.81.
4.2 Topographic Contours Data and DEMs Derivation
The derivation of DEM based on contour lines was extracted from topographic maps with a medium scale of 1:50,000. The contour lines map was established by digitizing on screen. The vertical accuracy of contour lines depends on the scale and ground distance between the contour lines. For that, the vertical RMSE of generating contour lines from the TM can be computed using Eq. (1). Several interpolation methods (Geostatistical analyst) are available in ArcGIS.V10.4 and we found that the best and appropriate DEM interpolation method is Kernel smoothing with barriers, where it fits to the complex physical landscape. Compared to other methods, Kernel smoothing with barriers has been found to adjust themselves to the topographic variations and is more appropriate for geo-morphologically smooth areas [18, 19], with significant topographic variation of the study area Eq. (1).
∑ ̂ (1)
where, (xi) is the predicted value, z(xi) is the observed value, and N is the number of values. The RMSE (root mean square error) expresses the degree to which the interpolated values differ from the measured values, and is based on the assumption that errors are random with a mean of zero and normally distributed around the true value (Table 3 and Fig. 8).
Regarding the available global DEMs, as shown from Table 3, the 30 m resolution DEM generates the best results with mean value of −0.0003 and RMS is 1.9161 conversely, the 90 m resolution DEM produces with a mean of −0.0007 and RMS of 2.5329. Therefore, it can be concluded that there are no significant differences between the accuracies of both global DEMs. Comparing these results against the results obtained from TM DEM shows a mean of 0.3237 and (RMS) 27.1907 showing significant differences between the accuracies of both global DEMs and TM DEM. Thus, the main issue here is that the area and the topographical characteristics of the study area on one hand, and the scale of the topographic map on the other hand are the main factors that determine the level of validation accuracy.
4.3 Validation/Prediction and Accuracy Assessment
In this step, we applied the GA (geostatisical analyst) which exports geostatistical layers to points,
Table 3 Comparison of results from DEM 30 m, 90 m and TM, using Kernel smoothing interpolation.
Statistical analysis Results from DEM (90) Results from DEM (30) Results from TM 50 m Mean −0.0001 −0.0002 3.237 Root-mean-square 2.5329 1.9161 27.1907 Mean standardized 0.0003 −9.6001 0.0005 Root-mean-square standardized 1.1214 0.98 2.0163 Average standard error 2.6629 0.7516 26.7083
Regression function 0.999930063208507 * X + 0.06392995247358
0.999922544350119 * X + 0.056013548
0.994668189261668 * X + 4.86951953037794
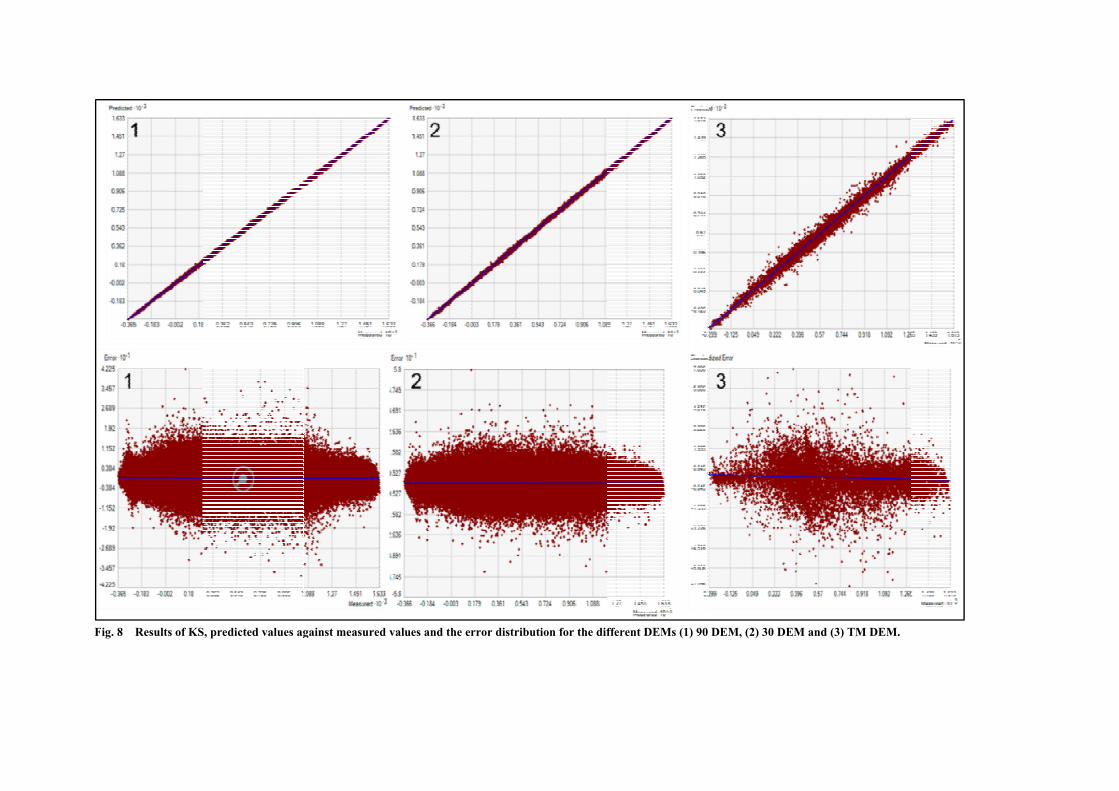
F
ig. 8 Results of KSS, predicted values aggainst measured valuues and the error dis
stribution for the diffferent DEMs (1) 90 DEM, (2) 30 DEM aand (3) TM DEM.
Comparison of Accuracy of Two Global DEMs, and the Extracted DEM from the Topographic Map of the Tafilah Governorate
240
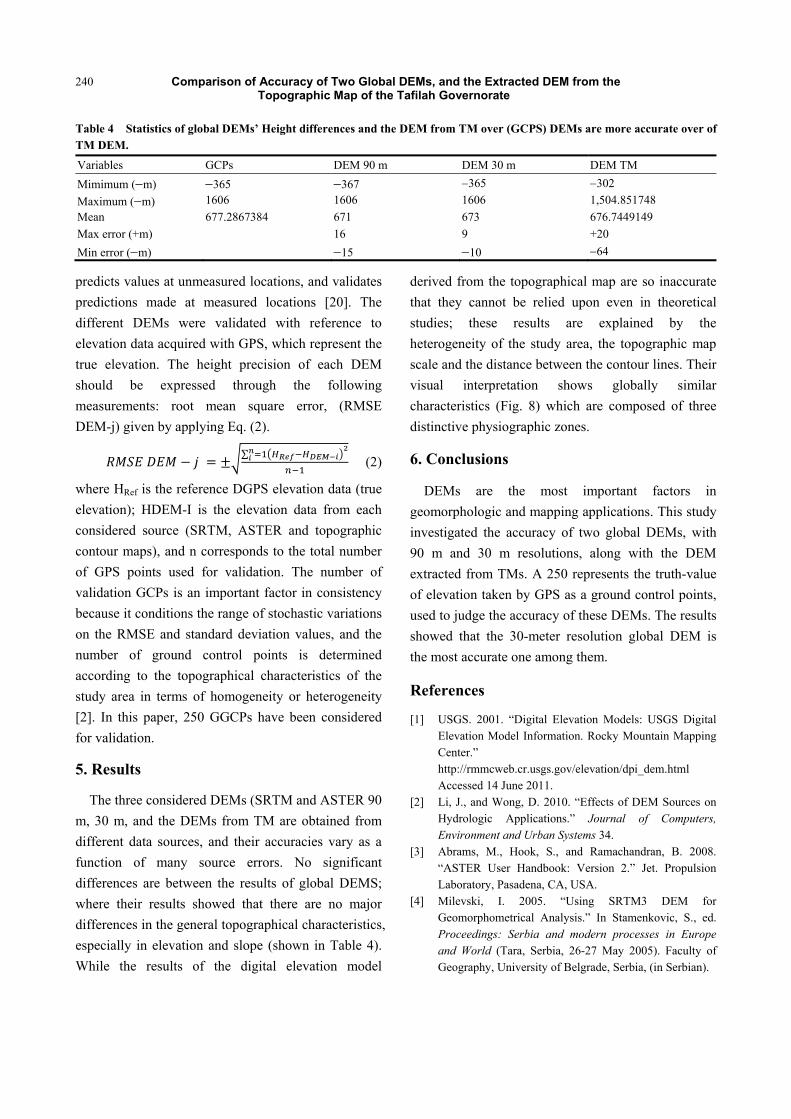
Table 4 Statistics of global DEMs’ Height differences and the DEM from TM over (GCPS) DEMs are more accurate over of TM DEM.
Variables GCPs DEM 90 m DEM 30 m DEM TM Mimimum (−m) −365 −367 −365 −302 Maximum (−m) 1606 1606 1606 1,504.851748 Mean 677.2867384 671 673 676.7449149 Max error (+m) 16 9 +20 Min error (−m) −15 −10 −64
predicts values at unmeasured locations, and validates predictions made at measured locations [20]. The different DEMs were validated with reference to elevation data acquired with GPS, which represent the true elevation. The height precision of each DEM should be expressed through the following measurements: root mean square error, (RMSE DEM-j) given by applying Eq. (2).
∑
(2)
where HRef is the reference DGPS elevation data (true elevation); HDEM-I is the elevation data from each considered source (SRTM, ASTER and topographic contour maps), and n corresponds to the total number of GPS points used for validation. The number of validation GCPs is an important factor in consistency because it conditions the range of stochastic variations on the RMSE and standard deviation values, and the number of ground control points is determined according to the topographical characteristics of the study area in terms of homogeneity or heterogeneity [2]. In this paper, 250 GGCPs have been considered for validation.
5. Results
The three considered DEMs (SRTM and ASTER 90 m, 30 m, and the DEMs from TM are obtained from different data sources, and their accuracies vary as a function of many source errors. No significant differences are between the results of global DEMS; where their results showed that there are no major differences in the general topographical characteristics, especially in elevation and slope (shown in Table 4). While the results of the digital elevation model
derived from the topographical map are so inaccurate that they cannot be relied upon even in theoretical studies; these results are explained by the heterogeneity of the study area, the topographic map scale and the distance between the contour lines. Their visual interpretation shows globally similar characteristics (Fig. 8) which are composed of three distinctive physiographic zones.
6. Conclusions
DEMs are the most important factors in geomorphologic and mapping applications. This study investigated the accuracy of two global DEMs, with 90 m and 30 m resolutions, along with the DEM extracted from TMs. A 250 represents the truth-value of elevation taken by GPS as a ground control points, used to judge the accuracy of these DEMs. The results showed that the 30-meter resolution global DEM is the most accurate one among them.
References
[1] USGS. 2001. “Digital Elevation Models: USGS Digital Elevation Model Information. Rocky Mountain Mapping Center.” http://rmmcweb.cr.usgs.gov/elevation/dpi_dem.html Accessed 14 June 2011.
[2] Li, J., and Wong, D. 2010. “Effects of DEM Sources on Hydrologic Applications.” Journal of Computers, Environment and Urban Systems 34.
[3] Abrams, M., Hook, S., and Ramachandran, B. 2008. “ASTER User Handbook: Version 2.” Jet. Propulsion Laboratory, Pasadena, CA, USA.
[4] Milevski, I. 2005. “Using SRTM3 DEM for Geomorphometrical Analysis.” In Stamenkovic, S., ed. Proceedings: Serbia and modern processes in Europe and World (Tara, Serbia, 26-27 May 2005). Faculty of Geography, University of Belgrade, Serbia, (in Serbian).
Comparison of Accuracy of Two Global DEMs, and the Extracted DEM from the Topographic Map of the Tafilah Governorate
241
[5] Sulebak, J. R. 2000. “Applications of Digital Elevation Models.” DYNAMAP. White Paper.
[6] Dowerah, B. 2010. “ASTER DEM Based Studies for Geological Investigation around Singhbhum Shear Zone (SSZ) in Jharkhand, India.” Journal of Geographic Information System 2.
[7] Sefercik, U. G. 2007. Comparison of DEM Accuracies Generated by Various Methods.
[8] USGS (U.S. Geological Survey). 1999. “Map Accuracy Standards.” USGS Fact, November.
[9] El Bastawesy, M. 2007. “Influence of DEM Source and Resolution on the Hydrographical Simulation of Wadi Keed Catchment, Sinai, Egypt.” Egypt Journal of Remote Sensing and Space Sciences 10.
[10] Center for Topographic Information. 2007. “Mapping Information Topo Maps: Frequently Asked Questions.”
[11] Ozah, A. P., and Kufoniyi, O. 2008. “Accuracy Assessment of Contour Interpolation from 1:50,000 Topographic maps and SRTM Data for 1:25,000 Topographical Mapping, the International Archives of the Photogrammetry.” Remote Sensing and Spatial Information Sciences. Vol. XXXVII. Part B7. Beijing.
[12] ESRI. 2008. “Georeferencing a Raster Dataset.” John P. Wilson, John C. Gallant, Terrain Analysis (Principles and Applications). Wiley, 2000.
[13] www.esri.com/geostatisticalanalyst.
[14] Childs, C. 2004. Interpolating Surfaces. ESRI Education Services. www.esri.com/news/arcuser/0704/files/ interpolating.pdf Accessed 14 June 2011.
[15] ASTER GDEM Validation Team. 2009. “ASTER global DEM Validation Summary Report.” METI & NASA.
[16] Keeratikasikorn, C., and Trisirisatayawong I. 2008 “Reconstruction of 30 m DEM from 90 m SRTM DEM with Bicubic Polynomial Interpolation Method.” The International Archives of the Photogrammetry, Remote Sensing and Spatial Information Sciences XXXVII. Part B1. Beijing 2008.
[17] Bamler, R. 1999. The SRTM Mission: A Worldwide 30 m Resolution DEM from SAR, Interferometry in 11 Days. Photogrammetric Week 1999. Heidelberg: Wichmann Verlag.
[18] Mousavi, S., Fallah, A., Abbasnejadc, R., Mousavi, S. R., and Shabani, M. 2007. “The ASTER DEM Generation for Geomorphometric Analysis of Central Alborz Mountains, Iran.” Proceedings of the Asian Association of Remote Sensing Conference, Nov. 12-16, Kuala Lumpur, Malaysia.
[19] http://maps.nrcan.gc.ca/topo101/faq_e.php Accessed 11 June 2011.
[20] http://webhelp.esri.com/arcgisdesktop/9.2/index.cfm? TopicName=Georeferencing_a_raster_dataset Accessed 10 June 2011.