Comparison of 2 or more means ( See Chapter 11) e.g. n=16, df=15, alpha=0.05 t- statistic under H0...
22
Comparison of 2 or more means (See Chapter 11)
-
date post
20-Dec-2015 -
Category
Documents
-
view
213 -
download
0
Transcript of Comparison of 2 or more means ( See Chapter 11) e.g. n=16, df=15, alpha=0.05 t- statistic under H0...

Comparison of 2 or more means(See Chapter 11)
e.g. n=16, df=15, alpha=0.05 t- statistic under H0 are ±2.13
Pr 2.131 2.131 0.95S/ nX mì ü-ï ïï ï- £ £ =í ýï ïï ïî þ
Is = 0 ? -- considerx
ts/ n
m0-= versus
ors s
C.I. : x 2.131 , x 2.13116 16
æ öç ÷- -ç ÷ç ÷è ø
One sample t test

Population (Normal)
T-treatment C-control
T C
T C
Sample
nT nC
sT sC
H0 : T = C
Two sample t
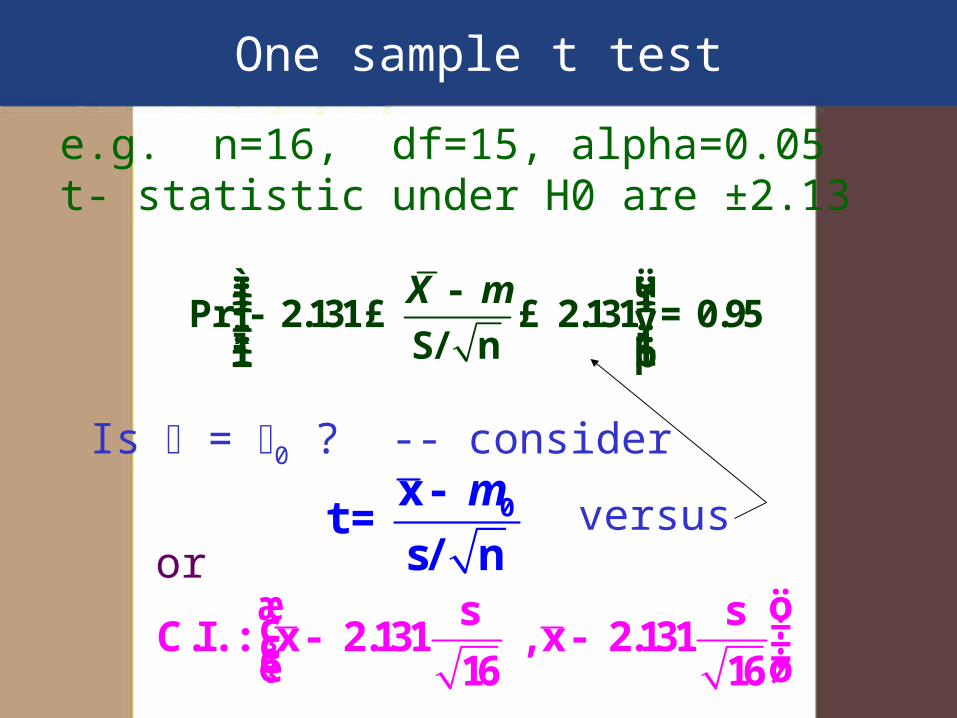
1.Samples dependent (Paired)(1 sample of subjects, 2 measures/subject)
2.Samples independent (2 independent samples of subjects,
1 measure per subject)
Two situations:

Example – Paired study
• Each subject is tested under 2 conditions: – Time to angina when exposed to plain air
– Time to angina when exposed to air + CO
– Question: Is there evidence that the time to angina is shorter when there is exposure to Co?

Perc
ent d
ecre
ase
.5 1 2 2.5
-30
-20
-10
0
10
20
30
40
Plain air Carbon monoxide
Example – Paired study(Partial data)

Plain air
Carbon monoxide
Example – Paired study

Perc
ent d
ecre
ase
.5 1 2 2.5
-30
-20
-10
0
10
20
30
40
Plain air Carbonmonoxide
Example – Paired study

Example – Paired study
• Response Error Model for a Subject (s):
sk s skY E
At time 1(Control)
1 1sk s skY E
At time 2(same)
2 2sk s skY E
Measured under same conditions!
Example – Paired study
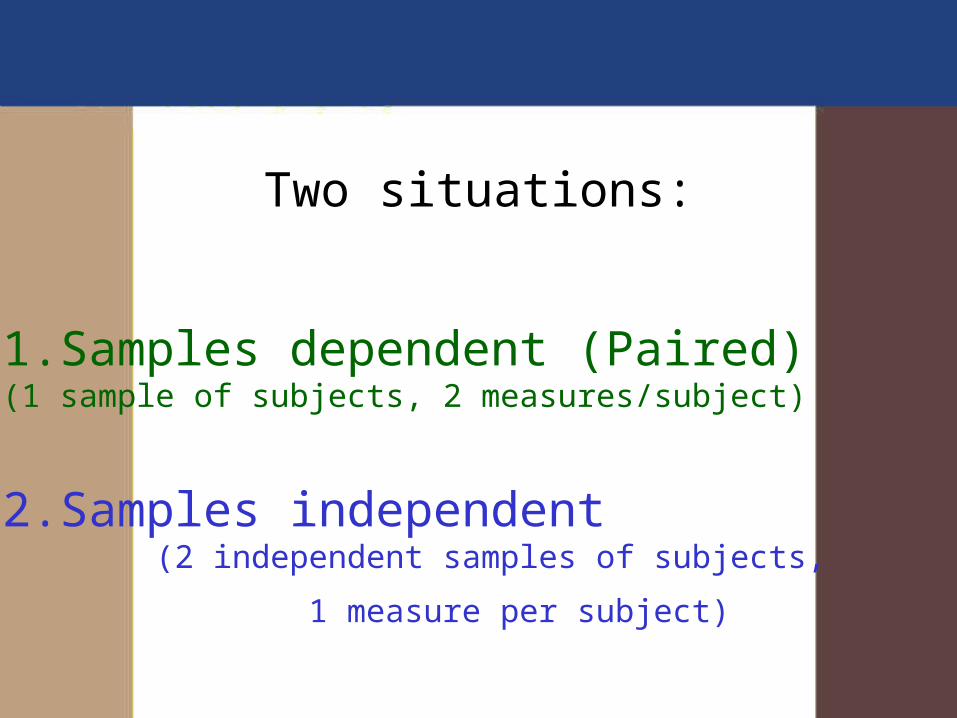
• Response Error Model for a Subject:
sk s skY E
At time 1(control)
1 1sk s skY E
At time 2(with CO)
2 2sk s s skY E
Measured under different conditions!
s = The condition effect

Example – Paired study
• Take Difference
-At time 1 1 1sk s skY E
At time 2 (+CO)
2 2sk s s skY E
Take Sample of Subjects, Test whether
0 : 0
: 0d
a d
H
H
2 1 2 1
2 1
*
sk sk s s sk s sk
s s sk sk
s s s
Y Y E E
D E E
D E
-CO reduces time to asthma

So
Look at the differences:

So treat the d’s as the data and perform a one-sample t-test:
T-test
Average change in time to angina = -6.63SD of change in time to angina = 20.29 n=63. Calculate p value for H0: μ=0 vs Ha: μ not 0

n= 63
Example - Paired study (Hypothesis test)
2.59dcal
d
dt
s
n
Compare with t (.05,62)= -1.671
Since tcal<-1.671, reject Ho. Conclude time is shorter.
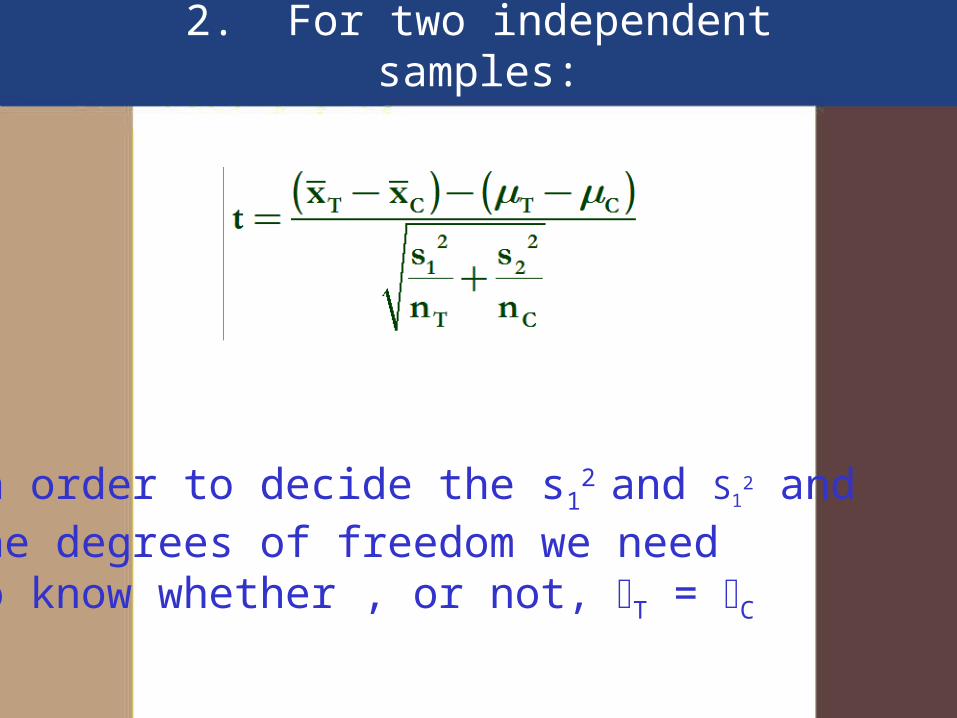
In order to decide the s12 and S1
2 and the degrees of freedom we need to know whether , or not, T = C
2. For two independent samples:

If T C (recommended)
and degrees of freedom, :
Heteroscedastic

If T = C (which can be tested)we can use a common value:
Homoscedastic

Two samples (groups):
Treatment Control 4 7 6 6 2 9 5 10
Example

Stata Output paired t
. ttest var1 = var2
Paired t test
------------------------------------------------------------------------------
Variable | Obs Mean Std. Err. Std. Dev. [95% Conf. Interval]
---------+--------------------------------------------------------------------
var1 | 4 4.25 .8539126 1.707825 1.532469 6.967531
var2 | 4 8 .9128709 1.825742 5.094837 10.90516
---------+--------------------------------------------------------------------
diff | 4 -3.75 1.493039 2.986079 -8.501518 1.001518
------------------------------------------------------------------------------
Ho: mean(var1 - var2) = mean(diff) = 0
Ha: mean(diff) < 0 Ha: mean(diff) ~= 0 Ha: mean(diff) > 0
t = -2.5117 t = -2.5117 t = -2.5117
P < t = 0.0434 P > |t| = 0.0868 P > t = 0.9566

Stata Output unpaired t
. ttest var1 = var2, unpaired
Two-sample t test with equal variances
-----------------------------------------------------------------------------
Variable | Obs Mean Std. Err. Std. Dev. [95% Conf. Interval]
---------+--------------------------------------------------------------------
var1 | 4 4.25 .8539126 1.707825 1.532469 6.967531
var2 | 4 8 .9128709 1.825742 5.094837 10.90516
---------+--------------------------------------------------------------------
combined | 8 6.125 .9149063 2.587746 3.96159 8.28841
---------+--------------------------------------------------------------------
diff | -3.75 1.25 -6.80864 -.6913601
------------------------------------------------------------------------------
Degrees of freedom: 6 Ho: mean(var1) - mean(var2) = diff = 0
Ha: diff < 0 Ha: diff ~= 0 Ha: diff > 0
t = -3.0000 t = -3.0000 t = -3.0000
P < t = 0.0120 P > |t| = 0.0240 P > t = 0.9880

Stata Output unpaired unequal
. ttest var1 = var2, unpaired unequal
Two-sample t test with unequal variances
------------------------------------------------------------------------------Variable | Obs Mean Std. Err. Std. Dev. [95% Conf. Interval]---------+-------------------------------------------------------------------- var1 | 4 4.25 .8539126 1.707825 1.532469 6.967531 var2 | 4 8 .9128709 1.825742 5.094837 10.90516---------+--------------------------------------------------------------------combined | 8 6.125 .9149063 2.587746 3.96159 8.28841---------+-------------------------------------------------------------------- diff | -3.75 1.25 -6.811938 -.6880619------------------------------------------------------------------------------Satterthwaite's degrees of freedom: 5.97345
Ho: mean(var1) - mean(var2) = diff = 0
Ha: diff < 0 Ha: diff ~= 0 Ha: diff > 0 t = -3.0000 t = -3.0000 t = -3.0000 P < t = 0.0121 P > |t| = 0.0241 P > t = 0.9879

Summary
• Paired test• Hypothesis test• CI
• 2 independent samples:– Hypothesis test for equal/unequal
variance– CI under equal/unequal variance