Comparison (Multivariate) investigation for Juniors. and Plan Do you remember what ... Analysis...
55
Created by Elizabeth Sneddon Comparison (Multivariate) investigation for Juniors. (Levels 2 – 6) Name:
-
Upload
duongquynh -
Category
Documents
-
view
214 -
download
1
Transcript of Comparison (Multivariate) investigation for Juniors. and Plan Do you remember what ... Analysis...

Created by Elizabeth Sneddon
Comparison (Multivariate) investigation for Juniors.
(Levels 2 – 6)
Name:

Page2
Current Level (circle one):
3 / 4 / 5 / 6
Goal Level (circle one):
3 / 4 / 5 / 6

Page3
Problem and Plan Do you remember what a comparison question is?
It must contain 2 groups (e.g. boys and girls) and another variable (counts or measurements).
Exercises:
Problem
I wonder if there tends to be a difference in the daily number of texts sent by boys and girls in Year 11 at Aorere College?
Plan
We will ask 30 boys and 30 girls the following question:
How many texts do you send each day?
1) Do you think all students will respond with an accurate answer to this question?
2) Why might students give an incorrect answer to the question?

Page4
3) Do you think that Year 11 students will send approximately the same number of texts per day as Year 4 students? Why/why not? Explain
4) Could we use the results of a survey of teenagers to estimate how many texts are sent per day by people in their 20’s? Why/why not? Explain

Page5
5) Why is the wording of the following question biased? What do you dislike about the school uniform?

Page6
Problem 1
I wonder if tends to be a difference in the amount of alcohol 18 year old girls and boys drink each week?
Plan
Discuss how errors can occur during the data collection stage. Give specific examples, and discuss how you could limit these error.

Page7
Problem 2
I wonder if tends to be a difference in the weight of a school bag for Year 13’s compared to Year 9’s?
Plan
Discuss how errors can occur during the data collection stage. Give specific examples, and discuss how you could limit these error.

Page8
Analysis Graphs and Calculations Sample statistics
Numbers calculated from a sample of numerical values that are used to summarise the sample. The statistics will usually include at least one measure of centre and at least one measure of spread. Measures of Center Mean
Median
Mode
Measures of Spread Range
IQR (Inter Quartile Range)
Standard Deviation

Page9

Page10
Displaying data In statistics, it is useful to visualise our data. This will help us describe the important features of the data such shape (distribution), the size of the spread, the location of the centre and anything else interesting or unusual (e.g. clusters of data, extreme values or outliers).
The dot plot. Below is a dot plot of a sample of 30 students from the Census at schools survey for 2011.
This is a cluster
Identical data values are stacked on top of one
Outlier
Axis labels and units are important

Page11
The box and whisker plot.

Page12
Analysis
Here are the features you need to analyse.
1. Shape
2. Shift – comparing the centers
3. Spread – comparing the spread
4. Overlap
5. Comparing the Middle 50%
6. Unusual features
We will now go through each feature, before putting it all together.

Page13
1. Shape
The first thing you need to do is sketch a rough shape over the top of a dot plot.
Example:
The next question you should ask yourself when analysing the shape of the distribution, is “which distribution does my data best match?”.

Page14
Normal distribution (hill/mound shapes, symmetric, bell shaped curve) Left skewed (Tail is on the left hand side) Right Skewed (tail is on the right hand side) Multimodal (there are more than one peak) Uniform (the sides are straight and it looks like a box)

Page15
Lastly, you need to write a sentence about the shape of each group. Here is a sentence framework to help. Sentence Framework: I notice that the shape of the distribution is
approximately Normal/left skewed/right
skewed/multi-modal/uniform/does not match any
distribution.

Page16
Exercise:
Sketch and then describe the shape.
I notice …
I notice …

Page17
I notice …
I notice …

Page18
I notice …
I notice …

Page19
I notice …
I notice …

Page20
I notice …

Page21
Predict what shape the distribution may be for the following situations.

Page22
2. Shift – comparing the centers
Locate the medians, and tell me which groups median is bigger and by how much. I notice that the median bag weight of females is bigger than males by around 700 grams. Sentence Framework:
I notice that the median variable of group 1
tends to be bigger / smaller than the median
variable of group 2’s by around _____ units.

Page23
3. Spread – comparing the spread
Find the IQR, and tell me which group’s spread is bigger and by how much. I notice that the IQR of females is slightly smaller than the IQR of males. Sentence Framework:
I notice that the group 1’s IQR for variable
is much bigger/bigger/the same/smaller/much
smaller than the IQR of group 2’s.

Page24
Example
I notice that the IQR for height of Year 12 boys is 12cm, and the IQR of Year 12 girls is 5cm. I notice that the Year 12 boys IQR is much bigger than the Year 12 girls. Excellence From this I can see that the Year 12 boys IQR is double the size of the Year 12 girls, meaning that the boys heights are much more variable and the Year 12 girls heights are much more consistent.

Page25
4. Overlap
Look at the boxes (this contains the middle 50%).
How much do the boxes overlap by: none, a little, some or a lot? I notice that the middle 50% of female bag weights overlap a lot with the middle 50% of males bag weights. Sentence Framework: I notice that there is none / a little / some / a lot
of overlap between the group 1 and group 2
variable (units).

Page26
5. Comparing the Middle 50%
We want to compare where the middle 50% of the data is located in each group and whether there are any significant differences between the groups. The middle 50% of the data are the values that lie between the UQ and LQ. In other words, the IQR contains the middle 50% of the data.
The easiest way to do this comparison is to look at the box’s on the box and whisker graph (as the box is the middle 50%).
Look at the boxes. Note where the UQ and LQ of each group is.
Has the box of one group shifted up compared to the other group?

Page27
I notice that the middle 50% of female bag weights lies between 2000grams and 5000 grams.
I notice that the middle 50% of male bag weights lies between 1600 grams and 5000 grams.
I notice that there is female bag weight is shifted slightly to the right compared with male bag weights.
Sentence Framework: I notice that the middle 50% of group 1
variable is between ______ and ____ units, and
the middle 50% of group 2 is between ____ and
_____ units.
I notice that the middle 50% (the box) of group 1's
variable is shifted to the left/right compared
with the middle 50% of group 2 .

Page28
6. Unusual features
Outliers
A member of a data set whose values for the variable in the data set are such that it lies well away from most of the other members of the data set. These must be VERY obvious. Example
I notice that there may be an outlier with a weight of around 125kg. Sentence Framework: I notice that in group 1 there may be outliers,
located at _____ units.

Page29
Cluster Be cautious about commenting on small groupings. Sentence Framework: I notice that in group 1 there appears to
be a cluster, located around ______units.
Example
There are three clusters in the distribution; a group who did a very small amount or no paid work, a group who did part-time work (about 20 hours) and a group who did full-time work (about 35 to 40 hours).

Page30
Example Compare and interpret the shape, unusual or interesting features, shift, spread, overlap and middle 50% of the data. Use the sentence frameworks as a guide.
Problem:
Do the weights of girls’ school bags tend to be greater than the weights of boys’ school bags in the 14 middle schools?

Page31
I notice:
that the shape of the females and male bag weights in the 14 middle schools both tend to be an approximate Normal distribution, with no apparent outliers.
that the median of the female bag weights in the 14 middle schools tends to be heavier than the median of the males bag weights by around 1000grams.
that the female bag weights in the 14 middle schools has a smaller IQR than the males, though only by around 500grams.
that the female bag weights IQR appears to be shifted to the right compared to the males.
that the bag weights of both females and males in the 14 middle schools overlap a lot

Page32
Exercise: 1) Do students who have a facebook account tend to
have newer cellphones than those who do not?

Page33

Page34
2) Is the average schoolbag weight carried by boys as they start secondary school more than the average weight carried by boys as they start intermediate school?

Page35

Page36
Conclusion There are three things you need to do in your conclusion:
Answer the investigation question
Make an inference about the population
Discuss Sampling Variability.

Page37
Making the call You need to decide if you have enough evidence to say whether or not there tends to be a difference between the 2 groups.
Evidence
Locate the medians.
Do either of these lie outside the box of the other group?

Page38
Conclusion
I can’t make the call, because the median of males bag weight lies inside the box of the females bag weights.
Therefore there tends to be no difference in the bag weights of males and females.
Sentence Framework:
I can/can’t make the call that there tends to be a
difference between the variable of group 1 and the
variable of group 2.
The evidence I used to make this call is _____________
Finally, write a sentence answering your investigation
question.

Page39
Example
Problem:
I wonder if there tends to be a difference in the length of the ring finger for Year 12 girls and boys.
Conclusion:
I cannot make the call that there tends to be a difference between the length of ring finger for girls and boys in Year 12.
The evidence I used to make this call is that the median length of the girls lies inside the box of the boys ring finger length.
Therefore I conclude that there tends to be no difference in the ring finger length for Year 12 girls and boys.

Page40
Exercise:
Data resulting from taking samples from Census at School is shown. What analysis and conclusion can you draw?
(a) Do students who have a facebook account tend to have newer cellphones than those who do not?
Conclusion:
Page41

Page42
(b) Is the average schoolbag weight carried by boys as they start secondary school more than the average weight carried by boys as they start intermediate school?
Conclusion:

Page43
Page44
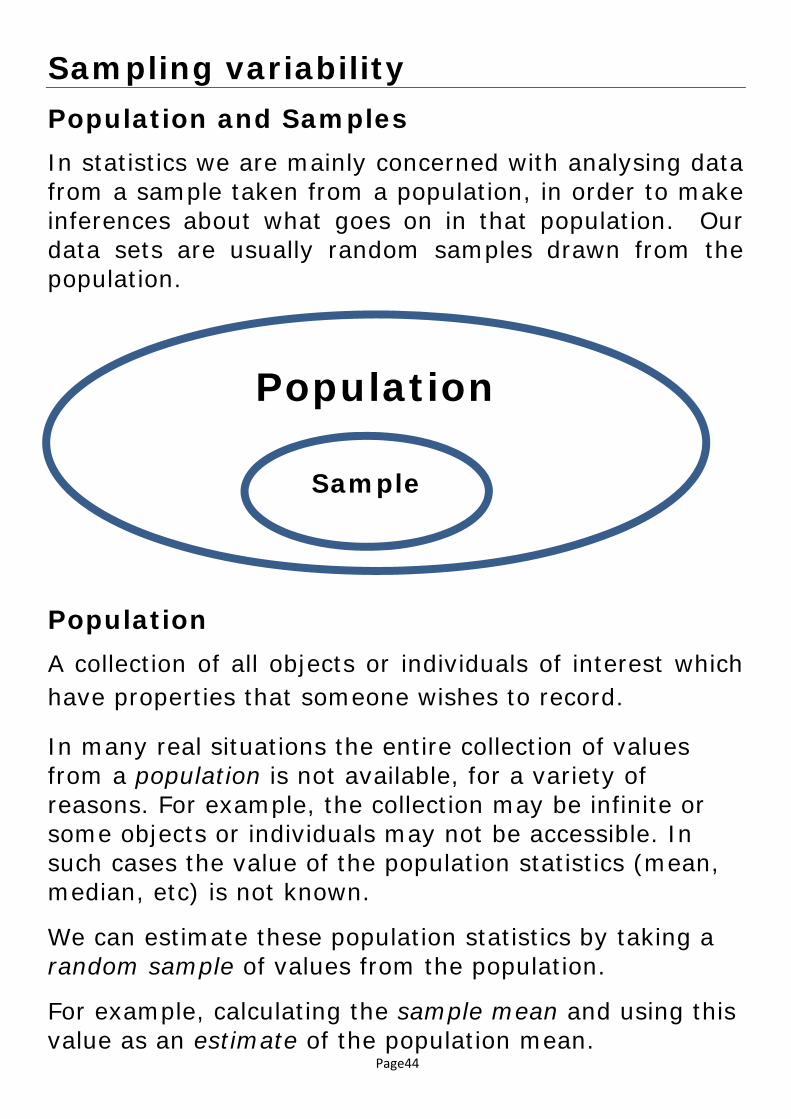
Sampling variability Population and Samples In statistics we are mainly concerned with analysing data from a sample taken from a population, in order to make inferences about what goes on in that population. Our data sets are usually random samples drawn from the population.
Population A collection of all objects or individuals of interest which have properties that someone wishes to record.
In many real situations the entire collection of values from a population is not available, for a variety of reasons. For example, the collection may be infinite or some objects or individuals may not be accessible. In such cases the value of the population statistics (mean, median, etc) is not known.
We can estimate these population statistics by taking a random sample of values from the population.
For example, calculating the sample mean and using this value as an estimate of the population mean.
Population
Sample

Page45
Sample A group of objects, individuals or values selected from a population. The intention is for this sample to provide estimates of population parameters.
Simple random sample A sample in which, at any stage of the sampling process, each object or individual (which has not been chosen) in the population has the same probability of being chosen in the sample.
In a simple random sample an object or individual in the population can be chosen once, at most. This is often called sampling without replacement.

Page46
Problems with taking a sample Sampling variation
The variation in a sample statistic from sample to sample.
Suppose a sample is taken and a sample statistic, such as a sample mean, is calculated. If a second sample of the same size is taken from the same population, it is almost certain that the sample mean calculated from this sample will be different from that calculated from the first sample. If further sample means are calculated, by repeatedly taking samples of the same size from the same population, then the differences in these sample means illustrate sampling variation.
Precision (of an estimate)
A measure of how close an estimate is expected to be to the true value of a population parameter. This measure is based on the degree of similarity among estimates of a population parameter, if the same sampling method were repeated over and over again.
Notes: Sampling variation is always present and will cause a
shift in the medians We are looking for sufficient evidence, a big enough
shift in the intervals for the median to be able to make a claim that there is a difference back in the populations.

Page47
Sampling variability If I took another sample …
When another sample is taken, you will select different people, therefore your data will differ from sample to sample.
However, if a difference is present (or not) in the population, then each sample should represent this
This means that the analysis and conclusion are likely to remain the same.
If I took a bigger sample …
The data will be more representative of the population.
The results will be more accurate.
The conclusion will be more accurate, and therefore the difference (if one exists) is stronger.
Also smaller differences are more able to be detected with a large sample than a small sample.
Population
Sample 1 Sample 2

Page48
Sample size
Which of these graphs is more accurate?
Which graph has smaller spread?
If we collect more data, we get more accurate.
This means that the spread decreases.
Therefore the accuracy of our conclusion is likely to
increase.
Page49
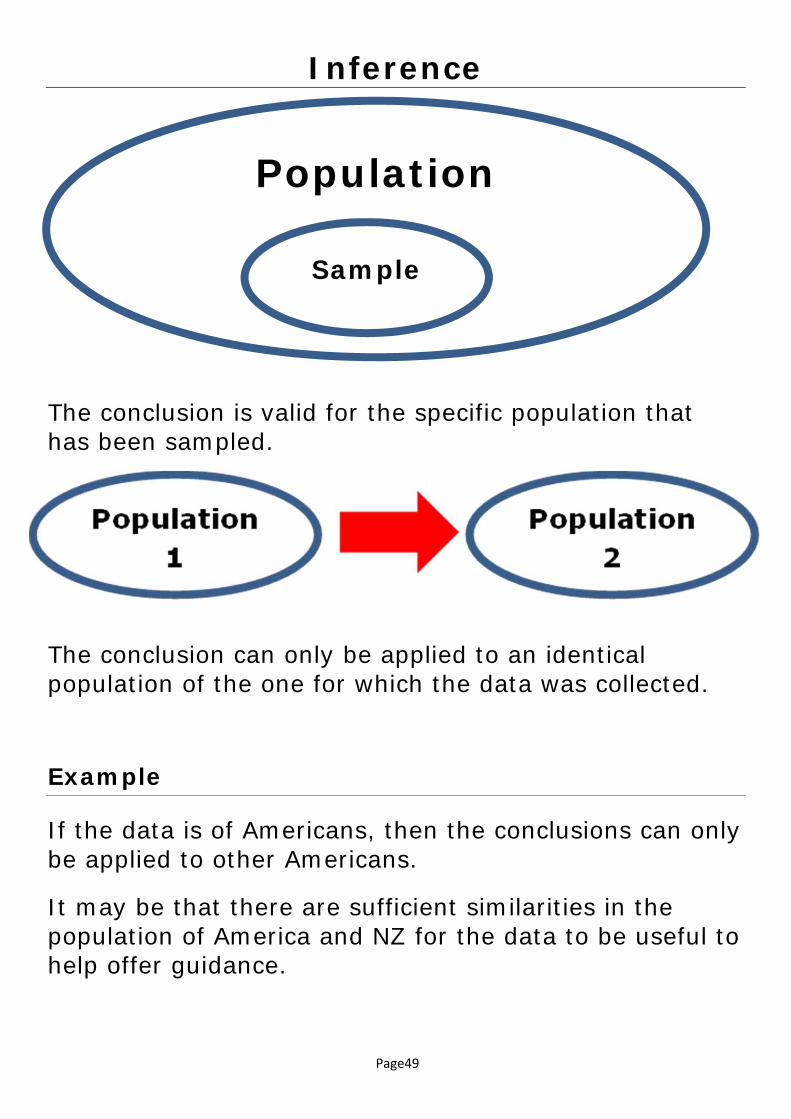
Inference
The conclusion is valid for the specific population that has been sampled.
The conclusion can only be applied to an identical population of the one for which the data was collected.
Example
If the data is of Americans, then the conclusions can only be applied to other Americans.
It may be that there are sufficient similarities in the population of America and NZ for the data to be useful to help offer guidance.
Population
Sample

Page50
Exercise:
1) Complete the following sentence:
The population of our school includes
2) Would a sample of 30 students from Aorere
be representative of the population of NZ?
Explain why/why not.
3) Why don’t we sample the entire population?

Page51
4) It is important for our samples to be randomly selected. Why?
5) Are the mean and median likely to always be the
same for every data set? Why/why not?
6) Consider house prices in Auckland, would you expect to see outliers? Or a skewed distribution? For example would you expect that there may be a few multi-million dollar houses in Auckland?

Page52
7) Would you predict that the house prices in Auckland are likely to be approximately Normally distributed (lovely bell-shaped curve), or skewed (long tail due to multiple outliers)? Why?
8) Draw a picture of what shape you expect the distribution to take, and predict where the mean and median would be.

Page53
9) Are the mean and median likely to be in the same place? Why/why not?
10) So which measure of center would best predict the price most Aucklanders could expect their house to be worth, the mean or the median? Why?
11) Now we want to form a more general rule: a) When are the mean and median likely to be
different? Why?

Page54
b) If the mean and median are the same, which represents the center best? The mean or the median? Why?
c) If the mean and median are different, which represents the center best? The mean or the median? Why?

Page55
12) What about measures of spread. When should you use the range? When should you use the IQR? Explain.