COMPARISON BSc Civil Eng. N. Seda Sopacı Hidro Dizayn...
17
SANİBEY DAM SPILLWAY HYDRAULIC CALCULATIONS AND MODEL STUDY COMPARISON BSc Civil Eng. N. Seda Sopacı Hidro Dizayn A.Ş. ABSTRACT: Sanibey Dam and HEPP is located on the Seyhan River in Adana Province and its primary purpose is power generation and irrigation. The scope of Sanibey Dam Project defines proposed spillway structure, on the left bank, should accommodate flood hydrograph peak discharge of 9,300 m 3 /s with flood routing. The design of spillway includes six (6) radial gates and a flip bucket. In this paper, we will provide a comparison between spillway hydraulic calculations and the physical model study results. It is perceived that the results of the model study are in compliance with the final design calculations. A further discussion will be given for the required design changes as per the results of the model test considering final design calculations. Aforementioned changes comprise revising the geometry of approach channel walls on the both banks, extending separation walls into the discharge channel, increasing the heights of side walls and providing ramp aerators in the chute channel. The model test studies for the dam spillway were carried out in accordance with the protocol signed between the Technical Research and Quality Control Department (TAKK) of DSİ and Yedigöze Power Generation and Trading Ltd. Co. dated 13/08/2007. 1 SCOPE The dam is 130 m high above foundation with 412 m crest length. The embankment is zoned rock-fill with concrete facing on upstream side, impounding a total volume of 643 million m 3 in the reservoir. The plant was equipped with two vertical Francis turbines and the total installed capacity is 318 MW. Its gross head is 96 m and total annual energy production for the present conditions is 942.82 GWh with 187.5 m 3 /s discharge. Total annual energy production for fully developed case including irrigation projects is 713.26 GWh. Spillway design hydraulic calculations in conjunction with the model test results will be summarised within the scope of Sanibey Dam and HEPP project.
Transcript of COMPARISON BSc Civil Eng. N. Seda Sopacı Hidro Dizayn...
SANİBEY DAM SPILLWAY HYDRAULIC CALCULATIONS AND MODEL STUDY
COMPARISON
BSc Civil Eng. N. Seda Sopacı
Hidro Dizayn A.Ş.
ABSTRACT: Sanibey Dam and HEPP is located on the Seyhan River in Adana Province and its
primary purpose is power generation and irrigation. The scope of Sanibey Dam Project
defines proposed spillway structure, on the left bank, should accommodate flood
hydrograph peak discharge of 9,300 m3/s with flood routing. The design of spillway includes
six (6) radial gates and a flip bucket. In this paper, we will provide a comparison between
spillway hydraulic calculations and the physical model study results. It is perceived that the
results of the model study are in compliance with the final design calculations. A further
discussion will be given for the required design changes as per the results of the model test
considering final design calculations. Aforementioned changes comprise revising the
geometry of approach channel walls on the both banks, extending separation walls into the
discharge channel, increasing the heights of side walls and providing ramp aerators in the
chute channel. The model test studies for the dam spillway were carried out in accordance
with the protocol signed between the Technical Research and Quality Control Department
(TAKK) of DSİ and Yedigöze Power Generation and Trading Ltd. Co. dated 13/08/2007.
1 SCOPE
The dam is 130 m high above foundation with 412 m crest length. The embankment is zoned
rock-fill with concrete facing on upstream side, impounding a total volume of 643 million m3
in the reservoir. The plant was equipped with two vertical Francis turbines and the total
installed capacity is 318 MW. Its gross head is 96 m and total annual energy production for
the present conditions is 942.82 GWh with 187.5 m3/s discharge. Total annual energy
production for fully developed case including irrigation projects is 713.26 GWh.
Spillway design hydraulic calculations in conjunction with the model test results will be
summarised within the scope of Sanibey Dam and HEPP project.

2 HYDRAULIC CALCULATIONS
2.1 INTRODUCTION
Spillway is designed to accommodate 9,000 m3/s routed Probable Maximum Flood (PMF)
peak safely. Six (6) radial gates are employed each 11.0 m high and 14.0 m wide. Energy of
the water conveyed from chute channel to the flip bucket is planned to be dissipated by the
water jet impinging to the riverbed.
2.2 FLOOD ROUTING
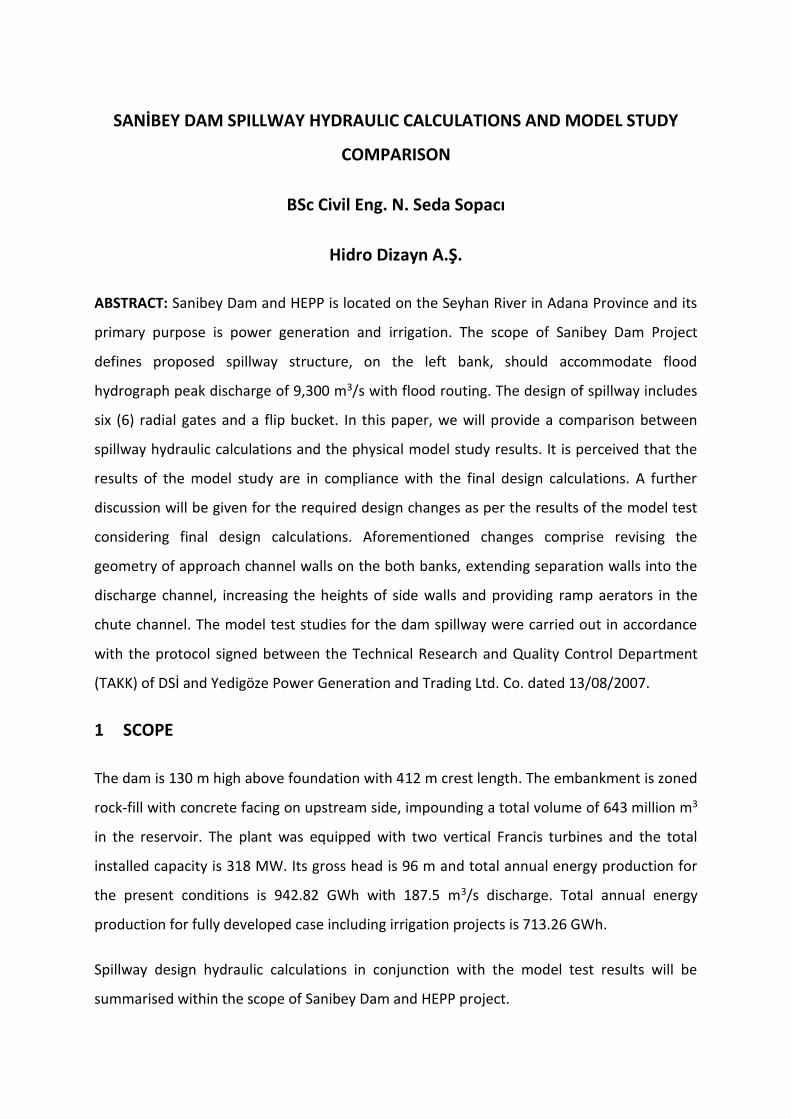
Spillway discharge capacity is calculated with the help of equation (1) given below where, C
is the spillway discharge coefficient depending on various parameters i.e. the ratio of P/Ho
(Figure 1) and upstream face slope (Figure 2).
Q = C.Le.H3/2 (1)
C is determined based on the ratio of He/Ho (Figure 3) for the heads (He) other than project
head (Ho).
Figure 1 Discharge coefficients for vertical-faced ogee crest spillways [1]
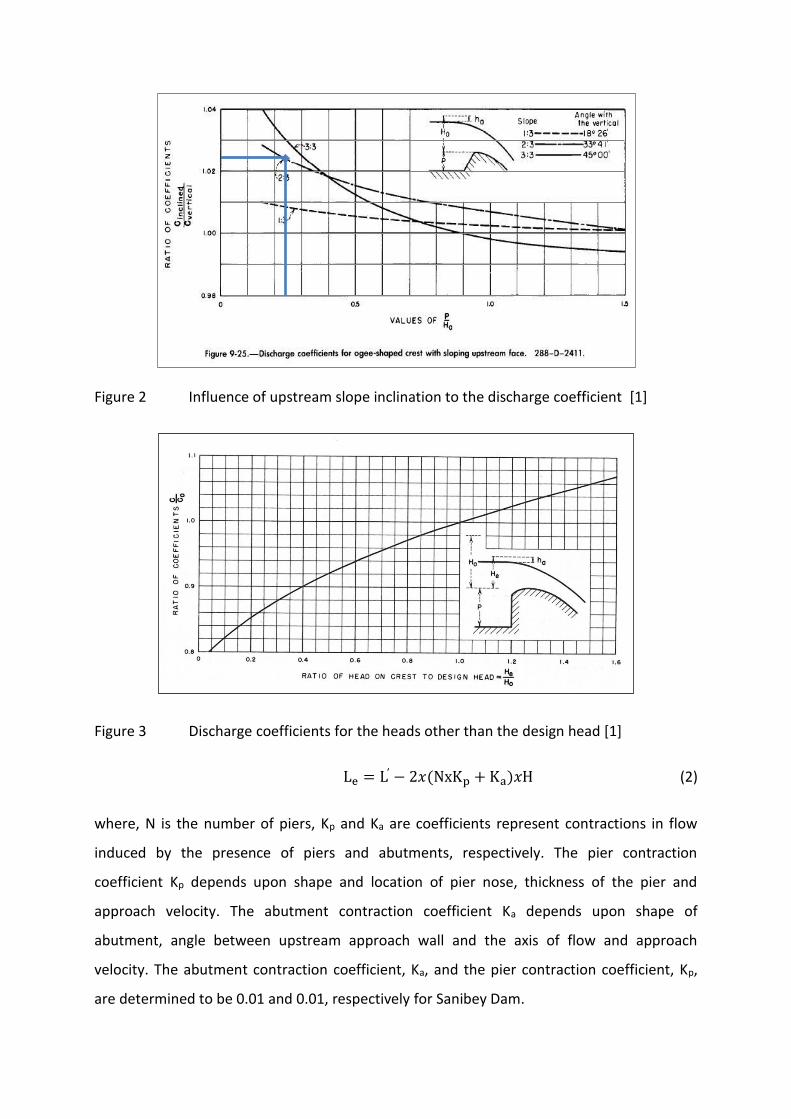
Figure 2 Influence of upstream slope inclination to the discharge coefficient [1]
Figure 3 Discharge coefficients for the heads other than the design head [1]
Le = L′ − 2𝑥(NxKp + Ka)𝑥H (2)
where, N is the number of piers, Kp and Ka are coefficients represent contractions in flow
induced by the presence of piers and abutments, respectively. The pier contraction
coefficient Kp depends upon shape and location of pier nose, thickness of the pier and
approach velocity. The abutment contraction coefficient Ka depends upon shape of
abutment, angle between upstream approach wall and the axis of flow and approach
velocity. The abutment contraction coefficient, Ka, and the pier contraction coefficient, Kp,
are determined to be 0.01 and 0.01, respectively for Sanibey Dam.

Rating curve is plotted by using equations (1) and (2) (Figure 4) and flood routing
calculations are carried out with the help of Elevation-Area-Volume Curves (

Table 1).
Figure 4 Spillway Discharge Rating Curve

Table 1 Sanibey Dam spillway flood routing calculations
2.3 OGEE CREST DESIGN
In general, the shape of an ogee profile depends upon the head, the inclination of the
upstream face of the overflow section, and the height of the overflow section above the
floor of the entrance channel.
Elements of nappe shaped crest profile is defined as it relates to axes at the apex of the
crest. The upstream portion from the origin is defined as both a single curve and a tangent
or as a compound circular curve. The portion at the downstream is defined by the following
equation:
y
H0=-K (
x
H0)
n
→ y
16.80=-0.503 (
x
16.80)
1.764
→ y=0.0613x1.764 (3)
in which K and n are constants whose values depend on the ratio of velocity of approach (ha)
to the design head (H0) given in [1]. The parameters requested for the Sanibey Dam spillway
are calculated by the equation (3) taken from [1].

2.4 HYDRAULICS OF CHUTE CHANNEL
Spillway chute channel accommodates three chutes with two separation walls. The thickness
of the separation walls is 1.0 m. Chute channel hydraulics are carried out by using equation
given in [1] for the middle channel in 26.4 m wide for the various discharges and
corresponding water velocities and water depths at various chainages are presented in Table
2, below. Cavitation indices as well as freeboard calculations are also given in the same
table.
Table 2 Chute Channel Hydraulic Calculations
Km Q Channel Bottom
B dn ∑hf Water Level
Cavitation Index
Freeboard Min. Wall
Height
Assumed Wall Level
- m3/s m m m m m m m m
0.00 1505.52 221.50 11.0 12.41 0.0006 233.91 3.62 1.56 13.96 235.46
1.70 1505.52 221.34 11.0 12.39 0.0075 233.68 3.61 1.56 13.95 235.33
6.81 1505.52 219.69 11.0 10.19 0.0314 229.07 2.20 1.69 11.88 234.47
11.92 1505.52 216.64 11.0 7.99 0.0865 223.24 1.20 1.88 9.87 230.16
17.03 1505.52 212.38 11.0 6.79 0.1862 217.40 0.81 2.03 8.82 225.23
25.14 1505.52 207.42 11.0 6.21 0.3860 213.12 0.65 2.12 8.32 216.80
37.49 3011.03 205.51 26.4 4.94 0.6654 210.42 0.55 2.07 7.01 212.69
58.32 3011.03 203.43 26.4 4.78 1.0838 208.18 0.51 2.10 6.88 210.35
79.16 3011.03 201.35 26.4 4.64 1.5425 205.96 0.48 2.13 6.77 208.15
100.00 3011.03 199.26 26.4 4.52 2.0415 203.76 0.45 2.16 6.68 205.97
108.68 3011.03 198.17 26.4 4.45 2.2627 202.58 0.43 2.18 6.63 204.87
117.36 3011.03 196.62 26.4 4.36 2.4979 200.90 0.41 2.20 6.56 203.31
126.03 3011.03 194.60 26.4 4.24 2.7535 198.72 0.39 2.23 6.47 201.29
151.53 3011.03 187.52 26.4 3.91 3.6543 191.29 0.32 2.32 6.23 194.00
185.43 3011.03 178.07 26.4 3.59 5.2026 181.53 0.26 2.42 6.00 184.31
219.34 3011.03 168.62 26.4 3.34 7.1627 171.84 0.23 2.50 5.85 174.70
244.25 3011.03 161.77 26.4 3.21 8.8677 164.89 0.20 2.56 5.76 167.70
251.16 3011.03 161.24 26.4 3.21 9.3565 164.44 0.20 2.56 5.76 167.00
258.08 3011.03 162.32 26.4 3.24 9.8408 165.48 0.21 2.54 5.79 168.41
265.00 3011.03 165.23 26.4 3.33 10.3309 168.19 0.22 2.51 5.84 170.78
In order to minimize spillway excavation, chute channel longitudinal slope is increased from
10% to ca. 28% at chainage 100 m. Aforementioned revision in slope is provided by a vertical
curve not to cause a local cavitation at this part of the chute.
2.4.1 Chute Areator Design
Cavitation indices were calculated along the chute channel for varies discharges and
presented in Table 2. Cavitation index decreases down to 0.2 starting from chainage
0+230.00 which indicates a need for aeration. Aeration is planned to be provided by a step in
1.25 m high along the chute and deflectors to be constructed on the separation walls. Since

the thickness of separation walls remain at its original thickness of 1.0 m after the location of
deflectors, only a sum of air supply will be provided from here and the rest will be supplied
from the aeration shafts to be built on the side and separation walls.
2.4.2 Flip Bucket
The flip bucket is employed as a energy dissipater for the Sanibey Dam spillway considering
surrounding topographical conditions. Flip bucket radius is selected to be 30.0 m and its
geometry is taken into the account when generating water surface profile computations.
Calculated velocities at the flip bucket lip are used to determine water jet impingement
point for various discharge values.
3 PHYSICAL MODEL STUDY
The model study for the dam spillway was carried out in accordance with the protocol signed
between the Technical Research and Quality Control Department of DSİ and Yedigöze Power
Generation and Trading Ltd. Co. dated 13/08/2007 as per the request letter no. 036 received
from SANKO HOLDING Yedigöze Power Generation and Trading Ltd. Co on 26 July 2007 .
Figure 5 General view of spillway as per the original design

Figure 6 General view of spillway as per the original design
Studies were conducted with a 1:70 scale model for Sanibey Dam spillway. Froude similarity
criteria were used to define the model considering negligibility of viscosity forces beside the
gravity and inertial forces. Thus, results of the model study can be converted into the
prototype values in accordance with the Froude similarity law. Correlations used between
model and prototype are presented in Table 3, below.
Table 3 Formulas and scale ratios used between model and prototype
Parameters Unit Formula Scale
Length (L) m KL=LP/LM 70
Velocity (U) m/s KU=KL1/2 8.3666
Discharge (Q) m3/s KQ5/2 40996.34

3.1 APPROACH CHANNEL AND SPILLWAY FLOW CONDITIONS
When routed discharge of 9,000 m3/s is released through the approach channel built
as per the original project, flow separation occurred along both left and right bank walls (
Figure 7). Uniform flow was not provided and some contractions in flow were observed that
results in a discharge capacity drop especially for the spillway outer gates located on the
both sides.
Figure 7 Flow conditions at approach channel built as per the original design with routed
discharge of 9,000 m3/s
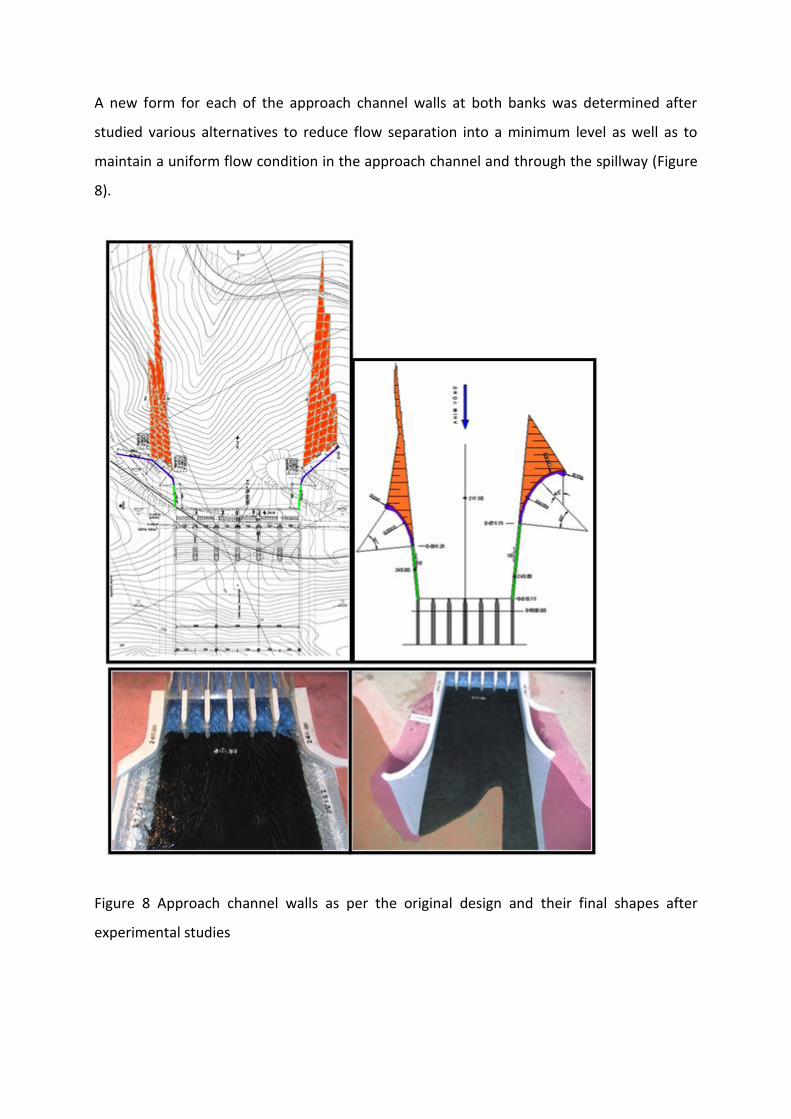
A new form for each of the approach channel walls at both banks was determined after
studied various alternatives to reduce flow separation into a minimum level as well as to
maintain a uniform flow condition in the approach channel and through the spillway (Figure
8).
Figure 8 Approach channel walls as per the original design and their final shapes after
experimental studies

3.2 SPILLWAY DISCHARGE CAPACITY
Discharge capacity was determined for fully and partially open gates within the scope of
spillway discharge capacity studies and presented in the chart below.
Figure 9 Spillway discharge rating curve for fully and partially open gates
When the results of physical model study compared against the final design calculations, it
was observed that the spillway discharge curve determined from the model study for fully
open gates is the same with the theoretical discharge curve given in the analysis. However,
theoretical discharge curves for partially open gates are lower than the results received from
the model study. When computing discharge curves for partially open gates, Plate 6-1 given
in [2], which is referred in [1], was used and computations are presented in Figure 10 for
gate openings of 2.0 m and 4.0 m as an example. Discharge coefficients received from the
model study is marked with red dots on the Plate 6-1 shown in Figure 10. It was examined
that when gate opening are increased the theoretical values get closer the values in the
model study discharge curve.

Figure 10 Theoretical discharge calculations for partially open gates (h=2m , h=4 m)
3.3 CHUTE CHANNEL SEPARATION WALL EFFECTS ON THE FLOW
The piers at a gated spillway cause contraction of the flow. No smooth flow passage from
the approach channel to chute channel was observed for the maximum discharge in the
model study for the original design of the piers in conjunction with the separation walls
(Figure 11). Sharp contractions due to the high flow velocities between the piers prevented
occurrence of a smooth flow along the chute channel. Dead zones were formed along the
chute due to the separations from the flow line.
Local shock waves due to merging flows caused increased water depths and water jumping
was observed over the separation wall to the adjacent channel (Figure 12).
Re-arrangement in the geometry of piers was conducted to stabilize the flow conditions at
the chute channel.
G₀= 4.12 Adım : 1.00 m
β= 72.21 C= 0.679
6.00 4.05 66.00 1646.355 227.500
7.00 5.05 66.00 1838.609 228.500
8.00 6.05 66.00 2012.581 229.500
9.00 7.05 66.00 2172.667 230.500
10.00 8.05 66.00 2321.740 231.500
11.00 9.05 66.00 2461.804 232.500
12.00 10.05 66.00 2594.316 233.500
13.00 11.05 66.00 2720.381 234.500
14.00 12.05 66.00 2840.858 235.500
15.00 13.05 66.00 2956.429 236.500
16.00 14.05 66.00 3067.649 237.500
16.80 14.85 66.00 3153.802 238.300
He
(m)
H
(m)
L
(m)
Q
(m3/s)
RSS
(m)
G₀= 2.22 Adım : 1.00 m
β= 62.37 C= 0.672
4.00 3.09 66.00 768.555 225.500
5.00 4.09 66.00 884.056 226.500
6.00 5.09 66.00 986.120 227.500
7.00 6.09 66.00 1078.568 228.500
8.00 7.09 66.00 1163.695 229.500
9.00 8.09 66.00 1243.006 230.500
10.00 9.09 66.00 1317.551 231.500
11.00 10.09 66.00 1388.099 232.500
12.00 11.09 66.00 1455.230 233.500
13.00 12.09 66.00 1519.399 234.500
14.00 13.09 66.00 1580.965 235.500
15.00 14.09 66.00 1640.222 236.500
16.00 15.09 66.00 1697.411 237.500
16.80 15.89 66.00 1741.811 238.300
He
(m)
H
(m)
L
(m)
Q
(m3/s)
RSS
(m)

Figure 11 Flow pattern before and after the re-arrangement in the geometry of piers
Figure 12 Chute channel before the re-arrangement in the geometry of piers
3.4 THE RISK OF CAVITATION EVALUATION
Verification of the cavitation risk along the chute is made by determination of the cavitation
index at certain points along the channel.
The high probability of cavitation occurring is expected at the locations with high flow
velocities. Therefore, the cavitation indices are investigated at four different locations
(Figure 13) for four different discharges between the vertical curve, where the high flow
velocities and change in the longitudinal slope starts, and the location which aerators are
located by using pitot tube to measure velocity and water depth changes in the flow.
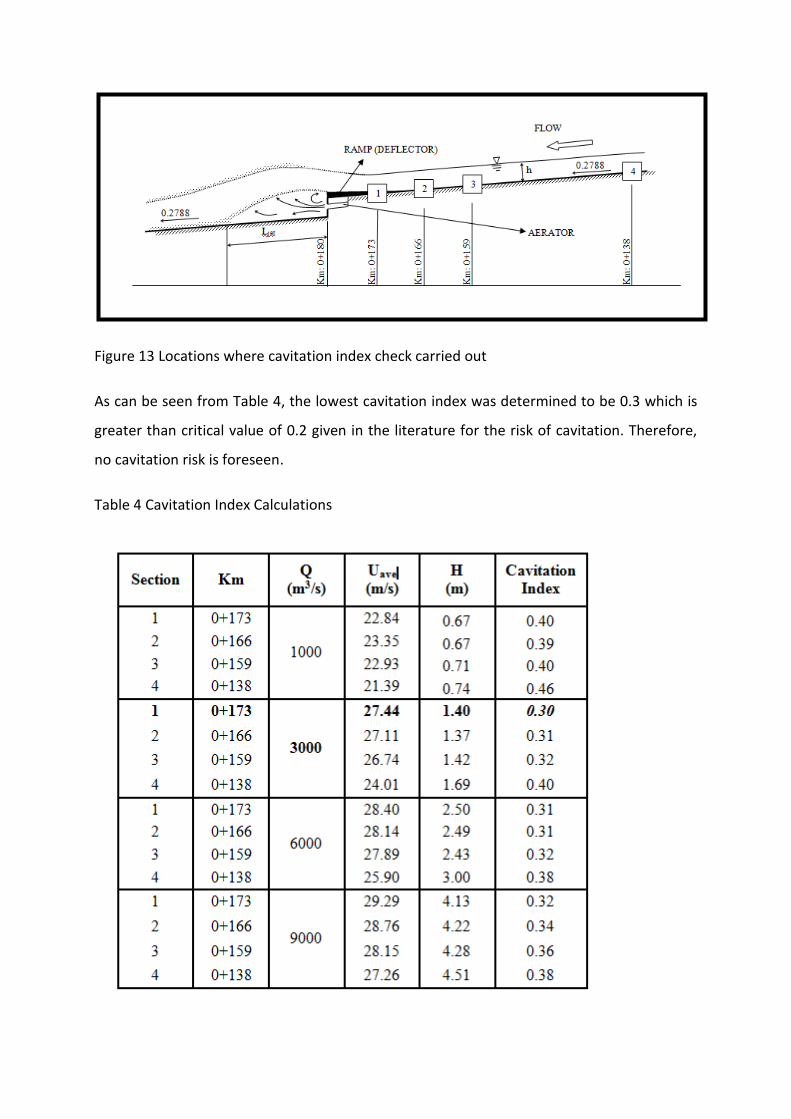
Figure 13 Locations where cavitation index check carried out
As can be seen from Table 4, the lowest cavitation index was determined to be 0.3 which is
greater than critical value of 0.2 given in the literature for the risk of cavitation. Therefore,
no cavitation risk is foreseen.
Table 4 Cavitation Index Calculations
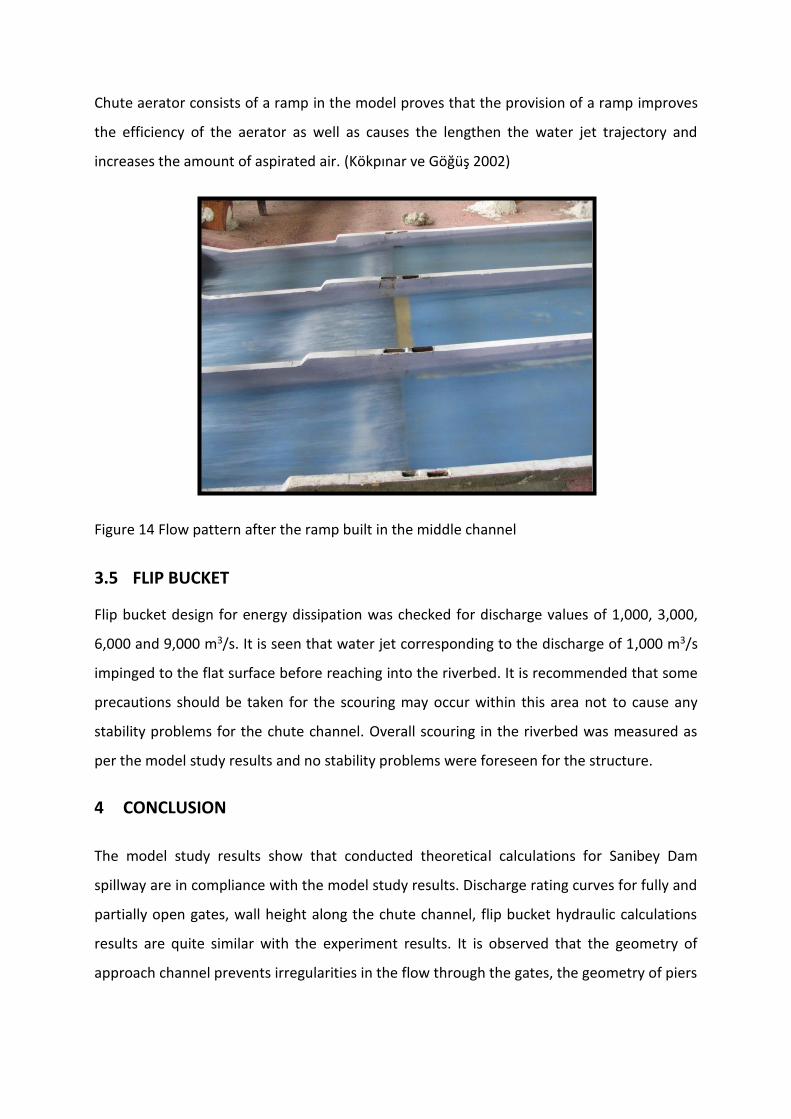
Chute aerator consists of a ramp in the model proves that the provision of a ramp improves
the efficiency of the aerator as well as causes the lengthen the water jet trajectory and
increases the amount of aspirated air. (Kökpınar ve Göğüş 2002)
Figure 14 Flow pattern after the ramp built in the middle channel
3.5 FLIP BUCKET
Flip bucket design for energy dissipation was checked for discharge values of 1,000, 3,000,
6,000 and 9,000 m3/s. It is seen that water jet corresponding to the discharge of 1,000 m3/s
impinged to the flat surface before reaching into the riverbed. It is recommended that some
precautions should be taken for the scouring may occur within this area not to cause any
stability problems for the chute channel. Overall scouring in the riverbed was measured as
per the model study results and no stability problems were foreseen for the structure.
4 CONCLUSION
The model study results show that conducted theoretical calculations for Sanibey Dam
spillway are in compliance with the model study results. Discharge rating curves for fully and
partially open gates, wall height along the chute channel, flip bucket hydraulic calculations
results are quite similar with the experiment results. It is observed that the geometry of
approach channel prevents irregularities in the flow through the gates, the geometry of piers

controls the unexpected turbulence in the chute channel and chute aerator consists a ramp
lowers the risk of cavitation significantly based on the results of the model study.
ACKNOWLEDGMENTS: We would like to give very special thanks to Mr. Tuncay Başer
who performed the design studies as well as to Dr. Mehmet Ali Kökpınar and Dr. Yurdagül
Kumcu who carried out the model studies.
REFERENCES:
[1] USBR. (1987). Design of Small Dams. A Water Resources Technical Publication.
[2] U.S. Army Corps of Engineers, (1992). Hydraulic Design of Spillways
[3] Kumcu, Y. (2008). Yedigöze Barajı ve HES Dolusavak Hidrolik Çalışmaları Model Raporu.
Ankara: DSİ Teknik Araştırma Kalite Kontrol Dairesi Başkanlığı.
[4] Kökpınar, M. A., & Göğüş, M. (2002). High-Speed Jet Flows over Spillway Aerators.
Canadian Journal of Civil Engineering (29), 885-898.