Comparison between probe-based TaqMan and HRM … between probe-based TaqMan and HRM detection for...
22
Comparison between probe-based TaqMan and HRM detection for SNP analysis considering genotyping of APOE Honours Thesis in Biomedicine, Advanced level 30 ECTS (09-01-16 – 09-06-03) Author Malin Eckerman [email protected] Biomedicine, 4 th year Supervisors Eva Arkblad [email protected] Chemist, PhD Annica Wester [email protected] Biologist School of Life Sciences Skövde University BOX 408 SE-541 28 Skövde Sweden
Transcript of Comparison between probe-based TaqMan and HRM … between probe-based TaqMan and HRM detection for...
Comparison between probe-based
TaqMan and HRM detection for
SNP analysis considering genotyping
of APOE
Honours Thesis in Biomedicine, Advanced level
30 ECTS
(09-01-16 – 09-06-03)
Author
Malin Eckerman
Biomedicine, 4th year
Supervisors
Eva Arkblad
Chemist, PhD
Annica Wester
Biologist
School of Life Sciences Skövde University
BOX 408 SE-541 28 Skövde
Sweden
ii
Abstract
Alzheimer’s disease is the most common form of senile dementia and it is
likely caused by degradation of the neurons in the brain which results in
memory and personality disorders. One known risk factor for Alzheimer’s
disease is an isoform of the Apo lipoprotein E (ApoE4). The common APOE
alleles results from two different SNPs that change the amino acid sequence,
these can be detected with several different methods. High resolution melt
analysis (HRM) is a new real time PCR technique that can measure the melt
curve change when dsDNA denaturates into ssDNA with high precision. In this
report, the HRM method has been compared with the probe based TaqMan
method to analyse APOE genotypes.
The HRM technique was not sensitive enough to separate all 6 genotypes in
one fragment and not robust enough to always assign the correct genotypes to
all samples. HRM is too sensitive to DNA quality and concentration, therefore
the TaqMan method was chosen for clinical genotyping of APOE.
Table of content
1 Introduction ......................................................................................................1
1.1 Alzheimer’s disease...................................................................................1
1.2 APOE .........................................................................................................2
1.3 TaqMan......................................................................................................4
1.4 HRM ..........................................................................................................5
1.5 Purpose ......................................................................................................7
2 Method .............................................................................................................7
2.1 DNA extraction..........................................................................................7
2.2 TaqMan......................................................................................................7
2.3 HRM ..........................................................................................................8
3 Results ..............................................................................................................9
3.1 DNA extraction..........................................................................................9
3.2 TaqMan....................................................................................................11
3.3 HRM ........................................................................................................11
4 Discussion ......................................................................................................15
5 Conclusion......................................................................................................18
6 References ......................................................................................................18

1
1 Introduction
Single nucleotide polymorphisms (SNPs) are single-base variations at specific
sites in the genome. The frequency of SNPs is about one in 300 bp in the
human genome, making it one of the most frequent sequence variations. SNPs
are frequently associated as a risk factor for several common diseases
(Garritano, et al. 2009), for example Alzheimer’s disease (AD). In AD one of
the Apo lipoprotein E (APOE) alleles (APOE ε4) is a risk factor and this allele
differ from the other to common alleles (APOE ε2 and APOE ε3) in two SNPs
(Laws, et al. 2003). Probe-based TaqMan and the newer high resolution melt
(HRM) analysis, are examples of methods used for SNP genotyping which
both are based on real-time PCR in a closed vial format (Bass, et al. 2007).
1.1 Alzheimer’s disease
AD is a neurodegenerative disorder and the most common form of senile
dementia. AD is characterized by memory loss and impairment of higher order
cerebral functions like abstract thinking, judgment and personality. AD may be
categorized into Early-onset AD (EOAD) which develops between the ages of
40-65 and the more common Late-onset AD (LOAD) which develops after age
65. EOAD is usually due to hereditary single gene disorders, whereas LOAD is
only associated with several known risk factors including both environmental
and genetic (Laws, et al. 2003).
Until now the development of the disease is not entirely understood, but large
concentrations of neurofibrillary tangles and plaques in nucleus basalis,
hippocampus and parahippocampal gyrus are associated with AD (Laws, et al.
2003). These abnormalities are thought to result in loss of mental function
through degradation of neurons in the brain, which also results in a reduction of
the brain size. The tangles arise from tau that is a polymerized form of a
microtubule accessory protein. The plaques consist of fibrils from a protein
called amyloid-β (Aβ) (Laws, et al. 2003). Amyloid precursor protein (APP) is
an integral membrane protein, which gene is located in chromosome 21. Aβ is
produced through proteolytic cleavage of APP. APP mutations are the most
commonly found mutations in familiar EOAD. This affects the production or
aggregation properties of Aβ (Wolfe and Guénette 2007). People with Down’s
syndrome have a high incidence of AD because of one extra chromosome 21.
APP can also be over expressed as a consequence of different stimuli such as
ischemia, trauma or inflammation (Jellinger, et al. 2008).
The diagnosis of AD is based on memory functions, differential diagnosis and
investigations on the patient’s history. It is possible to measure the levels of
tau, phosphorylated-tau and Aβ in cerebrospinal fluid (CSF). Decreased levels
of Aβ, and increased levels of tau and phosphorylated-tau, are associated with
AD (Thal, et al. 2007). But the diagnosis can only be definite if it has been
2
confirmed with a brain biopsy, in other cases were the diagnosis only is based
on observations of the patient mental state and biomarkers levels, it is only
defined as possible or probable AD. To further improve the diagnostic process
for AD newer tools and investigations are needed. (Gauthier, et al. 1997)
1.2 APOE
Apo lipoproteins are, through association with lipoproteins, involved in the
cholesterol and lipid transport in the body. There are several different forms of
Apo lipoproteins; ApoA, ApoB, ApoC, ApoD, ApoE and ApoJ. The main
function of ApoE is to transport cholesterol in the body and to maintain the
cholesterol homeostasis in the brain. In the periphery ApoE remove lipids by
interacting with LDL-receptors as a ligand. ApoE-bound-lipoproteins are
transferred into the hepatic parenchymal cells in the liver through endocytosis
by LDL-receptors and hence cleared from the plasma (Laws, et al. 2003). This
mechanism is also thought to occur in the CNS. Some data propose that ApoE
is involved in other neuronal homeostasis as well, like plasticity and repair of
damaged neural membrane (Laws, et al. 2003).
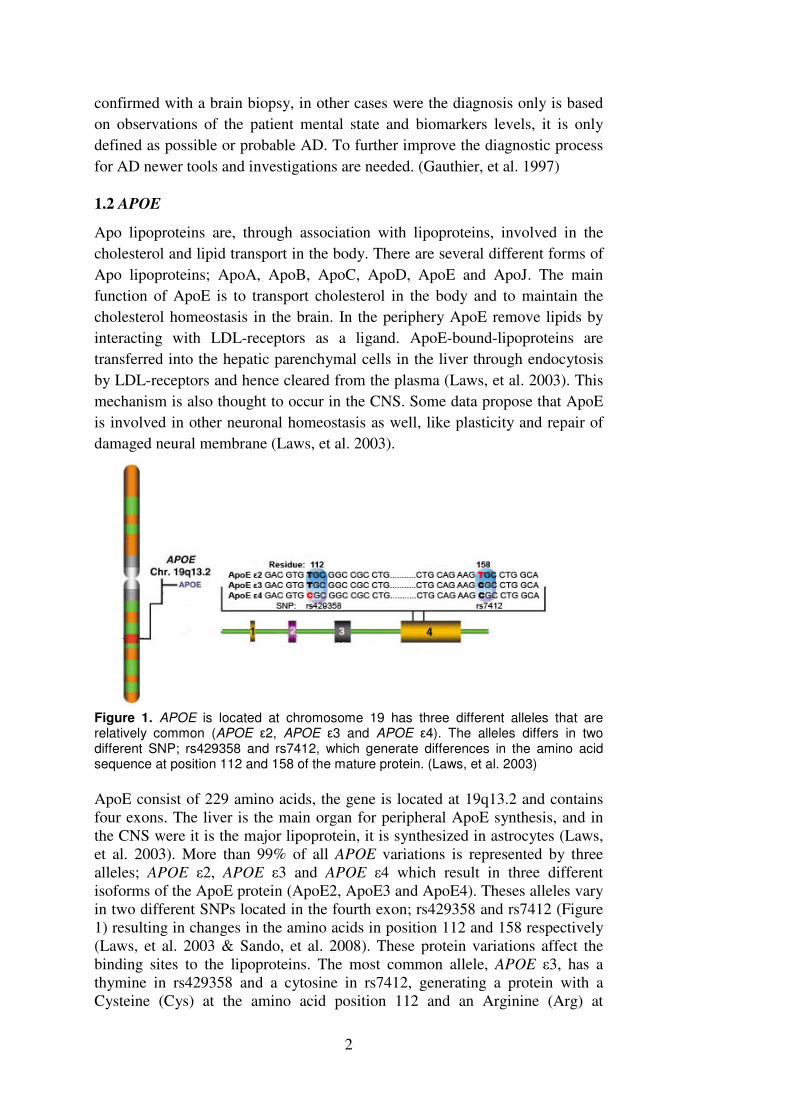
Figure 1. APOE is located at chromosome 19 has three different alleles that are relatively common (APOE ε2, APOE ε3 and APOE ε4). The alleles differs in two different SNP; rs429358 and rs7412, which generate differences in the amino acid sequence at position 112 and 158 of the mature protein. (Laws, et al. 2003) ApoE consist of 229 amino acids, the gene is located at 19q13.2 and contains four exons. The liver is the main organ for peripheral ApoE synthesis, and in the CNS were it is the major lipoprotein, it is synthesized in astrocytes (Laws, et al. 2003). More than 99% of all APOE variations is represented by three alleles; APOE ε2, APOE ε3 and APOE ε4 which result in three different isoforms of the ApoE protein (ApoE2, ApoE3 and ApoE4). Theses alleles vary in two different SNPs located in the fourth exon; rs429358 and rs7412 (Figure 1) resulting in changes in the amino acids in position 112 and 158 respectively (Laws, et al. 2003 & Sando, et al. 2008). These protein variations affect the binding sites to the lipoproteins. The most common allele, APOE ε3, has a thymine in rs429358 and a cytosine in rs7412, generating a protein with a Cysteine (Cys) at the amino acid position 112 and an Arginine (Arg) at

3
position 158. In APOE ε2 the cytosine in rs7412 is replaced with a thymine and this result in an amino acid change in position 158 into Cys. APOE ε4 has a substitution in rs429358 to cytosine and this produce a protein with change in position 112 to Arg (Laws, et al. 2003). The three alleles can be combined into six different genotypes; APOE ε2/ε2, APOE ε3/ε3, APOE ε4/ε4, APOE ε2/ε3, APOE ε3/ε4 and APOE ε2/ε4 (Laws, et al. 2003). Table 1 visualize the distribution of the alleles and genotype frequency, APOE ε3 is the most frequent allele in the Scandinavian population as well as the general population (60-90%) (Sando, et al. 2008).
Table 1
Allele and genotype frequency of APOE
Allele Frequency* APOE ε2 0-20% APOE ε3 60-90% APOE ε4 10-20% Genotype Frequency*
APOE ε2/ε2 0.7% APOE ε3/ε3 55.8% APOE ε4/ε4 2.3% APOE ε2/ε3 17.1% APOE ε3/ε4 20.0% APOE ε2/ε4 4.1% *For Scandinavian population according to Sando, et al. 2008.
The APOE ε4 allele is a risk factor and lowers the age of onset for AD,
especially LOAD. ApoE is assembled with Aβ in the AD susceptible regions of
the brain (Laws, et al. 2003). By having one APOE ε4 allele the risk of
developing AD is about 4 times higher in the Caucasian population than if the
allele not is present. If an individual is homozygote for the APOE ε4 allele, the
risk increases ten times of developing the disease compared to the genotypes
without APOE ε4, in Caucasians (Sando, et al. 2008). ApoE is thought to
influence the cholesterol level in the brain in an isoform manner, ApoE4
preferable binds to VLDL while the other two isotypes perferable binds HDL
(Lane and Farlow 2005). ApoE4 is supposed to remove lipoproteins faster from
plasma, resulting in decreased expression of LDL receptors and hence an
increase in plasma cholesterol (Lane and Farlow 2005). Several evidence
indicate that an increased cholesterol level will process more APP resulting in
more amplified Aβ and hence increased plaque formation (Vaya 2007). It has
been proposed that populations that orginates from hunter-gathering societies
are those with the highest frequencey of the APOE ε4 allele. The quality for the
allele to enhance the cholesterol uptake would have been a benefit for these
people because of their sporadic food supply (Corbo, et al. 1999). The APOE
ε4 allele is found in a higher frequency in the populations of northern Europe
compared to the southern Europe (Sando, et al. 2008). APOE ε4 is not a
causative factor for AD, it only confers an elevated risk of AD in certain
populations under certain environmental conditions. The analysis of APOE ε4

4
therefore cannot be used for predicting the development of AD, only as a factor
to further verify the diagnosis for a susceptible AD patients (Kidd 2008).
APOE ε4 is not only associated as a risk factor for AD. ApoE4 increase the
plasma cholesterol and this affects the susceptibility to be affected of coronary
diseases. Several studies also indicate that APOE ε4 carriers have a more
severe decline in cognition following head trauma, probably because of an
increase in Aβ accumulation. This also results in a poorer prognosis after
ischemic injury and stroke (Laws, et al. 2003).
1.3 TaqMan
A single stranded probe complementary to the template sequence is used in
TaqMan, also called double-dye oligonucleotide. The probe has a fluorophore
attached to its 5’ end and a quencher molecule attached to its 3’ end (Figure 2).
The real time PCR machine excites the fluorophore with laser and if there is a
quencher molecule nearby the fluorophore it transmits energy to the quencher
and this will prevent the fluorescent signal (Suzuki, Yoshida and Nakano
2005). During PCR amplification, the probe will hydrolyse to its
complementary sequence. Taq polymerase will extend the DNA strand from
primers bound to the amplicon and displace the 5’ end of the probe, resulting in
degradation of the probe as the Taq polymerase exonuclease activity continue
(Holland, et al. 1991). Consequently the fluorophore and the quencher will be
separated in the solution and the fluorescence can be measured in a
corresponding wavelength as the fluorescence increases during the
amplification. Different probes are used for different alleles/sequence
alterations and each probe has a fluorophore which transmit light in a specific
wavelength, making it possible to separate the different genotypes (Suzuki,
Yoshida and Nakano 2005).

5
1. Forward primer F Q
5’
3’ 5’
5’ 3’ 5’
Reverse primer
F
2. Forward primer Q
5’
3’ 5’
5’ 3’
F 5’
Reverse primer
3. Forward primer Q
5’
3’ 5’
5’ 3’
F 5’
Q Reverse primer
4. Forward primer
5’
3’ 5’
5’ 3’ 5’
Reverse primer
Figure 2. A TaqMan probe contains a fluorophore (F) and a quencher molecule (Q).
When the fluorophore and quencher is connected the fluorophore will not emit light. As
it extend the sequence from the primers, Taq polymerase will degrade the probe
resulting in a separation of the fluorophore and the quencher hence the fluorescence
can be measured. The measured fluorescence will directly correlate to the amount of
PCR-product that is synthesized.
1.4 HRM
High resolution melt analysis (HRM) is a technique based on analysis of the
melt curve when dsDNA separate into ssDNA during increased temperature.
This is a real time PCR method that can visualize the melting behaviour of the
product through a fluorescent dye. The fluorescent dye binds to dsDNA during
the PCR amplification resulting in an increase of fluorescence. HRM starts
after the amplification through an incremental increase of the temperature,
resulting in a separation of the dsDNA to ssDNA. When the dsDNA separates
the fluorescent dye releases and the fluorescence decreases, this is visualised in
a characteristic melt curve (Figure 3) (Bass, et al. 2007).
6
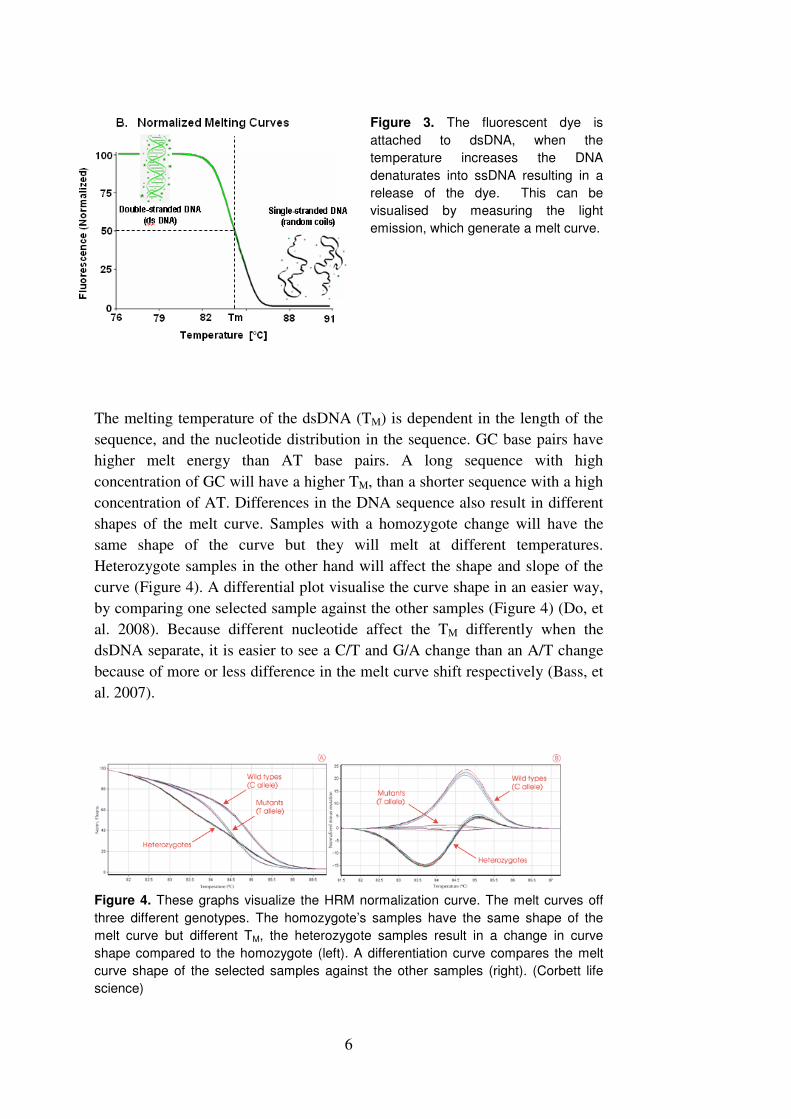
Figure 3. The fluorescent dye is
attached to dsDNA, when the
temperature increases the DNA
denaturates into ssDNA resulting in a
release of the dye. This can be
visualised by measuring the light
emission, which generate a melt curve.
The melting temperature of the dsDNA (TM) is dependent in the length of the
sequence, and the nucleotide distribution in the sequence. GC base pairs have
higher melt energy than AT base pairs. A long sequence with high
concentration of GC will have a higher TM, than a shorter sequence with a high
concentration of AT. Differences in the DNA sequence also result in different
shapes of the melt curve. Samples with a homozygote change will have the
same shape of the curve but they will melt at different temperatures.
Heterozygote samples in the other hand will affect the shape and slope of the
curve (Figure 4). A differential plot visualise the curve shape in an easier way,
by comparing one selected sample against the other samples (Figure 4) (Do, et
al. 2008). Because different nucleotide affect the TM differently when the
dsDNA separate, it is easier to see a C/T and G/A change than an A/T change
because of more or less difference in the melt curve shift respectively (Bass, et
al. 2007).
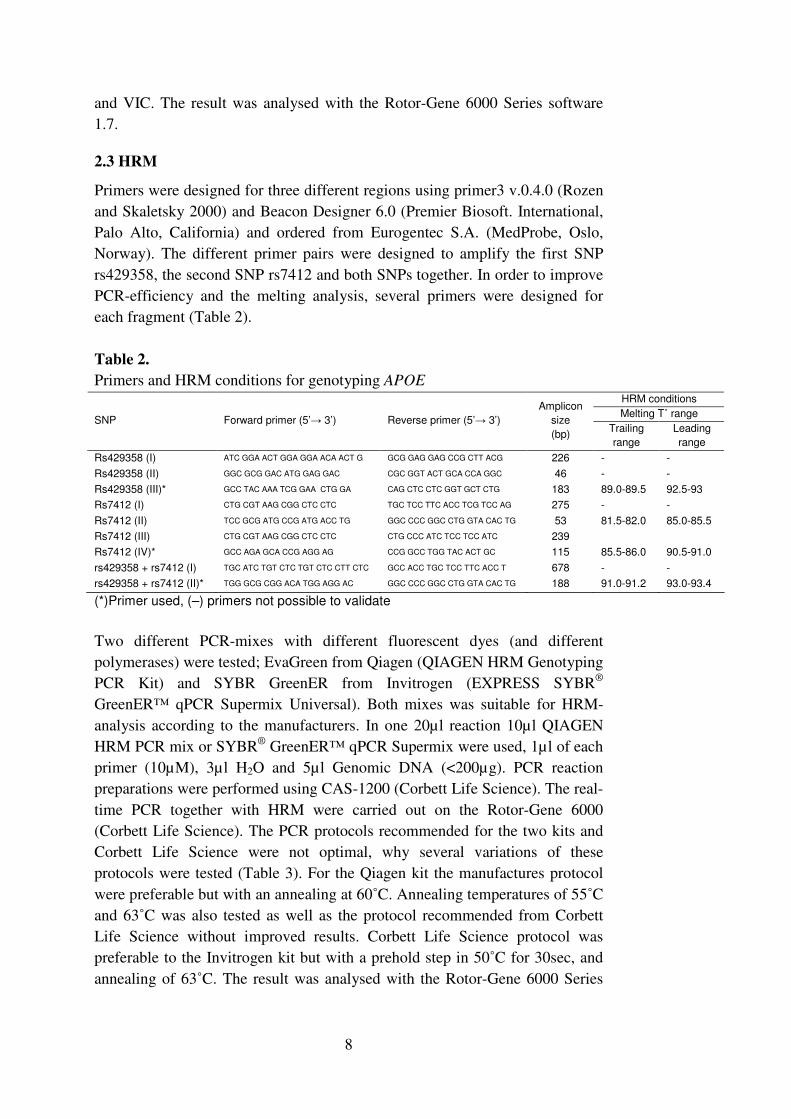
Figure 4. These graphs visualize the HRM normalization curve. The melt curves off
three different genotypes. The homozygote’s samples have the same shape of the
melt curve but different TM, the heterozygote samples result in a change in curve
shape compared to the homozygote (left). A differentiation curve compares the melt
curve shape of the selected samples against the other samples (right). (Corbett life
science)

7
Newer less toxic fluorescent dyes have been introduced, making HRM possible
(EvaGreen, SYTO and LCGreen). This is the third generation dyes which can
bind to the DNA in a saturated manner, without poisoning the PCR reaction.
This prevents the rebinding that occurred with the older dyes during DNA
denaturation (Bass, et al. 2007).
1.5 Purpose
The purpose of this study was to evaluate the new HRM technique and
compare it with the probe based TaqMan method. To evaluate this method the
APOE-genotype was chosen since there is an interest in starting this as a
clinically available analysis at Unilabs in Skövde. This is also an investigation
of the resolution of HRM when analysing two SNPs in the same fragment.
There are plans to start analysis of genes were 2 or more known variations are
located close to each other. To perform this with the TaqMan technique is
expensive, since one probe is needed for each known allele. If this method
works well, there is an interest to apply it to all other SNP genotyping analyses
in the lab since the cost of the HRM method is lower than the cost of the
TaqMan method.
2 Method
2.1 DNA extraction
Genomic DNA was extracted from blood by BioRobot M48 (GenoVision,
Norway) with two different kits; Carboxy gDNA (NorDiag, Oslo, Norway) and
MagAttract DNA Blood Mini M48 kit (Qiagen, Hilden, Germany) according to
manufacturers manuals. Blood for DNA extraction were obtained from clinical
samples and all samples were blinded before the extractions. Control samples
for all six genotypes were obtained from Equalis (External quality assurance in
laboratory medicine in Sweden, Uppsala)
2.2 TaqMan
To evaluate the genotypes of the samples real time PCR with predesigned
TaqMan SNP Genotyping Assays (Applied Biosystem, Foster City, California)
for rs429358 (Assay ID: C___3084793_20) and rs7412 (Assay ID:
C___904973_10) were used. For one reaction were 0.5µl 40x primer/probe
mix, 10µl 2x TaqMan genotyping mix (Applied Biosystem), 4.5µl H2O and
5µl DNA (< 200ng) used. All pre-PCR steps were performed using CAS-1200
(Corbett Life Science, Cambridgeshire, UK). Real-time PCR cycling were
carried out on the Rotor-Gene 6000 analyser (Corbett Life Science) according
to the program used for other TaqMan assays (lactase, HFE, MTHFR, factor II
and factor V genotyping) in this laboratory; 50˚C for 2min, 95˚C for 10min,
45cycles at 92˚C 15sec, 60˚C 45sec, and 60˚C 15sec with acquiring to FAM
8
and VIC. The result was analysed with the Rotor-Gene 6000 Series software
1.7.
2.3 HRM
Primers were designed for three different regions using primer3 v.0.4.0 (Rozen
and Skaletsky 2000) and Beacon Designer 6.0 (Premier Biosoft. International,
Palo Alto, California) and ordered from Eurogentec S.A. (MedProbe, Oslo,
Norway). The different primer pairs were designed to amplify the first SNP
rs429358, the second SNP rs7412 and both SNPs together. In order to improve
PCR-efficiency and the melting analysis, several primers were designed for
each fragment (Table 2).
Table 2.
Primers and HRM conditions for genotyping APOE HRM conditions
Melting T˚ range SNP Forward primer (5’→ 3’) Reverse primer (5’→ 3’)
Amplicon
size
(bp) Trailing
range
Leading
range
Rs429358 (I) ATC GGA ACT GGA GGA ACA ACT G GCG GAG GAG CCG CTT ACG 226 - -
Rs429358 (II) GGC GCG GAC ATG GAG GAC CGC GGT ACT GCA CCA GGC 46 - -
Rs429358 (III)* GCC TAC AAA TCG GAA CTG GA CAG CTC CTC GGT GCT CTG 183 89.0-89.5 92.5-93
Rs7412 (I) CTG CGT AAG CGG CTC CTC TGC TCC TTC ACC TCG TCC AG 275 - -
Rs7412 (II) TCC GCG ATG CCG ATG ACC TG GGC CCC GGC CTG GTA CAC TG 53 81.5-82.0 85.0-85.5
Rs7412 (III) CTG CGT AAG CGG CTC CTC CTG CCC ATC TCC TCC ATC 239
Rs7412 (IV)* GCC AGA GCA CCG AGG AG CCG GCC TGG TAC ACT GC 115 85.5-86.0 90.5-91.0
rs429358 + rs7412 (I) TGC ATC TGT CTC TGT CTC CTT CTC GCC ACC TGC TCC TTC ACC T 678 - -
rs429358 + rs7412 (II)* TGG GCG CGG ACA TGG AGG AC GGC CCC GGC CTG GTA CAC TG 188 91.0-91.2 93.0-93.4
(*)Primer used, (–) primers not possible to validate
Two different PCR-mixes with different fluorescent dyes (and different
polymerases) were tested; EvaGreen from Qiagen (QIAGEN HRM Genotyping
PCR Kit) and SYBR GreenER from Invitrogen (EXPRESS SYBR®
GreenER™ qPCR Supermix Universal). Both mixes was suitable for HRM-
analysis according to the manufacturers. In one 20µl reaction 10µl QIAGEN
HRM PCR mix or SYBR® GreenER™ qPCR Supermix were used, 1µl of each
primer (10µM), 3µl H2O and 5µl Genomic DNA (<200µg). PCR reaction
preparations were performed using CAS-1200 (Corbett Life Science). The real-
time PCR together with HRM were carried out on the Rotor-Gene 6000
(Corbett Life Science). The PCR protocols recommended for the two kits and
Corbett Life Science were not optimal, why several variations of these
protocols were tested (Table 3). For the Qiagen kit the manufactures protocol
were preferable but with an annealing at 60˚C. Annealing temperatures of 55˚C
and 63˚C was also tested as well as the protocol recommended from Corbett
Life Science without improved results. Corbett Life Science protocol was
preferable to the Invitrogen kit but with a prehold step in 50˚C for 30sec, and
annealing of 63˚C. The result was analysed with the Rotor-Gene 6000 Series

9
software 1.7. Melting curves were normalized between two temperature ranges,
the leading range and the trailing range (Table 2).
Table 3
PCR conditions according to manufactures and variations of them used for the
different kits
3 Results
3.1 DNA extraction
There were differences in the amplification curves between the samples for
both the TaqMan method and the HRM and this affected the results. The
separations between heterozygote and homozygote samples for the TaqMan
were sometimes difficult to distinguish (Figure 5). The differences affected the
HRM more, with low amplification efficiency resulting in low fluorescence at
the start of the melt curve and these were sometimes complicated to categorise
into a specific genotype (Figure 6). Optimisation of the PCR did not change the
different appearance of the samples. By changing DNA extraction kit, from
Carboxy gDNA (NorDiag) to MagAttract DNA Blood Mini M48 kit (Qiagen),
Manufactures protocols Protocol Used
Qiagen QIAGEN HRM
Hold 5 min 95˚C Hold 5 min 95˚C
Denaturation 10 sec 95˚C Denaturation 10 sec 95˚C
Annealing/extension 30 sec 55˚C x40
Annealing/extension 30 sec 60˚C x40
HRM 2 sec 80-95˚C
0.1˚C
increments
HRM 2 sec 80-95˚C
0.1˚C
increments
Corbett life Science Invitrogen, SYBR® GreenER™
Prehold 30 sec 50˚C
Hold 5 min 95˚C Hold 2 min 95˚C
Denaturation 5 sec 95˚C Denaturation 5 sec 95˚C
Annealing/extension 10 sec 60˚C x40
Annealing/extension 10 sec 63˚C x40
HRM 2 sec 80-95˚C
0.1˚C
increments
HRM 2 sec 80-95˚C
0.1˚C
increments
Invitrogen
Pre-hold 2 min 50˚C
Hold 2 min 95˚C
Denaturation 15 sec 95˚C
Annealing/extension 1 min 60˚C x40
HRM 2 sec 80-95˚C,
0.1˚C
increments
10
the amplifications became more constant and the result was easier to interpret.
A comparison between the two extraction kits also revealed that it was not
possible to compare the genotypes in the HRM between samples prepared with
these two different kits (Figure 6) a problem not revealed with TaqMan. It was
later found that the NorDiag kit had an incorrect composition (to low
concentration of Proteinase K) from the supplier during the period when the
experiments were made and this probably affected the results. A correctly
composed NorDiag kit had probably affected the result less.
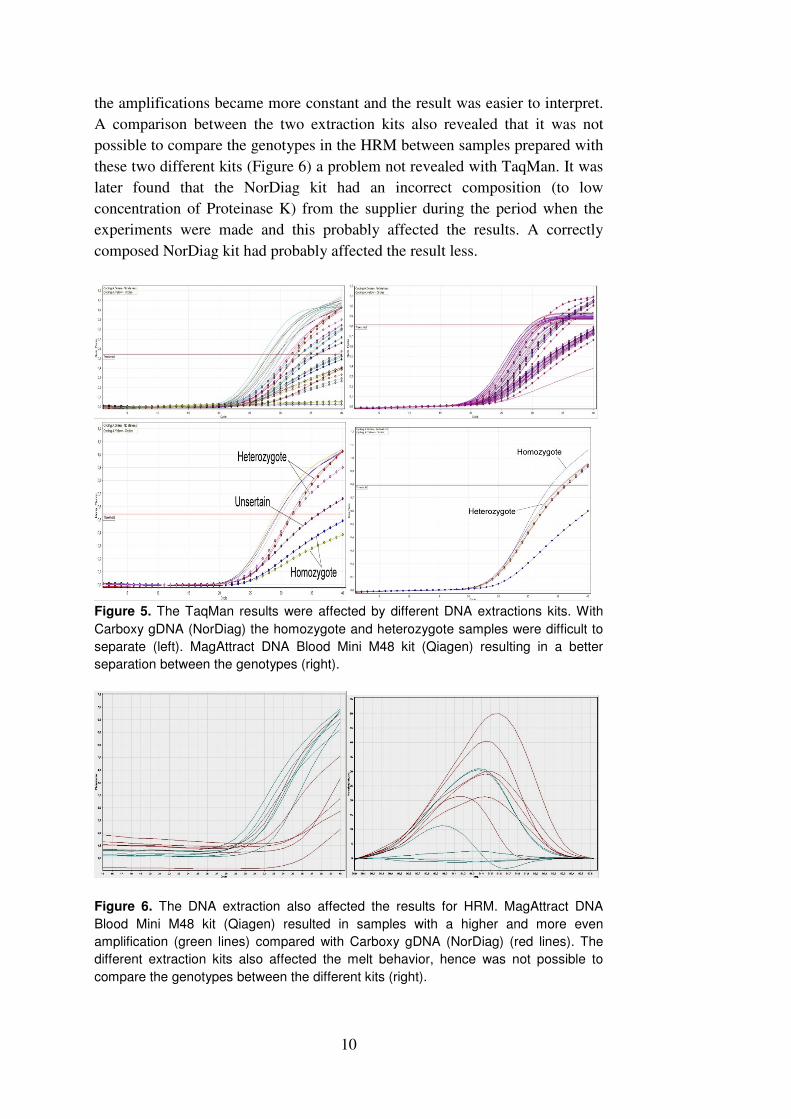
Figure 5. The TaqMan results were affected by different DNA extractions kits. With
Carboxy gDNA (NorDiag) the homozygote and heterozygote samples were difficult to
separate (left). MagAttract DNA Blood Mini M48 kit (Qiagen) resulting in a better
separation between the genotypes (right).
Figure 6. The DNA extraction also affected the results for HRM. MagAttract DNA
Blood Mini M48 kit (Qiagen) resulted in samples with a higher and more even
amplification (green lines) compared with Carboxy gDNA (NorDiag) (red lines). The
different extraction kits also affected the melt behavior, hence was not possible to
compare the genotypes between the different kits (right).
11
3.2 TaqMan
The probe based TaqMan method was used to find the six different genotypes,
and this was confirmed by comparing the samples with sequenced genotype
controls from the external quality centre, Equalis. The TaqMan was run seven
times for each genotype resulting in 486 investigated samples, three of these
runs had samples extracted with the NorDiag kit (222 samples). All seven runs
had similar distribution of the genotypes. The Qiagen extracted samples were
able to be genotyped with one single cut-off threshold. Within the NorDiag
extracted samples, about 50 were hard to genotype. The rs429358 analysis was
most difficult to distinguish the separation between homozygote and
heterozygote samples. Among the 486 samples investigated the genotypes were
found in a frequency close to that previously found in a Norwegian study
(Sando, et al. 2008)(Tab. 4). All samples extracted with the Qiagen kit could be
genotyped, but there was a high background from the VIC signal in the
rs429358 analysis giving lower confidence values in those genotype
assignments by the software. The disadvantage with this method is the cost,
two fluorescently labelled probes are needed for each SNP and this is quite
expensive compared to the HRM, where only primers and a fluorescent dye are
needed.
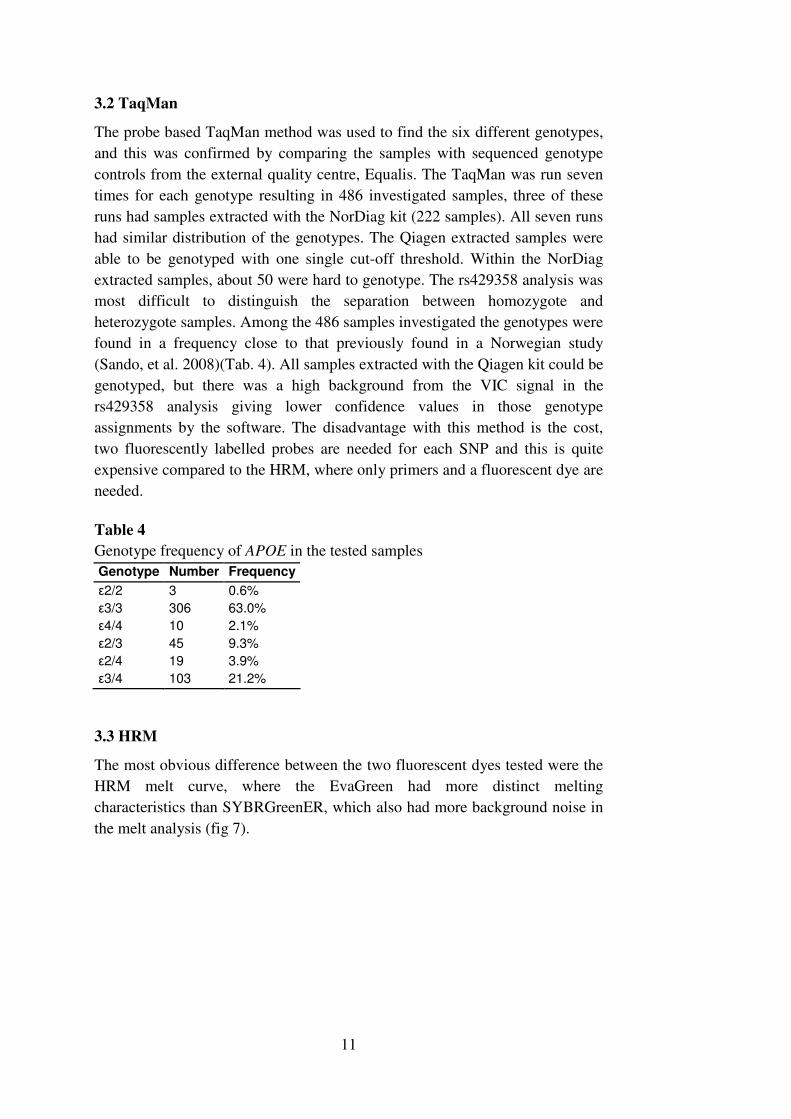
Table 4
Genotype frequency of APOE in the tested samples
Genotype Number Frequency
ε2/2 3 0.6%
ε3/3 306 63.0%
ε4/4 10 2.1%
ε2/3 45 9.3%
ε2/4 19 3.9%
ε3/4 103 21.2%
3.3 HRM
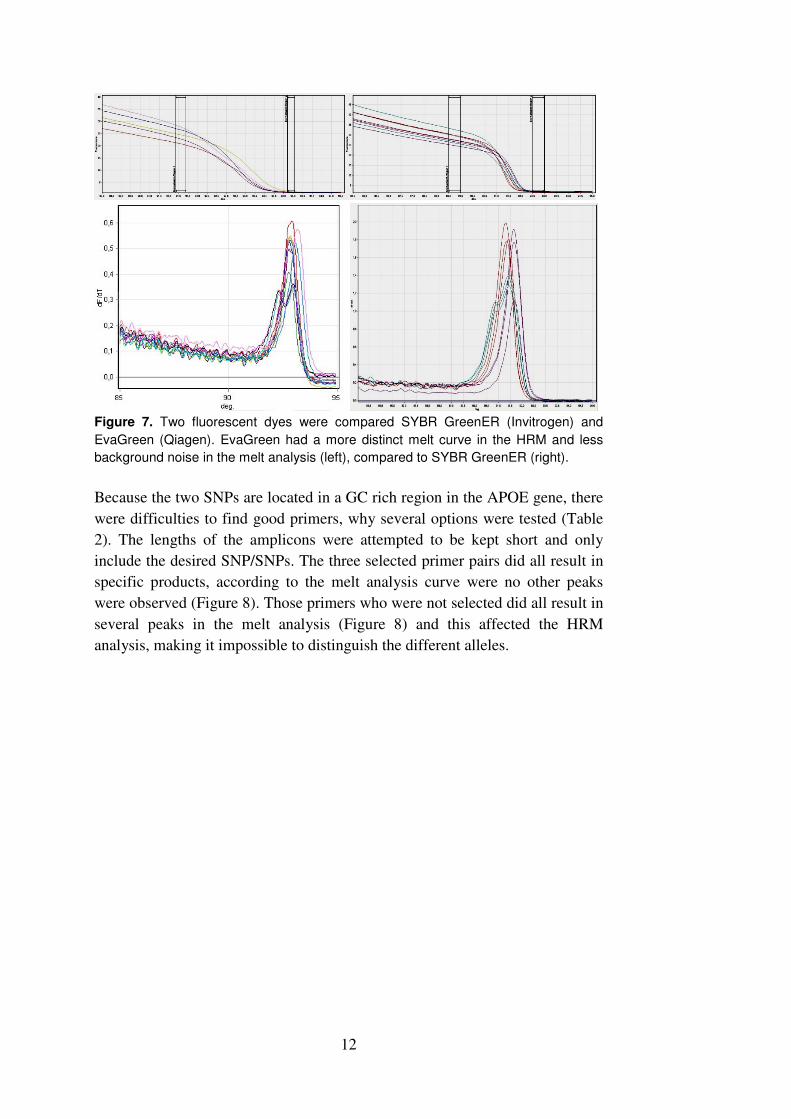
The most obvious difference between the two fluorescent dyes tested were the
HRM melt curve, where the EvaGreen had more distinct melting
characteristics than SYBRGreenER, which also had more background noise in
the melt analysis (fig 7).
12
Figure 7. Two fluorescent dyes were compared SYBR GreenER (Invitrogen) and
EvaGreen (Qiagen). EvaGreen had a more distinct melt curve in the HRM and less
background noise in the melt analysis (left), compared to SYBR GreenER (right).
Because the two SNPs are located in a GC rich region in the APOE gene, there
were difficulties to find good primers, why several options were tested (Table
2). The lengths of the amplicons were attempted to be kept short and only
include the desired SNP/SNPs. The three selected primer pairs did all result in
specific products, according to the melt analysis curve were no other peaks
were observed (Figure 8). Those primers who were not selected did all result in
several peaks in the melt analysis (Figure 8) and this affected the HRM
analysis, making it impossible to distinguish the different alleles.

13
Figure 8. According to the melt analysis curves all the PCR products were specifically
amplified for all three primer pairs since there were no other peaks than the expected.
This can be compared with one unspecific product for rs429258 (I) (Table 2).
When both SNPs were amplified in the same fragment it was not possible to
categorise all samples to the correct genotype. The genotypes located in the
middle of the panel, of different melting temperatures was most difficult to
separate, because of similar shape of the curves (Figure 9).
Figure 9. It was not possible to separate all genotypes when both SNPs were
amplified in the same fragment. Each genotype is labelled in the same colour in
triplicate.

14
A small unspecific amplicon for rs7412 (II) were possible to separate the
genotypes, but in an unreliable manner. By changing the primers the product
become more specific and the results more consistent (Figure 10).
Figure 10. The HRM were able to separate the genotypes for a short unspecific
product for rs7412, but in an unconfident manner (Rs7412 (II), left). By changing
primers to a longer fragment did the product become specific and the assignment of
genotypes became more confident (Rs7412 (IV), right).
The repetitiveness was tested for the fragments containing the separate SNPs,
by analysing three samples for each genotype in six different runs. The results
were most of the times possible to correctly interpret. Some samples with low
confidence were genotyped in a wrong way by the software (3.7% for
rs429358 and 6.3% for rs7412). But it was mostly possible to genotype them
correctly manually, with only one exception for a sample of rs7412 (TT instead
of CT).
If many samples were analysed together the samples had a large spread and it
was not possible to genotype all samples. Of 50 samples, 28% fall into the
incorrect genotype, because of similar curve shape (Figure 11). These wrongly
genotyped samples did not have a lower confidence level when assigned by the
software and were impossible to separate from the correctly genotyped ones by
eye. The PCR was repeated for the wrongly assigned samples together with
new extractions of the same samples. The old extractions did have similar
appearance as in the previously run. Most of the newly extracted samples were
not similar to the old extraction in the HRM, but still all samples were not
assigned to the correct genotype.

15
Figure 11. HRM with many samples at the same time resulted in a wide range of the
melting behaviour of the samples which make it difficult to analyse the genotype.
Rs429358 is to the left and rs7412 to the right, purple is homozygote TT, red
homozygote CC and green is heterozygote.
4 Discussion
The advantage with real time-PCR methods for SNP genotyping is the lowered
contamination risk because the whole analyze is carried out in a single closed
tube. Both the HRM and the probe based TaqMan method used are based on
real time PCR.
The HRM method has been introduced as a new method that is simple and
more cost effective than recent methods used in the field of genotyping
(Garritano, et al. 2009). This method has now been evaluated in an attempt to
genotype the AD susceptibility gene APOE. There are six different genotypes
of the APOE gene and these depend on two close SNPs. The purpose was to
investigate if the HRM method could be used in finding both SNPs in the same
16
PCR fragment, or if it was necessary to analyse them one at time. This was also
an investigation to compare the previously used probe based TaqMan method
to HRM.
The DNA extraction kit Carboxy gDNA (NorDiag) have previously been
validated as a good product and it was a replacement from the more expensive
extraction kit MagAttract DNA Blood Mini M48 kit (Qiagen). Because of the
uneven amplification and the difficulty in analysing samples extracted with the
Carboxy gDNA kit (NorDiag), problems which have not been found before,
the kit were returned for an examination to NorDiag. NorDiag investigated the
problem and found out that they had added the wrong concentration of
Proteinase K in the kit. Because the NorDiag kit had an incorrectly
composition, this affected the results both for TaqMan and HRM by disturbing
the amplification efficiency. With TaqMan some samples were difficult to
distinguish between heterozygote and homozygote. HRM is a method that is
very sensitive to DNA quality and amount and need as homogenous samples as
possible (Bass, et al. 2007). Because this not were achieved with the erroneous
NorDiag kit, the genotypes were sometimes difficult to categorize. HRM was
more affected by the incorrect kit than TaqMan, with more false genotypes and
the inability to compare samples extracted with the different kits. TaqMan is
therefore a more robust method compared to HRM.
The TaqMan method was used to find the different APOE genotypes. Because
probes are used, designed for each sequence variation, this is a very specific
method. To validate the TaqMan primer/probe mixes they were used to analyse
samples of all the six known genotypes (from Equalis) and all samples gave the
expected results. Among all samples tested (486), the APOE genotypes were
found in a similar distribution as that previously found in a Norwegian
population (Sando, et al. 2008). The genotype frequency was similar between
every run, including the samples extracted with NorDiag, and this might
indicate that most of the samples were correctly genotyped. This is a rather
expensive method because it is necessary to design one primer pair for the
sequence to be investigated and one probe for each different sequence
variations. Even though it is a rather sensitive and specific method it would be
interesting to replace it with a less expensive method.
To evaluate the HRM method different fluorescent dyes were tested (SYBR
GreenER from Invitrogen and EvaGreen from Qiagen) to compare the
behaviour of the melt curve. EvaGreen was more sensitive to the temperature
shift resulting in a more distinct melt curve compared to SYBR GreenER. This
can be explained through the different saturation between the dyes. SYBR
GreenER will not bind to the amplified product in a saturated manner why the
dyes can rebind to the DNA during the melt phase, resulting in a more flattened
melt curve. In comparison, EvaGreen will bind the DNA in a saturated way

17
and no rebinding can occur, consequently the melt curve becomes more distinct
(Figure 7). The results might also be affected by the different compositions of
the PCR mixes, like polymerase and buffers. It is much easier to normalize and
hence analyse a more distinct melt curve, why EvaGreen was the dye used for
HRM in this study. Whether or not it is the dye or the other compositions in
these mixes that affect the results are impossible to say from these analyses.
Three different fragments were amplified for the HRM; one for the first SNP
(rs429358), one for the second SNP (rs7412) and one for both SNPs. Because
of a GC rich region and the need of short amplicons it was difficult to obtain
any optimal primers, but it was possible to get specific products for all three
fragments in the amplification. The samples did not always reach full plateau
phase during the amplification and amplification started late in the run (~30).
By trying to optimise the PCR, it was not possible to achieve any large
improvement in the amplification of the samples. Maybe, this was affected by
the quality of the DNA. Because the samples did not reach full plateau phase
the HRM results was probably affected and the analysis less robust than it
would be with a more optimal PCR reaction.
Even though the amplification seemed to be specific, it was not possible to
separate all genotypes in a confident manner when analysing both SNPs in the
same fragment. The heterozygote genotypes all melted in a similar way making
it difficult to genotype the samples accurately (Figure 11).
After optimisation of the PCRs through primer design, PCR-mixes and
profiles, an acceptable result was achieved considering PCR-efficiency, clean
products and distinct melt curves. The repetitiveness of the method was tested
for each SNP by analysing three samples of each genotype six times, with
different DNA extractions each time. By analysing each SNP in separate
fragments it was possible to genotype the samples if the sample size was small.
The software used for automatic genotyping did sometimes categorize samples
into the wrong genotype with a low confidence, but it was possible to assign
the samples correct genotype manually. Two large analyses were also tested for
HRM were 50 samples were used. These test resulting in a wide range of
melting characteristics of the samples in the HRM analysis. The automatic
genotyping was not reliable, because it genotyped samples wrong with high
confidence numbers. It was not possible to do the right classification manually
either for all samples, because of the similarities between genotypes. These
results indicate that HRM is not robust enough for genotyping APOE. Similar
results have been found on the kdr mutations in Anopheles gambiae (Bass, et
al. 2007).
The HRM method is a very sensitive method that requires clean samples with
equal DNA concentrations among the samples and amplicon without too large
18
GC amount (Garritano, et al. 2009). Because the DNA extraction used at
Unilabs, Skövde is carried out automatically the samples will not be as clean as
the manual methods. In practise is it not possible to measure the DNA
concentration of each sample and normalise them to a specific DNA
concentration because of the time required. The region were the APOE SNPs
are located is very GC rich. It is generally more difficult to design good PCR
primers in GC rich areas. It is also, in the case of HRM analysis, necessary to
design very short PCR fragments since the high GC content also result in
relatively high melting temperatures of the PCR fragments and the melting
temperature of the fragment need to be as low as possible to maximise the
resolution of the HRM analysis. All these factors affects the HRM, it would be
interesting to perform the analysis with another gene sequence with less GC
content to analyse if the results become more robust, or if the other factors are
more important.
Because TaqMan resulted in more reliable results and was a more robust
method this will be the method of choice for genotyping APOE at Unilabs in
Skövde. To further verify these results before the analysis is started, a couple
of samples from each genotype could be sequenced, to see if the genotypes are
correct.
5 Conclusion
Even though the probe based TaqMan is nearly three times as expensive for
every samples as the HRM, it is less sensitive to the quality and concentration
of the DNA. HRM is only good enough if the samples are sufficient
homogenous and if the investigated sequence is without too much GC. It would
be interesting to analyse other genes to further investigate the HRM method.
6 References
Bass, C., et al. “Detection of knockdown resistance (kdr) mutations in
Anopheles gambiae: a comparison of two new high-throughput assays with
existing methods.” Malar J 6, no. 111 (2007).
Corbo, R.M., R. Scacchi, O. Rickards, C. Martinez-Labarga, and G.F. De
Stefano. “An investigation of human apolipoproteins B and E polymorphisms
in two African populations from Ethiopia and Benin.” Am J Hum Biol 3, no. 11
(1999): 297-304.
Do, H., M. Krypuy, P.L. Mitchell, S.B. Fox, and A. Dobrovic. “High resolution
melting analysis for rapid and sensitive EGFR and KRAS mutation detection in
formalin fixed paraffin embedded biopsies.” BMC Cancer 8, no. 142 (2008).

19
Garritano, S., et al. “Determining the effectiveness of High Resolution Melting
analysis for SNP genotyping and mutation scanning at the TP53 locus.” BMC
Genetics 10, no. 5 (2009).
Gauthier, S., M. Panisset, J. Nalbantoglu, and J. Poirier. “Alzheimer’s disease:
current knowledge, management and research.” CAN MED ASSOC J, no. 8
(1997): 157.
Holland, P. M., R. D. Abramson, R. Watson, and D. H. and Gelfand.
“Detection of specific polymerase chain reaction product by utilizing the 5' -*
3' exonuclease activity of Thermus aquaticus DNA polymerase.” Biochemistry
88 (1991): 7276-7280.
Jellinger, K.A., B. Janetzky, J. Attems, and E. Kienzl. “Biomarkers for early
diagnosis of Alzheimer disease:‘ALZheimer ASsociated gene’ – a new blood
biomarker?” J. Cell. Mol. Med 12, no. 4 (2008): 1094-1117.
Kidd, P.M. “Alzheimer’s Disease, Amnestic Mild Cognitive Impairment, and
Age-Associated Memory Impairment: Current Understanding and Progress
Toward Integrative Prevention.” Alternative Medicine Review 13, no. 2 (2008):
85-115.
Lane, R.M., and M.R. Farlow. “Lipid homeostasis and apolipoprotein E in the
development and progression of Alzheimer disease.” Journal of lipid research
5, no. 46 (2005): 949-968.
Laws, SM, E. Hone, S. Gandy, and RN. Martins. “Expanding the association
between the APOE.” Journal of Neurochemistry, no. 84 (2003): 1215–1236.
Rozen, S., and H.J. Skaletsky. “Primer3 on the WWW for general users and for
biologist programmers Humana Press.” Bioinformatics Methods and Protocols:
Methods in Molecular Biology ( Krawetz S, Misener S ), 2000: 365-386.
Sando, S., et al. “APOEε4 lowers age at onset and is a high risk factor for
Alzheimer's disease; A case control study from central Norway.” BMC
Neurology 8, no. 9 (2008).
Suzuki, N., A. Yoshida, and Y. Nakano. “Quantitative Analysis of Multi-
Species Oral Biofilms by TaqMan Real-Time PCR.” Clin Med Res. 3, no. 3
(2005): 176–185.
Thal, L., et al. “The Role of Biomarkers in Clinical Trials for Alzheimer
Disease.” Alzheimer Dis Assoc Disord 20, no. 1 (2007): 6-15.
Vaya, J. and Schipper, H.M. “Oxysterols, cholesterol homeostasis, and
Alzheimer disease.” Journal of Neurochemistry, no. 102 (2007): 1727-1737.
Wolfe, M.S, and S.Y. Guénette. “APP at a glance.” Journal of Cell Science, no.
120 (2007): 3157-3161.