A Statistical Approach to Gas Distribution Modelling with ...
Upload
duonghuongCategory
view
221download
0
Institute of Food Sciences,
National Research Council – Avellino (Italy)
E. Del Prete, S. Dotolo, A. Marabotti, A. Facchiano
COMPARISON BETWEEN
HEURISTIC AND STATISTICAL ANALYSIS ON PROTEIN
STRUCTURAL PROPERTIES
E. Del Prete, S. Dotolo, A. Marabotti, A. Facchiano
15th International Workshop on Network Tools and Applications for Biology
11th Integrative Bioinformatics International Symposium
October 15th, 2015 Bari
Introduction
Methods
Results
Conclusions

Institute of Food Sciences,
National Research Council – Avellino (Italy)
E. Del Prete, S. Dotolo, A. Marabotti, A. Facchiano October 15th, 2015 Bari 1/17
Introduction
Methods
Results
Conclusions
Biological macromolecules
- complex structural organization
- balance of energetic factors
Protein Structure
Homology among different organisms
- different sequence, same structure
- amino acid substitution, different structure
2CBR, A Chain, LCN, Bos taurus
(obtained with PyMol)
Structure-function relationships
- some of them stronger than others
Examining protein structure
- analyzing conformational features

Institute of Food Sciences,
National Research Council – Avellino (Italy)
E. Del Prete, S. Dotolo, A. Marabotti, A. Facchiano October 15th, 2015 Bari 2/17
Introduction
Methods
Results
Conclusions
Getting Data
Protein families with different
architectural classification 1. Beta-lactamase (BLA)
2. Cathepsin B (CTS)
3. Ferritin (FTL)
4. Glycosyltransferase (GTF)
5. Hemoglobin (HGB)
6. Lipocalin 2 (LCN)
7. Lysozyme (LYS)
8. P. Cell Nuclear Antigen (PCNA)
9. P. Nucleoside Phosphorylase (PNP)
10. Superoxide Dismutase (SOD)
153 Crystallographic structures
2.40.128.x β-β barrel

Institute of Food Sciences,
National Research Council – Avellino (Italy)
E. Del Prete, S. Dotolo, A. Marabotti, A. Facchiano October 15th, 2015 Bari 3/17
Introduction
Methods
Results
Conclusions
Cleaning Data
Similar number of structures, 13-19 for each family
- only wild-type, one for organism
- less than 50 residues about length Only one chain in homo-multimeric proteins
- chain A where available (chain E in 1M73 and chain X for 3CH2)
Structural-geometrical properties
- secondary structure, hydrogen bonds, accessible surface areas, torsion angles,
packing defects, charged residues, free energy of folding, volume, salt bridges
Percentage features and standard score form
- better stability in evaluations
1. Vadar
2. McVol
3. R-script

Institute of Food Sciences,
National Research Council – Avellino (Italy)
E. Del Prete, S. Dotolo, A. Marabotti, A. Facchiano October 15th, 2015 Bari 4/17
Introduction
Methods
Results
Conclusions
EDA: Kernel Density Distribution
Non-parametric estimation of p.d.f.
- based on a finite data sample
Overcoming the histogram graph - a more effective way to show
the distribution of a variable
𝒇𝒉 (𝒙) =𝟏
𝒏𝒉 𝑲
𝒏
𝒊=𝟏
(𝒙 − 𝒙𝒊𝒉) with 𝒉 ≈ 𝟏. 𝟎𝟔
𝝈
𝒏𝟓 (if K is a Gaussian distribution for univariate data)
How variables are distributed
- for each protein family

Institute of Food Sciences,
National Research Council – Avellino (Italy)
E. Del Prete, S. Dotolo, A. Marabotti, A. Facchiano October 15th, 2015 Bari 5/17
Introduction
Methods
Results
Conclusions
EDA: Correlation
Pearson’s correlation coefficient
- graphical correlation matrix
Partial correlation coefficient
- able to avoid the collinearity
Dissimilarity measurement
- Pearson’s distance
T-Student test for significance
- confidence level of 0.95
𝝆𝒙𝒚 =𝝈𝒙𝒚
𝝈𝒙𝝈𝒚
𝝆𝒚𝐳∙𝒙 =𝝆𝒚𝒛 − 𝝆𝒚𝒙𝝆𝒛𝒙
𝟏 − 𝝆𝒚𝒙𝟐 𝟏 − 𝝆𝒛𝒙
𝟐
𝒅𝒙𝒚 = 𝟏 − 𝝆𝒙𝒚
𝒕 = 𝝆𝒏 − 𝟐
𝟏 − 𝝆𝟐

Institute of Food Sciences,
National Research Council – Avellino (Italy)
E. Del Prete, S. Dotolo, A. Marabotti, A. Facchiano October 15th, 2015 Bari 6/17
Introduction
Methods
Results
Conclusions
EDA: Principal Component Analysis
Multivariate & unsupervised statistical method
- compressed data, new relationships
Summarizing initial variables into new ones
- semi-heuristic decision on variables number
&𝑷𝑪𝟏 = 𝒂𝟏𝟏𝑿𝟏 + 𝒂𝟏𝟐𝑿𝟐 +⋯+ 𝒂𝟏𝒄𝑿𝒄
&&𝑷𝑪𝟐 = 𝒂𝟐𝟏𝑿𝟏 + 𝒂𝟐𝟐𝑿𝟐 +⋯+ 𝒂𝟐𝒄𝑿𝒄&…&𝑷𝑪𝒍 = 𝒂𝒍𝟏𝑿𝟏 + 𝒂𝒍𝟐𝑿𝟐 +⋯+ 𝒂𝒍𝒄𝑿𝒄
𝒎𝒂𝒙𝒂𝒎
𝟏
𝒓 𝒂𝟏𝒋𝒙𝒊𝒋
𝒄
𝒋=𝟏
𝟐𝒓
𝒊=𝟏
𝜮 −&𝝀𝒎𝑰 𝒂𝒎 = 𝟎
𝒂𝟏𝒋𝟐
𝒄
𝒋=𝟏
= 𝟏 with Clusterization and outlier detection
- interpretation allowed to investigator
Sparse PCA, a hybrid technique with regression
- not all the variables are in the PCs

Institute of Food Sciences,
National Research Council – Avellino (Italy)
E. Del Prete, S. Dotolo, A. Marabotti, A. Facchiano October 15th, 2015 Bari 7/17
Introduction
Methods
Results
Conclusions
Classification: Variable Importance
Categorizing observations
- by means of predictive models for classification
Different algorithms used:
- random forest (RFO)
- recursive partitioning (RPA)
- stochastic gradient boosting (GBM)
- boosting model (C50)
- flexible discriminant analysis (FDA)
- nearest shrunken centroid (NSC)
Different scores for variable importance estimation
- percentage of variables occurence (ranking)
Resampling:
a) Training set of 70% of data
b) Testing set of 30% of data
c) 10-fold cross validation
d) Repeating 10 times

Institute of Food Sciences,
National Research Council – Avellino (Italy)
E. Del Prete, S. Dotolo, A. Marabotti, A. Facchiano October 15th, 2015 Bari 8/17
Introduction
Methods
Results
Conclusions
Classification: Performance
Accuracy
- proportion of true results among
the total number of cases examined
Kappa coefficient
- reliability of a statistical classification,
related to the possible best classification
Sensitivity
- proportion of positives that are
correctly identified as such
Specificity
- proportion of negatives that are
correctly identified as such
𝑨𝑪𝑪 =𝑻𝑷 + 𝑻𝑵
𝑷 +𝑵
𝑲 =𝑷𝒓 𝒐 − 𝑷𝒓(𝒆)
𝟏 − 𝑷𝒓(𝒆)
𝑻𝑷𝑹 =𝑻𝑷
𝑷
𝑻𝑵𝑹 =𝑻𝑵
𝑵

Institute of Food Sciences,
National Research Council – Avellino (Italy)
E. Del Prete, S. Dotolo, A. Marabotti, A. Facchiano October 15th, 2015 Bari 9/17
Introduction
Methods
Results
Conclusions
R Tools
R environment in Rstudio IDE
- user and developer
- Comprehensive R Archive Network (CRAN) & Bioconductor
corrplot, Hmisc, ppcor
sparcl, GeneNet, caret
lattice, ggplot2, directlabels
Classification and Regression Training:
a) data splitting
b) pre-processing
c) feature selection
d) model tuning using resampling
e) variable importance estimation
Institute of Food Sciences,
National Research Council – Avellino (Italy)
E. Del Prete, S. Dotolo, A. Marabotti, A. Facchiano October 15th, 2015 Bari 10/17
Introduction
Methods
Results
Conclusions
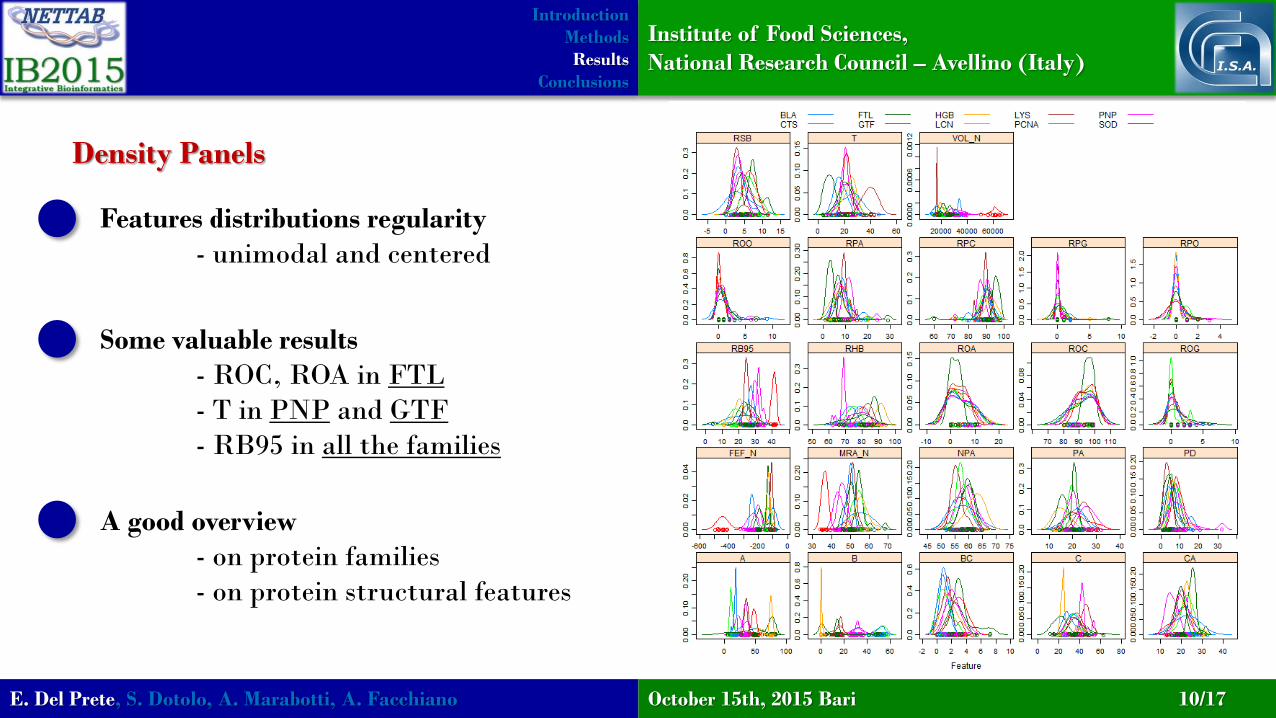
Density Panels
Features distributions regularity
- unimodal and centered
Some valuable results
- ROC, ROA in FTL
- T in PNP and GTF
- RB95 in all the families
A good overview
- on protein families
- on protein structural features

Institute of Food Sciences,
National Research Council – Avellino (Italy)
E. Del Prete, S. Dotolo, A. Marabotti, A. Facchiano October 15th, 2015 Bari 11/17
Introduction
Methods
Results
Conclusions
Dissimilarity Dendrogram

Institute of Food Sciences,
National Research Council – Avellino (Italy)
E. Del Prete, S. Dotolo, A. Marabotti, A. Facchiano October 15th, 2015 Bari 12/17
Introduction
Methods
Results
Conclusions
Features Network
Two kind of relationships
- continuous line: partial correlation
- dotted line: partial anticorrelation
Pruning excessive features
- peripheral ones
a) Phi-Psi Angles
b) Omega Angle
c) ASA information
* Use of GGMs
Institute of Food Sciences,
National Research Council – Avellino (Italy)
E. Del Prete, S. Dotolo, A. Marabotti, A. Facchiano October 15th, 2015 Bari 13/17
Introduction
Methods
Results
Conclusions
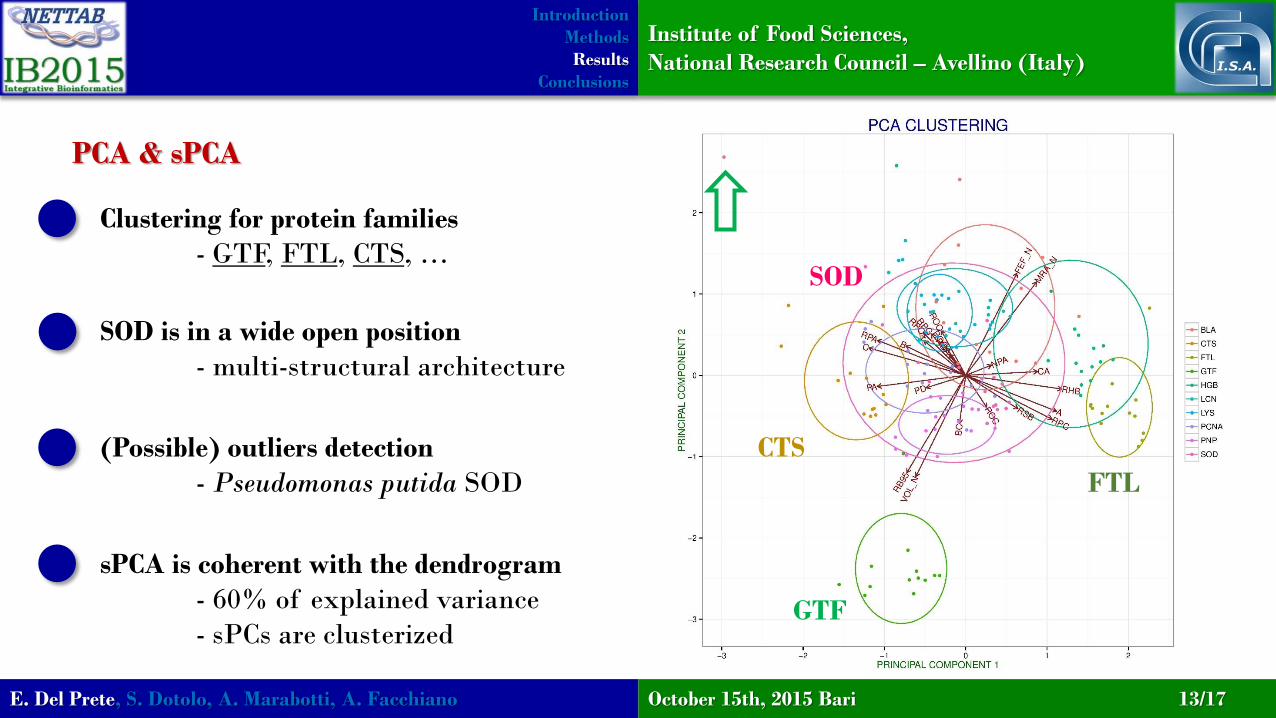
PCA & sPCA
Clustering for protein families
- GTF, FTL, CTS, …
SOD is in a wide open position
- multi-structural architecture
GTF
CTS
FTL
SOD
(Possible) outliers detection
- Pseudomonas putida SOD
sPCA is coherent with the dendrogram
- 60% of explained variance
- sPCs are clusterized

Institute of Food Sciences,
National Research Council – Avellino (Italy)
E. Del Prete, S. Dotolo, A. Marabotti, A. Facchiano October 15th, 2015 Bari 14/17
Introduction
Methods
Results
Conclusions
Features Classification RFO RFO_S RPA RPA_S GBM GBM_S C50 C50_S FDA FDA_S NSC NSC_S PERCENTAGE
A 4 3 2 2 3 3 3 3 8 8 4 4 1,00
B 1 2 1 1 2 1 1 1 2 2 3 3 1,00
C 10 9 8 8 6 8 7 10 0,67
T 7 8 5 5 10 7 6 6 4 4 9 8 1,00
RHB 9 6 9 9 5 5 9 9 8 7 0,83
NPA 0,00
PA 8 10 12 10 5 5 10 9 0,67
CA 11 12 9 9 8 12 11 11 0,67
MRA_N 6 5 6 6 7 6 7 7 5 5 0,83
VOL_N 2 1 3 3 1 2 2 2 1 1 1 1 1,00
RPC 0,00
RPA 12 0,08
RPG 0,00
RPO 0,00
ROC 0,00
ROA 0,00
ROG 0,00
ROO 0,00
PD 11 0,08
FEF_N 3 4 4 4 5 5 4 4 3 3 2 2 1,00
RB95 5 7 7 7 4 4 6 6 0,67
BC 12 11 11 7 7 6 6 0,58
RSB 12 0,08
RFO RFO_S RPA RPA_S GBM GBM_S C50 C50_S FDA FDA_S NSC NSC_S
ACCURACY 0,95 0,95 0,59 0,60 0,94 0,95 0,89 0,88 0,95 0,94 0,89 0,83
KAPPA 0,95 0,94 0,54 0,56 0,93 0,94 0,88 0,86 0,94 0,93 0,88 0,81
SENSITIVITY 0,97 0,97 0,50 0,50 0,93 0,93 0,86 0,86 0,93 0,93 0,91 0,82
SPECIFICITY 0,99 0,99 0,95 0,95 0,99 0,99 0,99 0,99 0,99 0,99 0,99 0,98
PERFORMANCE 0,97 0,96 0,65 0,65 0,95 0,95 0,91 0,90 0,95 0,95 0,92 0,86
P-VALUE 1,00E-29 1,00E-29 1,83E-10 1,83E-10 1,46E-27 1,46E-27 5,05E-22 5,05E-22 1,46E-27 1,46E-27 1,37E-26 2,44E-17

Institute of Food Sciences,
National Research Council – Avellino (Italy)
E. Del Prete, S. Dotolo, A. Marabotti, A. Facchiano October 15th, 2015 Bari 15/17
Introduction
Methods
Results
Conclusions
Features «Selection»
Comparing all the used techniques
Variables subset as typical for the protein families dataset
- A, B, C, T, RHB, PA, CA, MRA_N, VOL_N, RB95
Free energy of folding (FEF_N) strictly related to volume
- because of the prediction formula…
Structural defects seem to influence the present study
- not so strong in all the methods

Institute of Food Sciences,
National Research Council – Avellino (Italy)
E. Del Prete, S. Dotolo, A. Marabotti, A. Facchiano October 15th, 2015 Bari 16/17
Introduction
Methods
Results
Conclusions
Conclusions and Future Works
Predictive models for classification
to perform feature selection
- knowledge < information < data
Graphical multivariate procedures
are good tools
- characterization
- fingerprints
How to improve the work?
- multivariate regression models
- protein families number
a) Transglutaminase
b) Superoxide Dismutase
c) Glycosyl Hydrolase

Institute of Food Sciences,
National Research Council – Avellino (Italy)
E. Del Prete, S. Dotolo, A. Marabotti, A. Facchiano October 15th, 2015 Bari 17/17
Introduction
Methods
Results
Conclusions
Acknowledgments and Credits
Flagship Project «InterOmics»
Bioinformatics and Computational
Biology Laboratory
E. Del Prete, S. Dotolo, A. Facchiano
Department of Chemistry and Biology,
University of Salerno (Fisciano, Italy)
A. Marabotti