COMPARISON BETWEEN FLAT SLAB AND SOLID SLAB · PDF filecomparison between flat slab and solid...
35
Vol 66, No.12;Dec 2016 Jokull Journal 83 COMPARISON BETWEEN FLAT SLAB AND SOLID SLAB SYSTEMS IN STRESSES DISTRIBUTION UNDER THE FOUNDATION USING FINITE ELEMENT ANALYSIS M. E. EL KILANY 1 , T. A. EL-SAYED 2* , N. R. EL-SAKHAWY 3 , A. I. EL-DOSOKY 4 1 Associate Professor, Civil Str. Eng. Dep., Faculty of Eng., Zagazig University, Egypt 2 Assistant Professor, Civil Str.Eng. Dep., Shoubra Faculty of Eng., Benha University, Egypt 3 Professor, Civil Str. Eng. Dep., Faculty of Eng., Zagazig University, Egypt 4 M.Sc Degree, Civil Str. Eng. Dep., Faculty of Eng., Zagazig University, Egypt * Corresponding author. Tel.: +20 1008444985, Fax: +202 22911118 E-mail address: [email protected] (T. A EL-SAYED*)
Transcript of COMPARISON BETWEEN FLAT SLAB AND SOLID SLAB · PDF filecomparison between flat slab and solid...

Vol 66, No.12;Dec 2016
Jokull Journal83
COMPARISON BETWEEN FLAT SLAB AND SOLID SLAB SYSTEMS
IN STRESSES DISTRIBUTION UNDER THE FOUNDATION USING
FINITE ELEMENT ANALYSIS
M. E. EL KILANY1, T. A. EL-SAYED2*, N. R. EL-SAKHAWY3, A. I. EL-DOSOKY4
1Associate Professor, Civil Str. Eng. Dep., Faculty of Eng., Zagazig University, Egypt 2Assistant Professor, Civil Str.Eng. Dep., Shoubra Faculty of Eng., Benha University, Egypt
3Professor, Civil Str. Eng. Dep., Faculty of Eng., Zagazig University, Egypt 4M.Sc Degree, Civil Str. Eng. Dep., Faculty of Eng., Zagazig University, Egypt
* Corresponding author. Tel.: +20 1008444985, Fax: +202 22911118
E-mail address: [email protected] (T. A EL-SAYED*)
84 Jokull Journal
Vol 66, No.12;Dec 2016
COMPARISON BETWEEN FLAT SLAB AND SOLID SLAB SYSTEMS
IN STRESSES DISTRIBUTION UNDER THE FOUNDATION USING
FINITE ELEMENT ANALYSIS
M. E. EL KILANY1, T. A. EL-SAYED2*, N. R. EL-SAKHAWY3, A. I. EL-DOSOKY4
1Associate Professor, Civil Str. Eng. Dep., Faculty of Eng., Zagazig University, Egypt 2Assistant Professor, Civil Str.Eng. Dep., Shoubra Faculty of Eng., Benha University, Egypt
3Professor, Civil Str. Eng. Dep., Faculty of Eng., Zagazig University, Egypt 4M.Sc Candidate, Civil Str. Eng. Dep., Faculty of Eng., Zagazig University, Egypt
ABSTRACT
Soil structure interaction is interdisciplinary field which includes auxiliary and
geotechnical engineering. In the ordinary non- interaction examination of building frame
structural designer assumed that columns are resting on unyielding support. So also, in
foundation design, foundation settlements are calculated without considering the impact of
the structural stiffness. The sub-grade reaction modulus "Ks" can be considered as a
fitting interface between the geotechnical and structural architects. The present research
studies the effect of statical systems of slabs (flat slab & solid slab) on the columns loads
distribution to achieve uniform stresses distribution under the foundation using finite
element analysis program sap 2000.
KEYWORDS
Soil structure interaction, Stresses distribution, modulus of sub grade reaction "Ks", structural analysis, SAP2000, static loading.
1. INTRODUCTION
A few studies have been made on the impact of soil-structure cooperation issues to get
more reasonable examination. They have evaluated the impact of connection conduct and
built up that there is redistribution of strengths in the structure and soil mass.
Consequently, structures and their supporting soils ought to be considered as a solitary
perfect unit. The connection impacts are discovered very noteworthy, especially for the
structures laying on exceptionally compressible soils. The adaptability of soil mass causes
the differential settlement and turn of footings under the use of burden.
85 Jokull Journal
Vol 66, No.12;Dec 2016
The interaction behavior of plane frames with an elastic foundation of the Winkler’s type,
having normal and shear moduli of sub-grade reactions is studied by Aljanabi et al. [1].
An exact stiffness matrix for a beam element on an elastic foundation having just a normal
modulus of sub-grade reaction was changed to include the shear modulus of sub-grade
reaction of the foundation and additionally the axial force in the beam. The outcomes
showed that bowing minutes may be significantly influenced by kind of edge and
stacking.
The proficiency of the coupled finite-infinite elements formulation regarding
computational exertion, information arrangement and the far field representation of the
unbounded area is explored by Noorzaei [2]. Al-Shamrani and Al-Mashary [3] displayed a
streamlined strategy for the investigation of soil-structure interaction behavior of two-
dimensional skeletal steel or reinforced concrete frame structures laying on isolated
footings that are supported by various sorts of soil. The principle program was made of
two noteworthy modules; one for soil settlement computations and another for the
investigation of structure. They assessed the impact of interaction on the predicted
settlements, footing loads, and internal bending moments of the structural members. Roy
et al. [4] performed an examination on an admired model comprising of multi-storey 3-D
frame structure with grid foundation. The grid foundation is assumed to lay on springs,
which romanticize the soil behavior.
The impact of soil-structure interaction on a space frame laying on a pile group installed in
the cohesive soil (clay) with flexible cap is analyzed by Chore et al. [5]. They assessed the
impacts of pile spacing, pile configuration, and pile diameter of the pile group on the
reaction of superstructure. The impact of soil structure interaction is observed to be very
huge.
The impact of contact between strap beam and bearing stratum is examined by Guzman
[6]. The outcomes demonstrate that when a strap footing is utilized as major of a
foundation system, a point of interest that take into consideration pressure to be alleviated
from the strap beam is vital on construction documents. Without it, an impressive
unanticipated load path made that may bring about the result in the failure of strap beam
followed by overstress of the soil under the eccentric footing.
86 Jokull Journal
Vol 66, No.12;Dec 2016
The interaction and non-interaction examinations for the space frame-raft foundation-soil
system utilizing ANSYS finite element code is compared by Thangaraj and Ilamparuthi
[7]. The soil was dealt with as an isotropic, homogenous and elastic half space medium. A
gritty parametric study was directed by shifting the soil and raft stiffness for a constant
building stiffness. The interaction examination demonstrated less total and differential
settlements than the non-interaction analysis and relative stiffness of soil plays significant
role in the execution of the raft. The stress and settlement distribution of a tank foundation
by using the finite element analysis software (ANSYS) is considered by Xiujuan et al. [8].
2. NUMERICAL STUDIES
2.1 Computer Analysis for Mat Foundation [9, 10]
Computer analysis for mat foundation is usually based on an approximation where the mat
is divided into a number of discrete finite elements using grid lines. There are three
general discrete element formulations which may be used:
1- Finite Difference (FD).
2- Finite Grid Method (FGM).
3- Finite Element Method (FEM).
All three of these methods use the modulus of sub grade reaction k, as the soil contribution
to the structural model. Computers and available software make the use of any of the
discrete element methods economical and rapid.
2.2 Finite Element Analysis (Sap 2000) [9, 10]
2.2.1 Shell Element
The six faces of a shell element are defined as the positive 1 face, negative 1 face, positive
2 face, negative 2 face, positive 3 face and negative 3 face as shown in Fig. 2.1. In this
definition the numbers 1, 2 and 3 correspond to the local axes of the shell element. [9, 10]

87 Jokull Journal
Vol 66, No.12;Dec 2016
Note that the positive 3 face is sometimes called the top of the shell element in SAP2000
and the negative 3 face is called the bottom of the shell element.
2.2.2 Frame Element Internal Forces and Moments [9, 10]
The frame element internal forces and moments are present at every cross-section along
the length of the frame. For each load pattern and load combination the frame internal
forces and moments are computed and reported at each frame output station as following:
1- P, the axial force
2- V2, the shear force in the 1-2 plane
3- V3, the shear force in the 1-3 plane
4- T, the axial torque (about the 1-axis)
5- M2, the bending moment in the 1-3 plane (about the 2-axis)
6- M3, the bending moment in the 1-2 plane (about the 3-axis).
3. VARIABLES OF THE STUDY
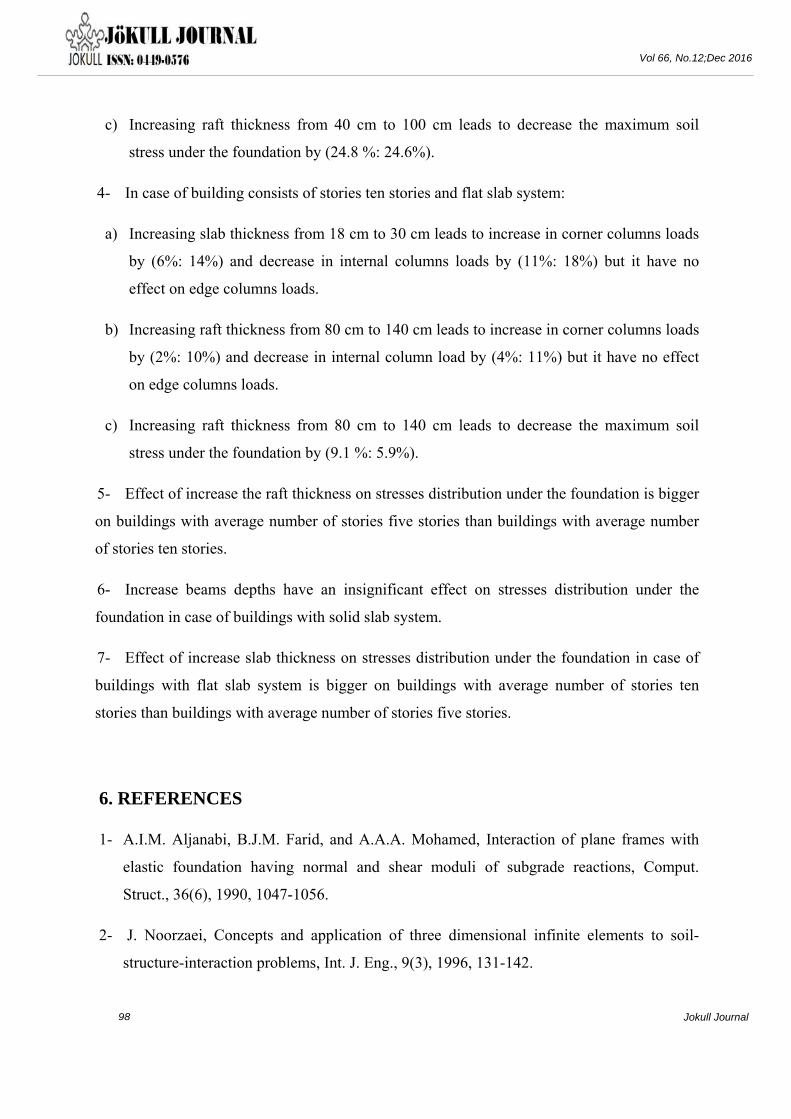
Table 1 summarizes the variable studied in this research. 3.1 Models Geometries and Statical Systems Figure 1 to Figure 3 show models geometries and dimensions. Models consist of two
equal spans in the both directions 10 m x 10 m, supported by 9 columns with dimensions
40 cm × 40 cm. There are two statical systems employed in this research: the first one is
flat slab with variable slab thickness, the second system is solid slab with constant slab
thickness 20 cm and each bay is surrounded by beams with width 30 cm and variable

88 Jokull Journal
Vol 66, No.12;Dec 2016
depth. Both systems are constructed on a square mat foundation with dimensions 10 m x
10 m with variable thickness. The mat will be founded at 1.5 m below the original ground
level.
3.2 Number of Stories
This research includes two types of models with constant story height 3.0 m and different
number of stories as fellows:
1- Five stories model with solid slab system.
2- Five stories model with flat slab system.
3- Ten stories model with solid slab system.
4- Ten stories model with flat slab system.
3.3 Structure Elements Dimensions 3.3.1 Raft Thickness 1- In models consist of five stories, raft thickness is variable from (40 cm = span/12.5) to
(100 cm = span/5).
2- In models consist of ten stories, raft thickness is variable from (80 cm = span/8.33) to
(140 cm = span/3.57).
3.3.2 Columns Dimensions
In all models, columns dimensions are constant and equal 40 cm x 40 cm
(span/12.5 in the both direction).
3.3.3 Slab Thickness 1- In models with flat slab system, slab thickness is variable from (18 cm = span/27.78) to
(30 cm = span/16.67).
2- In models with solid slab system, slab thickness is constant and equal 20 cm (span/25).
89 Jokull Journal
Vol 66, No.12;Dec 2016
3.3.4 Beams Depth 1- In models with flat slab system, there are no beams.
2- In models with solid slab system, beams depths is variable from (40 cm = span/12.5) to
(100 cm = span/5).
3.4 Applied Loads and Load Combinations In this research, Loads are uniform and constant in all stories for all models. Own weight
is taken into consideration, covering load is 3.0 KN/m2 and live load is 2.0 KN/m2.
Columns reactions are computed by combination: (1.0 own weight + 1.0 covering load +
1.0 live load).
3.5 Springs Constant
The modulus of sub grade reaction "Ks" is used to compute node springs based on the
contributing plan area of an element to any node.
Where: (Joint spring = Modulus of sub grade reaction x area) As follows:
1- Interior node springs = Ks x (0.50x0.50).
2- Edge node springs = Ks x 0.50 x (0.50x0.50).
3- Corner node springs = Ks x 0.25 x (0.50x0.50).
3.6 Soil Types One type of soil is employed in this research. The description and properties of the soil are
summarized in Table 2. "Vesic" relation is the governing relation for estimating "Ks" in
our study [11]. Substituting υs (poisson,s ratio) = 0.3, B (footing width) = 10 m, EcIc
(flexural rigidity of the raft) =2.50×10¹⁰ kN.m2 [12] and Es (soil modulus of elasticity) =
300578 KPa [13].
…………….equation (1) [11]

90 Jokull Journal
Vol 66, No.12;Dec 2016
4. RESULTS AND ANALYSIS Columns loads (corner, edge, internal column) are computed and compared in all models
as variation in column load can be consider as an indication to the same variation in
stresses under this column because raft dimensions and meshing are constant and equal
for all models. ℴ (stresses) = P (column load) /A (area), i.e (ℴα P).
Tables and charts give the relation between relative columns loads (computed sap
column load / column load computed by area method) and relative element dimensions
(maximum span / element dimension) in order to make general relation related to
maximum span in the building and try to achieve the same column load computed by area
method and getting uniform stresses under the foundation.
4.1 Models Consist of 5 Stories with Solid Slab System
Figures from 4 to 6 show the effect of increase the raft thickness from 40 cm to 100 cm
and increase the beams depth from 40 cm to 100 cm on the columns loads in models of
five stories with solid slab system.
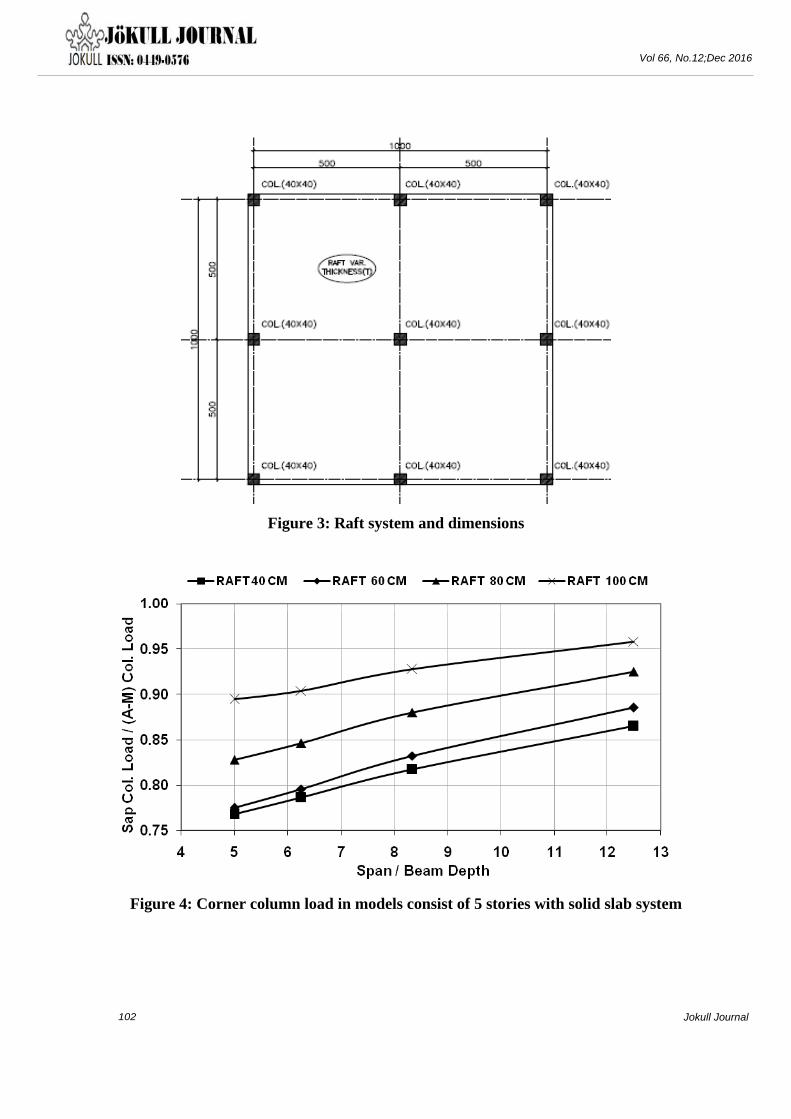
Figure 4 indicate that corner column load decrease by 9% when beams depth increase
from 40 cm to 100 cm in models with raft thickness 40 cm and decrease by 12% in
models with raft thickness 60 cm and decrease by 9% in models with raft thickness 80 cm
and decrease by 7% in models with raft thickness 100 cm. Corner column load increase
by 10% at beams depth 40 cm when raft thickness increase from 40 cm to 100 cm and
increase by 12% at beams depth 100 cm.
Figure 5 indicate that there is an insignificant difference in edge column load when
beams depth increase from 40 cm to 100 cm in all models. Edge column load increase by
1% at beams depth 40 cm when raft thickness increase from 40 cm to 100 cm and
increase by 5% at beams depth 100 cm.
Figure 6 indicate that there is no difference in internal column load when beams depth
increase from 40 cm to 100 cm in models with raft thickness 100 cm. They also clears

91 Jokull Journal
Vol 66, No.12;Dec 2016
that internal column load increase by 12% when beams depth increase from 40 cm to 100
cm in models with raft thickness 40 cm and increase by 8% in models with raft thickness
60 cm and increase by 4% in models with raft thickness 80 cm. Internal column load
decrease by 15% at beams depth 40 cm when raft thickness increase from 40 cm to 100
cm and decrease by 27% at beams depth 100 cm.
Figures from 7 to 10 show the effect of increase the raft thickness from 40 cm to 100 cm
on the stresses distribution under the foundation in models consist of five stories with
solid slab system at beams depths equal 40 cm. Figure 7 and Figure 10 indicate that soil
stresses changed from (from 52 KN/m2 to 138 KN/m2) in model with raft thickness 40 cm
to (from 80 KN/m2 to 99 KN/m2) in model with raft thickness 100 cm which mean that
maximum soil stress decrease by 28.26 %.
Figures from 11 to 14 show the effect of increase the raft thickness from 40 cm to 100 cm
on the stresses distribution under the foundation in models consist of five stories with
solid slab system when beams depths equal 100 cm. Figure 11 and Figure 14 indicate that
soil stresses changed from (from 63 KN/m2 to 152 KN/m2) in model with raft thickness 40
cm to (from 92 KN/m2 to 115 KN/m2) in model with raft thickness 100 cm which mean
that maximum soil stress decrease by 24.34%.
4.2 Models Consist of 10 Stories with Solid Slab System
Figures from 15 to 17 show the effect of increase the raft thickness from 80 cm to 140 cm
and increase the beams depth from 40 cm to 100 cm on the columns loads in models of ten
stories with solid slab system.
Figure 15 indicate that corner column load decrease by 7% when beams depth increase
from 40 cm to 100 cm in models with raft thickness 80 cm and decrease by 3% in models
with raft thickness 100 cm and increase by 4% in models with raft thickness 140 cm. They
also clears that there is an insignificant difference in corner column load when beams
depth increase from 40 cm to 100 cm in models with raft thickness 120 cm. Corner

92 Jokull Journal
Vol 66, No.12;Dec 2016
column load increase by 13% at beams depth 40 cm when raft thickness increase from 80
cm to 140 cm and increase by 24% at beams depth 100 cm.
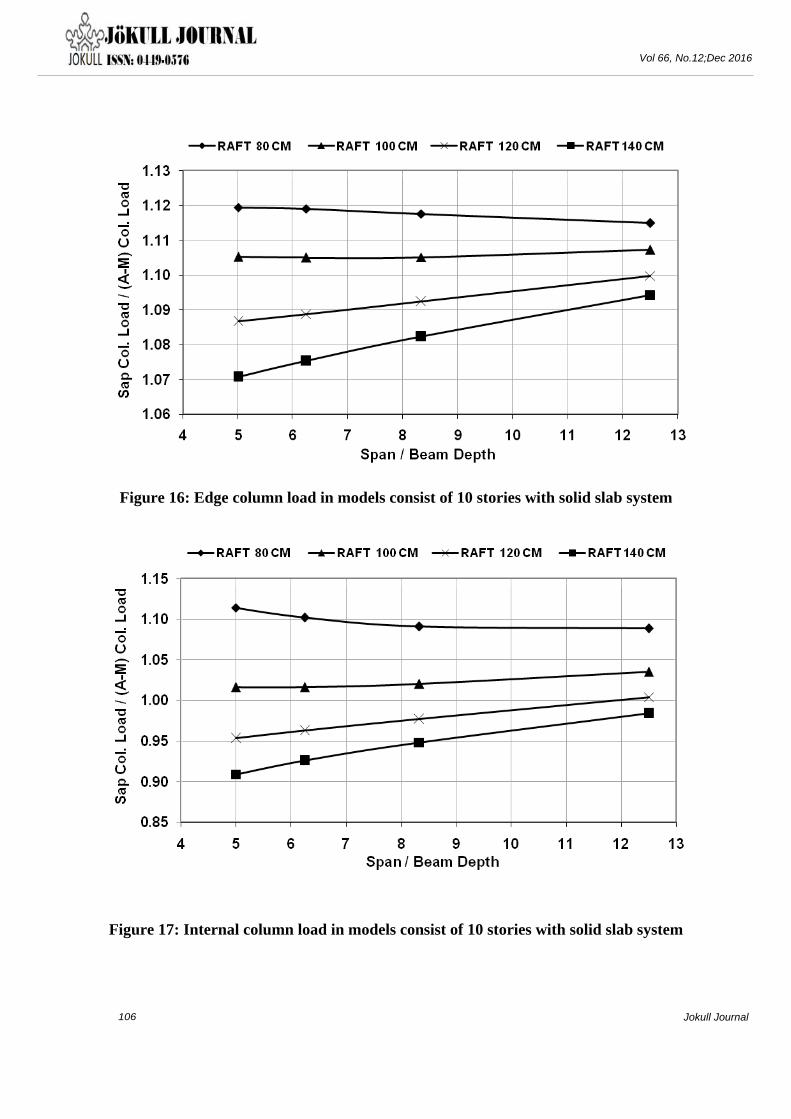
Figure 16 indicate that there is an insignificant difference in edge column load when
beams depth increase from 40 cm to 100 cm in all models. Edge column load decrease by
2% at beams depth 40 cm when raft thickness increase from 80 cm to 140 cm and
decrease by 5% at beams depth 100 cm.
Figure 17 indicate that there is an insignificant difference in internal column load when
beams depth increase from 40 cm to 100 cm in models with raft thickness 80 cm and 100
cm. They also clears that internal column load decrease by 5% when beams depth increase
from 40 cm to 100 cm in models with raft thickness 120 cm and decrease by 7% in models
with raft thickness 140 cm. Internal column load decrease by 11% at beams depth 40 cm
when raft thickness increase from 80 cm to 140 cm and decrease by 20% at beams depth
100 cm.
Figures from 18 to 21 show the effect of increase the raft thickness from 80 cm to 140 cm
on the stresses distribution under the foundation in models consist of ten stories with solid
slab system when beams depths equal 40 cm. Figure 18 and Figure 21 indicate that soil
stresses changed from (from 123 KN/m2 to 195 KN/m2) in model with raft thickness 80
cm to (from 151 KN/m2 to 175 KN/m2) in model with raft thickness 140 cm which mean
that maximum soil stress decrease by 10.25%.
Figures from 22 to 25 show the effect of increase the raft thickness from 80 cm to 140 cm
on the stresses distribution under the foundation in models consist of ten stories with solid
slab system when beams depths equal 100 cm. Figure 22 and Figure 25 indicate that soil
stresses changed from (from 145 KN/m2 to 229 KN/m2) in model with raft thickness 80
cm to (from 174 KN/m2 to 207 KN/m2) in model with raft thickness 140 cm which mean
that maximum soil stress decrease by 9.6%.

93 Jokull Journal
Vol 66, No.12;Dec 2016
4.3 Models Consist of 5 Stories with Flat Slab System
Figures from 26 to 28 show the effect of increase the raft thickness from 40 cm to 100 cm
and increase the slab thickness from 18 cm to 30 cm on the columns loads in models of
five stories with flat slab system.
Figure 26 indicate that there is an insignificant difference in corner column load when slab
thickness increase from 18 cm to 30 cm in all models. Corner column load increase by 2%
at slab thickness 18 cm when raft thickness increase from 40 cm to 100 cm and increase
by 4% at slab thickness 30 cm.
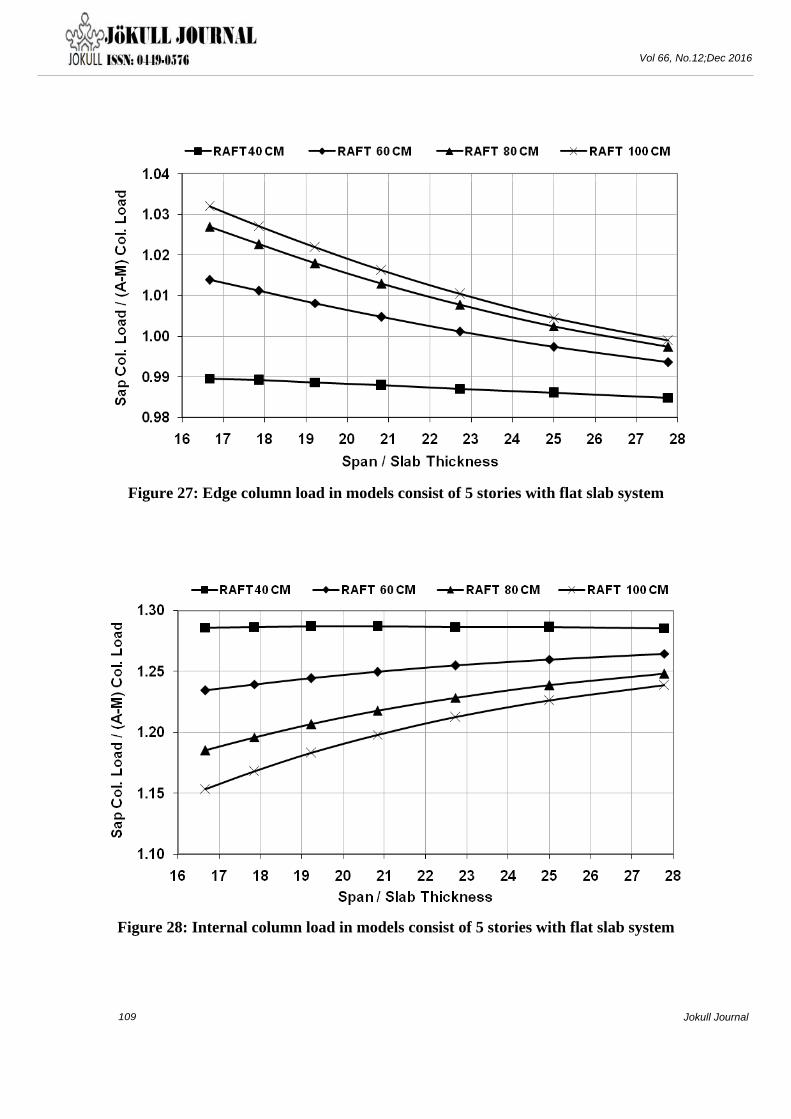
Figure 27 indicate that there is an insignificant difference in edge column load when slab
thickness increase from 18 cm to 30 cm in all models. Edge column load increase by 2%
at slab thickness 18 cm when raft thickness increase from 40 cm to 100 cm and increase
by 4% at slab thickness 30 cm.
Figure 28 indicate that there is no difference in internal column load when slab thickness
increase from 18 cm to 30 cm in models with raft thickness 40 cm. They also clears that
internal column load decrease by 3% when slab thickness increase from 18 cm to 30 cm in
models with raft thickness 60 cm and decrease by 6% in models with raft thickness 80 cm
and decrease by 9% in models with raft thickness 100 cm. Internal column load decrease
by 5% at slab thickness 18 cm when raft thickness increase from 40 cm to 100 cm and
decrease by 14% at slab thickness 30 cm.
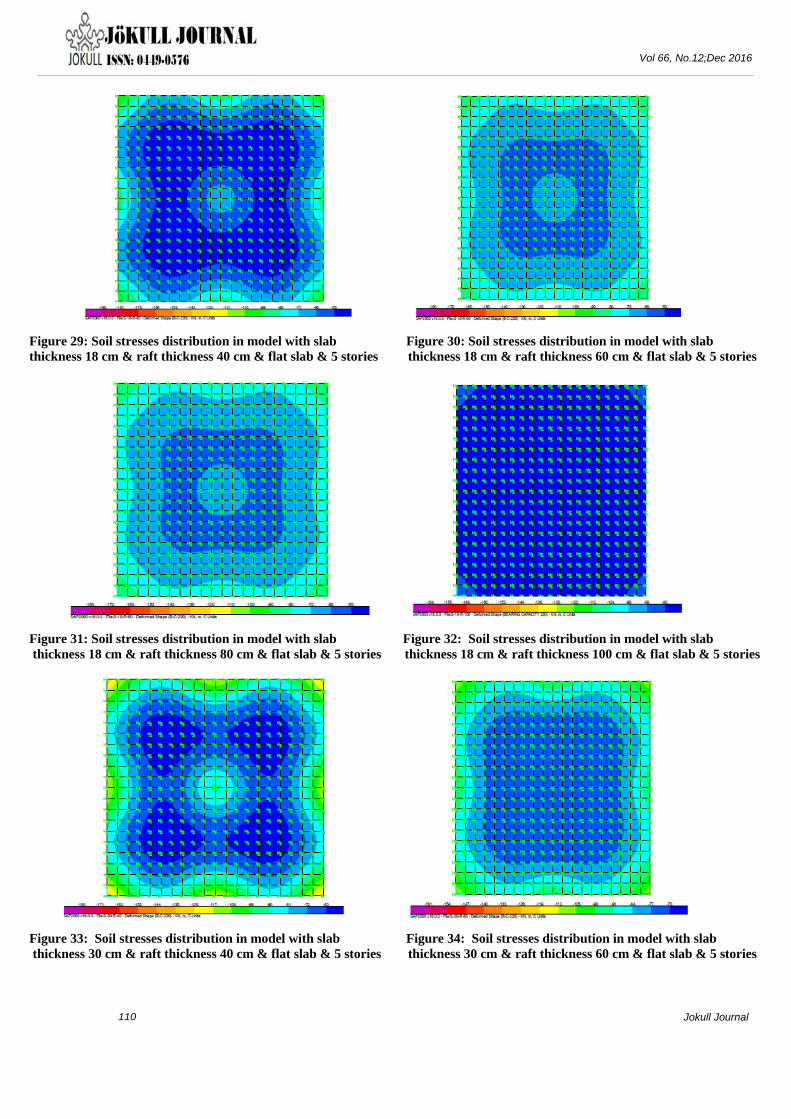
Figures from 29 to 32 show the effect of increase the raft thickness from 40 cm to 100 cm
on the stresses distribution under the foundation in models consist of five stories with flat
slab system when slab thickness equal 18 cm. Figure 29 and Figure 32 indicate that soil
stresses changed from (from 45 KN/m2 to 110 KN/m2) in model with raft thickness 40 cm
to (from 72 KN/m2 to 83 KN/m2) in model with raft thickness 100 cm which mean that
maximum soil stress decrease by 24.54%.

94 Jokull Journal
Vol 66, No.12;Dec 2016
Figure 33 and Figure 36 show the effect of increase the raft thickness from 40 cm to 100
cm on the stresses distribution under the foundation in models consist of five stories with
flat slab system when slab thickness equal 30 cm. Figure 33 and Figure 36 indicate that
soil stresses changed from (from 56 KN/m2 from 133 KN/m2) in model with raft thickness
40 cm to (from 85 KN/m2 from 100 KN/m2) in model with raft thickness 100 cm which
mean that maximum soil stress decrease by 24.81%.
4.4 Models Consist of 10 Stories with Flat Slab System Figures from 37 to 39 show the effect of increase the raft thickness from 80 cm to 140 cm
and increase the slab thickness from 18 cm to 30 cm on the columns loads in models of
ten stories with flat slab system.
Figure 37 indicate that corner column load increase by 6% when slab thickness increase
from 18 cm to 30 cm in models with raft thickness 80 cm and increase by 10% in models
with raft thickness 100 cm and increase by 12% in models with raft thickness 120 cm and
increase by 14% in models with raft thickness 140 cm. Corner column load increase by
2% at slab thickness 18 cm when raft thickness increase from 80 cm to 140 cm and
increase by 10% at slab thickness 30 cm.
Figure 38 indicate that there is an insignificant difference in edge column load when slab
thickness increase from 18 cm to 30 cm in all models. They also clears that there is no
difference in edge column load when raft thickness increase from 80 cm to 140 cm in all
models.
Figure 39 indicate that internal column load decrease by 11% when slab thickness increase
from 18 cm to 30 cm in models with raft thickness 80 cm and decrease by 14% in models
with raft thickness 100 cm and decrease by 17% in models with raft thickness 120 cm and
decrease by 18% in models with raft thickness 140 cm. Internal column load decrease by
4% at slab thickness 18 cm when raft thickness increase from 80 cm to 140 cm and
decrease by 11% at slab thickness 30 cm.

95 Jokull Journal
Vol 66, No.12;Dec 2016
Figures from 40 to 43 show the effect of increase the raft thickness from 80 cm to 140 cm
on the stresses distribution under the foundation in models consist of ten stories with flat
slab system. Figure 40 and Figure 43 indicate that soil stresses changed from (from 110
KN/m2 to 154 KN/m2) in model with raft thickness 80 cm to (from 132 KN/m2 to 145
KN/m2) in model with raft thickness 140 cm which mean that maximum soil stress
decrease by 5.84 %.
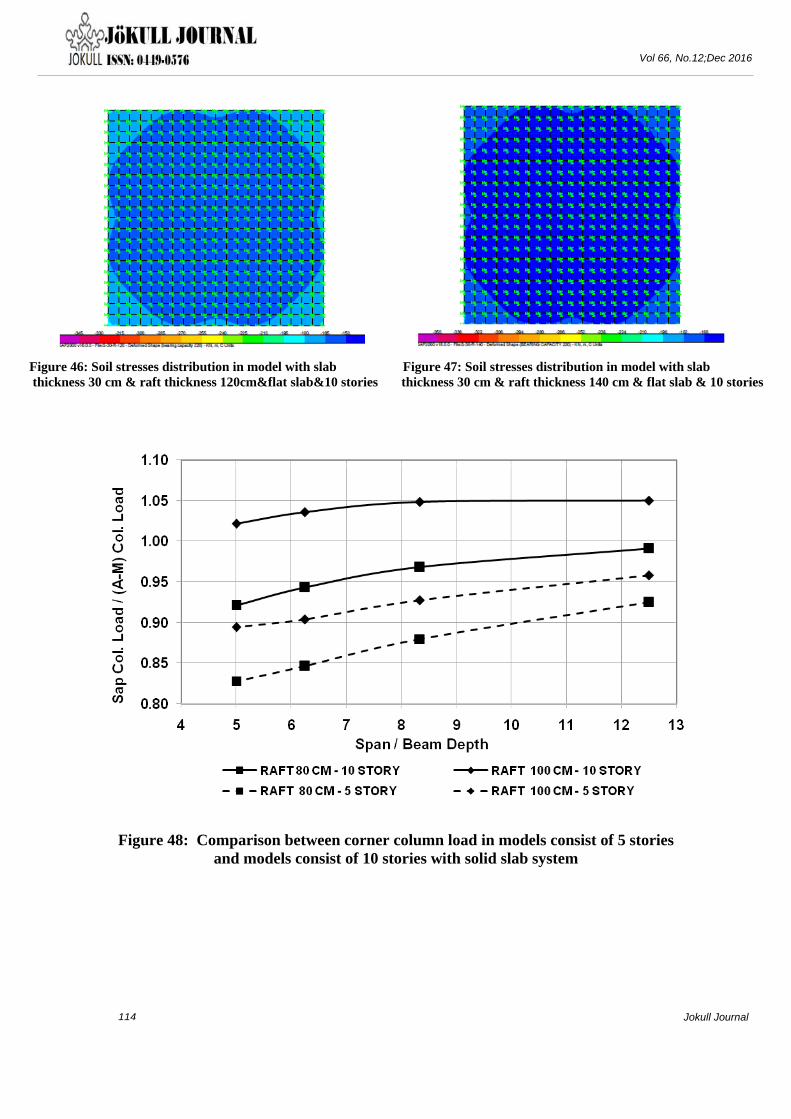
Figures from 44 to 47 show the effect of increase the raft thickness from 80 cm to 140 cm
on the stresses distribution under the foundation in models consist of ten stories with flat
slab system when slab thickness equal 30 cm. Figure 44 and Figure 47 indicate that soil
stresses changed from (from 132 KN/m2 to 198 KN/m2) in model with raft thickness 80
cm to (from 158 KN/m2 to 180 KN/m2) in model with raft thickness 140 cm which mean
that maximum soil stress decrease by 9.09 %.
4.5 Comparison between Models Consist of 5 Stories and Models Consist
of 10 Stories with Solid Slab System
Figures from 48 to 50 show the comparison between columns loads in models consist of
five stories and models consist of ten stories with solid slab system at raft thickness 80 cm
and 100 cm and beam depth increase from 40 cm to 100 cm.
Figure 48 indicate that corner column load increase by 7% with raft thickness 80 cm at
beam thickness 40 cm and increase by 9% at beam thickness 100 cm and increase by 9%
in models with raft thickness 100 cm at beam thickness 40 cm and increase by 13% at
beam thickness 100 cm.
Figure 49 indicate that there is an insignificant difference in edge column load when
number of stories increase from 5 stories to 10 stories in models with raft thickness 80 cm
and 100 cm when beam thickness increase from 40 cm to 100 cm.
Figure 50 indicate that internal column load decrease by 11% with raft thickness 80 cm at
beam thickness 40 cm and decrease by 13% at beam thickness 100 cm and decrease by
13% in models with raft thickness 100 cm at beam thickness 40 cm and decrease by 15%
at beam thickness 100 cm.

96 Jokull Journal
Vol 66, No.12;Dec 2016
4.6 Comparison between Models Consist of 5 stories and Models Consist
of 10 Stories with Flat Slab System
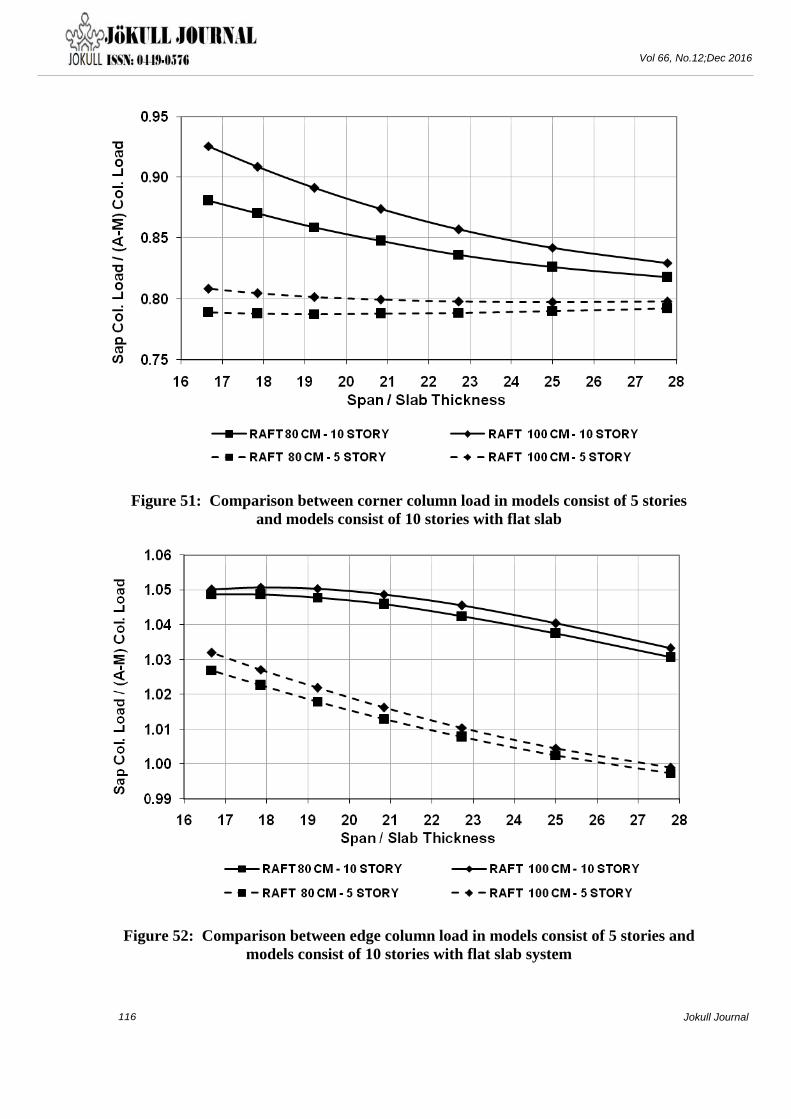
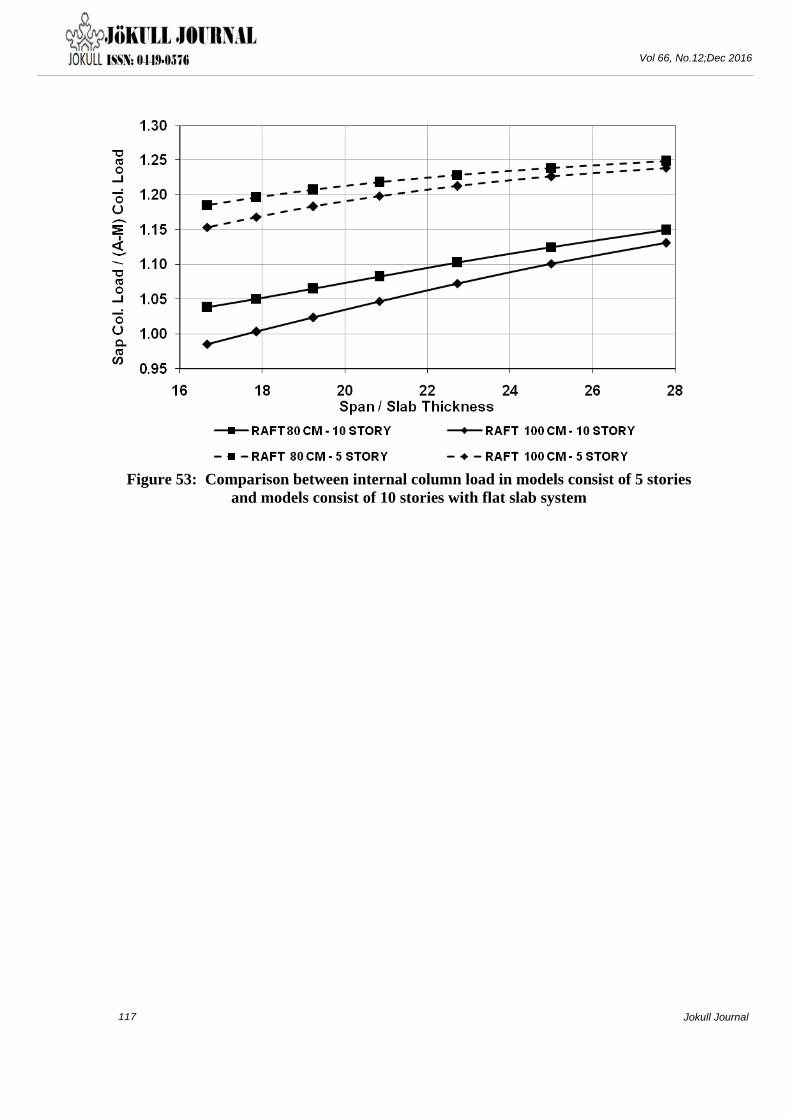
Figures from 51 to 53 show the compare between columns loads in models consist of five
stories and models consist of ten stories with flat slab system at raft thickness 80 cm and
100 cm and slab thickness increase from 18 cm to 30 cm.
Figure 51 indicate that corner column load increase by 3% with raft thickness 80 cm at
slab thickness 18 cm and increase by 9% at slab thickness 30 cm and increase by 3% in
models with raft thickness 100 cm at slab thickness 18 cm and increase by 12% at slab
thickness 30 cm.
Figure 52 indicate that edge column load increase by 3% with raft thickness 80 cm at slab
thickness 18 cm and increase by 2% at slab thickness 30 cm and increase by 3% in models
with raft thickness 100 cm at slab thickness 18 cm and increase by 2% at slab thickness 30
cm.
Figure 53 indicate that internal column load decrease by 10% with raft thickness 80 cm at
slab thickness 18 cm and decrease by 15% at slab thickness 30 cm and decrease by 11% in
models with raft thickness 100 cm at slab thickness 18 cm and decrease by 16% at slab
thickness 30 cm.
5. CONCLUSION
1- In case of building consists of stories five stories and solid slab system:
a) Increasing beams depths from 40 cm to 100 cm leads to decrease in corner columns
loads by (7%: 12%) and increase in internal column load by (0%: 12%) but it have no
effect on edge columns loads.
b) Increasing raft thickness from 40 cm to 100 cm leads to increase in corner columns loads
by (10%: 12%), increase in edge columns loads by (1%: 5%) and decrease in internal
column load by (15%: 27%).

97 Jokull Journal
Vol 66, No.12;Dec 2016
c) Increasing raft thickness from 40 cm to 100 cm leads to decrease the maximum soil
stress under the foundation by (24.4 %: 28.3%).
d) Beams depths must be small as it can be and according to structure requirements.
e) Raft thickness must be at least equal (span/6) and it is prefer to increase raft thickness to
get uniform stresses distribution under the foundation.
2- In case of building consists of stories ten stories and solid slab system:
a) Increasing beams depths from 40 cm to 100 cm leads to change in corner columns loads
from decrease by 7% to increase by 4% and decrease in internal column load by (1%:
7%) but it have no effect on edge columns loads.
b) Increasing raft thickness from 80 cm to 140 cm leads to increase in corner columns loads
by (13%: 24%), decrease in edge columns loads by (2%: 5%) and decrease in internal
column load by (11%: 20%).
c) Increasing raft thickness from 80 cm to 140 cm leads to decrease the maximum soil
stress under the foundation by (9.6 %: 10.3%).
d) Beams depths must be small as it can be and according to structure requirements when
raft thickness less than (span/5) but when raft thickness is bigger than that it is prefer to
increase beams depths to get uniform stresses distribution under the foundation.
e) Raft thickness must be at least equal (span/4) and it is prefer to increase raft thickness to
get uniform stresses distribution under the foundation.
3- In case of building consists of stories five stories and flat slab system:
a) Increasing slab thickness from 18 cm to 30 cm leads to decrease in internal columns
loads by (0%: 9%) but it have no effect on corner and edge columns loads.
b) Increasing raft thickness from 40 cm to 100 cm leads to increase in corner and edge
columns loads by (2%: 4%) and decrease in internal column load by (5%: 14%).
98 Jokull Journal
Vol 66, No.12;Dec 2016
c) Increasing raft thickness from 40 cm to 100 cm leads to decrease the maximum soil
stress under the foundation by (24.8 %: 24.6%).
4- In case of building consists of stories ten stories and flat slab system:
a) Increasing slab thickness from 18 cm to 30 cm leads to increase in corner columns loads
by (6%: 14%) and decrease in internal columns loads by (11%: 18%) but it have no
effect on edge columns loads.
b) Increasing raft thickness from 80 cm to 140 cm leads to increase in corner columns loads
by (2%: 10%) and decrease in internal column load by (4%: 11%) but it have no effect
on edge columns loads.
c) Increasing raft thickness from 80 cm to 140 cm leads to decrease the maximum soil
stress under the foundation by (9.1 %: 5.9%).
5- Effect of increase the raft thickness on stresses distribution under the foundation is bigger
on buildings with average number of stories five stories than buildings with average number
of stories ten stories.
6- Increase beams depths have an insignificant effect on stresses distribution under the
foundation in case of buildings with solid slab system.
7- Effect of increase slab thickness on stresses distribution under the foundation in case of
buildings with flat slab system is bigger on buildings with average number of stories ten
stories than buildings with average number of stories five stories.
6. REFERENCES
1- A.I.M. Aljanabi, B.J.M. Farid, and A.A.A. Mohamed, Interaction of plane frames with
elastic foundation having normal and shear moduli of subgrade reactions, Comput.
Struct., 36(6), 1990, 1047-1056.
2- J. Noorzaei, Concepts and application of three dimensional infinite elements to soil-
structure-interaction problems, Int. J. Eng., 9(3), 1996, 131-142.

99 Jokull Journal
Vol 66, No.12;Dec 2016
3- M.A. Al-Shamrani, and F.A. Al-Mashary, A simplified computation of the interactive
behavior between soils and framed structures, Eng. Sci., 16(1), 2003, 37-60.
4- R. Roy, K. Bhattacharya, and S.C. Dutta, Behaviour of grid foundation under static
gravity loading, J. Inst. Eng. (India), 85, 2005, 261-268.
5- H.S. Chore, R.K. Ingle, and V.A. Sawant, Building frame - pile foundation - soil
interaction analysis: a parametric study, J. Interact. Multiscale Mech., 3(1), 2010, 55-79.
6- T. Guzman, Heavily loaded strap footing-design, detailing and behavior, Structure
Magazine, 2010, 12-15.
7- D. Thangaraj and K. Ilamparuthi, Parametric study on the performance of raft foundation
with interaction of frame, Electron. J. Geotech. Eng., 15, 2010, 861-878.
8- Y. Xiujuan, X. Zongxiang, Z. Lisong, and Y. Xiangzhen, 3D simulation of weak
foundation for good-sized oil storage tank, Proc. of International Conference on
Mechanic Automation and Control Engineering, China, 2010, 1345-1348.
9- Sap-2000 (V.16) User's Manual, Computers and Structures, Inc.1995 University Avenue,
Berkeley, California 94704, USA.
10- T. A. El-sayed, m. E. El kilany, n. R. El-sakhawy and a. I. El-dosoky , 2016. Methods for
achievement uniform stresses distribution under the foundation, international journal of
civil engineering & technology (ijciet).volume:7, issue: 2, pages: 45-66.
11- Jamshid and Maryam, 2009. Comparative Study of Methods of Determination of
Coefficient of Subgrade Reaction, electronic journal of geotechnical engineering. Volume
14- Bundle E.
12- Egyptian code for Reinforced concrete (ECCS – 203 - 2001) REV.02 – chapter 06 –
Foundation design - Egypt.
13- Bowles (1997) "Foundation Analysis and Design" Text book - International Edition -
McGraw-Hill Book Co. - Singapore.

100 Jokull Journal
Vol 66, No.12;Dec 2016
Table 1: Research Variables
Table 2: Soil properties and descriptions
Soil Type Soil description Es
(KPa)
Bearing capacity
B/C (KN/ m2)
Modulus of Sub
grade Reaction
Ks (KPa)
Type (1) Medium Dense Sand 300578 220 18000
Soil Type Type (1)
Slab System Flat Slab Solid Slab
Slabs Thicknesses 18 : 30 cm 20 cm
Beams Depths ——— 40 : 100 cm
Number of Stories 10-Stories 5-Stories 10-Stories 5-Stories
Raft Thickness 80 : 140 cm 40 : 100 cm 80 : 140 cm 40 : 100 cm

101 Jokull Journal
Vol 66, No.12;Dec 2016
Figure 1: Flat slab system
Figure 2: Solid slab system
102 Jokull Journal
Vol 66, No.12;Dec 2016
Figure 3: Raft system and dimensions
Figure 4: Corner column load in models consist of 5 stories with solid slab system

103 Jokull Journal
Vol 66, No.12;Dec 2016
Figure 5: Edge column load in models consist of 5 stories with solid slab system
Figure 6: Internal column load in models consist of 5 stories with solid slab system

104 Jokull Journal
Vol 66, No.12;Dec 2016
Figure 7: Soil stresses distribution in model with beam Figure 8: Soil stresses distribution in model with beam depth 40 cm & raft thickness 40 cm & solid slab & 5 stories depth 40 cm & raft thickness 60 cm & solid slab & 5 stories
Figure 9: Soil stresses distribution in model with beam Figure 10: Soil stresses distribution in model with beam depth 40 cm & raft thickness 80 cm & solid slab & 5 stories depth 40 cm & raft thickness 100 cm & solid slab & 5 stories
Figure 11: Soil stresses distribution in model with beam Figure 12: Soil stresses distribution in model with beam Depth 100 cm & raft thickness 40 cm & solid slab & 5 stories depth 100 cm & raft thickness 60 cm & solid slab & 5 stories

105 Jokull Journal
Vol 66, No.12;Dec 2016
Figure 13: Soil stresses distribution in model with beam Figure 14: Soil stresses distribution in model with beam depth 100 cm & raft thickness 80 cm & solid slab & 5 stories depth 100 cm & raft thickness 100 cm & solid slab & 5 stories
Figure 15: Corner column load in models consist of 10 stories with solid slab system
106 Jokull Journal
Vol 66, No.12;Dec 2016
Figure 16: Edge column load in models consist of 10 stories with solid slab system
Figure 17: Internal column load in models consist of 10 stories with solid slab system

107 Jokull Journal
Vol 66, No.12;Dec 2016
Figure 18: Soil stresses distribution in model with beam Figure 19: Soil stresses distribution in model with beam depth 40 cm & raft thickness 80 cm & solid slab & 10 stories depth 40 cm & raft thickness 100 cm & solid slab & 10 stories
Figure 20: Soil stresses distribution in model with beam Figure 21: Soil stresses distribution in model with beam depth 40 cm & raft thickness 120 cm & solid slab & 10 stories depth 40 cm & raft thickness 140 cm & solid slab & 10 stories
Figure 22: Soil stresses distribution in model with beam Figure 23: Soil stresses distribution in model with beam depth 100 cm & raft thickness 80 cm & solid slab & 10 stories depth 100 cm & raft thickness 100 cm & solid slab & 10 stories

108 Jokull Journal
Vol 66, No.12;Dec 2016
Figure 24: Soil stresses distribution in model with beam Figure 25: Soil stresses distribution in model with beam depth 100 cm & raft thickness 120 cm & solid slab & 10 stories depth 100 cm & raft thickness 140 cm & solid slab & 10 stories
Figure 26: Corner column load in models consist of 5 stories with flat slab system
109 Jokull Journal
Vol 66, No.12;Dec 2016
Figure 27: Edge column load in models consist of 5 stories with flat slab system
Figure 28: Internal column load in models consist of 5 stories with flat slab system
110 Jokull Journal
Vol 66, No.12;Dec 2016
Figure 29: Soil stresses distribution in model with slab Figure 30: Soil stresses distribution in model with slab thickness 18 cm & raft thickness 40 cm & flat slab & 5 stories thickness 18 cm & raft thickness 60 cm & flat slab & 5 stories
Figure 31: Soil stresses distribution in model with slab Figure 32: Soil stresses distribution in model with slab thickness 18 cm & raft thickness 80 cm & flat slab & 5 stories thickness 18 cm & raft thickness 100 cm & flat slab & 5 stories
Figure 33: Soil stresses distribution in model with slab Figure 34: Soil stresses distribution in model with slab thickness 30 cm & raft thickness 40 cm & flat slab & 5 stories thickness 30 cm & raft thickness 60 cm & flat slab & 5 stories

111 Jokull Journal
Vol 66, No.12;Dec 2016
Figure 35: Soil stresses distribution in model with slab Figure 36: Soil stresses distribution in model with slab thickness 30 cm & raft thickness 80 cm & flat slab & 5 stories thickness 30 cm & raft thickness 100 cm & flat slab & 5 stories
Figure 37: Corner column load in models consist of 10 stories with flat slab system

112 Jokull Journal
Vol 66, No.12;Dec 2016
Figure 38: Edge column load in models consist of 10 stories with flat slab system
Figure 39: Internal column load in models consist of 10 stories with flat slab system

113 Jokull Journal
Vol 66, No.12;Dec 2016
Figure 40: Soil stresses distribution in model with slab Figure 41: Soil stresses distribution in model with slab thickness 18 cm & raft thickness 80 cm & flat slab &10 stories thickness 18 cm & raft thickness 100 cm& flat slab &10 stories
Figure 42: Soil stresses distribution in model with slab Figure 43: Soil stresses distribution in model with slab thickness 18 cm & raft thickness 120 cm & flat slab&10 stories thickness 18 cm&raft thickness 140 cm&flat slab & 10 stories
Figure 44: Soil stresses distribution in model with slab Figure 45: Soil stresses distribution in model with slab thickness 30 cm & raft thickness 80 cm & flat slab &10 stories thickness 30 cm & raft thickness 100 cm&flat slab & 10 stories
114 Jokull Journal
Vol 66, No.12;Dec 2016
Figure 46: Soil stresses distribution in model with slab Figure 47: Soil stresses distribution in model with slab thickness 30 cm & raft thickness 120cm&flat slab&10 stories thickness 30 cm & raft thickness 140 cm & flat slab & 10 stories
Figure 48: Comparison between corner column load in models consist of 5 stories and models consist of 10 stories with solid slab system

115 Jokull Journal
Vol 66, No.12;Dec 2016
Figure 49: Comparison between edge column load in models consist of 5 stories and models consist of 10 stories with solid slab system
Figure 50: Comparison between internal column load in models consist of 5 stories and models consist of 10 stories with solid slab system
116 Jokull Journal
Vol 66, No.12;Dec 2016
Figure 51: Comparison between corner column load in models consist of 5 stories and models consist of 10 stories with flat slab
Figure 52: Comparison between edge column load in models consist of 5 stories and models consist of 10 stories with flat slab system
117 Jokull Journal
Vol 66, No.12;Dec 2016
Figure 53: Comparison between internal column load in models consist of 5 stories
and models consist of 10 stories with flat slab system