COMPARING TWO SAMPLES: EXTENSIONS OF THE t, RANK SUM, …
26
COMPARING TWO SAMPLES: EXTENSIONS OF THE t, RANK SUM, AND LOG RANK TESTS by Peter C. O'Brien, Ph.D. Technical Report Series, No. 30 November 1985 -
Transcript of COMPARING TWO SAMPLES: EXTENSIONS OF THE t, RANK SUM, …
COMPARING TWO SAMPLES: EXTENSIONS OF THE t, RANK SUM,
AND LOG RANK TESTS
by
Peter C. O'Brien, Ph.D.
Technical Report Series, No. 30
November 1985
-

ABSTKACT
We consider the problem of testing the null hypothesis that two
populations are identical with respect to the distribution of a
continuous variable against the alternative that values tend to be larger
in one population. The most commonly used tests for this problem when
the data are obtained independently from the two populations are the t,
rank sum, and censored data log rank tests. In this paper we: 1) call
attention to the observation that these tests may be expected to be
insensitive for a large class of situations, 2) propose a criterion for
identifying these circumstances in a particular data set, and 3) propose
corresponding extensions of the conventional methods. In addition to
facilitating the identification of group differences, the proposed
methods should be useful descriptively as an aid in their
interpretation.
Key Words: t test, rank sum, log rank, censored data, logistic
regression, maximum likelihood.
-

-2-
1. INTRODUCTION
One of the most common questions posed by medical investigators is,
Do the values in one population (A) tend to be larger than those in a
second population (B)? This question may be formulated in the context of
classical hypothesis testing in terms of the cumulative distribution
functions Ho: FA(u) = FB(u) vs HA: F*(u) C FR(u), with strict
inequality holding for at least one value of u. In practice, however,
the alternative is usually formulated as shift in location,
*A ': FA(u) = FB(u-A) for uncensored data, or the proportional hazards
model for censored data. It has been our experience, verified by review
of other published data sets, that the standard tests based on shift in
location and proportional hazards alternatives may fail to identify
important differences. The purpose of this paper is to 1) draw attention
to this problem, 2) distinguish a broad class of situations in which the
conventional procedures may be expected to be insensitive, 3) propose a
criterion for identifying such circumstances in a particular data set,
and 4) propose corresponding extensions of the conventional methods. The
methodologies relating to the t and rank sum tests are discussed in the -
next section, followed by real data examples in section 3. Applications
to censored data are discussed in section 4. We emphasize at the outset
that the methodologies proposed should be viewed as extensions of the
conventional procedures to enhance their usefulness. They are not
intended as competitors to be used in place of the corresponding
conventional two sample tests,

-3-
2. UNCENSORED DATA: THE t AND RANK SUM TESTS
Let (Xl, .., Xm) and (Yl, . . . . Yn) represent independently obtained
samples with cumulative distribution functions F x and Fy respectively,
let (W, <... < WN) represent the ordered data in the pooled sample, and
define 2. = 1
1 if Vi corresponds to a member of the Y sample and 0
otherwise (i=l , *-*a N) . If Fx and FY are normal distributions differing
only in location, Pr (Z = l(W) may be expressed as l/[l + exp{-a-m}],
where 8 is the linear discriminant function (LDF) coefficient. Thus, LDF
analysis regressing Z against W using ordinary least squares and
comparing the estimated slope to its standard error is formally
equivalent to the t test (Anderson, 1958). (Both approaches may be -
viewed as asymptotically exact approximations to the permutation test
derived from randomization theory.) This equivalence suggests two
potential sources of inefficiency for the t test: i> the association -
between Z and 'G! is nonlinear, and ii) the association between Z and W may
be estimated more efficiently for non-normal data using the logistic
regression model with maximum likelihood estimates (see Halperin et al.,
1971 and Press and Wilson, 1978).
These considerations suggest that maximum likelihood estimation in
nonlinear logistic regression models may provide a useful extension to
the two sample t test. - Similar conclusions are obtained regarding the
rank sum test from observing that it is formally equivalent to regressing
Zi against i using ordinary least squares. The linearity in this model
requires that the expected number of Y values occurring between

-4-
successive X values increase (decrease) linearly. The expectation for
the run length at any value P of F, is given approximately by
EP = n{Fy[FX -l(P)] - Fy[Fx-l(P-l/m)
In particular, if FX and Fy are normal distributions differing only in
location, the expected run lengths are found to be a nonlinear function
of P, accounting for the inefficiency of the rank sum test relative to
the t test in this situation. Since the curve is concave, a more -
efficient test for normal shift in location may be obtained by using
weights which place greater emphasis on the larger ranks, in agreement
with the findings of Weissfeld and Wieand (1984).
Methods for evaluating nonlinear associations using either ordinary
least squares or logistic regression are, of course, well known. In the
present context we propose investigating possible nonlinearity by fitting
the second degree polynomial model: log odds Pr (Z=llW) = cr+t%?+ykT2, with
an overall test of association obtained by testing the null hypothesis
that 6 = y = 0. Since, in general the distribution of either V or W2
will be distinctly non-normal, we recommend use of maximum likelihood
estimation with logistic regression in preference to ordinary least
squares.
3. EXAMPLES
In this section we consider 3 real data examples, prototypes of some
of the most common studies in medical research, illustrating the
potential usefulness of the proposed methods.

-5-
Example A (randomized clinical trial).
In general terms, we assume patients are randomly assigned to either
of two therapies, experimental (E) or placebo (P), with response measured
by a continuous measurement W. The response in the experimentally
treated group will consist of the placebo effect plus an added treatment
effect if the therapy is efficacious. If the treatment effect adds
precisely A units to W in each member of the population, then FE(w) =
FP(w-A) and shift in location is the correct model for the
alternative hypothesis. However, in practice, the effect of the
experimental therapy will vary among different members of the population.
In particular, it is not uncommon that large segments of the population
will receive little or no benefit from a new therapy. Thus, a realistic
formulation of the alternative hypothesis should incorporate the
possibility of heterogeneous response to therapy.
We illustrate these concerns using data from a study undertaken at
the Mayo Clinic to determine if plasma pheresis therapy over a three week
period has a beneficial effect in treatment of chronic inflammatory
demyelinating polyradiculoneuropathy (CIDP), a relatively common
neurologic disease which may cause prolonged morbidity and even death.
Twenty-nine patients were randomly assigned to either real or sham
pheresis, with neither the patient nor the person measuring response
aware of the treatment assignment. An overall measure of efficacy was
the improvement in a standard clinical neurologic disability score (NDS)
occurring over the 3-week period (Table 1). Details of the study design
and results are reported in Dyck, et al. (Submitted).

-6-
It was anticipated beforehand that pheresis might benefit only a
minority of patients. However, neither the disease etiology nor the
mechanism of the hoped for treatment effect were sufficiently understood
to identify such a subset based on covariate information.
Using a one-sided rank sum test, one observes no evidence of a
beneficial treatment effect, P = .249, and 1 inear logistic regression on
the ranks yields essentially the same results, P = -238. We note,
however, that pheresis treated patients are found among the patients
showing the most deterioration as well as predominating the most improved
group of patients, suggesting that a shift in location model may be
inappropriate. In agreement with this observation and a priori
expectations, there is evidence of a nonlinear association using a second
degree model. The linear and quadratic terms are individually
significant, P = .056 and P = .039 respectively, using two-sided tests.
In order to formulate an overall one-sided test of the null hypothesis
Ho: B=Y=O, we computed the corresponding 2 d.f. chi-square test,
rejecting only if the estimated log odds at k'h exceeded its null
expectation of Ln(n/m>, and obtained P = .027. The nature of the
observed nonlinearity in this instance suggests the speculation that
plasma pheresis may be especially beneficial in accelerating recovery
among patients whose prognosis would have been encouraging even without
therapy.
We note that a somewhat ad hoc test may be based on M = the number
of values in the pheresis sample exceeding the largest value in the sham
group. The null probability that M or more of the largest observations

-7-
would all occur in the pheresis group is obtained by performing Fisher's
exact test on the Z-way table having rows (III, 0) and (n - M, M). In the
present instance, M = 5 and P = .025.
Example B (Epidemiologic evaluation of a risk factor).
We suppose that an observational study is conducted, measuring a
continuous characteristic W in a population (E) of individuals exposed to
a certain risk factor and in a comparable unexposed population (U). If
the effect of exposure is to increase the characteristic in each
individual by a constant amount A, then the shift in location model
HA: FE(w) = F,,(w-A) is appropriate. In practice, however, the effects
of exposure are typically quite variable and large segments of the
population often show little or no effect.
We illustrate with an observational study performed at the Mayo
Clinic to evaluate the effects of in utero exposure to DES. Details of
the study design and results are provided in Leary et al. (1984). Of
particular concern was the possible effect exposure may have had on
anatomical measurements. Flaccid penis diameters as measured in 262
males exposed to DES and 274 unexposed males are shown graphically in
Figure 1. The corresponding means and standard deviations (in cm) were
2.693 f .2709 and 2.669 -+ .2229, respectively. In this instance there
was no a priori expectation for the direction of any DES effect: the
occurrence of unusually small or large values, or both, was plausible.
(We note that an advantage of the quadratic model is that it will be
sensitive to departures from the null hypothesis occurring simultaneously
in both directions.) Thus, all tests reported are two-sided.

-8-
TWO sample t and rank sum tests gave no indication of a difference -
between groups, P = .264 and P = .593, respectively. Linear logistic
regression applied to the untransformed data and the ranks resulted in P
= .264 and P = .592, respectively. However, as alluded to previously, it
appeared probable at the outset that only a subset of exposed subjects
would be affected. This expectation is supported by visual inspection of
the figure and is confirmed using quadratic logistic regression.
Using the untransformed data, both the linear and quadratic terms
are significant, P = .052 and P = .045, respectively. The overall test
for association resulted in P = .045. Using ranks, the linear and
quadratic terms were also significant, P = .017 and P = .009,
respectively, and the overall test yielded P = .028. In view of the
nonlinearity observed, one might speculate that the effect of DES
exposure operates differentially within a subgroup of males, although the
identifying characteristics of this subgroup are unknown.
Example C (Cross-sectional study).
Finally, we consider cross-sectional studies intended to compare a
characteristic in each of two patient populations. Again, rather than
assume that disease increases values by a constant amount relative to a
reference population, it is typically more plausible that the
determination as to whether or not alteration occurs in a given
individual, as well as the magnitude of any change, will depend on both
the characteristics of the patient and the characteristics of the disease
as manifested in that patient.
-

-9-
We illustrate using data (Table 2) from a study by Blumberg, West,
and Ellis (1954) and used by Lehman (1975) to illustrate the rank sum
test. The purpose of the study was to compare psychological test scores
in patients with unstable cancer relative to patients with a stable form
of the disease. Highly negative values were considered indicative of
defensiveness. The results of one-sided t and rank sum tests are P = -
.132 and P = .050, respectively. Using linear logistic regression on the
ranks yielded P = .036. We note, however, that high grade patients are
requested among the least defensive patients as well as predominating
among the most defensive patients suggesting that the shift in location
model may be inappropriate.
Using a quadratic model on the ranks, the two-sided tests for the
linear and quadratic terms individually resulted in P = .133 and
P = .057, respectively, and the overall one-sided test for association
clearly indicated a difference between groups, P = .013. In this
instance a quadratic model was not fitted to the original data which
included both positive and negative values. The evidence for
nonlinearity suggests that increased defensiveness occurs among high
grade patients, but that the group is not homogeneous in this regard. In
view of the heterogeneity in disease status which one would expect to
find within the designation "high grade", as well as differences in the
way different persons may respond to similar situations, this finding
again accords with a priori expectations.

-lU-
4. CENSORED DATA: THE LOG BANK TEST
As discussed by Fleming et al. (19801, the log rank test is
efficient for comparing two samples subject to arbitrary right censoring
when the proportional hazards model holds, whereas the Cehan-Wilcoxon
procedure is relatively more sensitive to early differences. If one can
specify in advance the precise nature of the difference expected, a
corresponding scoring system will provide an efficient test (see
Harrington and Fleming, 1982, Prentice, 1978, and Peto and Peto, 1972).
Fleming et al,, proposed a Smirnov type test in which prior assumptions
regarding the nature of the treatment effect are not required.
Conversely, however, information which may be available regarding these
effects is unused. Another useful approach is to model the relative
hazard as a function of time, as described by Cox, 1972. A similar
approach may also be simply obtained using the preceding methodology.
Formally, if one assumes a common censoring distribution for both
populations, one could ignore the censoring and perform the usual two
sample tests on the observation times or their ranks. By implication,
one could evaluate nonlinearity using the methods proposed previously.
Of course, a more sensitive test is obtained by using scores which take
the censoring into account in defining the independent variable. Since
these scores will typically take on both negative and positive values, we
recommend adding the absolute value of the lowest score to all the scores
in fitting the quadratic model. In the following two examples we
illustrate this approach using log rank scores. Notationally, let

-l.l-
t1 <...> tN) represent the ordered observation times. Define S i
= 1 if
ti corresponds to a death and 0 otherwise and let ni represent the number
of subjects in the risk set just prior to t i (i=l, . . . . N). 'Ihe log rank
i score for t i is given by c. =
1 Z S./n.-1 and Ci
j=l J J = ci+l depending on
whether t i corresponds to a death or censoring, respectively. Let
(a1 <... < WN) represent the ordered log rank scores and define Z. = 1 and 1
Wi corresponds to an observation from the Y sample and 0 otherwise. Ve
propose a log rank type test obtained by regressing Z against k' using
linear logistic regression and evaluating nonlinearity using the
quadratic model described previously.
The next two examples are based on studies conducted at the Mayo
Clinic and discussed by Fleming et al. (1980).
Example D. The first example compares the times to progression among 15
patients with low grade cancer versus 20 patients with high grade cancer.
The experience was similar in both groups for the first 11 months, but
was markedly better among low grade patients beyond 11 months. The two-
sided log rank and Gehan-Wilcoxon tests yielded P = .023 and P = .134,
respectively. Using a generalized Smirnov statistic, Fleming et al.
obtained P = .0022.
Using linear logistic regression with log rank scores, one obtains P
= .022 in agreement with the usual log rank test. However, it is obvious
that the proportional hazards model does not hold. Using quadratic
logistic regression, one obtains P values of .055 and .020 for the linear
and quadratic terms respectively. The overall test for association
-

-12-
yields P = .0027. In this instance, the quadratic analysis is helpful in
confirming the visual impression that the relative hazard is not constant
and appears to increase with time.
Example E. The second example compares the survival experience of 22
patients treated with 5-Fluorouracil (5-FIJI to a second group of 25
patients receiving a control therapy. Visual inspection of the survival
curves (Figure 3) suggests a benefit occurred with 5-FU in the interval
of 2 to 8 months following treatment, but not otherwise. The results of
one-sided log rank and Gehan-Wilcoxon tests in this instance were P =
.418 and P = .127 respectively. Using the generalized Smirnov statistic
resulted in P = .046. Using linear logistic regression one obtains P =
.414 which again agrees with the conventional log rank test. With the
quadratic model, the two-sided tests for the linear and quadratic terms
individually are each significant, P = .033 and .052, respectively. The
overall one-sided test is significant, P = .020. In this case, the
results of the nonlinear analysis appears to support the visual
impression of a benefit associated with 5-FU which is transitory in
nature.
Example F. Our final example is based on the results of a clinical trial
reported by the Gastrointestinal Study Group (1982) comparing
chemotherapy versus combined chemotherapy and radiation therapy in the
treatment of locally unresectable gastric cancer. The data are provided
in Stablein and Koutrouvelis (1985), and result in crossing survival
curves as shown in Figure 4. As indicated by Stablein and Koutrouvelis,

-13-
the log rank test gives P = .64 (two-sided). Results with the Gehan-
Wilcoxon and Smirnov tests are P = .047 and P = .006 respectively. Using
a test designed specifically for sensitivity against crossing hazards,
Stablein and Koutrouvelis obtain P <.Ol.
Using linear logistic regression one obtains P = .64, in agreement
with the usual log rank test. However, with the quadratic model one
obtains P = -0007 and P = .0008 for the linear and quadratic terms, with
the overall 2 d,f. test for association providing P = .0014, confirming
the visual impression of an association with non-proportional hazards.
5. DISCUSSION
In evaluating a treatment effect with uncensored paired data, pre-
and post-treatment, it is often necessary to consider the possibility
that the magnitude of the effect depends on pretreatment levels.
Appropriate methodology generalizing the paired t test, regressing -
observed changes against initial values, are well known and widely used.
(An analogous extension of the signed rank test is to regress the signed
ranks against the pretreatment values.) Although the same problem exists
with unpaired data, the need for analogous methodology generalizing the
two sample t test appears to be less well recognized. -
The possibility of enhancing the power of the rank sum test by
weighting the ranks unequally is not new. A good overview is provided by
Randles and Wolfe (1979), and power comparisons among several procedures
are given by k'eissfeld and Wieand (1984). However, most of the
optimality theory associated with these procedures pertains only to shift
in location alternatives, so that optimization is only with respect to

-14-
FX. The larger problem of nonlinearity does not seem to have been
considered. We believe that, in practice, nonlinearity is the more
significant source of inefficiency. This viewpoint is supported by the
examples, since to the extent that inefficiency was due to the form of F x
one would expect a gain in efficiency using linear logistic regression
relative to the corresponding conventional procedure. In each instance,
however, the two methods provided similar results.
A second concern with the methods alluded to above is that they
require that the weights be prespecified. This is usually impractical,
and any choice may take on the appearance, if not the character, of data
dredging. Adaptive rank tests in which the data are used to fit weights
within a predetermined class have been proposed by Behnen and Huskovz
(1984); Behnen, Neuhaus, and Ruymgaart (1983); Eplett (19821, and Beran
(1974), who demonstrate the potential for enhanced power. However, these
procedures tend to focus on shift in location alternatives, are
relatively difficult computationally, and, perhaps for these reasons, are
in fact rarely used.
Since the need for weighting systems other than those implied by the
standard tests derives from the possibility of nonlinearity in the
underlying model, a reasonable solution would appear to be to fit the
appropriate nonlinear model. The proposed methodology may be viewed as
providing adaptive tests, with the estimated coefficients providing
adaptive weights within the family of models considered.
As indicated in the examples, the need for two sample censored data
procedures which are sensitive to alternatives involving nonproportional
hazards has been well recognized. However, in practice their use
-15-
requires a search for interesting P-values among qualitatively different
tests. As an alternative strategy, we propose a generalization of the
log rank test which is simple to administer and which provides a direct
evaluation of the proportional hazards assumption.
For both the censored and uncensored data situations, it may be
useful to consider models other than second degree polynomials. For .,
example, the model log odds = o + B?" may be worth investigation.
However, as discussed by Gallant (1975, 19771, the null distribution of
the least squares estimators for this model requires further study.
Another approach would be to use a linearizing transformation on B,
enabling one to use the conventional two-sample tests on the transformed
data. However, under the null hypothesis, the effect of selectively
using linearizing transformations will be to artificially decrease the
error mean square, so that the true size of the test will be increased
over the nominal level. Although the error mean square is similarly
decreased by fitting higher order models as we have proposed, the effect
on the size of the test is mitigated by the corresponding increase in the
numerator degrees freedom.
To summarize, the methods proposed here are viewed as complementing
conventional methodology, in much the same way that polynomial regression
enhances the usefulness of simple linear regression, They are analogous
to conventional methods which have been found to be useful in evaluating
paired data, and may be viewed as an extension of this methodology to
unpaired study designs. Since nonlinearity in the two sample setting is
more difficult to identify visually, we recommend routinely checking for

-16-
nonlinearity when performing conventional two sample tests, utilizing
maximum likelihood estimation in conjunction with nonlinear logistic
regression models. In addition to enabling the detection of important
group differences which might otherwise go unobserved, evaluation of the
form of nonlinearity may be valuable in understanding the nature of an
observed difference.
ACKNOkZEDGEMENTS
I would like to thank Dr. Peter Dyck for the use of his data on CIDP
and Dr. Leonard Kurland for the use of the DES data,
-

Table 1. Data from Dyck et al.
i wi -
1 -69.0 2 -7.0
3 -6.8 4 -6.1
5 -6.0
6 -5.2
7 -4.0
8 -3.0 9 -2.5
10 -2.0 11 -0.5 12 +1.5 13 +4.0 14 +5.0 15 +5.5 16 +8.0 17.5 +13.0 17.5 t13.0 19 +15.0 20.5 +16.0
20.5 +16.0 22 +21.5
23 i23.5 24 +26.0
25 i32.4 26 +33.5 27 +47.3 28 i83.0
29 +96.0
zi
0
1
1 1 0 0 1 1
0 1
1 0 0 0
0 0 0 1 0 0 1 0 1
0 1 1
1 1 1
+ values indicate improvement Zi = 1 if pheresis
= 0 if sham
-

i
Table 2. -~ Data from Blumberg et al.
wi zi i wi
1 +10 0 25.5 -13 2 +7 1 25.5 -13 3 +7 1 25.5 -13 4.5 +3 0 25.5 -13
4.5 +3 1 25.5 -13 6 +1 1 29 -14
7 -2 0 30 -14 8 -3 0 31 -16 9 -5 1 32 -16
10 -6 0 33 -16 11.5 -7 0 34 -16 11.5 -7 1 35 -17 13 -8 1 38 -18 16 -9 0 38 -18 16 -9 0 38 -18 16 -9 0 38 -18
16 -9 0 38 -18 16 -9 1 41 -21 20 -11 0 42 -21
20 -11 0 43.5 -22
20 -11 0 43.5 -22 22 -12 0 45 -24
25.5 -13 0 46 -25
- zi
0 1 1 1
1 1 1 0 0 0 1 1 0 1 1 1
1 0 1
1 1 1 1
Negative values indicate defensiveness. Zi = 1 if high grade, 0 if low grade.

Legend for Figures:
Figure 1. Data from DES study comparing 262 exposed and 274
unexposed males.
Figure 2. Times to progression, using the Kaplan-Meier method,
among 20 high grade and 15 low grade patients. (From
Fleming, et. al., 1980.)
Figure 3. Survival curves, obtained using the Kaplan-Meier method,
for 22 5-FU treated patients and 25 controls. (From
Fleming, et. al., 1980.)
Figure 4. Survival curves, obtained using the Kaplan-Meier method
for 45 chemotherapy treated patients and 45 patients
receiving chemotherapy + radiation (From Stablein, et al,
1985).

FIGURE 1
- DES unexposed -- DES exposed
Percent frequency
20 2.4 26 3.2 36 40 Diameter, cm

FIGURE 2
80
80
--
%
L
I Low Grade --
i
(15) --------,
I w----
High Grade (20)
0 3 8 9 12 15 18 21 24
Months after start of Rx
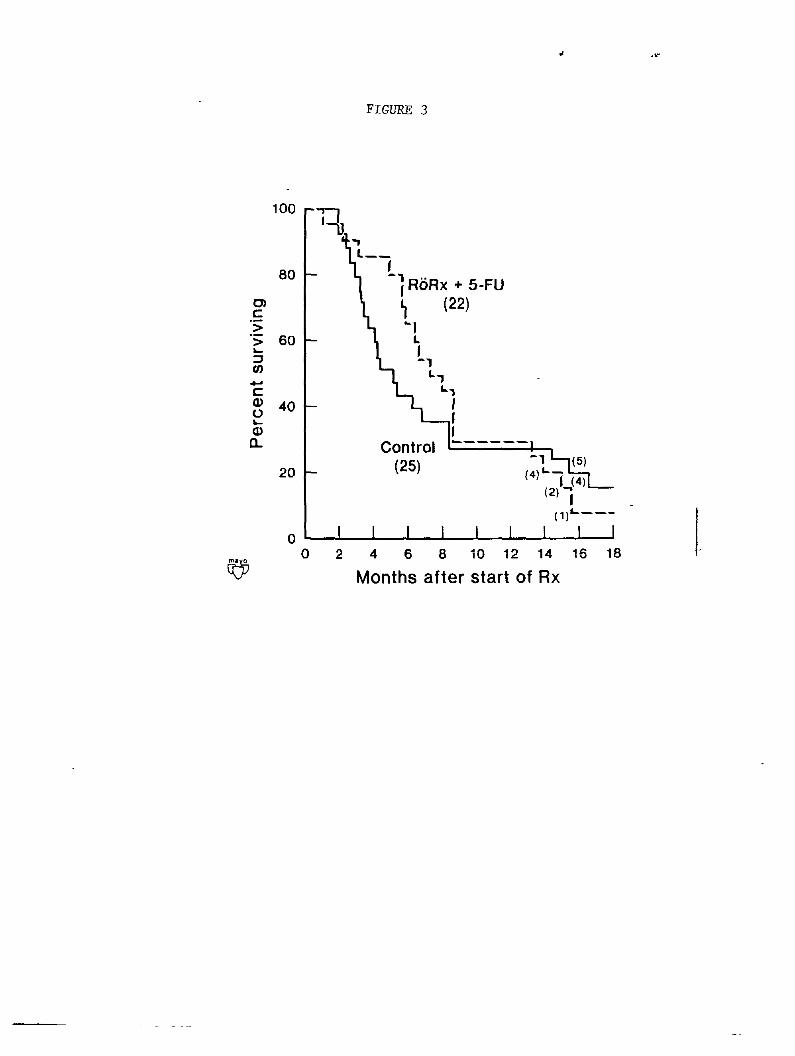
FIGURE 3
80
20
0
3
0 2 4 6 8 i0 12 14 16 18
Months after start of Rx

FIGURE 4
100
80
0
Chemotherapy + radiation (45)
I
VJ o’234567 Years after start of Rx

REFERENCES
Anderson, T.W. (1958). Introduction to Multivariate Statistical Analysis. Wiley and Sons, NY, p. 140.
Behnen, K. and Huskovii, M. (1984). A simple algorithm of scores and power behavior of the corresponding Stat. - Theor. Meth. 13, 305-325.
Behnen, K, Neuhaus, G., and Ruymgaart, F. (1983). TWJ
for the adaptation rank test. Comm.
sample rank estimators of optimal nonparametric score-functions and corresponding adaptive rank statistics. Ann. Stat. 11,
Beran, R. (1974). Asymptotically efficient adaptive rank estimates in location models. Ann. Stat. 2, 63-74.
Blumberg, West, and Ellis (1954). A possible relationship between psychological factors and human cancers. Psychosomat. Med. 16, 277- 286.
Dyck, P-J., Daube, J., O'Brien, P.C., et. al. Plasma exchange beneficial in chronic inflammatory demyelinating polyradiculoneuropathy. NEJM (Submitted).
--
Cox, D.R. (1972). Regression models and life tables (with discussion). JRSS B 34, 198-220.
Eplett, W.J.R. (1982). Rank tests generated by continuous piecewise linear functions. Ann. Stat. 10, 569-574.
Fleming, T.R., O'Fallon, J.R., O'Brien, P.C., and Harrington, D.P. (1980). Modified Kolmogorov-Smirnov test procedures with application to arbitrarily right-censored data. Biometrics 36, 607- 625.
Gallant, A.R. (1975). Nonlinear regression. Amer. Stat. 29, 73-81.
Gallant, A.R. (1977). Testing a nonlinear regression specification: A nonregular case. JASA 72, 523-530.
Harrington, D.P. and Fleming, T.R. (1982). A class of rank test procedures for censored survival data. Biometrika 69, 553-66.
Leary, F.J., Resseguie, L.J., Kurland, L.T., et al. (1984). Evaluation of males exposed in utero to diethylstilbestrol. JAMA 252, 2984- -- 2989.
Lehman, E.L. (1975). Nonparametrics: Statistical Methods Based on Ranks. Holden-Day, San Francisco, p. 61.
Markowski, E.P. and Hettmansperger, T.P. (1982). Inference based on simple rank step score statistics for the location model. JASA 77, 901-7.

REFERENCES (continued)
Peto, R. and Peto, J. (1972). Asymptotically efficient rank invariant test procedures (with discussion). JRSS A 135, 185-206.
Prentice, R.L. (1978). Linear rank tests with right censored data. Biometrika 65, 167-79.
Prentice, R.L. and Marek (1979). A qualitative discrepancy between censored data rank tests. Biometrics 35, 861-867.
Press, S.J. and Wilson, S. (1978). Choosing between logistic regression and discriminant analysis. JASA 73, 699-705.
Randles, R.H. and Wolfe, D.A. (1979). Introduction to the Theory of Nonparametric Statistics. Riley, New York.
Stablein, D.M. and Koutrouvelis, I.A. (1985). A two-sample test sensitive to crossing hazards in uncensored and singly censored data. Biometrics 41, 643-652.
k'eissfeld, L.A. and Wieand, H.S. (1984). Bounds on efficiencies for some two-sample nonparametric statistics. Coma. Stat. - Theor. Meth. 13, 1741-57.


![arXiv:2007.05477v1 [cs.LG] 10 Jul 2020 · zero-sum games have many properties not extensible to games with more players or non zero-sum payo s. We observe that the extensions above](https://static.fdocuments.us/doc/165x107/5f569aa5dfe2a1126c245a5a/arxiv200705477v1-cslg-10-jul-2020-zero-sum-games-have-many-properties-not-extensible.jpg)