Comparing the efficiency of pradofloxacin and - Start the efficiency of pradofloxacin and ......
25
Comparing the efficiency of pradofloxacin and ciprofloxacin with respect to preventing the emergence of fluoroquinolone resistance in E. coli Ruonan Zheng Degree project in biology, Master of science (1 year), 2008 Examensarbete i biologi 30 hp till magisterexamen, 2008 Biology Education Centre and Department of Cell and Molecular Biology, Microbiology Programme, Uppsala University Supervisors: Diarmaid Hughes and Linda Marcusson
Transcript of Comparing the efficiency of pradofloxacin and - Start the efficiency of pradofloxacin and ......

Comparing the efficiency of pradofloxacin andciprofloxacin with respect to preventing theemergence of fluoroquinolone resistance in E.coli
Ruonan Zheng
Degree project in biology, Master of science (1 year), 2008Examensarbete i biologi 30 hp till magisterexamen, 2008Biology Education Centre and Department of Cell and Molecular Biology, Microbiology Programme,Uppsala UniversitySupervisors: Diarmaid Hughes and Linda Marcusson

1
SUMMARY Since they were first isolated, antibiotics have become important medicines all over the world as highly effective drugs used to treat bacterial infections. However, as time goes by, with their success has followed many problems associated with over-usage, and the increasing prevalence of antibiotic resistant bacteria. Fluoroquinolones are synthetic antimicrobial drugs of the quinolone family and are very widely used in both clinical and veterinary medicine. Pradofloxacin (PRA) and ciprofloxacin (CIP) are two fluoroquinolones. Ciprofloxacin has been in use for over 20 years and is regarded as a highly effective antimicrobial drug whereas pradofloxacin is a new drug in development. In order to compare the efficiency of PRA and CIP, I measured the minimum inhibitory concentration (MIC) and mutant prevention concentration (MPC) of seven E. coli strains including five isogenic strains with different mutant alleles (gyrA S83L; gyrA D87G) and two clinical strains with first- or second-step resistance mutation in gyrA compared to the wild type strain. MIC means the lowest drug concentration needed to inhibit the visible growth of bacteria, and MPC is the lowest concentration of drug used to prevent the growth of the least- susceptible single- step mutant in a large bacterial population. The first step mutant which was achieved from the wild type has lower resistance toward drugs than the second step mutants which was based on the first step mutant. The results showed that PRA and CIP had very similar characteristics but PRA was associated with a slightly lower MIC and a slightly higher MPC than CIP. Thus, the mutant selective window (MSW) representing the concentration range between MPC and MIC was slightly larger for PRA than for CIP. In addition, I made evolution experiments to compare the evolution of resistance to PRA and CIP, using thirteen isogenic strains carrying different resistance-associated mutations (wild- type; marR; acrR; gyrA) and mutator alleles (wild-type; mutM; mutY) having different mutation increasing strengths. The data indicated that the genotype of a strain with regard to pre-existing resistance mutations strongly affected the evolution of resistance under selection. Furthermore, they showed that even a two-fold increase in mutation rate caused a significant increase in the rate of resistance evolution under selection. Comparing the two drugs, the results showed that resistance of bacteria was slightly more likely to evolve in the presence of PRA than CIP. Overall, the data reflected the importance of defining the mutant-development potential of a new drug to provide guidelines for an optimized anti-mutant strategy.

2
INTRODUCTION Escherichia coli and urinary tract infections E. coli is a Gram-negative microorganism that lives in the intestine of warm-blooded animals. Most E. coli in the natural environment are not virulent or harmful to other organisms, otherwise, in some cases are helpful for the host, for example benefit the host by producing vitamin K2 which mainly functions as a required cofactor for the carboxylation (by CO2) of protein-bound glutamate residues to form y-carboxyglutamates in mammalian metabolism (Bentley et al., 1982, Hudault et al., 2001, Reid et al., 2001). E. coli is a widely used model organism in biotechnology for example in molecular cloning and protein expression. However, some E. coli strains are highly virulent, and can lead to many diseases, such as gastroenteritis, diarrhea, and urinary tract infections and neonatal meningitis, sometimes peritonitis and mastitis are induced (Todar, 2007).
Figure 1: Scanning electron micrograph of Escherichia coli (Internet source: http://en.wikipedia.org/wiki/Image:EscherichiaColi_NIAID.jpg) Caused mostly by E. coli, urinary tract infection (UTI) is a common disease that mainly infects women and can infect any part of the urinary tract, commonly in the bladder (called cystitis), and in the most serious cases, the kidneys (called pyelonephritis). About 40-50% women in US were bothered by UTIs (Kunin, 1994). During the process of clinical therapy related to the urinary system, for example genitourinary operations and catheterization, some accidents or mistakes enhance the risks for UTI (Orenstein and Warner, 1999). According to a survey in 17 western countries which is the first international survey for the UTIs with 4734 women, for at least 80% cases of uncomplicated UTI, E. coli is the principle original pathogen (Kahlmeter, 2003). More serious in chronic urinary tract infections, E. coli can escape the innate immune system of the host to form intracellular bacterial communities by attacking superficial umbrella cells (Justic et al., 2006, Ehrlich et al., 2005). Antibiotics and antibiotic resistance Many different kinds of antimicrobial drugs have been invented to treat bacterial infections in people and animals. Antibiotics are chemotherapeutic agents that function by inhibiting the

3
growth of, or killing, bacteria. Ideally, a good and applicable antibiotic should have no or few side effects on the patient, should be highly specific with regard to target activity, and should be convenient to use. Different drugs can be used in different forms: orally taken medicine; injection antibiotic; eye drops liquid or external cream. Antibiotics play a major part in UTI treatment and among those that have been used commonly worldwide are ampicillin, amdinocillin, fosfomycin, trimethoprim and several fluoroquinolones (Komp et al., 2003). Different classes of antibiotics have specific targets. β-lactam antibiotics works by binding to the active site of penicillin-binding proteins (PBPs) which is transpeptidases in peptidoglycan synthesis, irreversibly inhibiting the PBPs and preventing the final cross-linking of the peptidoglycan layer during cell wall formation (Waxman and Strominger, 1983). As the first invented antimicrobial drug, sulfonamides act on the metabolism of folic acid. The antibiotic rifampicin blocks RNA transcription by binding to RNA polymerase (Hartmann et al., 1967). The fluoroquinolones, the subject of this project, function on cell replication by targeting the activity of DNA gyrase and topoisomerase IV which are enzymes affecting regulation of chromosome supercoiling and introducing double-strand breaks into the chromosome, inhibiting both DNA replication and RNA transcription.
Figure 2: Resistant mechanisms of bacteria (provided by Linda Marcusson). Effective antibiotic drugs are very important for controlling infections by bacteria. But an increase in the prevalence of resistant bacteria in recent decades due to over-use or misuse of antibiotic drugs worldwide makes previous effective treatment much more difficult to achieve. It has been reported that more than 40% of antibiotics in Western countries (Europe, North America, and Australia) are being improperly used, 20-50% unnecessary use of antibiotic for human and 40-80% highly unnecessary for agricultural use (Wise et al, 1998). In many countries, especially in developing countries, antibiotics are applied without doctor’s prescription (Cars and Nordberg, 2004). In addition, in order to prevent diseases, many antibiotics are added to animals’ feed resulting in the antibiotic resistance through food chain (Johnson et al., 2006). Along with using effective antibiotic drugs to treat UTIs, the number of bacteria resistant is rising every year, and the antibiotic selective pressure is becoming much more serious even in the countries having strict control of antibiotics usage (Perfeito et al., 2007).

4
There are three different ways for bacteria to become less susceptible to antibiotics (see Figure 2). First, antibiotic target modification and protection by mutation can reduce effect from antibiotics. In some bacteria, the mechanism is production of a specific protein to protect the target from the antibiotic. The second way is decreasing the intracellular drug quantity by less influx or more efflux of antibiotics. Some bacteria have mutations in the gene encoding proteins which were involved in controlling ions and other small molecules diffusion, for example outer membrane proteins (OMPs), and avoid the entrance of an antibiotic. In another example, increasing expression of AcrAB-TolC (a multiprotein transmembrane complex) induced by mutation, functions to pump out antibiotics from E. coli and leads to drug influx decreasing. A third mechanism of resistance is increasing the production of enzymes that modify or otherwise inactivate the drug (Hughes and Andersson, 2001). Fluoroquinolones (FQ) and mechanisms of FQ in E. coli
Nalidixic acid Ciprofloxacin Pradofloxacin
Figure 3: Chemical structure of nalidixic acid, ciprofloxacin and pradofloxacin. The original quinolone used in medicine was nalidixic acid. All subsequent variants of this have a fluoro group attached to the central ring structure because this increases their antimicrobial activity. It’s reported that the most important class of antimicrobial drugs applied for UTIs treatment in Western Europe and North America is fluoroquinolone family (Naber, 2000). Fluoroquinolones occupy about 18% of the total market for antimicrobial drug. Four generations of fluoroquinolones have been perfected in attempts to change the biological spectra of activity, achieve different in vivo half- lives, and improve distribution in the body, and reduce side-effects, some of which have been prevalently applied in the clinic to treat skin and soft tissue infection, bone and joint infection etc., such as norfloxacin, ciprofloxacin and nadifloxacin of the second generation, and grepafloxacin and temafloxacin of the third generation of fluoroquinolones (Naber, 2000). Ciprofloxacin (CIP) is an antibiotic drug that belongs to the fluoroquinolones and has been widely used to treat lower respiratory infections, urinary tract infections and sexually transmitted disease (STDs). The drugs have been developed to be convenient for oral, parenteral and topical use. Because of long time and over-usage, bacterial CIP-resistant infections are increasing and CIP may gradually lose effect against some organisms. Ciprofloxacin treatment results in adverse side effect in 5.8% of all cases investigated in US and Europe, 3.4% gastrointestinal (GI), 1.1% central nervous system (CNS), 0.7% skin (Rubinstein, 2001). The side effects are rash, photosensitivity, nausea,

5
vomiting, headaches, and restlessness etc. Pradofloxacin is a new fluoroquinolone, being developed and just used to treat bacterial infections in dogs and cats so far (Bartel et al., 2001, Stephan et al., 2003). Fluoroquinolones target bacterial replication by inhibiting the functions of DNA gyrase and topoisomerase IV. During DNA replication, DNA gyrase is an important enzyme introducing negative supercoils, and paving the way for DnaA initiator protein loading to the replication origin and for replication forks movement. The enzyme tetramer, gyrase, is formed by two GyrA and two GyrB subunits encoded by gyrA and gyrB (Snyder and Champness, 2003). The GyrA subunits function in the DNA double strands breakage and rejoining reaction whereas the GyrB subunits provide the energy for GyrA through ATP hydrolysis. The other enzyme, topoisomerase IV acts by relaxing negative supercoils, and promoting decatenation of chromosomes to balance the supercoil structure of DNA during replication or transcription (Snyder and Champness, 2003). Topoisomerase IV is also formed by four subunits, two ParC and two ParE. The fluoroquinolones form a ternary complex with DNA and enzymes (DNA gyrase) in front of the replication fork, bind to the cut DNA and block the process of rejoining and further inhibit the progress of polymerase. All of these quickly stop DNA replication, RNA transcription, and bacterial growth. In addition, the eventual release of the cut DNA results in cell death. Fluoroquinolone resistance arises primarily through target gene mutation and mutations that increase drug efflux. Weak resistance to fluoroquinolones is usually associated with single resistance mutations, but the accumulation of several mutations leads to higher levels of resistance according to experimental evidences (Komp et al., 2005). Mutations altering the genes of drug targets occur mostly in the so-called quinolone resistance-determining region (QRDR) of gyrA and parC; mutations in gyrB and parE also increase resistance to fluoroquinolones. In addition, resistance is also conferred by the presence of a plasmid expressing a target protecting protein, Qnr (a member of the pentapeptide repeat family). Other mutations that could enhance resistance involve increasing expression of the endogenous transmembrane efflux pump, AcrAB-TolC (Alekshun et al., 1997, Maneewannakul et al., 1996, Okusu et al., 1996, Wang et al., 2001). A decrease in the efflux of the drug can be achieved by mutations that knock-out marR (multiple antibiotic resistance) encoding a repressor of the marA gene, a regulator of the AcrAB-TolC efflux pump, or that knock-out acrR, a repressor of acrA (efflux pump protein). Besides, the rates at which novel mutations arise have influence on the rate at which ordinary mutations arise. The bacteria with increased mutation rates (so-called mutators) can develop resistance faster than many natural and clinical isolates of bacteria that are weak mutators. Mutators may thus be an important factor on the development of resistance in natural populations. Minimum inhibitory concentration, mutant prevention concentration and mutant selection window As an important index used to representing the antibiotics, the minimum inhibitory concentration, MIC, is the lowest drug concentration required to prevent any visible growth of

6
bacteria in media after a standardized incubation. In clinical practice, the concentration of antibiotic achieved during treatment should be maintained above MIC so as to prevent the growth of the infecting bacterial population. However, treatment just above MIC concentrations would not be enough to prevent the growth and selection of pre-existing resistant mutants in the infecting bacterial population. The mutant prevention concentration, MPC, another index important for drug efficiency representation, is defined as the lowest concentration of drug needed to prevent the growth of the least-susceptible single-step mutant emerging in a large bacterial population (Dong et al., 1999, Baquero, 1997). Thus, two or more resistance mutations would have to occur for bacteria to grow at the MPC. The antibiotic concentration range between MIC and MPC is called the mutant selection window (MSW) (see Figure 4), a drug concentration interval within which susceptible cells are inhibited whereas first-step resistant mutants will grow. At drug concentrations below MIC resistant mutants are not selected, whereas at concentrations above MPC, all of the first-step resistant mutants are inhibited. In order to prevent the selection of resistant mutants it is necessary to maintain drug concentrations above MPC during treatment.
Figure 4: Mutant selection window. MIC represents the least drug concentration to inhibit wild type bacterial growth; MPC is the lowest drug concentration to totally prevent the growth of first step mutants and appearance of further step mutants. MSW is the selection window between MIC and MPC for the single step mutations (kindly provide by Linda Marcusson).
Evolution E. coli is an organism with an average spontaneous mutation rate of 10-9-10-10 mutations per base pair per generation (Andersson and Hughes, 1996, Drake et al., 1998). Upon exposure to antibiotics, resistant mutants will be selected, but mutations increasing the mutation rate may also be indirectly selected. Bacteria with increased mutation rates are more likely to generate the mutations resulting in resistance to the antibiotics that will be beneficial in a selective environment, especially if that requires a multistep mutational process. In an evolution experiment, each well in a cell culture plate contained a separate bacterial population, representing an independent lineage; different lineages created different resistance to antibiotics and survived until different antibiotic concentrations (Orlen and Hughes, 2006).

7
When selected for growth in media with increasing drug concentrations, these separate bacterial populations went extinct, or acquired mutations that allow their continued survival and growth. The survival lineages of each strain in 96 wells represented the evolution efficiency. Some studies have pointed out that fluoroquinolone resistance mutations accumulating in the process of evolution lead to fitness costs in vitro and vivo (Gualco et al., 2007). Thus, the survival of resistant strains under selection depends on two evolutionary pathways: evolution of increased resistance, and evolution of growth fitness.
Project aim
The goal of this project was to compare the efficiency of two fluoroquinolone drugs, pradofloxacin and ciprofloxacin, using E. coli as a model organism. MIC and MPC were measured using seven E. coli strains to determine whether a new drug (PRA) was effective in comparison with an established drug (CIP) against five isogenic strains and two clinical strains in preventing the emergence of antibiotic resistance. In addition, the evolution of resistance to CIP and PRA was measured in thirteen isogenic strains carrying different resistance associated mutations in the presence and absence of two different weak mutator alleles to investigate the influence of mutators on the evolution of resistance to each drug.

8
RESULTS
Minimal inhibitory concentration results E- test is a convenient method used to measure minimal inhibitory concentration (MIC) for ciprofloxacin (CIP). From the strip, MIC can be directly read out from the E-test concentration scale as the lowest concentration step above the intercept of bacterial growth with the strip.
Figure 5: E- test plates. The CIP E-test strips were put in the middle of the plates. Around each strip is an area where bacterial growth is inhibited. MIC can be directly read from the strip.
MIC test for CIP was performed both by E-test and by the dilution method. The MIC for pradofloxacin (PRA) was only tested by the dilution method (no E-test strips are available for PRA because it is not yet on the market). All the PRA and CIP solutions used in the MIC test were diluted from the same PRA and CIP 500 μg/ml stock solution. The results in the table 1 were based on three independent experiments. MIC values were different among isogenic strains with different resistance-associated mutations, and clinical strains carrying different first and second step resistance mutations. The wild type strains, LM179 and LM1067 without any resistance mutations had the lowest MIC. Strains carrying single mutations had higher MICs than the wild types, whereas the double mutation strain LM625 had the highest MIC value. The strains carrying the gyrA S83L single mutation (LM1071, LM378, and C128) had higher MIC values than the strains with the gyrA D87G mutation. Comparing the MIC of PRA and CIP, the MIC values of all the strains show that the MIC of PRA was on average slightly lower than the MIC of CIP. PRA inhibited the growth of all the strains carrying different mutation at a lower concentration than CIP, predicted that it may have a higher efficiency than CIP. The MIC test results of CIP from the two different methods (E-test and broth dilution) showed no big difference. Table 1: MIC for PRA and CIP for ten isogenic strains.
Strain (genotype) MIC (μg/ml)
PRA CIP

9
LM179 (MG1655, wt) 0.012 0.012 LM1067 (ATCC 8739, wt) 0.012 0.016 LM1070 (gyrA D87G) 0.047 0.064 LM1071(gyrA S83L) 0.094 0.125 LM378 (gyrA S83L) 0.094 0.19 C2(gyrA D87G, UTI) 0.023 0.047 C128(gyrA S83L, UTI) 0.094 0.125 LM202 (△marR) 0.023 0.032 LM351 (△acrR) 0.023 0.023 LM625 (gyrA S83L, D87N) 0.19 0.19
Mutant prevention concentration results The mutant prevention concentration, MPC, represents the drug concentration that inhibits the growth of the least susceptible, single step mutant in a large population (1010 CFU) and was measured by using a large number of Mueller Hinton Agar (MHA) plates. Initially, I tested concentrations with a large step size, then narrowed it down to a smaller step size, and finally measured MPC with a concentration step-size limited to 0.1 μg/ml. A large population was needed to observe single step mutants, at least 1010 cells per drug concentration. From the results in Table 2 and 3, it is evident that the wild type strains had the lowest MPC value among the seven strains tested. LM1071, LM378 and C128 carrying a gyrA S83L single mutation had higher MPC values than the strains with gyrA D87G mutation (LM1070 and C2). The comparison between the MPC for PRA and CIP shows that the MPC values for CIP were a little higher than for PRA for gyrA S83L single mutants, whereas the MPC values for PRA were higher than for CIP for gyrA D87G single mutants. The MPC values of two wild type strains were similar to each other Table 2: The last step MPC test results for PRA for seven strains.
Strain Concentration of PRA (μg/ml) LM179 0.1 (+, +, +) 0.2 (-, -, 3) 0.3 (-, -, -) LM1067 0.1 (+, +, +) 0.2 (1, 2, 3) 0.3 (-, -, -) 0.4 (-, -, -) LM1070 0.5 (7, 1, 22) 0.6 (2, 1, 2) 0.7 (1, 1, -) 0.8 (-, -, -) LM1071 1 (3, 7, 14) 1.1 (1, 6, 4) 1.2 (-, -, 2) 1.3 (-, -, -) 1.4 (-, -, -) 1.5 (-, -, -) C2 0.3 (9, 2, 14) 0.4 (-, -, 1) 0.5 (-, -, -) 0.8 (-, -, -) C128 0.5 (7, 5, 10) 0.6 (2, -, -) 0.7 (-, -, -) 0.8 (-, -, -) LM378 1.5 (+, +, +) 1.6 (13, -, 1) 1.7 (-, -, -) 1.8 (-, -, -) 1.9 (-, -, -) 2 (-, -, -)
Table 3: The last step MPC test results for CIP for seven strains.
Strain Concentration of CIP (μg/ml) LM179 0.05 (+, +, +) 0.1 (1, 3, +) 0.2 (-, -, 2) 0.3 (-, -, -) LM1067 0.02 (+, +, +) 0.05 (2, +, +) 0.1 (-, -, 1) LM1070 0.2 (+, +, +) 0.3 (+, +, +) 0.4 (+, 8, 9) 0.5 (-, -, -) LM1071 1.1 (+, +, +) 1.2 (+, +, +) 1.3 (4, 10, 9) 1.4 (-, -, -) 1.5 (-, -, -) C2 0.1 (+, +, +) 0.2 (11, 9, 4) 0.3 (-, -, -)

10
C128 0.7 (+, +, +) 0.8 (+, +, +) 0.9 (1, 2, 3) 1 (-, -, 1) LM378 0.5 (+, +, +)
1.8 (5) 1 (+, +, +) 2 (-)
1.5 (+, +, +) 2.2 (-)
2 (-, 2, +) 2.5 (-)
2.5 (-, -, -)
Each row in tables 2 and 3 represents the last set of PRA or CIP concentrations tested for each strain. MPC were measured by independent triplicate experiments for each concentration. All the PRA and CIP solutions were prepared from the same stock solution separately. The information in brackets showed the results of three independent experiments- the total number of colonies in 10 plates with the same drug concentration. “+” means the number of visible colony is more than 10. “-” means no colony grows at the 10 plates. The concent-ration of drug that prevented the growth of resistant colonies in at least two tests was defined as the MPC of the strain. The numbers marked in bold therefore represented the MPC values. In the MPC test experiments, all the drug concentrations used were much higher than MIC value of each strain. On the plates with drug concentrations close to MPC, just a few colonies grew out after 96 h incubation, typically less than 10 colonies per plate. The mutant colonies that appeared on the plates with drug concentration close to MPC typically had a slower growth rate than the original strain. The results of triplicate experiments were not always the same, with different numbers of mutant colonies. This is to be expected because different spontaneous mutations may be present in different independent cultures. The concentration of drug that inhibited the growth of resistant colonies in at least two out of three experiments was determined as MPC. Mutant selection window (MSW) MSW is a drug concentration range between MPC and MIC, and represents the drug concentrations at which resistant mutants are subject to selection. The MPC depends on the mutant genotype of the strain, and there is no direct relationship between MIC and MPC. From results in table 4, it’s obvious that LM1067 (wt), C2 and LM1070 with same mutant allele (gyrA D87G) had a smaller MSW for PRA than for CIP. The wild type LM1067 had the biggest PRA/CIP ratio, whereas LM179 had the smallest ratio. Table 4: MIC, MPC, MSW values for PRA and CIP for seven isogenic strains.
Strain PRA (μg/ml) CIP (μg/ml) PRA/CIP1
MIC MPC MSW2 MIC MPC MSW2 MIC MPC MSW2
LM179 0.012 0.2 0.188 0.012 0.3 0.288 1 0.667 0.653 LM1067 0.012 0.3 0.288 0.016 0.1 0.084 0.75 3 3.429 LM1070 0.047 0.8 0.753 0.064 0.5 0.436 0.734 1.6 1.727 LM1071 0.094 1.3 1.206 0.125 1.4 1.275 0.752 0.929 0.946 LM378 0.094 1.7 1.606 0.19 2.2 2.01 0.495 0.773 0.799 C2 0.023 0.4 0.377 0.047 0.3 0.253 0.489 1.333 1.49 C128 0.094 0.7 0.606 0.125 1 0.875 0.752 0.7 0.693
1 ratio of values for PRA and CIP 2 MSW = MPC – MIC

11
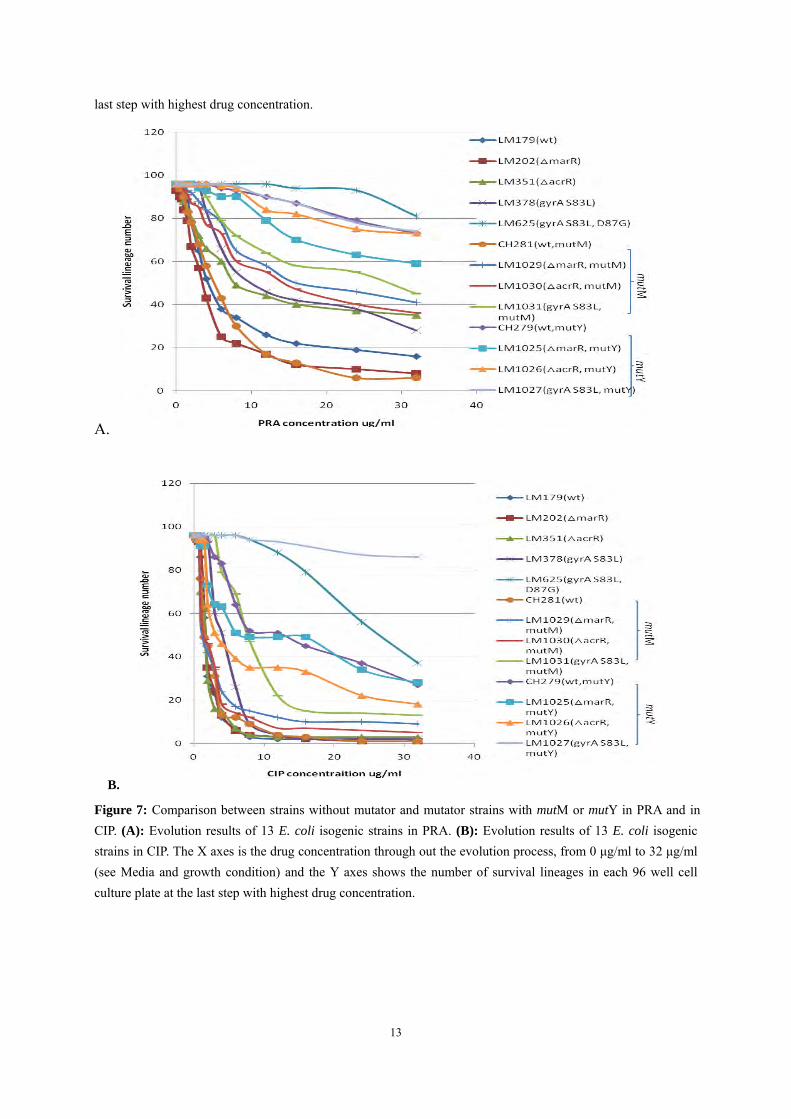
Evolution of resistance to CIP and PRA In order to investigate the evolution of isogenic strains with different mutant alleles under increasing PRA and CIP concentration, I performed evolution experiments using microtiter dishes. First I performed evolution experiment with PRA and CIP by using five isogenic strains carrying the resistance associated mutations (LM179, LM202, LM351, LM378 and LM625) to see the evolution of resistance to PRA and CIP of each strain. Then four strains with the mutator mutM (CH281, LM1029, LM1030 and LM1031) and four strains with the mutator mutY (CH279, LM1025, LM1026 and LM1027) were tested through evolution experiment with the same set of PRA and CIP concentrations. The 96 cultures in each plate evolved as 96 independent lineages. The aim was to see how many lineages of each strain would succeed in creating the resistant mutations required by the selection and whether this differed according to the drug and the initial genotype of the strain. The mutator strains used in this experiment were achieved by previous work in Hughes’s lab by transferring alleles into the original strains by P1 transduction. Because LM625 with the alleles gyrA S83L D87G is already relatively resistant to PRA and CIP (and evolved efficiently to high-level resistance with a wild-type mutation rate), this strain was not included in the mutY and mutM part of the study. For the PRA evolution experiments (see Figure 6 and 7), it is clear that the relative efficiency of evolution to resistance to PRA of the five strains is LM202, LM179, LM351, LM378 and LM625, from weakest to strongest according to the final number of lineages that survived selection. In the process of evolution, each strain had a different trend. Thus, the LM202 and LM179 lineages went extinct early, whereas LM351 and LM378 survived longer, and LM625 lineages only started to go extinct at very high PRA concentrations. When the mutator allele mutM, was introduced into the strains, it greatly enhanced the survival of LM1029, and marginally enhanced the survival of LM1031. For the other strains the effect of mutM was very small. The strains with mutY all gained a large increase in the number of surviving lineages. In particular, CH279 (LM179 with mutY) had a significant increase with about 10 times as many lineages surviving. Similarly, for LM1025 (LM202 plus mutY) there was also a distinct increase in the number of lineages that survived. In the CIP evolution experiments, the pattern observed was similar, but not as remarkable as for PRA. Thus, LM625 also had the strongest ability to develop resistance, but was much weaker than in the PRA evolution process. LM202, LM351, LM378, and the strains with the mutM/ mutY mutator alleles showed a similar relative pattern under selection by CIP. However it was notable that in general, under selection by CIP, strains were more prone to extinction than under equivalent selection by PRA. The strain that showed the greatest enhancement in survival when the mutM/ mutY mutator alleles were added was LM378. This strain went from almost all lineages going extinct to more than 80 surviving in the presence of the mutator alleles.

12
A.
B.
C.
Figure 6: Comparison of results with PRA and CIP in all the strains. (A): Evolution results of 5 E. coli isogenic strains without antibiotics in PRA and CIP. (B): Evolution results of 4 E. coli isogenic strains with mutator mutM in PRA and CIP. (C): Evolution results of 4 E. coli isogenic strains with mutator mutY in PRA and CIP. The X axes is the drug concentration through out the evolution process, from 0 μg/ml to 32 μg/ml (see Media and growth condition) and the Y axes shows the number of survival lineages in each 96 well cell culture plate at the
13
last step with highest drug concentration.
A.
B.
Figure 7: Comparison between strains without mutator and mutator strains with mutM or mutY in PRA and in CIP. (A): Evolution results of 13 E. coli isogenic strains in PRA. (B): Evolution results of 13 E. coli isogenic strains in CIP. The X axes is the drug concentration through out the evolution process, from 0 μg/ml to 32 μg/ml (see Media and growth condition) and the Y axes shows the number of survival lineages in each 96 well cell culture plate at the last step with highest drug concentration.

14
DISCUSSION MIC and MPC comparison between isogenic strains with CIP and PRA Seven E. coli stains were used in MIC and MPC experiments. According to their different resistant mutations, the strains appeared different on phenotypes, such as colony shape, size, color, growth speed etc. Strains with mutation in gyrA grew more slowly than the LM1067 (ATCC WT), but faster than mutants △marR and △acrR, which indicated that different mutant had different effects on growth fitness of the strains, the gene marR and acrR played an important role in bacterial growth process. The results of the MIC test for CIP by the broth dilution method showed no big difference between the E-test and dilution method. They differed by just one concentration step for some strains. This indicated that the MIC values for PRA determined by the broth dilution method were believable. The mutant gene, gyrA S83L, D87N was associated with the highest MIC to CIP and PRA among the alleles tested, and the single mutant gene, gyrA S83L had a higher MIC than gyrA D87G, marR, or acrR, but was much weaker than double mutant allele. The relative order of the mutant alleles was similar for MPC. All the MIC values of PRA for the strains tested were lower than for CIP. This might mean that PRA has a higher efficiency to inhibit E. coli than CIP, and can inhibit the growth of wild-type bacteria at lower drug concentration. The MPC results in each step of the test may have some differences even with the same drug concentration (some parts in table 2 and 3). This might be due to differences in the strain populations in each experiment, or to slight differences in actual drug concentrations in media prepared at different times etc. A practical conclusion is that it is important to make stock solutions of the drug very carefully. A good drug for clinical use should have a low MIC and narrow MSW for different strains. According to the table 4, PRA has similar or lower MIC than CIP and similar MPC with CIP, so a little larger MSW than CIP. For many years, ciprofloxacin has been well studied in antibiotic resistance researches. As a new fluoroquinolone (FQ), pradofloxacin is studied for MIC and MPC by comparing to well-used CIP. It has been reported by Wetzsten in 2005 that the affinity between primary targets is comparable because of similar MICs of all fluoroquinolones for E. coli, and PRA has very similar or only slightly higher MPC value than CIP which has the lowest MPC among many other FQ, and my results confirm the PRA efficiency. Besides, S83L and D87G are two mutantion genes in gyrA which can induce highest level of resistance to nalidixic acid (Komp et al, 2003). PRA may induce stronger resistance through evolution than CIP In order to find the resistance through evolution process, I performed 32 steps evolution experiment of PRA and CIP. The results of the evolution part of the project show that the rate of mutations to resistance of all strains increased significantly after the addition of the mutator alleles (mutM and mutY). From the number of surviving lineages, it can be concluded that mutY had a much stronger ability to enhance the development of resistance under selection than mutM. This was in agreement with expectations as mutY is stronger mutator than mutM

15
which creates lower mutation rate than mutY (Örlén and Hughes, 2006). Previous research shows that the biological cost of multiple mutations may influence the evolution of E. coli strains, the more multi step resistance-associated mutations the more reduction in biological fitness (Komp et al, 2005). The mutators influenced the evolution of each strain differently which may be due to the different initial genotypes of each strain. Some of genes are used in comparing efficiency of different drugs by transduction, such as mut gene family. In addition to mutations that directly affect the level of resistance it is also reported that mutator alleles can drive the development of fluoroquinolone resistance in E. coli, by increasing the emergence rate of rare new mutations (Örlén and Hughes, 2006). Comparing the results between PRA and CIP, it seemed that PRA might have a stronger promotion in selecting resistant E. coli than CIP, regardless of whether or not the original strain is a mutator. Bacterial antibiotic resistance is an important problem to address. It is becoming more serious and poses the medical profession and the pharmaceutical industry with a series of difficult challenges. Among these challenges are the improvements of dosing regimens so as to reduce the selection of resistant mutants during antimicrobial drug therapy. In this study I have evaluated a new fluorouquinolone PRA (being developed for use in animal medicine) in comparison with a well established one, CIP (used in human medicine). The measurements of MIC and MPC reveal that PRA has very similar properties compared to CIP, although the MSW may on average be slightly broader. This conclusion is supported by the series of evolution experiments made which show that on average resistance to PRA develops more frequently than resistance to CIP. Taken together, there results show that PRA has good antimicrobial properties (at least in vitro) but the use of an optimized anti-mutant dosing rule will be important to prevent the selection of resistant mutants. The future work can be done probably are: continue to do some compare between PRA and CIP using more isogenic and clinical strains; further test the MPC and MSW of PRA; drug dose determination for human use. And it would be necessary to set up a good and convenient method to test MIC and MPC of a new drug and determine the proper dose.

16
MATERIALS AND METHODS
Bacterial strains Eighteen E. coli strains were used in this project, seven for minimum inhibitory concentration (MIC) and mutant prevention concentration (MPC) testing and the other thirteen strains were used in the evolution experiment. The strains are shown in Table 5 and 6. Table 5: Strains used in MIC and MPC test:
Strain Description and Genotype Parental strain Source and reference LM179 MG1655, laboratory wild type strain Hughes’s lab (Olofsson et
al., 2007, Blattner et al., 1997)
LM1067 ATCC 8739, wild type control strain American Type Culture Collection (Wetzstein 2005, Bagel et al., 1999)
LM1071 AP 4.24/2, gyrA S83L LM179 Bayer Health Care (Wetzstein 2005)
LM1070 AO 4.24/1, gyrA D87G LM179 Bayer Health Care (Wetzstein, 2005)
C2 (UTI) Clinical strain, gyrA D87G AB Biodisk Culture Collection
C128 (UTI) Clinical strain, gyrA S83L AB Biodisk Culture Collection
LM378 gyrA S83L LM179 (Marcusson 2007)
LM1067 is a wild type control strain used for fluoroquinolone target identification. LM1070, LM1071, and LM378 are mutants derived from wild type strain LM179 with different mutation altering amino acid in gyrA. Table 6: Isogenic strains and strains with different mutator alleles used in evolution of resistance to PRA and CIP.
Strain Description and Genotype Parental strain Mutator Strength Source and referenceLM179 MG1655, laboratory wild
type strain Hughes’s lab
(Olofsson et al., 2007, Blattner et al., 1997)
LM202 mar△ R LM179 Marcusson, 2007 LM351 acr△ R LM179 Marcusson, 2007 LM378 gyrA S83L LM179 Marcusson, 2007 LM625 gyrA S83L, D87G LM179 Marcusson, 2007 CH281 mutM (mutator allele) LM179 2× Bhagwat, 2005 LM1029 marR, mutM LM202 2× Marcusson, 2007 LM1030 acr△ R, mutM LM351 2× Marcusson, 2007 LM1031 gyrA S83L, mutM LM378 2× Marcusson, 2007

17
CH279 mutY (mutator allele) LM179 10× Miller, 1992 LM1025 mar△ R, mutY LM202 10× Marcusson, 2007 LM1026 LM1027
acr△ R, mutY gyrA S83L, mutY
LM351 LM378
10× 10×
Marcusson, 2007 Marcusson, 2007
LM202 and LM351 are mutants derived from LM179 with deleted gene marR and acrR respectively. LM625 is double mutant strain (S83L, D87G) in gyrA derived from LM179. LM281, LM1029, LM1030 and LM1031 are mutants with mutator allele mutM derived from LM179, LM202, LM351 and LM378 respectively. LM279, LM1025, LM1026 and LM1027 are mutants with mutator allele mutY derived from LM179, LM202, LM351 and LM378 respectively. The strains were streaked on LA plates and incubated in 37 °C over- night to get fresh single colonies on the plates. The strains were only used five days and then re-streaked only once before retrieving new strains from the -70 °C freezer. Media and growth condition LB liquid media: 100 g NaCl, 50 g yeast extract and 100 g tryptone were mixed with 1 L sterile water, pH adjusted to 7.2-7.4, then autoclaved. LA is solid LB medium with 20 g agar (OXOID LTD)/L. LB and LA medium were prepared by lab assistant. MHB liquid medium: Mueller Hinton Broth (MHB, Difco Laboratories, Detroit, MI, USA) was prepared according to instructions given by the manufacturers. 21 g MHB powder was suspend in 1 L sterile water, and autoclaved. Mueller Hinton Agar (MHA, Difco Laboratories) solid media were prepared according to instructions given by the manufacturers: 38 g MHA powder was dissolved in 1 L sterile water and autoclaved. MHA medium with different PRA or CIP concentration used in MPC assays were prepared by adding appropriate PRA or CIP stock solution to autoclaved MHA medium with a temperature not higher than 50 °C and stored in cold room, medium with PRA were protected from light. Incubation of strains in liquid LB or MHB media without any antibiotic was carried out at 37 °C with shaking. For each strain, one colony was picked from LA plate to LB or MHB media and after at least 6 h growth, the bacterial concentration reached 109 CFU (colony forming unit)/ml, OD540~1.0 which is the proper culture used in this project (Marcusson personal communication). Antibiotics Ciprofloxacin and Pradofloxacin powders were provided by Bayer AG, Leverkusen, Germany. Pradofloxacin (PRA) was prepared by dissolving in sterile water to achieve a stock solution of 500 μg/ml , stored at room temperature and protected from light. Ciprofloxacin (CIP) was prepared by dissolving in 500 ml 0.1 M NaOH to a stock concentration of 500 μg/ml and stored at 4 °C.

18
In antibiotic resistant evolution experiment the set of PRA and CIP solutions with different concentrations were prepared by diluting stock solution in LB and MIC test of PRA and CIP in which solutions were prepared in MHB. Minimal inhibitory concentration (MIC) All strains were tested for MIC of CIP and PRA independently in triplicate experiments by broth dilution or by E-test. MIC of CIP was determined by E-test (AB Biodisk, Solna, Sweden) according to the instruction given by the manufacturer. One colony of a strain was picked from an over- night incubated LA plate and completely suspended in a glass tube with 1 ml 0.9% NaCl by vortexing. A MacFarlane = 0.5 standard tube was used as comparison to adjust the turbidity to that which represented 108 CFU/ml. Then the NaCl culture was spread evenly onto an MHA plate by a cotton swab and an E-test strip was attached to the middle of MHA plate, incubated at 37 °C for about 16 h. The MIC value of CIP was directly read out from the E-test strip on the plate after over night incubation, shown as the edge of the circle without growth of bacteria across the scale of the strip. MIC measurement of PRA was performed by dilution method. The 500 μg/ml PRA stock solution was diluted into a set of concentrations between 0.002 and 32 μg/ml with MHB. 180 μl PRA solution of each concentration was added to a well in a 96 wells cell culture plate (Beyotime Biotechnology). Over-night cultures of all strains containing about 109 bacterial cells per ml were diluted to 106 CFU/ml in 0.9% NaCl, 20 μl of 106 CFU/ml MHB culture was added into the wells containing PRA dilutions. The plate was sealed and incubated at 37 °C in the dark for 24 h. The culture of each strain with the lowest concentration of the PRA solution without any visible growth of bacterial represented the MIC for PRA for this strain. The dilution method was also used to test MIC for CIP. Mutant prevention concentration (MPC) For each E. coli strain, one colony was picked from an LA plate and inoculated into certain volume Mueller-Hinton broth which depended on the number of tested drug concentrations (10 ml/ concentration) in a falcon tube and incubated over night at 37 °C with shaking. The over- night culture was expected to contain 109 cells/ml, so an aliquot culture was then centrifuged at 3200 g for 20 min and kept on ice. After pouring away the supernatant, the pellet was re-suspended in 1 ml MHB per 10 ml culture. The culture was mixed completely and divided to 10 MHA plates containing a defined concentration of PRA or CIP, 100 μl/plate= 109 cells/plate, and spread evenly on the plates. Each strain was tested at different set PRA and CIP concentrations, starting from a larger range to a smaller range of PRA and CIP concentrations. All the plates were observed four days to record the changes on the plates, such as mutant colonies number, and mutant appearance time. In case no colony appeared at any tested concentration after 96 h incubation, the strain was continually tested on a set of lower concentrations at the same incubation condition. If colonies appeared at all tested concentrations, a set of higher concentrations would be tested. Once colonies appeared on the MHA plate, the following test range was minimized. The final MPC result was accurate to 0.1 μg/ml PRA or CIP. All the drug concentrations tested in this experiment are listed in table 7. The MHA media with lowest concentration of PRA or CIP which inhibited the appearance of colony was the MPC value. The final set of concentration including MPC was determined at three independent experiments.

19
Table 7: Antibiotic concentration steps used to measure MPC for 7 strains. Strain Concentration of PRA (μg/ml) Concentration of CIP (μg/ml) LM179 0.1 0.2 0.3 0.2 0.3 0.4 0.05 0.1 0.2 LM1067 0.1 0.2 0.3 0.4 0.1 0.2 0.3 0.4
0.02 0.05 0.1 LM1070 1 2 3 4 1 2 3 4 0.1 0.5 1 0.1 0.5 0.8 1 0.5 0.6 0.7 0.8 0.2 0.3 0.4 0.5 LM1071 1 2 3 4 5 3 4 5 6 7 1 1.5 2 2.5 1.5 2 2.5 3 1 1.1 1.2 1.3 1.4 1.5 0.1 0.5 1 1.1 1.2 1.3 1.4 1.5 C2 0.1 0.2 0.3 0.1 0.2 0.3 0.3 0.4 0.5 0.8 C128 0.5 0.8 1.2 1.5 0.5 0.8 1.2 1.5 0.5 0.6 0.7 0.8 0.7 0.8 0.9 1 LM378 0.5 1 1.5 2 2.5 0.5 1 1.5 2 2.5 1.5 1.6 1.7 1.8 1.9 2 1.8 2 2.2 2.5 The first MPC test was performed in MHA media with the first row of PRA and CIP concentrations for each strain which were determined according to previous experiments or the MIC value of each strain. The following rows of PRA and CIP concentrations were the second or the third set of concentration tested in this experiment to get the MPC value for each strain. The concentration tested was accurate to 0.1 μg/ml and the last step was measured in triplicate. Evolution of fluoroquinolone resistance The PRA and CIP concentrations (μg/ml) used in this procedure are ranged from 0.002 to 32 ug/ml in steps of approximately 1.5. For each strain, 5 ml LB culture was prepared by picking a colony from an LA plate to LB by over-night shaking. A fresh LB over-night culture was diluted to 102 cells/ml, and 200 μl was added to each well of a 96 well cell culture plate with a barrier pipette. The 96 well cell culture plate was sealed tightly with plastic film and set over-night shaking at 37 °C in a shaker with sticky surface. 5 μl LB culture from each well was transferred to the corresponding well in a new 96 well cell culture plate containing 200 μl 0.002 μg/ml PRA or CIP in LB. After each 23-24 h growth cycle, 5 μl LB culture of each well was transferred to 200 μl LB media with higher concentration PRA or CIP. In each step the 96 well cell culture plates were incubated over-night with shaking at 37 °C. During the course of the evolution experiment, the bacteria in each well were seen as an independent lineage of a strain. Strains with mutator mutM or mutY alleles were also tested with the same evolution procedure as just described.

20
ACKNOWLEDGEMENT I would like to express my sincerely thankfulness to Prof. Diarmaid Hughes for accepting me to this interesting project and providing me a exciting and happy experience in his group, who is tall with great kindness, wisdom, patience, giving me, great support concern and help during my project, is not only as a supervisor but also like a elder friend. I am also really grateful to Linda Marcusson who guiding me through my experiments from the first day I started my project for her kind helps, encouragements, and understanding. Her enthusiasm and inspiration on research impressed me a lot. Besides, many thanks for our group members, Disa, Marie, Jonas. I appreciate yours’ amity, nice accompany, and a lot helps in this half year. Sincerely gratitude to Karin Carlson for her helps through out my project: kind encouragement for my presentations, and patient help on my degree project report. At last, I would like to say thanks to all my dear friends in Sweden, without their concern and encouragement I would not have such a nice time here. Great miss and thanks to my parents and boyfriend who are my strong support for my life and study here far away from home.

21
REFERENCES Alekshun, M. N., and Levy S. B. 1997. Regulation of chromosomally mediated multiple antibiotic resistance: the mar regulon. Antimicrob. Agent Chemother. 41: 2067-2075. Andersson D.I. and Hughes D. 1996. Muller’s ratchet decreases fitness of a DNA- based microbe. Proc. Natl. Acad. Sci. USA. 93: 906-907. Baquero F. and Negri M.C. 1997. Strategies to minimize the development of antibiotic resistance. J Chemother. 9 Suppl 3: 29-37. Blattner F.R., Plunkett G. 3rd, Bloch CA, Perna NT, Burland V, Riley M, Collado-Vides J, Glasner JD, Rode CK, Mayhew GF, Gregor J, Davis NW, Kirkpatrick HA, Goeden MA, Rose DJ, Mau B, Shao Y. 1997. The complete genome sequence of Escherichia coli K-12. Science 277: 1453-74. Bartel, S., Jaetsch T., Himmler T., Rast H.-G., Hallenbach W., Heinen E., Pirro F., Scheer M., Stegemann M., Stupp H.-P., and Wetzstein H.-G.. 2001. Possibly substituted 8- cyano-1- cyclopropyl-7-(2, 8- diazabicyclo-[4.3.0]- nonan-8-yl)-6-fluoro-1, 4- dihydro-4- oxo-3- quinolin carboxylic acids and their derivatives. U.S. patent NO: 6,323,213. Bagel S., Hüllen V., Wiedemann B. and Heisig P. 1999. Impact of gyrA and parC mutations on quinolone resistance, doubling time, and supercoiling degree of Escherichia coli. Antimicrob. Agents Chemother 43: 868-875. Bentley R., Meganathan R. 1982. Biosynthesis of vitamin K (menaquinone) in bacteria. Bacteriological Reviews 46: 241-280. Cars O. and Nordberg P. 2004. Antibiotic resistance- The faceless threat. A background document from the Uppsala meeting on the Global Threat of Antibiotic Resistance. Http://www.reactgroup.org. Domagala J. 1999. Effect of fluoroquinolone concentration on selection of resistance mutants of Mycobacterium bovis BCG and Staphylococcus aureus. Antimicrob. Agents Chemother. 43: 1756-8. Dong Y., Zhao X., Domagala J. and Drlica K. 1999. Effect of fluoroquinolone concentration on selection of resistance mutants of Mycobacterium bovis BCG and Staphylococcus aureus. Antimicrob. Agents Chemother. 43: 1756-8. Drake J.W., Charlesworth B., Charlesworth D., and Crow J.F. 1998. Rates of spontaneous mutation. Genetics 148: 1667-1686. Ehrlich G.D., Hu F.Z., Shen K., Stoodley P., Post J.C. 2005. Bacterial plurality as a general

22
mechanism driving persistence in chronic infections. Clin Orthop Relat Res: 20-4. Gualco L., Schito A.M., Schito G.C., Marchese A. 2007. In vitro activity of prulifloxacin against Escherchia coli isolated from urinary tract infections and the biological cost of pruliflosacin resistance. Int. J. Antimicrob. Agents Chemother. 19: 152-60. Hartmann G, Honikel K.O., Knüsel F., Nüesch J. 1967. The specific inhibition of the DNA-directed RNA synthsis by rifamycin. Biochim. Biophys. Acta. 145:843-844. Hooper D.C. 2001. Emerging mechanisms of fluoroquinolone resistance. Emerg. Infect. Dis. 7: 337-341. Hopkins K.L., Davies R.H., and Threlfall E.J. 2005. Mechanisms of quinolone resistance in Escherichia coli and Salmonella: recent developments. Int. J. Antimicrob. Agents 25: 358-373. Hudault S., Guignot J. and Servin A.L. 2001. Escherichia coli strains colonizing the gastrointestinal tract protect germfree mice against Salmonella typhimurium infection. Gut 49:47-55. Hughes D. and Andersson D.I. 2001. Target Alterations Mediating Antibiotic Resistance. In: Hughes, D. and Andersson, D.I.(eds.), Antibiotic development and resistance pp.23-36. Tylor& Francis, London and New York. Johnson J.R., Kuskowski M.A., Menard M., Gajewski A., Xercavins M., Garau J. 2006. Similarity between human and chicken Escherichia coli isolates in relation to ciprofloxacin resistance status. J Infect Dis. 194: 71-8. Justice S.S., Hunstad D.A., Seed P.C., Hultgren S.J. 2006. Filamentation by Escherichia coli subverts innate defenses during urinary tract infection. Proc Natl. Acad. Sci. USA 103: 19884-9. Kahlmeter G. 2003. An international survey of the antimicrobial susceptibility of pathogens from uncomplicated urinary tract infections: the ECO.SENS Project. J Antimicrob Chemother. 51:69-76. Klapacz J. and Bhagwat A. S. 2005. Transcription promotes guanine to thymine mutations in the non- transcribed strand of an Escherichia coli gene. DNA Repair (Amsterdam) 4: 806-813. Komp L.P., Karlsson Å and Hughes D. 2003. Mutation Rate and Evolution of Fluoroquinolone Resistance in Escherichia coli Isolates from Patients with Urinary Tract Infections. Antimicrob. Agents Chemother. 47: 3222-3232.

23
Komp L.P., Marcusson L.L, Sandvang D., Frimodt-Møller N., Hughes D. 2005. Biological Cost of Single and Multiple Norfloxacin Resistance Mutations in Escherichia coli Implicated in Urinary Tract Infections. Antimicrob. Agents Chemother. 49: 2343-2351. Kunin C.M. 1994. Uninary tract infections in females. Clinical Infectious Diseases 18, 1-12. Maneewannakul K., and Levy S. B. 1996. Identification for mar mutants among quinolone- resistant clinical isolates of Escherichia coli. Antimicrob. Agents Chemother. 40: 1695-1698. Marcusson L.L. 2007. Resistance to Fluoroquinolones in Escherichia coli: Prevention, Genetics and Fitness Costs. PHD thesis, Uppsala University, pp. 14, 18-19, 22-23, 36. Marcusson L.L., Olofsson S.K., Komp Lindgren P., Cars O., Hughes D. 2005. Mutant prevention concentrations of ciprofloxacin for urinary tract infection isolates of Escherichia coli. J. Antimicrob. Agents Chemother. 55: 938-943. Miller J. H. 1992. A short course in bacterial genetics: a laboratory manual and handbook for Escherichia coli and related bacteria. Cold Spring Harbor Laboratory Press, Plainview, N. Y. Naber K.G. 2000. Survey on antibiotic usage in the treatment of urinary tract infections. J. Antimicrob. Chemother 46: 49-52. Okusu H., Ma D., and Nikaido H. 1996. AcrAB efflux pump plays a major role in the antibiotic resistance phenotype of Escherichia coli multiple- antibiotic- resistance (Mar) mutants. J. Bacterial. 178: 306-308. Orenstein R. and Wong E. S. 1999. Urinary tract infections in adults. American family physican. 59:1225-1234. Olofsson S.K., Marcusson L.L., Strömbäck A., Hughes D., Cars O. 2007. Dose- related selection of fluoroquinolone- resistant Escherichia coli. J. Antimicrob. Chemother. 60: 795-801. Örlen H. and Hughes D. 2006. Weak Mutators Can Drive the Evolution of Fluoroquinolone Resistance in Escherichia coli. Antimicrob. Agents Chemothe. 50: 3454-3456. Perfeito L., Fernandes L., Mota C., Gordo I. 2007. Adaptive Mutations in Bacteria: High Rate and Small Effects. Science 317, 813 – 815. Reid G., Howard J. and Gan B.S. 2001. Can bacterial interference prevent infection? Trends Microbiol. 9:424-428. Rocky Mountain Laboratories, National Institutes of Health, part of the United States Department of Health and Human Services. 2005. Scanning electron micrograph of
24
Escherichia coli. WWW document http://en.wikipedia.org/wiki/ Image: Escherichia Coli_ NIAID. jpg. Date visited 25th Feb. 2008. Rubinstein E. 2001. History of quinolones and their side effects. Chemotherapy. 47: 3:3-8. Snyder L. and Champness W. 2003. Molecular Genetics of Bacteria. Genes: replication and Expression. 2nd ed. American Society for Microbiology, USA. Stephan B., Hellmann K., Liege P., Granier S., Knoppe T.N., Heinen E. and Greife H.A. 2003. Clinical efficacy and safety of pradofloxacin in the treatment of canine pyoderma and wound infections under field conditions. J. Vet. Ther. 26: 217-218. Todar K. 2008. Pathogenic E. coli. Online Textbook of Bacteriology. University of Wisconsin-Madison Department of Bacteriology. Retrieved on 2007-11-30. WWW document: http://www.textbookofbacteriology.net/e.coli.html. Date visited 25th Feb. 2008. Waxman D.J. and Strominger J.L. 1983. Penicillin-binding proteins and the mechanism of action of bata-lactam antibiotics. Annu Rev Biochem 52:825-869. Wang H., Dzink-Fox J.L., Chen M., Levy S.B. 2001. Genetic characterization of highly fluoroquinolone- resistant clinical Escherichia coli strains from China: role of acrR mutations. Antimicrob. Agents Chemother. 45: 1515-1521. Wetzstein H.G. 2005. Comparative Mutant Prevention Concentrations of Pradofloxacin and Other Veterinary Fluoroquinolones Indicate Differing Potentials in Preventing Selection of Resistance. Antimicrob. Agents Chemothe. 49: 4166-4173. Wise R., Hart T., Cars O., Streulens M., Helmuth R., Huovinen P., and Sprenger M. 1998. Antimicrobial resistance. Is a major threat to public health. Bmj 317: 609-610.