Comparing the Effect of Natural Versus Processed Sugar on...
26
Comparing the Effect of Natural Versus Processed Sugar on College Student's Cognitive Ability Item Type text; Electronic Thesis Authors Votruba, Cassandra Dee Publisher The University of Arizona. Rights Copyright © is held by the author. Digital access to this material is made possible by the University Libraries, University of Arizona. Further transmission, reproduction or presentation (such as public display or performance) of protected items is prohibited except with permission of the author. Download date 12/07/2018 01:09:38 Link to Item http://hdl.handle.net/10150/297779
Transcript of Comparing the Effect of Natural Versus Processed Sugar on...

Comparing the Effect of Natural Versus ProcessedSugar on College Student's Cognitive Ability
Item Type text; Electronic Thesis
Authors Votruba, Cassandra Dee
Publisher The University of Arizona.
Rights Copyright © is held by the author. Digital access to this materialis made possible by the University Libraries, University of Arizona.Further transmission, reproduction or presentation (such aspublic display or performance) of protected items is prohibitedexcept with permission of the author.
Download date 12/07/2018 01:09:38
Link to Item http://hdl.handle.net/10150/297779

Comparing the Effect of Natural Versus Processed Sugar on College Student's
Cognitive Ability
By
Cassandra Dee Votruba
A Thesis Submitted to The Honors College
In Partial Fulfillment of the Bachelor's degreeWith Honors in
Public Health
UNIVERSITY OF ARIZONA
MAY2013
~'Dr. Heidi own
College of Public Health

The University of Arizona Electronic Theses and DissertationsReproduction and Distribution Rights Form
The UA Campus Repository supports the dissemination and preservation of scholarship produced by University of Arizonafaculty, researchers, and students. The University Library, in collaboration with the Honors College, has established acollection in the UA Campus Repository to share, archive, and preserve undergraduate Honors theses.
Theses that are submitted to the UA Campus Repository are available for public view. Submission of your thesis to theRepository provides an opportunity for you to showcase your work to graduate schools and future employers. It also allowsfor your work to be accessed by others in your discipline, enabling you to contribute to the knowledge base in your field.Your signature on this consent form will determine whether your thesis is included in the repository.
Student signature: _ Date: _
Name (Last, First, Middle)\.JcA:(,U~, C(A<:.s~cL"'"" 1>e..e...
Degree tiUe (eg BA, BS, BSE, BSB, BFA):
"BSHonors area (eg Molecular and Cellular Biology, English, Studio Art):
f>\l\.:>\\<'" -\\.e.(A.\t~
Date thesis submitted to Honors College:
L\h.q \.~TiUe of Honors thesis:
Co""," . ("-, ~e. £f~d 0\ f\\,,-\u,c-,\ \ls·\'('ot€!:se.d S\JjW- 0\'\ Col\..e~t.~tuc.e..I\-\-'S Co~nlti\l{ A. ',\'\\-y
The University of Arizona Library Release Agreement
I hereby grant to the University of Arizona Library the nonexclusive worldwide right to reproduce and distribute mydissertation or thesis and abstract (herein, the "licensed matenals''), in whole or in part, in any and all media of distributionand in any format in existence now or developed in the future. I represent and warrant to the University of Arizona that thelicensed materials are my original work, that Iam the sole owner of all rights in and to the licensed materials, and that noneof the licensed materials infringe or violate the rights of others. Ifurther represent that Ihave obtained all necessary rights topermit the University of Arizona Library to reproduce and distribute any nonpublic third party software necessary to access,display, run or print my dissertation or thesis. Iacknowledge that University of Arizona Library may elect not to distribute mydissertation or thesis in digital format if, in its reasonable jUdgment, it believes all such rights have not been secured.
Student signature: f---J~~~hf.f~CJ~~~~~",=,~
'",,-",eu "'IJUS Repository!
Date: ~,--Z.'i_1_13 _
Date: Lf/2-1 ( VJ f "1I
D No, do not release my thesis to the UA Campus Repository.
Last updated: 04101113

Abstract:
The average college student living on campus does not consume a healthy, well
balanced and nutritious diet. Thus, a question was formed as to how to assist students in
doing well in classes through their diet. This study examines how the consumption of
sugar affects cognitive functioning, specifically examining the different effects between
natural and processed sugars compared to water alone. It was hypothesized that there
would be a difference in cognitive functioning between the three study groups with natural
sugar having the greatest positive influence on cognition. Fifty resident students at Colonia
de La Paz at the University of Arizona were recruited to participate in this study.
Participants completed an initial cognitive test, consumed a substance that contained either
processed sugar, natural sugar, or a placebo and then took a final cognitive test. The
difference between those tests where then calculated and compared statistically. A general
health and knowledge survey was also conducted. There was a statistically significant
difference in cognition levels between the three groups with a positive trend in
improvement after the ingestion of natural sugar.
Research Question:
How is cognitive ability among college students affected by natural sugar versus
processed sugar?
Introduction:
In modern America, college is a time when students are beginning their independent
lives and preparing for future employment. College is a stressful time for students due to
their course load, examination stress and changes from adolescents to adulthood
(Cousineau, Goldstein, & Franko, 2004). For many students, this is their first time on their
own, with the freedom to develop their own study and eating habits (Cousineau, et al.,
2004). The ability to focus and function at a more optimal level requires a specific level of
nutrition that is often not being reached. College students are often found to have very
irregular diets due to their late night studying, lack of access to healthy food, lack of
knowledge about nutrition, and indifference to eating healthy (Boyle & Holben, 2013). With
more college campuses converting their cafeteria styled restaurants to food courts,

students have easier access to unhealthy foods (Strout, 2007). Fast foods available in foods
courts have high energy densities, high glycemic indexes and are provided in too large
portions, which contributes to the unhealthy diet (Rosenheck, 2008).
An individual who does not partake in a breakfast meal has diminished cognitive
functioning and is more likely to perform badly on specific tasks set before them (Kaplan,
Greenwood, Winocur, & Wolever, 2001). A study found that eating breakfast supports
improvements in both short-term and long term effects of cognitive functioning,
supporting the need for breakfast programs for school aged children (Taki et al., 2010).
College students are notorious to skip a meal on occasion and it has been proven that this
affects their performance on tests and reaction times (Smith, Kendrick, Maben, & Salmon,
1994).
Students lack of nutrient rich diets, require one to question how their diet can be
supplemented to improve performance on tests through an improvement in cognitive
functioning. Previous studies have examined the various types of foods that affect cognitive
functioning; protein, carbohydrate, iron, glucose, caffeine, and herbal supplements
(Hoyland, Lawton, & Dye, 2008). It was found that glucose has the largest affect upon
cognitive functioning and is the best hope for increasing cognitive functioning with the end
result of better exam scores for college students (Hoyland, et al., 2008).
Glucose is the brains primary source of energy, which means that all brain activity
and cognitive functioning is dependent upon the body’s glucose levels (Hoyland, et al.,
2008). Research suggests that memory ability and enhancement is associated with changes
in blood glucose levels. Increasing blood glucose levels has led to improvement in memory
among Alzheimer’s patients (Craft et al., 1996). Likewise, studies have shown that Type I
diabetics exhibited diminished mental function during hypoglycemic periods (Hoyland, et
al., 2008).
While previous studies have examined the effect glucose has on cognitive function,
studies have not examined the effect of different forms of glucose (e.g., natural versus
processed) on cognitive function. I tested the axiom, “natural is always better,” by
examining whether natural or refined sugar had a stronger effect on cognitive function.

Sugar is difficult to find in its most natural and least processed form, with the exception of
honey. The majority of sugar available on market or in foods has undergone a refining
process that changes the way the sugar functions in the human body. Refined sugars
include sucrose (table sugar), fructose (extracted from fruit), corn syrup, coconut palm
sugar, cane juice, and agave syrup. When standardized to a tablespoon, different sugars
possess different values on the glycemic index. The glycemic index is a method of
measuring and placing value on the effect the sugar has on the body in terms of how
quickly it is metabolized and how it affects blood sugar levels in the body. Glucose has a
glycemic index of 100 while table sugar is 60, fructose is 12-23, corn syrup is 75, coconut
palm sugar is 35, cane juice is 43 and agave syrup is 10-19 ("Livestrong.com," 2013).
Processed sugars have a lower glucose index indicating they have a slower glucose and
energy release during digestion (Rozan et al., 2008). It is unknown whether variation in
cognitive functioning results from consumption of different types of sugar.
Cognitive tests are useful to measure cognitive functioning. Cognitive tests range in
cognitive modalities that include memory, perception, vigilance, attention, accuracy, and
information processing (Hoyland, et al., 2008). Short-term and working memory can be
tested using verbal short term memory tests (such as free recall), visuo-spatial short-term
memory (Rey-Osterrieth Complex Figure Task), working memory and mental arithmetic
(Serial Three/Seven Task), and numeric short-term memory (digit span task) (Hoyland, et
al., 2008). Delayed memory can be examined through verbal or spatial capacities which are
similar to the short term memory tests, except for a delayed time between receiving the
information and having to recall the knowledge (Hoyland, et al., 2008). Verbal fluency tests
examine the retrieval of verbal information stored in long-term memory, while
attention/vigilance is tested through the Bakan task that requires participants to respond
to a specific string of digits within a series (Hoyland, et al., 2008). Reaction time is tested
through direct measure of reaction time (Hoyland, et al., 2008).
This study utilizes a cross-sectional study design to examine the irregularity in
nutrition, bringing forth the question of how irregular nutrition is affecting the cognitive
functioning of the students and their ability to perform well during their undergraduate
college careers. This latter question is examined by a randomized control trial. I
hypothesized that participants that consume natural forms of sugar will perform with
higher cognitive functioning compared to participants that consume processed sugar or
placebo drink. The findings have implications for whether colleges should provide
nutritious meals in resident halls rather than the current food court style that is becoming
more prevalent across university campuses (Strout, 2007). Moreover, this study provides
direction on whether college nutrition services should be concerned about the type of
sugar used in student meals.
Methods:
Participants Selection:
The target population for this study was college students in resident halls on the
University of Arizona campus. College students are often alone for the first time in their
lives and have not previously had to make conscious decisions about healthy eating or
understand how nutrition affects their body both physically and mentally. Typically,
students in resident halls have limited access to kitchens and appliances to make their own
meals which requires them to rely upon the university restaurants to provide their
nutrition. Likewise, many of these students do not have their own vehicles which make it
difficult to purchase food at stores or eat at healthier restaurants off campus. Thus, they are
left with the options available on campus that includes fast food chains like Burger King ®
and Papa John’s ®.
The study sample was drawn from Colonia de la Paz residence hall (where the PI is
the Resident Assistant). Students volunteered, with informed consent (UA IRB #
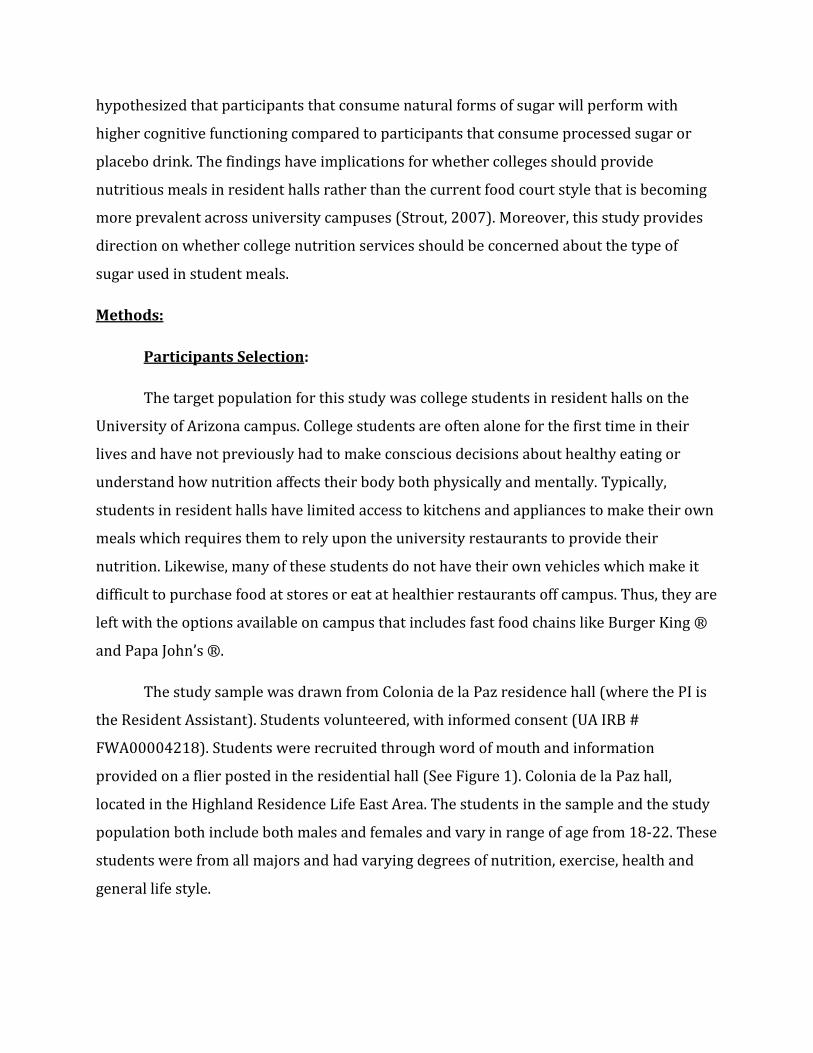
FWA00004218). Students were recruited through word of mouth and information
provided on a flier posted in the residential hall (See Figure 1). Colonia de la Paz hall,
located in the Highland Residence Life East Area. The students in the sample and the study
population both include both males and females and vary in range of age from 18-22. These
students were from all majors and had varying degrees of nutrition, exercise, health and
general life style.
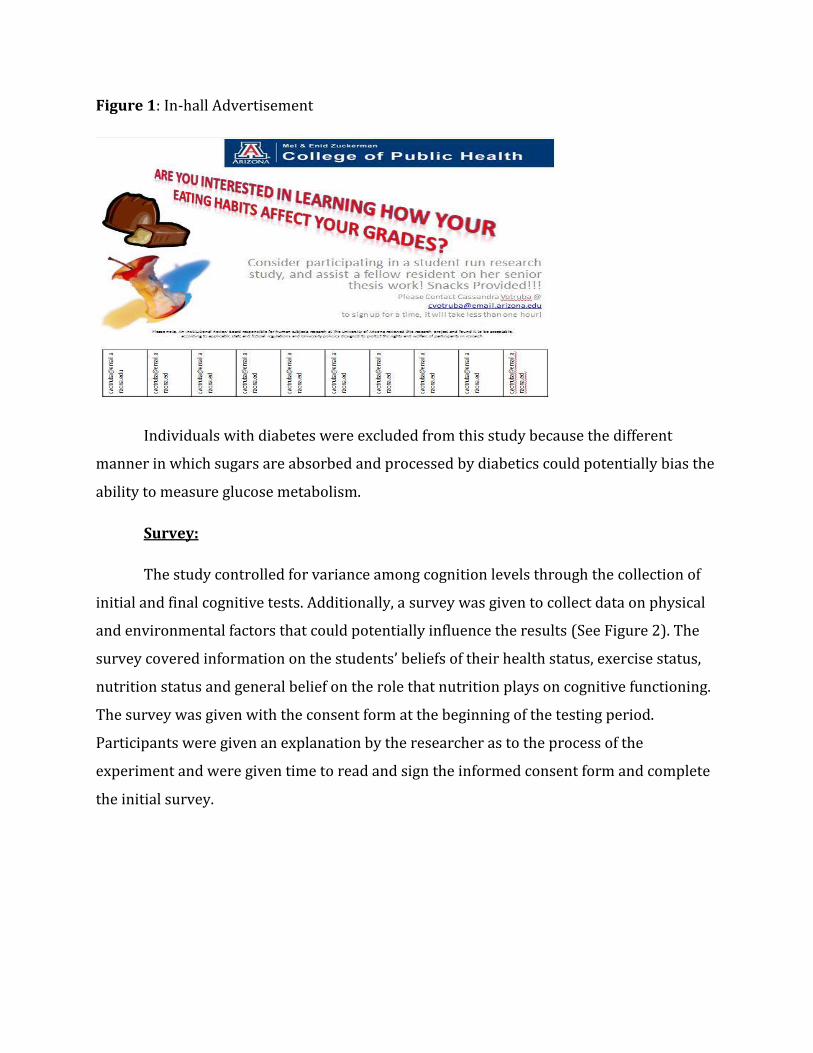
Figure 1: In-hall Advertisement
Individuals with diabetes were excluded from this study because the different
manner in which sugars are absorbed and processed by diabetics could potentially bias the
ability to measure glucose metabolism.
Survey:
The study controlled for variance among cognition levels through the collection of
initial and final cognitive tests. Additionally, a survey was given to collect data on physical
and environmental factors that could potentially influence the results (See Figure 2). The
survey covered information on the students’ beliefs of their health status, exercise status,
nutrition status and general belief on the role that nutrition plays on cognitive functioning.
The survey was given with the consent form at the beginning of the testing period.
Participants were given an explanation by the researcher as to the process of the
experiment and were given time to read and sign the informed consent form and complete
the initial survey.

Figure 2: Participant Survey
Experiment:
Participants were given a cognitive free recall test (see below) of after completing
the survey to establish a cognitive baseline for the participant. This initial test was
compared to data obtained after the consumption of the unknown drink; 1) decaffeinated
tea sweetened with table sugar, 2) decaffeinated tea sweetened with natural honey, or 3)
water with food coloring to resemble the decaffeinated tea. After the baseline value was
recorded, the students were randomly assigned a drink (1, 2, or 3 above). The two drinks
containing a form of sugar contained equal amounts of sugar (defined by the equal
glycemic index: 1/3 cup of honey and 1/3 cup minus 1 teaspoon of table sugar) to avoid
variation in results. Participants were given a recovery period of 15 minutes in which they
were free to socialize. This recover period was used to allow time for the sugar to be
absorbed into the body and the bloodstream. Following the recovery period, a second
cognitive free recall test was given, hereafter: the final test. The final test was conducted in
the same manner that the initial, however the words supplied were different than the
previously generated ones. See Diagram 1 for clarification.
Diagram 1: Flow Chart of the Experiment Process
Experimental Test Parameters:
The Free Recall Cognitive Test was supplied by Hanover College Psychology
Resources.
http://psych.hanover.edu/JavaTest/CLE/Cognition/Cognition/freerecall_instructions.html
("Cognition Laboratory Experiments,"). This test was chosen because of its simplicity, yet
functionality at identifying variance in cognitive functioning. The test was given to
participants on a laptop using the Java® enabled browser Google Chrome®. The Free
Recall Test given to participants was a variation of typical free recall tests that examine
short term/working memory and involved the memorization of 15 words. Participants
were seated in front of a computer screen in which a word flashed on the screen for five
5-8 Minutes (Depending on how
quickly the survey was completed)
3 minutes
15 minutes after the consumption of
the entire drink (took between 2-5
minutes to consume entire drink).
3 minutes

seconds before being replaced by another word (See Diagram 2). After all 15 words were
displayed, participants were shown a computer generated list of 30 words (some belonged
in the list, some were novel) in which they had 40 seconds to click and identify as many of
the 15 words as possible from memory. After the 40 seconds were complete, a scored was
generated by the computer system and supplied to the PI to record the results.
Diagram 2: Layout of room where the research was conducted. In blue is the tables in the
room. The Prepared Drinks were on the far side of a table in one corner while the subject
sat at a table with the computer. The PI was in the room to monitor if a problem should
arise, but was not directly observing the subject to reduce the likelihood of The Hawthorn
Effect. During the experiment, there were no other students in this common area.
Data Analysis:
After completion of the experiment, the data were compiled into an excel worksheet
and coded for preparation for statistical analysis (See Figure 3).

Figure 3: Data Analysis Spread Sheet
Survey: Qualitative Analysis
Standard descriptive analyses were conducted on the survey responses. The
responses to the survey were analyzed for trends and were used to determine outlier
responses. During analysis interesting findings were determined and will be discussed
below.
Experiment: Quantitative Analysis
For the statistical analysis or the experiment, we calculated the difference in
number of words recalled before and after the consumption of glucose (natural or
processed) or the placebo (See Equation 1).
Equation 1:
Difference = Final test value– Initial test value
The data were analyzed using One-Way ANOVA (Analysis of Variance), which was
used to compare mean test value difference (See Equation 1) among the three treatments
(control, natural or processed sugar). For One-Way ANOVA, the null hypothesis was that all
of the groups’ final-initial test difference means are the same, that is, the null hypothesis is
that cognitive functioning is the same for natural, processed and placebo groups. The
alternative hypothesis is that not all the group means are same, that is that cognitive
functioning is not the same among the groups.
The One-Way ANOVA has three requirements in order for it to be valid. The ANOVA
requires that each of the k groups measurements be obtained from a population with a
normal distribution. It also requires that each of the groups be randomly selected and be
independent of all others groups (one will not have an effect on the other). Lastly, it
requires that the variables from each group come from distributions of approximately the
same standard deviation.
The data were analyzed using the software SmallSTATA 12. Additionally, all of the
charts and graphs were generated in STATA and exported for inclusion in this document.
Results:
Descriptive statistics
The study was performed in Colonia de la Paz hall on the University of Arizona campus. All
subjects were run between 1pm and 9pm, April 02-10, 2013. The study consisted of 50
participants, with ages between 18-22 years, with a mean of 19.6 years. There were 22
males and 28 females. Of the participants, 17 (9 males and 8 females) consumed natural
sugar, 17 (5 males and 12 females) consumed processed sugar, and 16 (8 males and 8
females) consumed the control (water). The test scores were normally distributed for all
three groups.
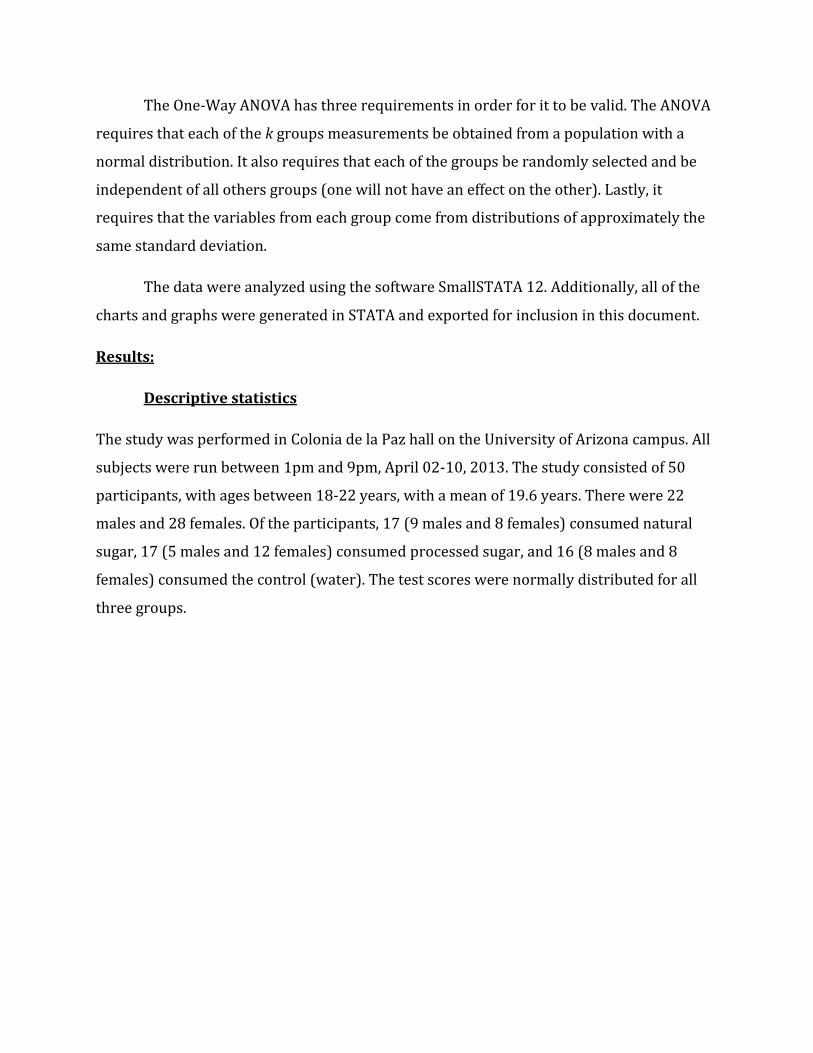
Graph 1: Normal Quantile Plot (stata command: qnorm) Showing Age Trend
As seen in Graph 1, the distribution of participants in terms of Age followed a
normal distribution (they mostly line up on the axis) with no outliers. Qnorm graphs were
created for additional variables and all indicated the data for each variable were normally
distributed.
During Analysis, the body mass index (BMI) was calculated to determine if there
were any unusual values. While height and weight are easily measured, BMI gives a better
measure of overall body composition and presumably may be related to overall physique.
The BMI was calculated using the formula:
Equation 2:
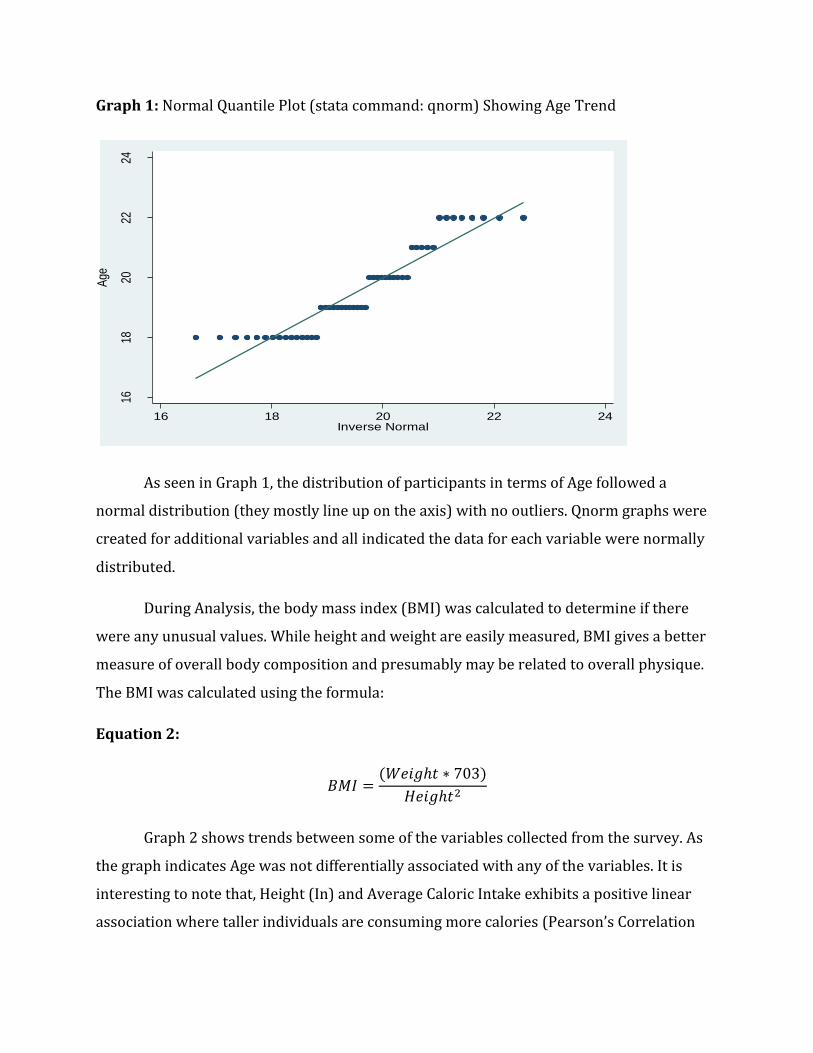
Graph 2 shows trends between some of the variables collected from the survey. As
the graph indicates Age was not differentially associated with any of the variables. It is
interesting to note that, Height (In) and Average Caloric Intake exhibits a positive linear
association where taller individuals are consuming more calories (Pearson’s Correlation
1618
2022
24
Age
16 18 20 22 24Inverse Normal
coefficient r=0.6, p<0.001). In other words, the taller a person is, the more food they are
likely to consume which is logical because their body requires more energy to function on a
normal level compared to someone of a small stature.
Graph 2: Scatter Graph Matrix of Height, Test Group, Age, and Caloric Intake
HeightIn
Age
N/P/C
AvgCaloricIntake
60
65
70
75
60 65 70 75
18
20
22
18 20 22
1
2
3
1 2 3
0
2000
4000
0 2000 4000

Graph 3: Bar Chart Showing Mean BMI by Response to Sugar Consumption Question
Graph 4: Bar Chart Showing Mean BMI by Response to Exercise Level Question
Survey Results:
Using a survey tool, participants were asked about their normal caloric intake,
general health level, general level or exercise, weight, height, and belief of whether food
affects cognitive functioning or not. This data was collected at first as a way of determining

possible demography or metabolic explanations for an outliers if any appeared. However,
the data didn’t show any outliers and the general questions about health left room for
questions to ponder. The height and weight of the individuals was collected and used to
estimate the BMI of the individual. Most subjects fell within the normal range of 20-27 BMI,
however two of the participants had a BMI greater than 30, classifying them as obese. It
posed the question of if this would affect their cognitive functioning, however there
performance on the tests were not significantly different from the other subjects so they
were kept in the analysis.
On average, women had a lower BMI with a mean of 22.0. In contrast, males had a mean
BMI of 25.1. It is interesting to note that the two participants that responded that they
never consume high-sugar content foods were both females. Additionally, twice as many
women as men had extreme levels of exercise with a 6:3 ratio. The implication of this is
that women are potentially more aware of their health and the need to consume more
health conscious foods and participate in strenuous forms of exercise.
Graph 5: Pie Graph of the Distribution of Response to Frequency of Consumption of Higher
Sugar Content Foods
Never, 2
Sometimes, 33
Often , 15 Never
Sometimes
Often
Overwhelmingly, students believe that nutrition affects all aspects of their body,
with 98% (49/50) of them believing that sugar does in fact affect cognitive functioning.
However, as shown in Graph 5, even though the individuals believe that sugar affects
cognitive functioning, only 2 participants responded that the never consume high sugar
content foods, whereas 33 participants responded that the occasionally consume high
sugar content foods and 15 participants responded that they often consume high sugar
content foods. Additionally, individuals that reported often consuming high sugar content
foods had a higher BMI score compared to those that responded that they sometimes
consumed high sugar foods or never (See Graph 3). Those individuals that were more
physically active tended to have a lower BMI score(See Graph 4). However, this could be
due to BMI being calculated rather than measured and didn’t take into account the type of
mass (fat versus muscle mass).
Experiment Results:
As shown in table 1, there were no significant differences in sex, age, BMI, and physical
activity level (1=easy, 2=moderate, 3= extreme) across all groups in the study; Natural
Sugar, Processed Sugar and Control, as indicated by the p-values being > 0.05.
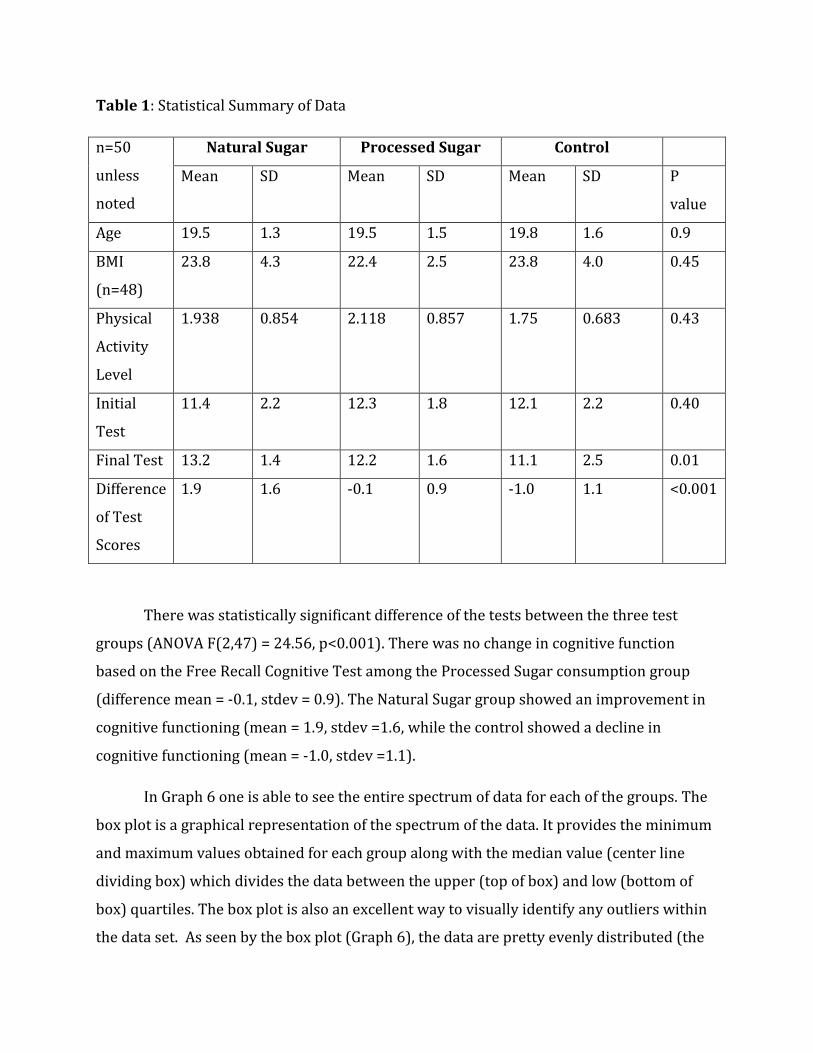
Table 1: Statistical Summary of Data
n=50
unless
noted
Natural Sugar Processed Sugar Control
Mean SD Mean SD Mean SD P
value
Age 19.5 1.3 19.5 1.5 19.8 1.6 0.9
BMI
(n=48)
23.8 4.3 22.4 2.5 23.8 4.0 0.45
Physical
Activity
Level
1.938 0.854 2.118 0.857 1.75 0.683 0.43
Initial
Test
11.4 2.2 12.3 1.8 12.1 2.2 0.40
Final Test 13.2 1.4 12.2 1.6 11.1 2.5 0.01
Difference
of Test
Scores
1.9 1.6 -0.1 0.9 -1.0 1.1 <0.001
There was statistically significant difference of the tests between the three test
groups (ANOVA F(2,47) = 24.56, p<0.001). There was no change in cognitive function
based on the Free Recall Cognitive Test among the Processed Sugar consumption group
(difference mean = -0.1, stdev = 0.9). The Natural Sugar group showed an improvement in
cognitive functioning (mean = 1.9, stdev =1.6, while the control showed a decline in
cognitive functioning (mean = -1.0, stdev =1.1).
In Graph 6 one is able to see the entire spectrum of data for each of the groups. The
box plot is a graphical representation of the spectrum of the data. It provides the minimum
and maximum values obtained for each group along with the median value (center line
dividing box) which divides the data between the upper (top of box) and low (bottom of
box) quartiles. The box plot is also an excellent way to visually identify any outliers within
the data set. As seen by the box plot (Graph 6), the data are pretty evenly distributed (the
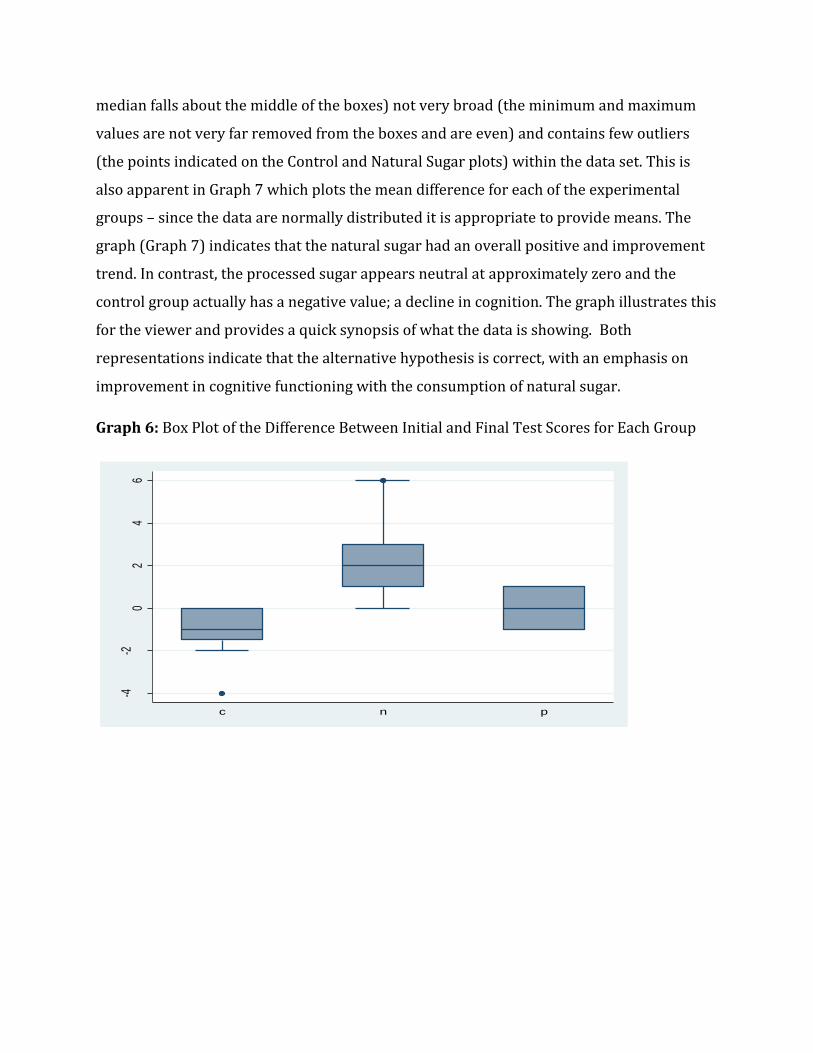
median falls about the middle of the boxes) not very broad (the minimum and maximum
values are not very far removed from the boxes and are even) and contains few outliers
(the points indicated on the Control and Natural Sugar plots) within the data set. This is
also apparent in Graph 7 which plots the mean difference for each of the experimental
groups – since the data are normally distributed it is appropriate to provide means. The
graph (Graph 7) indicates that the natural sugar had an overall positive and improvement
trend. In contrast, the processed sugar appears neutral at approximately zero and the
control group actually has a negative value; a decline in cognition. The graph illustrates this
for the viewer and provides a quick synopsis of what the data is showing. Both
representations indicate that the alternative hypothesis is correct, with an emphasis on
improvement in cognitive functioning with the consumption of natural sugar.
Graph 6: Box Plot of the Difference Between Initial and Final Test Scores for Each Group
-4-2
02
46
Diff
eren
ce
c n p

Graph 7: Bar Graph of the Difference Value Between the Groups
Limitations:
This study was conduct at one university with a specific population of students.
Because these students were all from the University of Arizona, were living on campus, and
lived in the same environment, it potentially created limitations to the study. The
individuals living on campus in Colonia de La Paz hall typically come from a higher
socioeconomic background because of their ability to pay for the expensive residential hall.
Thus this study would need to be conducted again with a larger and more inclusive sample.
Additionally, this study was only conducted on 50 students while the entire university is
comprised of over 50,000. It would be beneficial to complete this study again with a larger
sample size. Finally, this study was completed with the FreeRecall Cognitive Memory Test
that focuses on the specific part of cognitive functioning of memory (short term/ working
memory). It would be beneficial to test with additional cognition tests that specialize in
other areas of cognition.
Discussion:
From these data one is able to interpret that the null hypothesis is rejected and the
alternative hypothesis is supported. The null hypothesis, that cognitive functioning is the
-10
12
mea
n of
Diff
eren
ce
c n p

same for natural, processed and control groups is rejected, and the alternative hypothesis
that cognitive functioning is not the same between all groups is supported. The null
hypothesis simply means that Natural Sugar= Processed Sugar= Control Group, the p-value
of < 0.001 for difference between the two cognitive test results shows statistical
significance with the data and that one of the groups does not equal another. While this
information does not supply exactly which does not equal the other, by looking at the
graphical representation of the data, one can see that natural sugar shows an increased
cognitive functioning compared to the control group and processed sugar group.
As seen in Graphs 2 and 3, the control group actually showed a decline in cognitive
functioning between the initial test and the final test. There are two potential reasons for
this that would require further experimentation. The first explanation is focused on the
recovery period which was 15 minutes. The recovery period of 15 minutes was selected for
two reasons. First, to allow a cognitive recovery period for the brain between two cognitive
tasks. The second reason was for the drink to be consumed and begin the absorption
process in order to properly affect the brain. If the recovery period was not long enough,
the brain would potential still be fatigued and unable to function at its peak levels
(Hoyland, et al., 2008). This might explain the decrease in performance among the control
group, which was not seen in the two experimental groups (natural and processed sugar).
This would require further experimentation to determine the optimal recovery period
time. The second potential explanation is focused on the cognitive test used, Free Recall
Cognitive Memory Test. Some of the control group participants reported a general feeling
of confusion with the second test, specifically, questioning if the words they were
identifying were from the first or the second test. This potentially created a problem with
properly recognizing words when it is unclear if they appeared during the initial test or the
post test. This could be controlled for by creating a tracking program within the cognitive
test in which it is controlled between the initial test and the final test. This would guarantee
that there are no repeat words either within the memorization period or the selection
portions of the exam.
It should be discussed that 2 participants’ were excluded in the ANOVA testing for
differences in BMI by study group. These two individuals had a BMI over 30 which skewed

the data, thus they were excluded from that analysis. However, when investigated further,
including these two individuals did not change the results. The concept of BMI and the
affect an overweight body has on its own ability to process and absorb sugars makes one
question if BMI affects one’s ability to function cognitively. A study conducted in 2012
confirmed that individuals that were obese participated in a weight loss program displayed
increased cognitive functioning after losing weight compared to their pre-weight loss obese
scores (Siervo et al., 2012). This question brings about the potential for future research in
examining if BMI affects cognitive functioning and if the addition of sugar (natural or
processed) increases or decreases an individual with a high BMI cognitive functioning.
The original question that this study posed was how is cognitive ability among
college students affected by natural sugar versus processed sugar? In other words; which
type of sugar would be best for college students to consume prior to taking an exam or
attending an important class? The rejection of the null hypothesis indicates that there is a
difference between the consumption of processed sugar and natural sugar on cognitive
function with a preference for natural sugar and increased cognitive functioning. Thus,
students should consume items with natural sugar such as fruits and vegetables, prior to
completing an exam or participating in a cognitively challenging task. Universities should
incorporate more healthy and natural options into their daily food options on campus,
including snacks available in vending machines and at curbside cafés/food carts. Some
colleges are already starting to begin this process of supporting healthier eating by resident
students. For example, the College of Public Health Interns at the University Of Arizona
Residence Life Department Of Residential Education recently published a cookbook
designed for students living on campus. The cook book is filled with nutritious but tasty
recipes with minimal ingredients and supplies required, with gluten free, vegan and
vegetarian options (Votruba, 2013).
After completing this study, while one question was answered, many more
questions have arisen. Future research could include examining how BMI affects glucose
absorption and cognitive functioning. Do individuals with higher BMI’s have lower
cognitive functioning compared to those within a normal range? Do individuals with higher
BMI’s have a variance with their ability to absorb sugar properly compared to those within

a normal range? Another question that could be posed is if individuals with diabetes
display similar results when this study is conducted on them; does natural sugar give
individuals with diabetes a cognitive boost? More research could also be conducted based
on the research question of this study by looking at duration of the cognitive spike. This
study looked at cognition 15 minutes after consumption, but most exams take over an hour.
Would there be a drop in cognition levels at a certain time? What is the point and can it be
increased by increasing the sugar concentration?
Conclusion
This study was able to show that natural sugar improved cognitive function when
compared to processed and no-sugar groups. This is important because it provides an
informed decision for students to make when deciding on their pre-class/exam snack. With
this knowledge, students will be able to make better decisions on their nutrition choices
and be able to support or improve upon their current cognitive function.

Works Cited
Boyle, M., & Holben, D. (2013). Community Nutrition in Action: An Entrepreneur Approach (6
ed.): Cengage Learning.
Cognition Laboratory Experiments. Retrieved September 15, 2012, 2012
Cousineau, T. M., Goldstein, M., & Franko, D. L. (2004). A collaborative approach to nutrition
education for college students. J Am Coll Health, 53(2), 79-84.
Craft, S., Newcomer, J., Kanne, S., Dagogo-Jack, S., Cryer, P., Sheline, Y., et al. (1996). Memory
improvement following induced hyperinsulinemia in Alzheimer's disease. Neurobiol
Aging, 17(1), 123-130.
Hoyland, A., Lawton, C. L., & Dye, L. (2008). Acute effects of macronutrient manipulations
on cognitive test performance in healthy young adults: a systematic research
review. Neurosci Biobehav Rev, 32(1), 72-85.
Kaplan, R. J., Greenwood, C. E., Winocur, G., & Wolever, T. M. (2001). Dietary protein,
carbohydrate, and fat enhance memory performance in the healthy elderly. Am J Clin
Nutr, 74(5), 687-693.
Livestrong.com. (2013). Retrieved September 10, 2012, 2012
Rosenheck, R. (2008). Fast food consumption and increased caloric intake: a systematic
review of a trajectory towards weight gain and obesity risk. Obes Rev, 9(6), 535-547.
Rozan, P., Deremaux, L., Wils, D., Nejdi, A., Messaoudi, M., & Saniez, M. H. (2008). Impact of
sugar replacers on cognitive performance and function in rats. Br J Nutr, 100(5),
1004-1010.
Siervo, M., Nasti, G., Stephan, B. C., Papa, A., Muscariello, E., Wells, J. C., et al. (2012). Effects
of intentional weight loss on physical and cognitive function in middle-aged and
older obese participants: a pilot study. J Am Coll Nutr, 31(2), 79-86.
Smith, A., Kendrick, A., Maben, A., & Salmon, J. (1994). Effects of fat content, weight, and
acceptability of the meal on postlunch changes in mood, performance, and
cardiovascular function. Physiol Behav, 55(3), 417-422.
Strout, E. (2007, September 21, 2007). The Obesity Epidemic Comes to Campuses.
Chronicle, p. 6.

Taki, Y., Hashizume, H., Sassa, Y., Takeuchi, H., Asano, M., Asano, K., et al. (2010). Breakfast
staple types affect brain gray matter volume and cognitive function in healthy
children. PLoS One, 5(12), e15213.
Votruba, C. D. (2013). Get Cookin': A College Student's Guide to Healthy Eating. Tucson:
University of Arizona.