Comparing school systems across Australia · SYSTEMS 1 Comparing school systems across ... economic...
25
COMPARING SCHOOL SYSTEMS 1 Comparing school systems across Australia ∗ Gary Banks Chairman, Productivity Commission Thank you for the opportunity to speak today on this important topic. Given the economic significance of education, the Productivity Commission has a long standing interest in this area—both in its own right, and as secretariat to the inter- governmental Review of Government Service Provision. Much of what I have to say draws on publicly available information from the Review’s annual Report on Government Services. However, today I am speaking as Chairman of the Productivity Commission, not on behalf of the Steering Committee for the Review. Education is crucial to Australia’s future In that capacity, part of my brief today is to address the economic pay-offs from education. An educated workforce is indeed a key determinant of economic progress. But, before elaborating on that theme, I also want to remind you that education is not enough. Throughout much of the post-war period, Australia’s productivity and income growth performance were poor compared to other OECD countries, despite our relatively highly educated workforce. Equally, our celebrated surge in productivity growth from the early 1990s—and the rise in per capita incomes that accompanied it—cannot be explained by any sudden improvement in skill levels. Taking into account workforce experience, the growth in skills was faster in the 1980s (when productivity growth was slow) than during the 1990s’ productivity surge (Barnes and Kennard 2002). As is now generally recognised, the transformation in Australia’s economic performance since the early 1990s can be attributed mainly to a series of microeconomic reforms that removed institutional and policy-related impediments to our economic performance (OECD 2004a). Tackling those anti-competitive ∗ Address to ANZSOG conference, ‘Schooling in the 21 st Century: Unlocking Human Potential’, 28 and 29 September 2005, Sydney.
-
Upload
hoangkhanh -
Category
Documents
-
view
244 -
download
0
Transcript of Comparing school systems across Australia · SYSTEMS 1 Comparing school systems across ... economic...

COMPARING SCHOOL SYSTEMS
1
Comparing school systems across Australia∗
Gary Banks Chairman, Productivity Commission
Thank you for the opportunity to speak today on this important topic. Given the economic significance of education, the Productivity Commission has a long standing interest in this area—both in its own right, and as secretariat to the inter-governmental Review of Government Service Provision. Much of what I have to say draws on publicly available information from the Review’s annual Report on Government Services. However, today I am speaking as Chairman of the Productivity Commission, not on behalf of the Steering Committee for the Review.
Education is crucial to Australia’s future
In that capacity, part of my brief today is to address the economic pay-offs from education. An educated workforce is indeed a key determinant of economic progress. But, before elaborating on that theme, I also want to remind you that education is not enough. Throughout much of the post-war period, Australia’s productivity and income growth performance were poor compared to other OECD countries, despite our relatively highly educated workforce. Equally, our celebrated surge in productivity growth from the early 1990s—and the rise in per capita incomes that accompanied it—cannot be explained by any sudden improvement in skill levels. Taking into account workforce experience, the growth in skills was faster in the 1980s (when productivity growth was slow) than during the 1990s’ productivity surge (Barnes and Kennard 2002).
As is now generally recognised, the transformation in Australia’s economic performance since the early 1990s can be attributed mainly to a series of microeconomic reforms that removed institutional and policy-related impediments to our economic performance (OECD 2004a). Tackling those anti-competitive
∗ Address to ANZSOG conference, ‘Schooling in the 21st Century: Unlocking Human Potential’,
28 and 29 September 2005, Sydney.

2 EDUCATION IS AUSTRALIA'S FUTURE
arrangements contributed to more rapid productivity growth, and to Australia closing the gap with the rest of the industrialised world.
While this process has been very important, and is not yet over, it is obvious that our future economic progress cannot depend on ‘catch-up’ alone. As Australia gets closer to the frontiers of economic performance, our progress will depend more and more on our capacity as a society to invent, innovate and adapt, in a rapidly changing and increasingly competitive world economy.
Our success in innovation and adaptation will largely depend on the skills and attitudes of our people (‘human capital’), and how well they are utilized in enterprises of all kinds throughout the country. Education plays a fundamental role in fostering human capital, and so it follows that the accessibility and performance of our education systems will be crucial to Australia’s economic future.
I have argued elsewhere that the demands of the ‘information age’ will put a particular premium on post-school training, to acquire necessary high-level generic and specific skills (Banks 1998; see also West 1998). However, primary and secondary education is clearly the bedrock on which any subsequent learning is based. It is difficult to overstate the economic importance of quality school education.
Although the personal and social benefits of education are intuitively obvious, measuring the returns to education in quantitative terms is a difficult business. At the individual level, however, a variety of evidence suggests a very significant payoff.
• For one thing, there is a very clear link between levels of educational attainment and employment rates. The Longitudinal Surveys of Australian Youth have consistently found that early school leavers have poor labour market outcomes.
• The Commission’s recent study on the Economic Implications of an Ageing Australia (PC 2005) documents the extent to which labour force participation (those either in employment or actively looking for work) remains higher on average over the life cycle for those with higher levels of educational attainment.
• The link between education and labour force participation is borne out by OECD data that show, for Australian 25 to 64 year olds in 2002, 35 per cent of those who had not completed secondary school were not even in the labour force. This compares with 19 per cent of those who had completed secondary school, and 14 per cent of those who had completed tertiary education. Similar results are evident across all OECD countries (OECD 2004b).

COMPARING SCHOOL SYSTEMS
3
Figure: Educational attainment matters for labour force participation % not in the labour force, 2002
(25-64 year olds)
05
10152025303540
Not completedsecondary
Completedsecondary
Completed tertiary
Per c
ent
Labour force participation age and highest educational attainment, 2001
Relative earnings also increase with educational attainment. In 2001, adult Australians who had not completed secondary school earned about 15 per cent less than those with upper secondary education. Those with tertiary qualifications earned nearly one half more than those with only secondary education (OECD 2004b).
Figure: More education, more pay
Relative earnings from employment, 2001 (24-64 year olds)
0
50
100
150
Did not completesecondary
Completed secondary Tertiary
Education level
Inde
x
In addition to benefiting individuals, improved educational outcomes have a wider economic payoff for the nation. For example, the higher labour force participation associated with educational attainment flows through into higher per capita incomes for society as a whole. Education is thus seen as a potentially important policy instrument for countering the decline in labour force participation caused by the aging of Australia’s population.

4 EDUCATION IS AUSTRALIA'S FUTURE
The so-called ‘new growth theory’ emphasises the importance of human capital as a source of growth, both directly as an ‘embodied’ labour input and indirectly in fostering absorption and further development of technology. As noted by exponents such as Paul Romer (1990), a country’s basic capabilities in education and research and development set up a virtuous cycle, reinforced by the positive spillovers associated with the generation, sharing and use of knowledge.
Steve Dowrick from the ANU has reviewed empirical estimates of the impact of education on productivity (Dowrick 2002). He found that:
• An additional year of education typically increases productivity and earnings of an individual by 8 per cent.
• If the average level of schooling rises by one year, as long as new cohorts replace less educated cohorts, annual growth of GDP is 0.2 per cent above trend, accumulating to an 8 per cent increase in GDP over 40 years.
In sum, both the theory and the available empirical evidence tell us that education is crucial to economic performance.
That said, there is more to societal well being than material living standards, important as they are. Education not only enhances human capital, it also enhances ‘social capital’—the networks of relationships, and norms of behaviour, trust and cooperation, that enable a society to function effectively (PC 2003). An educated population will also be politically more sophisticated, have a better understanding of policy choices and be more demanding of its leaders.
Education assists individuals to develop their talents, capacities, self-confidence, self-esteem and respect for others. It is therefore instrumental in helping to overcome disadvantage. The recent National Aboriginal and Torres Strait Islander Social Survey (ABS 2004) reveals a clear link between educational background and involvement in the criminal justice system (although other factors also play a role). For example, the survey records that 42 per cent of Indigenous adults who dropped out of school before year 10 had been formally charged by police at some time in their lives, twice the proportion of those who had completed year 12.
We also know that people who complete secondary or post-secondary education are more likely to encourage the educational pursuits of their children, so that the benefits of education flow from one generation to another.
There are many ways of delivering education
It follows that there are strong rationales for government involvement in education. This is particularly true at primary and secondary levels, where the ratio of public to
COMPARING SCHOOL SYSTEMS
5
private benefits arguably looms largest. This is reflected in government policies the world over, which regulate and heavily subsidise their citizens’ participation in schooling.
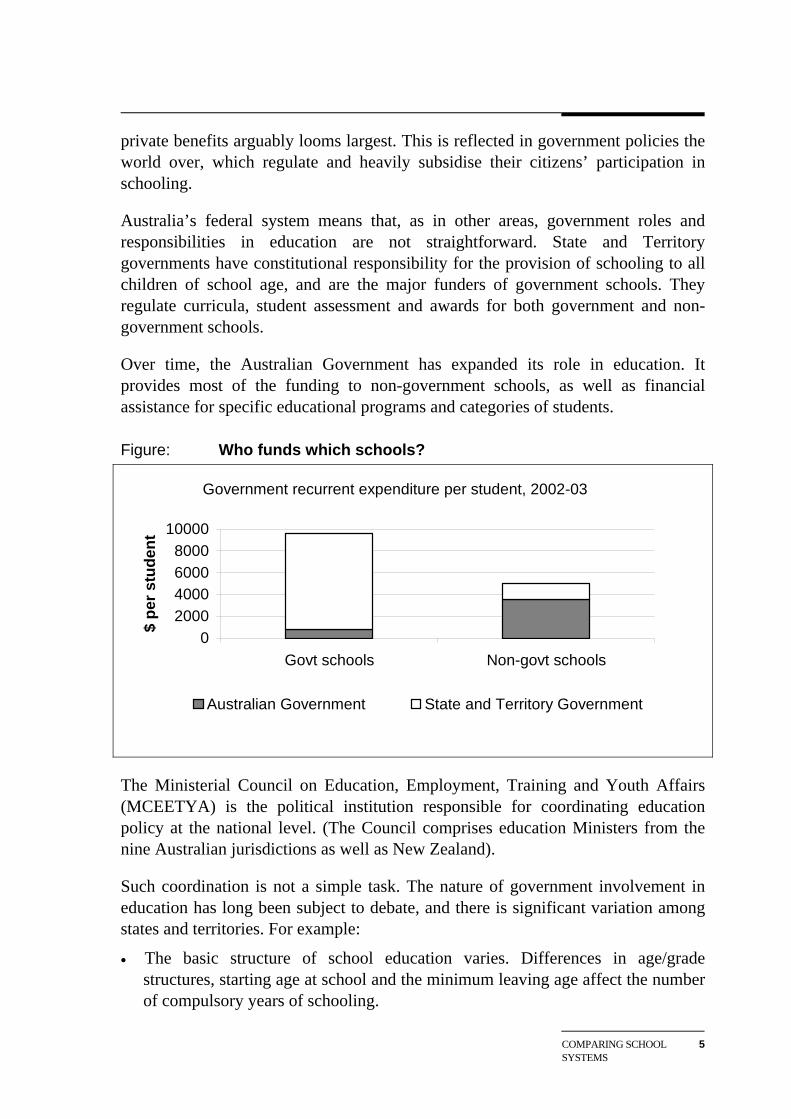
Australia’s federal system means that, as in other areas, government roles and responsibilities in education are not straightforward. State and Territory governments have constitutional responsibility for the provision of schooling to all children of school age, and are the major funders of government schools. They regulate curricula, student assessment and awards for both government and non-government schools.
Over time, the Australian Government has expanded its role in education. It provides most of the funding to non-government schools, as well as financial assistance for specific educational programs and categories of students.
Figure: Who funds which schools?
Government recurrent expenditure per student, 2002-03
02000400060008000
10000
Govt schools Non-govt schools
$ pe
r stu
dent
Australian Government State and Territory Government
The Ministerial Council on Education, Employment, Training and Youth Affairs (MCEETYA) is the political institution responsible for coordinating education policy at the national level. (The Council comprises education Ministers from the nine Australian jurisdictions as well as New Zealand).
Such coordination is not a simple task. The nature of government involvement in education has long been subject to debate, and there is significant variation among states and territories. For example:
• The basic structure of school education varies. Differences in age/grade structures, starting age at school and the minimum leaving age affect the number of compulsory years of schooling.

6 EDUCATION IS AUSTRALIA'S FUTURE
• Jurisdictions also differ in the form of final qualification conferred on successful students. Although all jurisdictions have now moved to a two-year system for awarding a ‘Senior Secondary Certificate of Education’, there are still differences which are addressed through the Australian Qualifications Framework.
• There is perennial debate over what curricula and teaching styles give the best results and again, significant differences across jurisdictions. A topical example, even reaching the front pages of newspapers, is the debate over ‘whole-word’ versus ‘phonetic’ teaching of reading, and ‘critical literacy’ versus traditional teaching of literature. (This has reached the point where the Education Minister, Brendan Nelson, has commissioned an inquiry into the teaching of reading.)
• There is a recurrent debate over the extent to which decision-making should be devolved to school management. Over time, different jurisdictions have swung between the extremes of the ‘devolution’/‘centralisation’ pendulum. A decade ago, under the ‘Schools of the future’ policy, principals of Victorian government schools were granted broad freedom over the hiring of teachers. But in NSW, teachers are allocated to schools by the Education Department with limited involvement by principals (at least until very recently).
• There is also debate over the extent to which parents should be able to choose among public schools. ‘Zoning’ requirements and limitations on ‘selective’ schools severely restrict choice of government school in all jurisdictions. Choice is affectively limited to those who can afford to move their households into desirable catchment zones—in Victoria, being in the right zone can add significantly to house prices—or to children bright enough to win selection. (Too bad for poor parents of average children who would like the benefit of choice.)
• Other controversies have deep historical roots, such as the merits of public versus private education. In 2003, over 70 per cent of schools in Australia were government owned and managed, accounting for 68 per cent of enrolments overall (ranging from 77 per cent in the Northern Territory to 60 per cent in the ACT). However, the proportion of students enrolled in non-government schools has been rising rapidly in all jurisdictions.
Is diversity (per se) a problem?
Such diversity can appear perplexing and has some obvious disadvantages. Multiple education systems impose additional administrative and transactions costs. Australia has eight separate State and Territory bureaucracies (plus the Commonwealth) running in parallel, each making decisions about policy, curricula and processes. Different systems can also constrain the ability of teachers, families and students to

COMPARING SCHOOL SYSTEMS
7
move between jurisdictions. This is an increasingly significant issue in an increasingly integrated national economy.
As a consequence, there have been moves recently toward greater uniformity, such as the Australian Government’s plans for:
• a common school student starting age across all jurisdictions by 2010;
• a national system for transferring information for students moving from one Australian jurisdiction to another; and
• an Australian Certificate of Education for year 12.
Such initiatives, which are not without controversy, reflect a shift of policy-making weight from states/territories to the Australian Government, implemented as part of the Australian Government 2005–08 quadrennial funding requirements.
While greater uniformity should bring national benefits in some areas, it can have risks in others. The fact that so much is contentious about educational system design is cause for caution. The imposition of a uniformly bad approach can turn what might have been a local problem into a national one.
At their best, federal systems constitute a ‘natural laboratory’, in which different policy or service delivery approaches can be observed in action, providing the opportunity for learning about what works and what does not. Also, where one jurisdiction develops a successful new approach, other jurisdictions can adopt that approach at less cost than starting from scratch. Moreover, the existence of different systems offers an additional avenue of choice for parents and employers.
Taking advantage of diversity within our federal system nevertheless requires an effective means of learning about and spreading successes (and, just as importantly, identifying and terminating failures). This is where the Review of Government Service Provision comes in.
The role of the Government Services Review
The Review was established by heads of government (now COAG) in 1993. It followed a related exercise comparing the performance of government trading enterprises across Australian jurisdictions (known as the Red Book).
The Review’s purpose is to inform parliaments, governments, service providers and the clients of services — the wider community — about performance in service provision across jurisdictions and about useful reforms. It does this through an annual publication, known as the Blue Book. The Review is guided by a Steering

8 EDUCATION IS AUSTRALIA'S FUTURE
Committee, with the Productivity Commission as Secretariat and me as Chairman of both.
Figure: Structure of the Review of Government Service Provision
The Blue Book reports on the equity, efficiency and effectiveness of mainstream government services, in the areas of education, justice, emergency management, health, community services and housing. It provides an incentive to improve the performance of government services, by:
• promoting greater transparency and informed debate about comparative performance; and
• helping jurisdictions identify where there is scope for improvement.
The Report has developed over time. There have been improvements to its methodology, as well as to the breadth and depth of reporting. In addition, in 1997, COAG asked the Review to improve reporting of the delivery of government services to Indigenous people. And, in April 2002, COAG commissioned the Review to produce a separate report against key indicators of Indigenous disadvantage.
The Steering Committee strives for data that are comparable across jurisdictions. But where available data are not fully comparable, the Steering Committee will still publish (with appropriate caveats). Similarly, the Steering Committee will report for some jurisdictions, even where data are not available for all. This ‘publish or perish’ approach has helped galvanise working groups and agencies to improve data and to match jurisdictional best practice.
Heads ofgovernment/COAG
Steering Committee
Working Groups
Productivity Commission Secretariat
Specialist input
18 Central agencies
80 Line agencies

COMPARING SCHOOL SYSTEMS
9
The reporting framework
The Blue Book applies a common overarching reporting framework to fourteen areas of government service provision. The performance of each area is measured as the extent to which the outputs of the service achieve the outcomes desired by governments. (Outputs refer to the services provided; outcomes to the impact on the community.)
The framework is divided into the key areas of equity, effectiveness, and efficiency.
Equity, effectiveness and efficiency Equity indicators measure how well a service is meeting the needs of identified ‘special needs groups’, including Indigenous Australians, those from language backgrounds other than English, those living in rural and remote areas, and people with disabilities.
Effectiveness indicators measure how well the outputs of a service achieve the stated objectives of that service. Indicators of effectiveness are grouped according to characteristics such as access, appropriateness and quality.
Efficiency indicators reflect how well services use their resources to produce outputs and achieve outcomes.
Figure: The general framework for performance measurement
Outputs Outcomes
Equity ofoutcomeindicators
Programeffectiveness
indicators
Cost-effectiveness
indicators
Access
Access
Appropriateness
Quality
Inputs peroutput unit
Equity
Effectiveness
Efficiency
Equity of accessindicators
Accessindicators
Appropriatenessindicators
Qualityindicators
Technicalefficiencyindicators
PERFORMANCE
Objectives

10 EDUCATION IS AUSTRALIA'S FUTURE
Applying the framework to school education
The reporting framework has been adapted for school education to align with the MCEETYA national goals for schooling. These focus on the development of life skills, high standards of attainment in key learning areas, and socially just provision of schooling. (See the box for a summary, or the Blue Book for the full text).
Nationally agreed goals for schooling In April 1999 MCEETYA endorsed national goals for school education. It observed that Australia’s future depends upon each citizen having the necessary knowledge, understanding, skills and values for a productive and rewarding life in an educated, just and open society. High quality schooling is central to achieving this vision. 1. Schooling should develop fully, by the time students leave school, the qualities, talents and capacities of all students in life skills.
• These include analysis, communication and planning, high self-esteem, a sense of social justice and civic awareness, employment and new technology related skills, concern for the natural environment and the wherewithal to live a healthy and satisfying life.
2. Students should have attained high standards of knowledge, skills and understanding through a comprehensive and balanced curriculum in the compulsory years of schooling that encompasses the eight key learning areas. Students should have:
• attained the skills of numeracy and English literacy
• participated in programs of vocational learning as part of their secondary studies, and
• participated in programs and activities which foster and develop enterprise skills. 3. Schooling should be socially just so that:
• students’ outcomes from schooling are free from the effects of negative forms of discrimination
• the learning outcomes, access and opportunities of Indigenous and educationally disadvantaged students improve and over time match those of other students
• all students understand and acknowledge the value of cultural and linguistic diversity, including Indigenous cultures to Australian society, and
• all students have access to high quality education necessary to enable the completion of school education to year 12 or its vocational equivalent and that provides clear and recognised pathways to employment and further education and training.
Source: Adapted from MCEETYA (1999).
The goals are expressed in very broad terms, and tend to overlap. They seek to encompass both the social and economic benefits of education that I highlighted earlier. However, the true test of governments’ commitment to the goals is the

COMPARING SCHOOL SYSTEMS
11
success of the policies put in place to achieve them. Measuring this is the ambitious task of the school education chapter of the Review.
The reporting framework for education
The performance indicator framework for schools is reproduced below. In the three dimensions of reporting:
• Equity indicators measure how special needs groups compare in terms of participation and retention rates.
• Effectiveness is measured in terms of learning outcomes—currently limited to reading, writing and numeracy in specified year levels—and estimated completions (achieving a year 12 certificate). Such outcomes can, of course, be affected by factors outside the school system.
• Efficiency is measured in terms of government expenditure per student, staff expenditure per student, and student to staff ratios.
Figure: Performance indicators for schools
Equity
PERFORMANCE
OutputsOutputs
OutcomesOutcomes
Access and equitymeasures for
participation andretention Literacy - writing
Effectiveness
Efficiency Inputs per outputunit
Participation
Staff expenditureper student
Notional user costof capital per
student
Student-to-staffratio
Numeracy
Science
Information andcommunication
technology
Apparent retention
Governmentrecurrent
expenditure perstudent
Civics andcitizenship
Enterpriseeducation
Other socialoutcomes
Other areas to beidentified
Student learning
Goals andObjectives
VET in schools
Destination
Estimatedcompletion
Key to indicatorsText
Text Information not complete or not directly comparable
Text Yet to be developed or not collected for this Report
Provided on a comparable basis for this Reportsubject to caveats in each chart or table
Equity andeffectiveness
measures for alloutcomes
Literacy - reading
12 EDUCATION IS AUSTRALIA'S FUTURE
Looking at the performance indicators for schools, in which the national goals are reflected, an immediate observation is that, despite some hard work over the past ten Reports, a large number of indicators are either white—‘yet to be developed or not collected’; or grey—‘not complete or not directly comparable’. This falls short of what could have been expected, given that Ministers gave a commitment to reporting against an earlier version of the national goals in 1997.
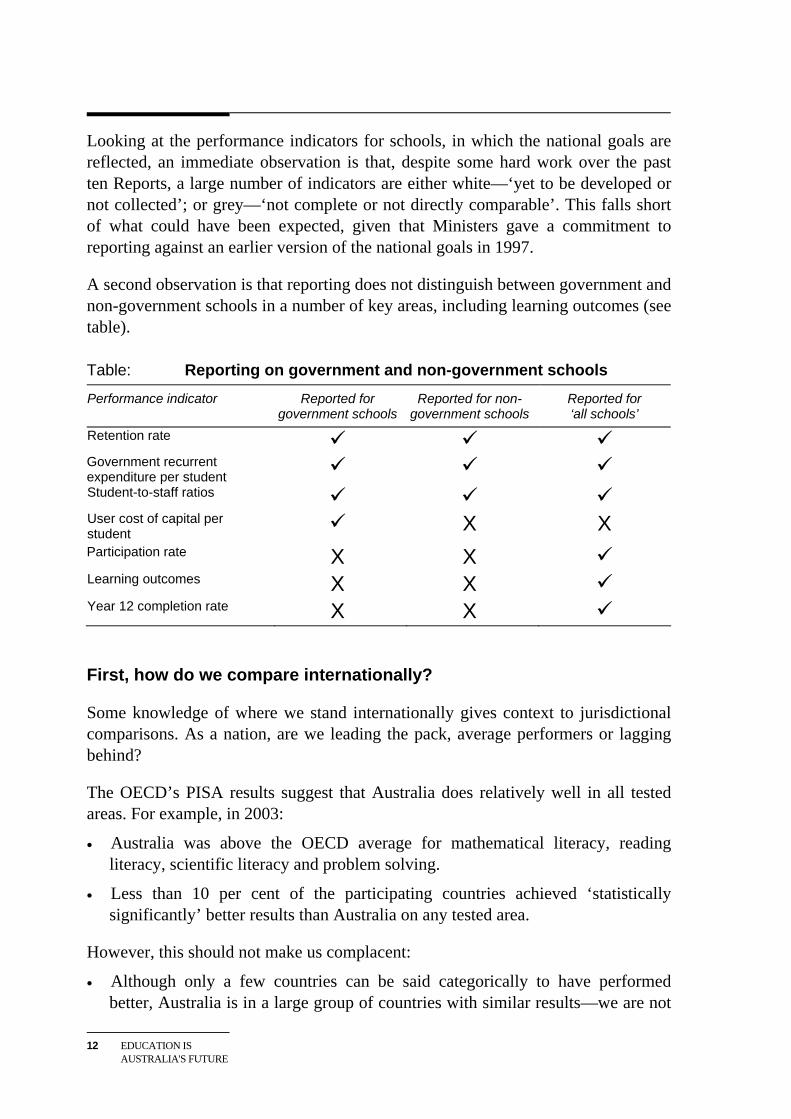
A second observation is that reporting does not distinguish between government and non-government schools in a number of key areas, including learning outcomes (see table).
Table: Reporting on government and non-government schools
Performance indicator Reported for government schools
Reported for non-government schools
Reported for ‘all schools’
Retention rate Government recurrent expenditure per student
Student-to-staff ratios User cost of capital per student X X
Participation rate X X Learning outcomes X X Year 12 completion rate X X
First, how do we compare internationally?
Some knowledge of where we stand internationally gives context to jurisdictional comparisons. As a nation, are we leading the pack, average performers or lagging behind?
The OECD’s PISA results suggest that Australia does relatively well in all tested areas. For example, in 2003:
• Australia was above the OECD average for mathematical literacy, reading literacy, scientific literacy and problem solving.
• Less than 10 per cent of the participating countries achieved ‘statistically significantly’ better results than Australia on any tested area.
However, this should not make us complacent:
• Although only a few countries can be said categorically to have performed better, Australia is in a large group of countries with similar results—we are not

COMPARING SCHOOL SYSTEMS
13
necessarily leading the pack. And our ranking slipped somewhat between 2000 and 2003.
• Moreover, the results for Australia appear to have a relatively wide dispersion—a higher proportion of Australian students may be falling behind than those of other countries with comparable averages.
The results of other international tests have been less positive than PISA. For instance, Australian students performed less well in the 2004 Trends in Mathematics and Science Study (TIMSS), run by the International Association for Evaluation of Educational Achievement (Donnelly 2005). Our year 4 maths students were outperformed by 15 countries, while 13 countries outperformed Australian year 8 students.
Comparing the States and Territories
I mentioned that context is important when comparing performance. The Northern Territory and the ACT will often be found at the extremes of any indicator. This is largely explained by their special characteristics:
• Nearly one-half of the NT population lives in remote areas, while there are no remote areas in the ACT.
• In a close corollary, over 37 percent of students in the NT are Indigenous, far higher than in any other jurisdiction. WA and Tasmania are next highest, each reporting a 6 per cent Indigenous student share.
Figure: Indigenous and remote students
Proportion of students who are Indigenous, or in remote areas, 2003
01020304050
NSW Vic Qld WA SA Tas ACT NT Aust
Per c
ent
Remote Indigenous

14 EDUCATION IS AUSTRALIA'S FUTURE
The NT also had the highest proportion of students from language backgrounds other than English (32 per cent) (influenced by the inclusion of Indigenous students whose home language is not English). New South Wales and Victoria both had over 25 per cent, while Tasmania had the lowest proportion at 6 per cent.
Figure: Students from language backgrounds other than English
Proportion of students from language backgrounds other than English, 2001
0.0
5.0
10.0
15.0
20.0
25.0
30.0
35.0
NSW Vic Qld WA SA Tas ACT NT
Per c
ent
How do the States compare on equity?
Equity of access is particularly important in education. Not only is it critical to the life choices of individuals, society as a whole loses out if people with potential are denied an opportunity to make the most of their abilities.
As noted, the equity indicators include participation and retention rates—and whether schools are meeting the needs of identified ‘special needs groups’.
The participation rate for the post-compulsory years of school, for all Australian schools, was 50.3 per cent in 2003. This does not include young people who are participating in VET. The Australian participation rate for 15 to 19 year olds engaged in more broadly defined ‘education and training’ is 78 per cent. According to related OECD data, under this broader definition of educational participation, Australia is slightly above the OECD average (OECD 2004b).
To return to Australian school participation rates, the ACT had the highest rate (61.5 per cent) and the NT the lowest (41.8 per cent). Victoria, at 56.1 per cent, was 5.3 percentage points higher than NSW. In virtually all jurisdictions, the female participation rate was slightly higher than that for males.

COMPARING SCHOOL SYSTEMS
15
A limitation of the participation data, apart from the VET interface issues, is that it is based on nominal enrolments rather than active attendance. Many Indigenous children are technically enrolled but not attending schools. That doesn’t get picked up in the figures. Even so, we find that school participation by Indigenous children aged 5 to 8, though in the ‘compulsory’ years of schooling, was still only 86 per cent.
Figure: Participation rates
Participation rates for 15 to 19 year olds, all schools, 2003
– 10.0 20.0 30.0 40.0 50.0 60.0 70.0
NSW Vic Qld WA SA Tas ACT NT Aust
Per c
ent
Male Female All students
Retention measures record students’ progression to final years of schooling. The 2003 Australia-wide retention rate from year 10 to year 12 for all schools was 77 per cent. That is, 77 per cent of students who were in year 10 in 2001, had progressed to year 12 in 2003.
Figure: Retention rates
Retention rates from year 10 to year 12, all schools, 2003
0.0
20.0
40.0
60.0
80.0
100.0
NSW Vic Qld WA SA Tas ACT NT Aust
Per c
ent
Indigenous students Non-Indigenous students

16 EDUCATION IS AUSTRALIA'S FUTURE
However, there was significant variation among jurisdictions.
• The ACT rate was highest for both Indigenous and non-Indigenous students (80 and 89 per cent respectively). There is a suggestion that this is influenced by students from NSW schools transferring to ACT schools for the final years of schooling.
• South Australia was lowest, but this is largely due to their comparatively high number of part time students, as retention is measured for full time students only.
Leaving these special cases aside, 83 per cent of all Victorian students had progressed from year 10 to year 12 in 2003, which was significantly higher than Western Australia at 71 per cent, and NSW at 73 per cent. These results are consistent with their relative participation rates. (NSW has indicated that its results reflect a greater proportion of students transferring to VET courses in later years, but data are not currently available to assess this.)
Indigenous retention rates to year 12 improved nationally from 36 per cent to 40 per cent, between 2001 and 2003—a positive development. However, Indigenous students in year 10 were still only half as likely to continue to year 12 than non-Indigenous students. Moreover, many Indigenous students will have already dropped out before year 10 (the end of compulsory schooling).
Figure: Indigenous retention rates
Retention rates of a single cohort of secondary school students, all schools, 2001-04
0
20
40
60
80
100
120
2001 (Year 9) 2002 (Year 10) 2003 (Year 11) 2004 (Year 12)
Per c
ent
Indigenous students Non-Indigenous students
Retention rates are also reported for government and non-government schools. These rates are affected by the number of students who switch from government to non-government schools in the final years of schooling. Non-government schools

COMPARING SCHOOL SYSTEMS
17
had a retention rate of 86 per cent from year 10 to year 12, compared to 72 per cent for government schools and 77 per cent for all schools.
‘Efficiency’ comparisons
Some $27 billion was spent by Australian governments on primary and secondary education in 2002-03. And there are claims for additional resources. It is essential that available funds are spent well.
Efficiency is measured, for government schools, in terms of expenditure per student, and student-to-staff ratios. As noted earlier, there can be trade-offs between expenditure and quality. However, relating the efficiency data to learning outcomes can raise some interesting questions about whether differences in expenditure are reflected in differences in outcomes.
Figure: Recurrent expenditure
Government expenditure per FTE student in government schools, 2002-03
–
5 000
10 000
15 000
NSW Vic Qld WA SA Tas ACT NT Aust
Dol
lars
Primary Secondary
As might be expected, the Northern Territory has the highest levels of recurrent expenditure for both primary and secondary school. For other jurisdictions:
• expenditure per primary school student ranged from $8715 in NSW to $7347 in Victoria, and
• expenditure per secondary school student ranged from $11 773 in the ACT to $9643 in South Australia. Again, there was a difference between NSW ($11 302) and Victoria ($10 014).
The student-to-staff ratio measures the number of full time equivalent students per FTE staff. There is some debate over the relationship between class sizes and

18 EDUCATION IS AUSTRALIA'S FUTURE
educational outcomes. However, apart from the NT (which had somewhat smaller class sizes) there was little variation across jurisdictions.
Effectiveness: how do learning outcomes compare?
The Review is largely dependent on MCEETYA for nationally comparable data on learning outcomes. Until mid-2005, these were limited to measures of the proportion of years 3 and 5 students who achieve a nationally agreed minimum benchmark standard in literacy (reading and writing) and numeracy. (Since mid-2005, year 7 results have been released, along with year 6 primary science data.)
The minimum benchmarks are set such that any student who did not reach those standards would have difficulty progressing satisfactorily at school.
The benchmark measures remain controversial. They are set after considering student achievement in national surveys and State and Territory assessment programs, expert opinion and classroom trials in all jurisdictions. But each jurisdiction applies its own tests. (There is no nationally applied test). The benchmarks attempt to set an equivalent minimum standard for each test, to allow inter-jurisdictional comparisons of results.
The MCEETYA benchmark approach focuses on an ‘extreme’—those students who do not reach a minimum standard. This design feature means that the published results are unlikely to identify any major differences between jurisdictions, almost by definition. The vast majority of students would be expected to pass a benchmark set at such a low standard. This is borne out by the results (again leaving aside the Northern Territory, because of its high proportion of Indigenous students). Most jurisdictions consistently report around 90 per cent of students reaching the benchmarks.1
Nevertheless, some differences do appear in the MCEETYA results. For example, based on the 2002 data:
• 89 per cent of students achieved the year three reading benchmark in SA, compared to 96 per cent in Tasmania;
• 86 per cent of students in WA and Queensland students achieved the year 3 writing benchmark, significantly below other jurisdictions; and
1 Even so, the MCEETYA data are published with extensive qualifiers and caveats, alerting
readers to the importance of considering factors such as different population characteristics, school starting age and sampling error in interpreting the results. More information can be found in the 2004 Blue Book (SCRGSP 2004).

COMPARING SCHOOL SYSTEMS
19
• while 95 per cent of Victorian students in year 5 achieved the writing benchmark, only 87 per cent achieved the reading benchmark.
Figure: Literacy
MCEETYA literacy outcomes, all schools, 2002
0
20
40
60
80
100
NSW Vic Qld WA SA Tas ACT NT Aust
Per c
ent
Year 3 Reading Year 3 Writing Year 5 Reading Year 5 Writing
Numeracy results showed an apparent decline in all jurisdictions except Victoria between years 3 and 5, with South Australia appearing to drop the most, from 91 per cent in year 3 to 85 per cent in year 5.
Figure: Numeracy
MCEETYA numeracy outcomes, all schools, 2002
0
20
40
60
80
100
NSW Vic Qld WA SA Tas ACT NT Aust
Year 3 Numeracy Year 5 Numeracy
Learning outcomes for Indigenous students were significantly poorer than for other students in all jurisdictions, across all benchmarks. In particular:

20 EDUCATION IS AUSTRALIA'S FUTURE
• the relative performance of Indigenous students deteriorated between years 3 and 5 in reading and numeracy; and
• there was a wide gap between Indigenous and all students for year 5 numeracy (over 24 percentage points).
Figure: Indigenous learning outcomes
MCEETYA learning outcomes, Indigenous and all students, all schools, 2002
0
20
40
60
80
100
Year 3Reading
Year 3Writing
Year 3Numeracy
Year 5Reading
Year 5Writing
Year 5Numeracy
Per c
ent
Indigenous students All students
Effectiveness is also measured in terms of completion rates—the proportion of the potential year 12 population obtaining a year 12 certificate (or equivalent).
The estimated year 12 completion rate was 69 per cent nationally in 2003. The outliers were the ACT at 80 per cent and the NT at 29 per cent. Among the others, the Victorian and Queensland rates were highest (72 per cent) and the WA rate lowest (66 per cent), while NSW, at 67 per cent, was also below the national average.

COMPARING SCHOOL SYSTEMS
21
Figure: Completion rates
Year 12 completion rates, 2003
0102030405060708090
NSW Vic Qld WA SA Tas ACT NT Aust
Per c
ent
It is difficult to make international comparisons on completion rates. Some indication might be given by OECD figures on the proportion of 25 to 34 year olds attaining at least upper secondary education. In 2002, 73 per cent of Australians in that age group had at least upper secondary education. This was below the OECD average of 75 per cent, and well below the US (87 per cent) and New Zealand (82 per cent) (OECD 2004b).
Do we know enough about jurisdictional performance?
Much work has been done over the ten Reports, and there have been some major improvements in reporting in that time. For example, no national learning outcomes data were available for the first six reports (until the 2001 Report). But there is still a fair way to go before one could say that performance reporting was satisfactory.
As noted earlier, the framework is based on the MCEETYA goals, which Ministers committed to reporting against in 1997. Since then:
• There has been little development in reporting on goal 1—‘life skills’. Most progress has been made in civics and citizenship education, where nationally agreed indicators exist but no data are available.
• Reporting on goal 2 — ‘knowledge skills and understanding’— is based on the data on learning outcomes for literacy and numeracy. But there has been no development in nationally comparable measures of ‘social outcomes’ or ‘enterprise education’.

22 EDUCATION IS AUSTRALIA'S FUTURE
• Reporting related to goal 3—social justice—is more complete. As noted, available data indicate wide gaps between Indigenous and non-Indigenous school students. The Report also indicates poorer school outcomes for children from remote areas, and children from lower socio-economic backgrounds. (For example, in 2003, students from very remote localities had completion rates of only 34 per cent, compared to the metropolitan zone rate of 72 per cent.)
The progress in reporting that has been made has been remarkably slow and difficult to achieve. Take the saga of national learning outcomes data:
• MCEETYA originally agreed that nationally comparable learning outcomes would be available in 1995.
• The first data, restricted to year 3 reading, were not available until 2000. The 2002 Report added year 5 reading from 1999.
• The 2003 Report included data for 2000 on year 3 and 5 reading and numeracy. It was not until the 2004 Report that data were available for year 3 and 5 reading, writing and numeracy — and these were for 2001.
• Measurement difficulties have prevented the publication of year 3, 5 and 7 spelling data for any year. The reading, writing and numeracy 2001-03 year 7 and 2002-03 years 3 and 5 results only became available during 2005.
As is apparent, the data are usually well out of date by the time they are released. Obviously, such protracted delays reduce the usefulness of the data for comparative assessments, as well as reducing transparency and accountability.
A second deficiency is that while non-government schools now participate in the national testing, MCEETYA only publishes data for ‘all schools’ (government plus non-government) on a nationally comparable basis. Not only does this make it impossible to compare the performance of government and non-government schools—it is not even possible to isolate the performance of government schools.
Moreover, as noted earlier, reporting against minimum standards (an unusual approach to benchmarking, which usually sets ‘best practice’ standards) is of limited usefulness in making jurisdictional comparisons. It is illuminating to contrast our national approach with the PISA international learning outcomes data. PISA data reports each jurisdiction’s results compared to both the average for the OECD and other jurisdictions. This allows the relative performance of each jurisdiction to be readily compared in a meaningful way. MCEETYA data merely report each jurisdiction’s results relative to a nationally agreed minimum standard. As noted, this is a very blunt indicator, and tends to show only winners.

COMPARING SCHOOL SYSTEMS
23
There are a number of other gaps in reporting against the indicator framework. For example:
• Most administrative systems are unable to trace the performance of individual students over time, including post-school destinations. The national development of a student identifier (subject to addressing privacy issues) could greatly improve our ability to analyse factors that influence school outcomes across jurisdictions. This is quite feasible—we understand that some jurisdictions have already developed surveys to track student performance and collect data on student destination outcomes.
• Current reporting on participation and apparent retention rates does not reflect the increasing number of students who are enrolling in school part-time, or choosing to pursue their senior secondary studies through TAFE. These estimates therefore may be subject to significant understatement, and are of reduced value in making comparisons across jurisdictions.
The Indigenous Report has identified further data priorities specific to addressing Indigenous disadvantage. For example:
• There is a need for learning outcomes data by geographic regions—separate data on Indigenous learning outcomes are only available by jurisdiction, not on a regional basis.
• There is also a need for comparable national data on school attendance, to allow comparisons between Indigenous and other students. The current lack of data on attendance also limits analysis of its relationship with learning outcomes and post-school achievement.
Making progress in such areas is inhibited by some aspects of the institutional arrangements. The Ministerial Council oversees the collection and dissemination of nationally consistent data. But under MCEETYA processes for releasing data, a single jurisdiction can hold up the publication of national data sets indefinitely. Governments commonly cite ‘quality concerns’ when withholding data — and indeed such data can never be perfect. On the other hand, most seem happy to cite PISA numbers that look favourable, even though they are arguably less rigorous than national data.
That said, agreement has been reached within MCEETYA on several improvements to future data. This includes extending the reporting of student achievement, including assessment of ‘civics and citizenship’ and ‘information and communication technology’ at years 6 and 10. MCEETYA is also examining ways to improve reporting and national comparability of test results, including trialling new common instruments. And MCEETYA is working on school attendance data, and participation and attainment data for VET in schools.
24 EDUCATION IS AUSTRALIA'S FUTURE
These are all positive developments. However, on past experience, it could take some time to see results. The work on improving nationally comparable learning outcomes data is particularly important. While extending the range of reporting is worthwhile, the nature of that reporting leaves much to be desired. What is needed is a common Australia-wide test, with meaningful measures.
Summing up
Despite a decade of endeavour, the ability to compare school systems across Australia is still limited. This is regrettable, given the extent of comparable data available internationally.
Why is it all so hard? Admittedly, there are some technical, and perhaps privacy, issues to be resolved, but the experience of the OECD is that these are not insurmountable. The issues appear to be more in the realm of politics and the willingness of the education sector to submit itself to scrutiny. But education is too important to our economic and social futures for the sector’s performance to be obscured. Australia’s federal system provides a valuable opportunity to learn from different educational approaches and philosophies, and thus to move forward with more confidence about achieving good outcomes nationally. We need to make the most of it.
COMPARING SCHOOL SYSTEMS
25
References ABS 2004, National Aboriginal and Torres Strait Islander Social Survey
(NATSISS) 2002, Cat. No. 4714.0, Canberra.
Banks, Gary 1998, Human Capital and Microeconomic Reform, edited transcript of a presentation to a Victorian Economic Society Forum, Sheraton Hotel, Melbourne 16 September 1998, www.pc.gov.au.
Barnes, P. and Kennard, S. 2002, Skill and Australia’s Productivity Surge, Productivity Commission Staff Research Paper, Canberra.
Donnelly, Kevin 2005, ‘Fads no substitute for teaching’, The Australian, 5 January 2005.
Dowrick Steve 2002, The Contribution of Innovation and Education to Economic Growth, Melbourne Institute Economic and Social Outlook Conference, April 2002, Towards Opportunity and Prosperity, http://www.melbourneinstitute.com.
OECD (Organisation for Economic Cooperation and Development) 2004a, Economic Survey of Australia, Paris.
——2004b, Education at a glance, OECD Indicators 2004, http://www.oecd.org/document/7/0,2340,en_2649_201185_33712135_1_1_1_1,00.html
Parham, Dean 2002, Australia’s 1990s Productivity Surge and its Determinants, Productivity Commission Staff Research paper, Canberra.
PC (Productivity Commission) 2005, Economic Implications of an Ageing Australia, Research Report, Canberra.
——2003, Social Capital: Reviewing the Concept and its Policy Implications, Research Paper, AusInfo, Canberra.
Romer, P, 1990, ‘Endogenous Technological Change’, Journal of Political Economy, 98:71-102.
SCRGSP (Steering Committee for the Review of Government Service Provision) 2004, Report on Government Services 2004, Productivity Commission, Canberra.
——2005a, Report on Government Services 2005, Productivity Commission, Canberra.
——2005b, Overcoming Indigenous Disadvantage: Key Indicators 2005, Productivity Commission, Canberra.
West, Roderick1998, Learning for Life, Final Report of the Review of Higher Education Financing and Policy, Department of Employment, Education, Training and Youth Affairs, Commonwealth of Australia, www.dest.gov.au.