Comparing Oversampling Techniques to Handle the Class ... · telecom industry, wherein predictive...
18
Received September 14, 2016, accepted October 1, 2016, date of publication October 26, 2016, date of current version November 28, 2016. Digital Object Identifier 10.1109/ACCESS.2016.2619719 Comparing Oversampling Techniques to Handle the Class Imbalance Problem: A Customer Churn Prediction Case Study ADNAN AMIN 1 , SAJID ANWAR 1 , AWAIS ADNAN 1 , MUHAMMAD NAWAZ 1 , NEWTON HOWARD 2 , JUNAID QADIR 3 , (Senior Member, IEEE), AHMAD HAWALAH 4 , AND AMIR HUSSAIN 5 , (Senior Member, IEEE) 1 Center for Excellence in Information Technology, Institute of Management Sciences, Peshawar 25000, Pakistan 2 Nuffield Department of Surgical Sciences, University of Oxford, Oxford, OX3 9DU, U.K. 3 Information Technology University, Arfa Software Technology Park, Lahore 54000, Pakistan 4 College of Computer Science and Engineering, Taibah University, Medina 344, Saudi Arabia 5 Division of Computing Science and Maths, University of Stirling, Stirling, FK9 4LA, U.K. Corresponding author: A. Amin ([email protected]) The work of A. Hussain was supported by the U.K. Engineering and Physical Sciences Research Council under Grant EP/M026981/1. ABSTRACT Customer retention is a major issue for various service-based organizations particularly telecom industry, wherein predictive models for observing the behavior of customers are one of the great instruments in customer retention process and inferring the future behavior of the customers. However, the performances of predictive models are greatly affected when the real-world data set is highly imbalanced. A data set is called imbalanced if the samples size from one class is very much smaller or larger than the other classes. The most commonly used technique is over/under sampling for handling the class-imbalance problem (CIP) in various domains. In this paper, we survey six well-known sampling techniques and compare the performances of these key techniques, i.e., mega-trend diffusion function (MTDF), synthetic minority oversampling technique, adaptive synthetic sampling approach, couples top-N reverse k -nearest neigh- bor, majority weighted minority oversampling technique, and immune centroids oversampling technique. Moreover, this paper also reveals the evaluation of four rules-generation algorithms (the learning from example module, version 2 (LEM2), covering, exhaustive, and genetic algorithms) using publicly available data sets. The empirical results demonstrate that the overall predictive performance of MTDF and rules- generation based on genetic algorithms performed the best as compared with the rest of the evaluated oversampling methods and rule-generation algorithms. INDEX TERMS SMOTE, ADASYN, mega trend diffusion function, class imbalance, rough set, customer churn, mRMR. ICOTE, MWMOTE, TRkNN. I. INTRODUCTION In many subscription-based service industries such as telecommunications companies, are constantly striving to recognize customers that are looking to switch providers (i.e., Customer churn). Reducing churn is extremely important in competitive markets since acquiring new customers in such markets is very difficult (attracting non-subscribers can cost up to six times more than what it costs to retain the current customers by taking active steps to discourage churn behavior [1]). Churn-prone industries such as the telecommunication industry typically maintain customer relationship manage- ment (CRM) databases that are rich in unseen knowledge and certain patterns that may be exploited for acquiring customer information on time for intelligent decision-making practice of an industry [2]. However, knowledge discovery in such rich CRM databases, which typically contains thousands or millions of customers’ information, is a challenging and difficult task. Therefore, many industries have to inescapably depend on prediction models for customer churn if they want to remain in the competitive market [1]. As a consequence, several competitive industries have implemented a wide range of sta- tistical and intelligent machine learning (ML) techniques to develop predictive models that deal with customer churn [2]. 7940 2169-3536 2016 IEEE. Translations and content mining are permitted for academic research only. Personal use is also permitted, but republication/redistribution requires IEEE permission. See http://www.ieee.org/publications_standards/publications/rights/index.html for more information. VOLUME 4, 2016
Transcript of Comparing Oversampling Techniques to Handle the Class ... · telecom industry, wherein predictive...
Received September 14, 2016, accepted October 1, 2016, date of publication October 26, 2016,date of current version November 28, 2016.
Digital Object Identifier 10.1109/ACCESS.2016.2619719
Comparing Oversampling Techniques to Handlethe Class Imbalance Problem: A CustomerChurn Prediction Case StudyADNAN AMIN1, SAJID ANWAR1, AWAIS ADNAN1, MUHAMMAD NAWAZ1,NEWTON HOWARD2, JUNAID QADIR3, (Senior Member, IEEE),AHMAD HAWALAH4, AND AMIR HUSSAIN5, (Senior Member, IEEE)1Center for Excellence in Information Technology, Institute of Management Sciences, Peshawar 25000, Pakistan2Nuffield Department of Surgical Sciences, University of Oxford, Oxford, OX3 9DU, U.K.3Information Technology University, Arfa Software Technology Park, Lahore 54000, Pakistan4College of Computer Science and Engineering, Taibah University, Medina 344, Saudi Arabia5Division of Computing Science and Maths, University of Stirling, Stirling, FK9 4LA, U.K.
Corresponding author: A. Amin ([email protected])
The work of A. Hussain was supported by the U.K. Engineering and Physical Sciences Research Council under Grant EP/M026981/1.
ABSTRACT Customer retention is a major issue for various service-based organizations particularlytelecom industry, wherein predictive models for observing the behavior of customers are one of the greatinstruments in customer retention process and inferring the future behavior of the customers. However, theperformances of predictive models are greatly affected when the real-world data set is highly imbalanced.A data set is called imbalanced if the samples size from one class is very much smaller or larger than theother classes. The most commonly used technique is over/under sampling for handling the class-imbalanceproblem (CIP) in various domains. In this paper, we survey six well-known sampling techniques and comparethe performances of these key techniques, i.e., mega-trend diffusion function (MTDF), synthetic minorityoversampling technique, adaptive synthetic sampling approach, couples top-N reverse k-nearest neigh-bor, majority weighted minority oversampling technique, and immune centroids oversampling technique.Moreover, this paper also reveals the evaluation of four rules-generation algorithms (the learning fromexample module, version 2 (LEM2), covering, exhaustive, and genetic algorithms) using publicly availabledata sets. The empirical results demonstrate that the overall predictive performance of MTDF and rules-generation based on genetic algorithms performed the best as compared with the rest of the evaluatedoversampling methods and rule-generation algorithms.
INDEX TERMS SMOTE, ADASYN, mega trend diffusion function, class imbalance, rough set, customerchurn, mRMR. ICOTE, MWMOTE, TRkNN.
I. INTRODUCTIONIn many subscription-based service industries such astelecommunications companies, are constantly striving torecognize customers that are looking to switch providers (i.e.,Customer churn). Reducing churn is extremely important incompetitive markets since acquiring new customers in suchmarkets is very difficult (attracting non-subscribers can costup to six times more than what it costs to retain the currentcustomers by taking active steps to discourage churn behavior[1]). Churn-prone industries such as the telecommunicationindustry typically maintain customer relationship manage-ment (CRM) databases that are rich in unseen knowledge and
certain patterns that may be exploited for acquiring customerinformation on time for intelligent decision-making practiceof an industry [2].
However, knowledge discovery in such rich CRMdatabases, which typically contains thousands or millions ofcustomers’ information, is a challenging and difficult task.Therefore, many industries have to inescapably depend onprediction models for customer churn if they want to remainin the competitive market [1]. As a consequence, severalcompetitive industries have implemented a wide range of sta-tistical and intelligent machine learning (ML) techniques todevelop predictive models that deal with customer churn [2].
79402169-3536 2016 IEEE. Translations and content mining are permitted for academic research only.
Personal use is also permitted, but republication/redistribution requires IEEE permission.See http://www.ieee.org/publications_standards/publications/rights/index.html for more information.
VOLUME 4, 2016
A. Amin et al.: Comparing Oversampling Techniques to Handle the CIP: A Customer Churn Prediction Case Study
Unfortunately, the performance of ML techniques isconsiderably affected by the CIP. The problem of imbal-anced dataset appears when the proportion of majorityclass has a higher ratio than minority class [3], [4].The skewed distribution (imbalanced) of data in the datasetposes challenges for machine learning and data mining algo-rithms [3], [5]. This is an area of research focusing on skewedclass distribution where minority class is targeted for classi-fication [6]. Consider a dataset where the imbalance ratio is1:99 (i.e., where 99% of the instances belong to the majorityclass, and 1% belongs to the minority class). A classifiermay achieve the accuracy up to 99% just by ignoring that1% of minority class instances—however, adopting suchan approach will result in the failure to correctly classifyany instances of the class of interest (often the minorityclass).
It is well known that churn is a rare object in service-based industries, and that misclassification is more costly forrare objects or events in the case of imbalance datasets [7].Traditional approaches, therefore, can provide mislead-ing results on the class-imbalanced dataset—a situationthat is highly significant and one that occurs in manydomains [3], [6]. For instance, there are a significant num-ber of real-world applications that are suffering from theclass imbalance problem (e.g., medical and fault diagnosis,anomaly detection, face recognition, telecommunication, theweb & email classification, ecology, biology and financialservices [3], [4], [6], [85], [86]).
Sampling is a commonly used technique for handlingthe CIP in various domains. Broadly speaking, samplingcan be categorized into oversampling and undersampling.A large number of studies focused on handling the classimbalance problem have been reported in literature [2], [4].These studies can be grouped into the following approachesbased on their dealing with class imbalance issue: (i) theinternal-level: construct or update the existing methods toemphasize the significance of the minority class and (ii)the external level: adding data in preprocessing stage wherethe distribution of class is resampled in order to reducethe influence of imbalanced distribution of class in theclassification process. The internal level approach is fur-ther divided into two groups [5]. Firstly, the cost-sensitiveapproach, which falls between internal and external levelapproaches, is based on reducing incorrect classificationcosts for minority class leading to reduction of the over-all cost for both internal and external level approaches.Secondly, the ensemble/boosting approach, which adoptsthe use of multiple classifiers to follow the similar ideaadopted by the internal approach. In this study, we have usedsix well-known advanced oversampling techniques—namely,Mega-trend Diffusion Function (MTDF), Synthetic MinorityOversampling Technique (SMOTE), Adaptive SyntheticSampling approach (ADASYN), Majority Weighted Minor-ity Oversampling Technique (MWMOTE), Immune cen-troids oversampling technique (ICOTE) and Couples Top-NReverse k-Nearest Neighbor (TRkNN).
SMOTE [6] is commonly used as a benchmark for over-sampling algorithm [7], [8]. ADASYN is also an importantoversampling technique which improves the learning aboutthe samples distribution in an efficient way [9]. MTDF wasfirst proposed by Li et al. [10] and reported improved per-formance of classifying imbalanced medical datasets [11].CUBE is also another advanced oversampling technique [12]but we have not considered this approach since as notedby Japkowicz [13], CUBE oversampling technique does notincrease the predictive performance of the classifier. Theabove-mentioned oversampling approaches are used to han-dle the imbalanced dataset and improve the performanceof predictive models for customer churn, particularly inthe telecommunication sector. Rough Set Theory (RST) isapplied to the four different rule-generation algorithms—(i) Learning from Example Module, version 2 (LEM2),(ii) Genetic (Gen), (iii) Covering (Cov) and (iv) Exhaustive(Exh) algorithms—in this study to observe the behavior ofcustomer churn and all experiments are applied on the pub-licly available dataset. It is specified here that this paper isan extended version of our previous work [14], and makesthe following contributions: (i) more datasets are employedto obtained more generalized results for the selected over-sampling techniques and the rules-generation algorithms,(ii) another well-known oversampling technique—namely,ADASYN—is also used (iii) detailed analysis and discus-sion on the performance of targeted oversampling tech-niques (namely, ADASYN, MTDF, SMOTE, MWMOTE,ICOTE and TRkNN) followed by the rules-generation algo-rithms—namely, Gen, Cov, LEM2 and Exh, and (iv) detailedperformance evaluation—in terms of the balance accuracy,the imbalance ratio, the area under the curve (AUC) andthe McNemar’s statistical test—is performed to validate theresults and avoid any biases. Many comparative studies [2],[7], [11], [15], [16] have already been carried out on thecomparison of oversampling and undersampling methods forhandling the CIP; however, the proposed study differs fromthe previous studies in that in addition to evaluating six over-sampling techniques (SMOTE, ADASYN, MTDF, ICOTE,MWMOTE and TRkNN), we also compare the performanceof four rules-generation algorithms (Exh, Gen, Cov andLEM2). The proposed study is also focused on consideringthe following research questions (RQ):• RQ1: What is the list of attributes that is highly symp-tomatic in the targeted data set for prediction of customerchurn?
• RQ2: Which of the oversampling technique (e.g.SMOTE, MTDF, ADASYN, ICOTE, MWMOTE andTRkNN) is more suitable for creating synthetically sam-ples that not only handle the CIP in a dataset of thetelecommunication sector but also improves the classi-fication performance.
• RQ3:Which of the rule-generation algorithm (Exh, Gen,Cov & LEM2) is more suitable using RST based classi-fication for customer churn prediction in the imbalanceddataset.
VOLUME 4, 2016 7941
A. Amin et al.: Comparing Oversampling Techniques to Handle the CIP: A Customer Churn Prediction Case Study
Remaining paper is organized as follows: the next sectionpresents the existing work of class imbalance and approachesto handle the CIP. The background study and evaluation mea-sures are explored in section III. The experiments are detailedin section IV. The section V explains the results followed bysection VI that concludes the paper.
II. HANDLING THE CLASS-IMBALANCE PROBLEMA. CLASS IMBALANCE PROBLEM (CIP)In this section, firstly it is explained that the CIP in the contextof classification followed by techniques used in handling theCIP in a dataset and its relationship to potential domains.This section also contains a brief literature review on classimbalance/skewed distribution of samples in datasets.
Prior to the overview of handling CIP, first, there is a needto address the notion of classification. The aim of classifi-cation is to train the classifier on some dataset, making itcapable to correctly classify the unknown classes of unseenobjects [4], [17]. If the samples in the dataset are not balanced,there is a great chance that the classification task will resultin misleading results.
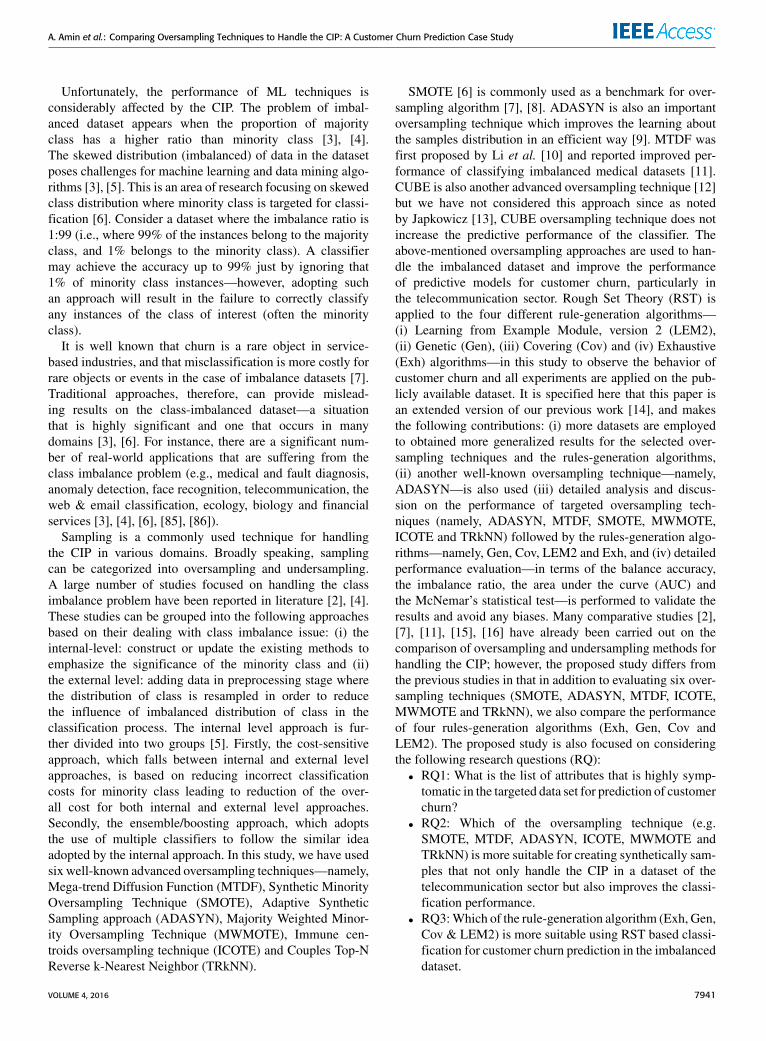
CIP exists in many real-world classifications includ-ing Social Network Services [18]–[22], Banks & Finan-cial Services [16], [23]–[26], Credit Card AccountServices [27], [28], Online Gaming Services [29], [30],Human Resource Management [31]–[33], Discussion &Answer forums [34], Fault Prediction &Diagnosis [11], [35],User’s profile personalization [36], Wireless Networks[37], [38], 5G future network [39] and Insurance & Subscrip-tion Services [40]–[42]. Considering the scenario of classimbalance in any application domain, almost all the objectsbelong to specific class (majority class) and far less numberof objects are assigned to other class (minority class) [26].The classification problems observation shows that trainingthe classifier using conventional classification techniquesresults on higher performance, but it tends to classify allthe samples data into the majority class; usually, which isoften not the desired goal of the classification study [26].In contrast, research studies [43], [44] show that latestmachine learning techniques result in low performance dueto dealing with large imbalanced datasets. Also, the classimbalance may cause classification approaches to pass fromdifficulties in learning, which eventually results in poorclassification performance [15]. Therefore, learning fromimbalanced class data has received a tremendous amount ofattention from the machine learning and data mining researchcommunity [45]. The following figures illustrate difficultiesin imbalanced datasets such as figure 1 (a) describes theoverlapping problem & small disjoints in figure 1(b).
1) APPROACHES FOR HANDLING THE CIPHandling the CIP is one of the most important approachesfor dealing with rarity in sampling. The basic idea ofhandling CIP is to reduce the majority class or increasethe minority class samples by altering the samples in the
FIGURE 1. When overlapping occurs then hard to induce thediscriminative rules [see figure 1 (a)] while the figure 1 (b) reflectsthe existence of small disjoints that increases the complexity dueto unbalanced instances.
dataset distribution. Following are the threemajor approachesused for handling CIP:
• The basic samplingmethod for under/over-sampling:The basic sampling method for under/over-samplingis usually referred to a manual approach which is thesimplest form to deal with the undersampling or over-sampling in datasets [2]. In this method, some of thesamples from the majority class are either eliminated orthe samples of minority class are duplicated to balancethe data distribution in the dataset. However, this methodfor undersampling has a drawback [46], i.e., it discardspotentially important samples (lack of data) in majorityclass and thus can receive low classifier’s performance.On the other hand, oversampling replicates data in thedataset. This does not degrade the classifier’s perfor-mance but can usually takemore time to train a classifier.
• The advanced sampling method for under/over-sampling: The advanced sampling methods mayinvolve some data mining or statistical approach to cutthe samples or combine the undersampling and over-sampling techniques [2]. There are many intelligencetechniques which are used for handling CIP such asSMOTE [6], ADASYN [9], MTDF [10], etc.
• Random undersampling/oversampling technique: Inthis technique, randomly removed samples from themajority class are combinedwith theminority class sam-ples. While in random oversampling technique, the sam-ples are replicated for random times and combined themwith the samples population of the majority class [26].Classification techniques usually produce a better per-formance when the samples of both classes are nearlyequally distributed in the dataset.
Figure 2(a) depicts the examples of random ignorance of themajority class sample while figure 2(b) replicate the minorityclass samples.
B. METHODS FOR DEALING WITH CIPThe methods for dealing with the CIP, as discussed inthe introduction section, can be classified into two groupsdepending on how these methods are used, for either under-sampling or oversampling, are the following:
7942 VOLUME 4, 2016

A. Amin et al.: Comparing Oversampling Techniques to Handle the CIP: A Customer Churn Prediction Case Study
FIGURE 2. (a) Reflects the randomly removes the instances from majorityclass. Figure 2(b) illustrate oversampling method by replicating theinstances of minority class to balance the dataset.
• Internal (algorithm level) approaches: In thisapproach, the concept is to resample the data throughexisting classification algorithms in order to rebalancethe class distribution [4], [5]. Where the oversamplingapproach increases the minority class by bias data, whileeliminating examples from the majority class is donethrough undersampling approach. The algorithm levelmethods are more dependent on problem & requirespecial knowledge of targeted classifier(s) along withdomain knowledge [4], [47]. This method is furtherdivided into two groups [5]. Firstly, cost-sensitive learn-ing, which is based on reducing the misclassificationcosts for minority class, and on reducing the total costerrors of both classes. Secondly, ensemble or boostingmethod is based onmultiple sets of classifiers (ensembletechnique) to handle the CIP [4].
• External (data level) approach: In this approach,a preprocessing step is involved in order to reduce theeffect of imbalanced class distribution in the classifica-tion process. There is no need to have special knowl-edge of classifiers and domain. Therefore, data levelapproach is usually more versatile. The objective ofthis approach is to rebalance the skewed distribution ofsamples by resampling the data space [48]. Resamplingmethod is used to rebalance the distribution of the classdata [4], [5], [47], and therefore avoids the modificationof the learning algorithm.
The data level approaches are usually considered to prepro-cess the data before training the classifier and then includeinto learning algorithms [4], [49]. On the other hand, cost-sensitive and internal levelmethods are depended on the prob-lem and require special knowledge of targeted classifier alongwith the domain. Similarly, the cost-sensitive technique hasa major problem of defining misclassification costs, whichare not usually known/available in the data space [50]. Thecomparison between oversampling and undersampling has
already been performed [2] with the conclusion that over-sampling performs best as compared to undersampling forhandling CIP. It is also reported that undersampling tech-nique has a major problem of losing classifier’s performancewhen some potential samples are discarded from the majorityclass [46]. Due to these motives, our objective is to deeplyreview the state-of-the-art data level methods to addressbinary CIP. The data level method have following advantages:(i) it is independent of the obligation to train the classifier;(ii) it is usually used in preprocessing data stage of othermethods (i.e. ensemble-based approach, cost-sensitive level);and (iii) it can be easily incorporated into other methods(i.e. internal methods) [51].
C. TECHNIQUES FOR HANDLING CIPKubat et al. [52] have addressed the CIP by applying under-sampling technique for the majority class and kept the orig-inal instances of the minority class. They applied geometricmean (related to ROC Curve) for performance evaluation ofclassifiers. Burez and Van den Poel [2] reported that ran-dom undersampling can improve the prediction accuracy ascompared to the boosting techniques but did not help themin their experiments. However, by randomly oversamplingor resampling the minority class may result in over-fitting.Chawla et al. [6] introduced a novel SMOTE considered aswidespread technique for oversampling. SMOTE producesnew minority observations based on weighted mean/averageof the k-nearest neighbor giving positive observations.It reduces the samples inconsistency and creates a correlationbetween objects of the minority class. The SMOTE oversam-pling technique is experimentally evaluated on a variety ofdatasets with various levels of imbalance and different sizesof data. SMOTE with C4.5 and Ripper algorithms, outper-formed as compared to Ripper’s Loss Ratio and Naïve Bayes[6], [45]. Verbeke et al. [15] illustrated an oversamplingtechnique by simply copying the minority class data andadding it to the training set. They reported that just over-sampling the minority class by same data (i.e. copied sam-ples) did not show significant improvement in performanceof the classifier. Therefore, they have suggested using moreappropriate oversampling methods (i.e. SMOTE). On theother hand, Jo and Japkowicz [3] showed that the deci-sion tree C4.5 and Backpropagation Neural Network (BNN)algorithms both degrade the performance of classifiers onsmall and complex dataset due to class imbalance. Theyhave proposed to use the cluster-based oversampling fora small and complex dataset with class imbalance dataset.Ling and Li [53] have combined oversampling with under-sampling of minority and majority classes respectively. Theyperformed different experiments such as undersampling thedata in majority class followed by oversampling the data inminority class and finally combining the oversampled withunder-sampled data. The conclusive results did not showsignificant improvement. Tang et al. [54], used support vectormachine (SVM) and granular computing for handling CIPthrough undersampling technique. They have removed the
VOLUME 4, 2016 7943
A. Amin et al.: Comparing Oversampling Techniques to Handle the CIP: A Customer Churn Prediction Case Study
noisy data (e.g., redundant data or irrelevant data) from thedataset while keeping only those samples that have maximumrelevant information. They investigated that undersamplingcan significantly increase the classification performance, butit was also observed that random undersampling might notprovide highly accurate classification. On the other hand,Wu and Chang [55] performed an experiment showing resultsweak performance of SVM on the dataset that suffered fromCIP. Foster Probost [56] empirically observed that duringclassification process with imbalanced data the number ofinstances of minority class are usually very less. Therefore,the trained classifiers can accurately recognize the objects ofmajority class instead of minority class. The reason is that theminority class cannot contribute more as compared to major-ity class. Due to this reason, the misclassification of instancesthat belong to minority class cannot be reduced in CIP.Batista et al. [48] introduced a comparative investigationof various sampling schema (i.e., Edited Nearest Neighborrule or ENN and SMOTE) to balance the training-set. Theyremoved the redundant or irrelevant data from the trainingprocess, which improved the mean number of induced rulesand increased the performance of SMOTE+ENN. In con-nection to this work, another sampling technique was pro-posed by Guo and Viktor [57] for handling CIP. He modifiedthe existing procedure of DataBoost which performed muchbetter than SMOTEBoost [49].
He et al. [9] introduced ADASYN oversampling algorithmwhich was an extension of the SMOTE algorithm. Theyreported that ADASYN algorithm can self-decide the numberof artificial data samples that are required to be producedfor minority class. They also investigated that ADASYN notonly provided a balanced data distribution but also forcedthe learning algorithm to focus on complex samples in thedataset. On the other hand, SMOTE algorithm [6], gener-ated alike numbers of artificial data for minority class whileDataBoost-IM [57] algorithm has generated various weigh-tage for changedminority class samples to compensate for thedistribution of skewed data. However, in their study, they haveshown that ADASYN has produced more efficient resultsthan SMOTE and DataBoost-IM.
III. BACKGROUND: OVERSAMPLING TECHNIQUESAND EVALUATION METRICSThis section presents a study of six well-known oversamplingtechniques (i.e., MTDF, SMOTE, ADASYN, MWMOTE,TRkNN and ICOTE), feature selection algorithm (i.e.,mRMR) and Rough Set Theory (RST).
A. MEGA-TREND-DIFFUSION FUNCTION (MTDF)Li et al. [10] introduced the MTDF, procedure to facilitatethe estimation of domain samples systematically. It generatesartificial data to balance the dataset. In their work, MTDFis applied for oversampling in order to address the CIP forcustomer churn prediction in the targeted domain. Due toinsufficient data, small samples size or imbalance distribu-tion of class samples provides imprecise information [10].
Therefore,MTDF apply amutual diffusion function to diffusethe data. Let hset , is diffusion coefficient set, i.e.
hset = S2x /n (1)
S2x=
n∑i=1
(Xi − X )2/n− 1 (2)
Where equation (2) is sample set variance and n is represent-ing the size of sample. If the set of the sample is variant,then, i.e., uset = min+max
2 , The lower and upper boundariesof diffused sample are;
a = uset −√−2× S2x /NL × ln(ϕ(a)) (3)
b = uset +√−2× S2x /NU × ln(ϕ(b)) (4)
Let SkewL =NL
(NL+NU )and SkewU =
NU(NL+NU )
are the
left and right skewness magnitudes of√−2× h× ln(ϕ(a))
in order to characterize the asymmetric diffusion. In pro-pose study the diffusion function is used and accordinglyrevised as:
a = uset − SkewL ×
√−2× S
2x/NL × ln(ϕ(a) (5)
b = uset − SkewU ×
√−2× S
2x/NU × ln(ϕ(b) (6)
Besides these it is important to note that if the varianceof any features for a target class is zero, then the value ofNU and NLwill be zero. Under such conditions equations(5) and (6) are not used. However, they propose that eitherequation (7) or (8) can be used.
a =min5
(7)
b = max × 5. (8)
B. SMOTETo overcome the issue of over-fitting and extend the decisionarea of the minority class samples, a novel technique SMOTE‘‘Synthetic Minority Oversampling TEchnique’’ was intro-duced by Chawla [45], This technique produces artificialsamples by using the feature space rather than data space.It is used for oversampling of minority class by creatingthe artificial data instead of using replacement or random-ized sampling techniques. It was the first technique whichintroduced new samples in the learning dataset to enhancethe data space and counter the scarcity in the distribution ofsamples [45]. The oversampling technique is a standard pro-cedure in the classification of imbalance data (e.g., minorityclass) [7]. It has received incredible effort from the researcherof machine learning domain in a recent decade. The pseudocode of the SMOTE algorithm and detail can be found in [45].
C. mRMRPeng et al. [58], introduced Minimal Redundancy MaximalRelevance (mRMR) technique for attributes selection as perthe procedure of themaximal statistical dependency criterion.
7944 VOLUME 4, 2016
A. Amin et al.: Comparing Oversampling Techniques to Handle the CIP: A Customer Churn Prediction Case Study
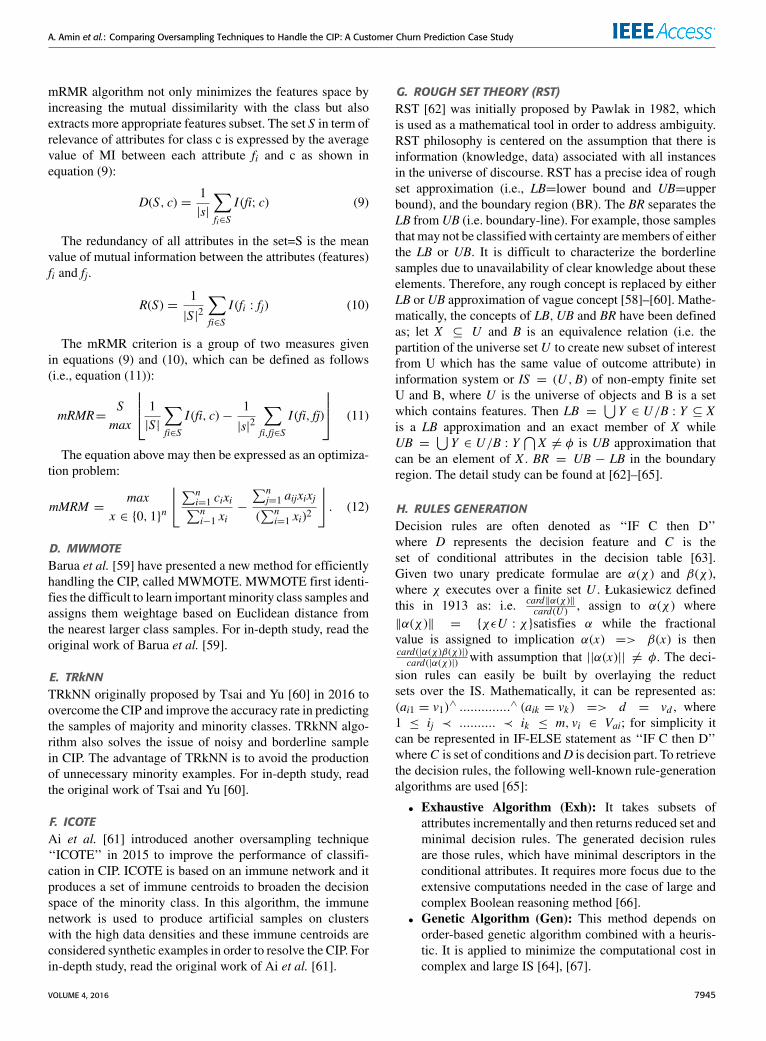
mRMR algorithm not only minimizes the features space byincreasing the mutual dissimilarity with the class but alsoextracts more appropriate features subset. The set S in term ofrelevance of attributes for class c is expressed by the averagevalue of MI between each attribute fi and c as shown inequation (9):
D(S, c) =1|s|
∑fi∈S
I (fi; c) (9)
The redundancy of all attributes in the set=S is the meanvalue of mutual information between the attributes (features)fi and fj.
R(S) =1
|S|2∑fi∈S
I (fi : fj) (10)
The mRMR criterion is a group of two measures givenin equations (9) and (10), which can be defined as follows(i.e., equation (11)):
mRMR=Smax
1|S|
∑fi∈S
I (fi, c)−1
|s|2∑fi,fj∈S
I (fi, fj)
(11)
The equation above may then be expressed as an optimiza-tion problem:
mMRM =max
x ∈ {0, 1}n
⌊∑ni=1 cixi∑ni−1 xi
−
∑nj=1 aijxixj
(∑n
i=1 xi)2
⌋. (12)
D. MWMOTEBarua et al. [59] have presented a new method for efficientlyhandling the CIP, called MWMOTE. MWMOTE first identi-fies the difficult to learn important minority class samples andassigns them weightage based on Euclidean distance fromthe nearest larger class samples. For in-depth study, read theoriginal work of Barua et al. [59].
E. TRkNNTRkNN originally proposed by Tsai and Yu [60] in 2016 toovercome the CIP and improve the accuracy rate in predictingthe samples of majority and minority classes. TRkNN algo-rithm also solves the issue of noisy and borderline samplein CIP. The advantage of TRkNN is to avoid the productionof unnecessary minority examples. For in-depth study, readthe original work of Tsai and Yu [60].
F. ICOTEAi et al. [61] introduced another oversampling technique‘‘ICOTE’’ in 2015 to improve the performance of classifi-cation in CIP. ICOTE is based on an immune network and itproduces a set of immune centroids to broaden the decisionspace of the minority class. In this algorithm, the immunenetwork is used to produce artificial samples on clusterswith the high data densities and these immune centroids areconsidered synthetic examples in order to resolve the CIP. Forin-depth study, read the original work of Ai et al. [61].
G. ROUGH SET THEORY (RST)RST [62] was initially proposed by Pawlak in 1982, whichis used as a mathematical tool in order to address ambiguity.RST philosophy is centered on the assumption that there isinformation (knowledge, data) associated with all instancesin the universe of discourse. RST has a precise idea of roughset approximation (i.e., LB=lower bound and UB=upperbound), and the boundary region (BR). The BR separates theLB fromUB (i.e. boundary-line). For example, those samplesthat may not be classifiedwith certainty aremembers of eitherthe LB or UB. It is difficult to characterize the borderlinesamples due to unavailability of clear knowledge about theseelements. Therefore, any rough concept is replaced by eitherLB or UB approximation of vague concept [58]–[60]. Mathe-matically, the concepts of LB,UB and BR have been definedas; let X ⊆ U and B is an equivalence relation (i.e. thepartition of the universe set U to create new subset of interestfrom U which has the same value of outcome attribute) ininformation system or IS = (U ,B) of non-empty finite setU and B, where U is the universe of objects and B is a setwhich contains features. Then LB =
⋃Y ∈ U/B : Y ⊆ X
is a LB approximation and an exact member of X whileUB =
⋃Y ∈ U/B : Y
⋂X 6= φ is UB approximation that
can be an element of X . BR = UB − LB in the boundaryregion. The detail study can be found at [62]–[65].
H. RULES GENERATIONDecision rules are often denoted as ‘‘IF C then D’’where D represents the decision feature and C is theset of conditional attributes in the decision table [63].Given two unary predicate formulae are α(χ ) and β(χ ),where χ executes over a finite set U . Łukasiewicz definedthis in 1913 as: i.e. card‖α(χ )‖
card(U ) , assign to α(χ ) where‖α(χ )‖ = {χεU : χ}satisfies α while the fractionalvalue is assigned to implication α(x) => β(x) is thencard(|α(χ )β(χ )|)card(|α(χ )|) with assumption that ||α(x)|| 6= φ. The deci-
sion rules can easily be built by overlaying the reductsets over the IS. Mathematically, it can be represented as:(ai1 = v1)∧ ..............∧ (aik = vk) => d = vd , where1 ≤ ij ≺ .......... ≺ ik ≤ m, vi ∈ Vai; for simplicity itcan be represented in IF-ELSE statement as ‘‘IF C then D’’whereC is set of conditions andD is decision part. To retrievethe decision rules, the following well-known rule-generationalgorithms are used [65]:
• Exhaustive Algorithm (Exh): It takes subsets ofattributes incrementally and then returns reduced set andminimal decision rules. The generated decision rulesare those rules, which have minimal descriptors in theconditional attributes. It requires more focus due to theextensive computations needed in the case of large andcomplex Boolean reasoning method [66].
• Genetic Algorithm (Gen): This method depends onorder-based genetic algorithm combined with a heuris-tic. It is applied to minimize the computational cost incomplex and large IS [64], [67].
VOLUME 4, 2016 7945
A. Amin et al.: Comparing Oversampling Techniques to Handle the CIP: A Customer Churn Prediction Case Study
• Covering Algorithm (Cov): It is the modifiedimplementation of the Learning from Example Module,version 1 (LEM1) algorithm and deployed in the RoughSet Exploration System (RSES) as a rule-generationmethod. It was presented by Jerzy Grzymala [68].
• RSES LEM2 Algorithm (LEM2): It is a divide-and-conquer based method which coupled with theRST approximation and it depends on the local cover-ing determination of every instance from the decisionattribute [68], [69].
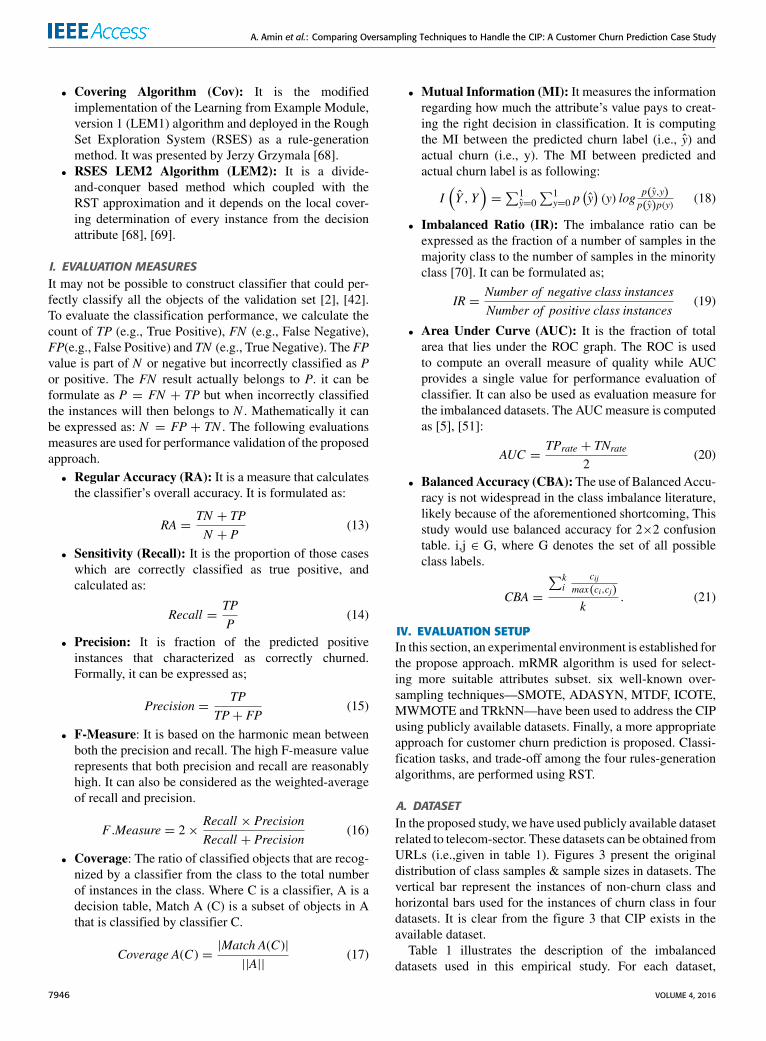
I. EVALUATION MEASURESIt may not be possible to construct classifier that could per-fectly classify all the objects of the validation set [2], [42].To evaluate the classification performance, we calculate thecount of TP (e.g., True Positive), FN (e.g., False Negative),FP(e.g., False Positive) and TN (e.g., True Negative). The FPvalue is part of N or negative but incorrectly classified as Por positive. The FN result actually belongs to P. it can beformulate as P = FN + TP but when incorrectly classifiedthe instances will then belongs to N . Mathematically it canbe expressed as: N = FP + TN . The following evaluationsmeasures are used for performance validation of the proposedapproach.• Regular Accuracy (RA): It is a measure that calculatesthe classifier’s overall accuracy. It is formulated as:
RA =TN + TPN + P
(13)
• Sensitivity (Recall): It is the proportion of those caseswhich are correctly classified as true positive, andcalculated as:
Recall =TPP
(14)
• Precision: It is fraction of the predicted positiveinstances that characterized as correctly churned.Formally, it can be expressed as;
Precision =TP
TP+ FP(15)
• F-Measure: It is based on the harmonic mean betweenboth the precision and recall. The high F-measure valuerepresents that both precision and recall are reasonablyhigh. It can also be considered as the weighted-averageof recall and precision.
F .Measure = 2×Recall × PrecisionRecall + Precision
(16)
• Coverage: The ratio of classified objects that are recog-nized by a classifier from the class to the total numberof instances in the class. Where C is a classifier, A is adecision table, Match A (C) is a subset of objects in Athat is classified by classifier C.
Coverage A(C) =|Match A(C)|||A||
(17)
• Mutual Information (MI): It measures the informationregarding how much the attribute’s value pays to creat-ing the right decision in classification. It is computingthe MI between the predicted churn label (i.e., y) andactual churn (i.e., y). The MI between predicted andactual churn label is as following:
I(Y ,Y
)=∑1
y=0∑1
y=0 p(y)(y) log p(y,y)
p(y)p(y)(18)
• Imbalanced Ratio (IR): The imbalance ratio can beexpressed as the fraction of a number of samples in themajority class to the number of samples in the minorityclass [70]. It can be formulated as;
IR =Number of negative class instancesNumber of positive class instances
(19)
• Area Under Curve (AUC): It is the fraction of totalarea that lies under the ROC graph. The ROC is usedto compute an overall measure of quality while AUCprovides a single value for performance evaluation ofclassifier. It can also be used as evaluation measure forthe imbalanced datasets. The AUCmeasure is computedas [5], [51]:
AUC =TPrate + TNrate
2(20)
• BalancedAccuracy (CBA):The use of Balanced Accu-racy is not widespread in the class imbalance literature,likely because of the aforementioned shortcoming, Thisstudy would use balanced accuracy for 2×2 confusiontable. i,j ∈ G, where G denotes the set of all possibleclass labels.
CBA =
∑ki
cijmax(ci,cj)
k. (21)
IV. EVALUATION SETUPIn this section, an experimental environment is established forthe propose approach. mRMR algorithm is used for select-ing more suitable attributes subset. six well-known over-sampling techniques—SMOTE, ADASYN, MTDF, ICOTE,MWMOTE and TRkNN—have been used to address the CIPusing publicly available datasets. Finally, a more appropriateapproach for customer churn prediction is proposed. Classi-fication tasks, and trade-off among the four rules-generationalgorithms, are performed using RST.
A. DATASETIn the proposed study, we have used publicly available datasetrelated to telecom-sector. These datasets can be obtained fromURLs (i.e.,given in table 1). Figures 3 present the originaldistribution of class samples & sample sizes in datasets. Thevertical bar represent the instances of non-churn class andhorizontal bars used for the instances of churn class in fourdatasets. It is clear from the figure 3 that CIP exists in theavailable dataset.
Table 1 illustrates the description of the imbalanceddatasets used in this empirical study. For each dataset,
7946 VOLUME 4, 2016
A. Amin et al.: Comparing Oversampling Techniques to Handle the CIP: A Customer Churn Prediction Case Study
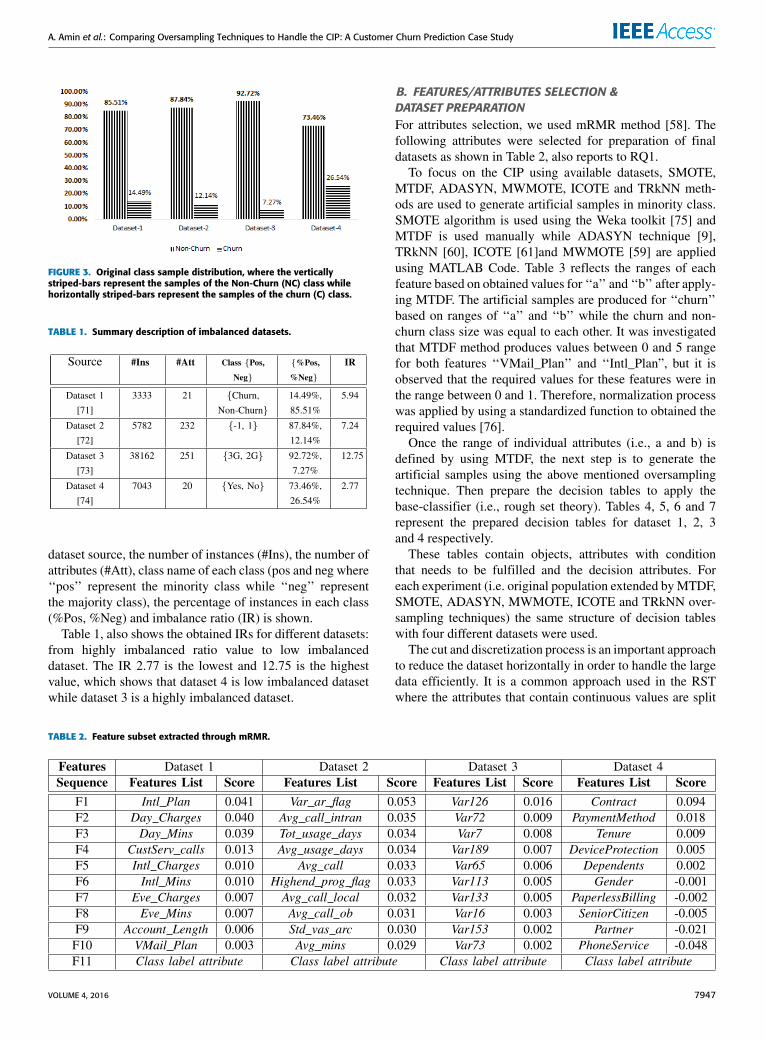
FIGURE 3. Original class sample distribution, where the verticallystriped-bars represent the samples of the Non-Churn (NC) class whilehorizontally striped-bars represent the samples of the churn (C) class.
TABLE 1. Summary description of imbalanced datasets.
dataset source, the number of instances (#Ins), the number ofattributes (#Att), class name of each class (pos and neg where‘‘pos’’ represent the minority class while ‘‘neg’’ representthe majority class), the percentage of instances in each class(%Pos, %Neg) and imbalance ratio (IR) is shown.
Table 1, also shows the obtained IRs for different datasets:from highly imbalanced ratio value to low imbalanceddataset. The IR 2.77 is the lowest and 12.75 is the highestvalue, which shows that dataset 4 is low imbalanced datasetwhile dataset 3 is a highly imbalanced dataset.
B. FEATURES/ATTRIBUTES SELECTION &DATASET PREPARATIONFor attributes selection, we used mRMR method [58]. Thefollowing attributes were selected for preparation of finaldatasets as shown in Table 2, also reports to RQ1.
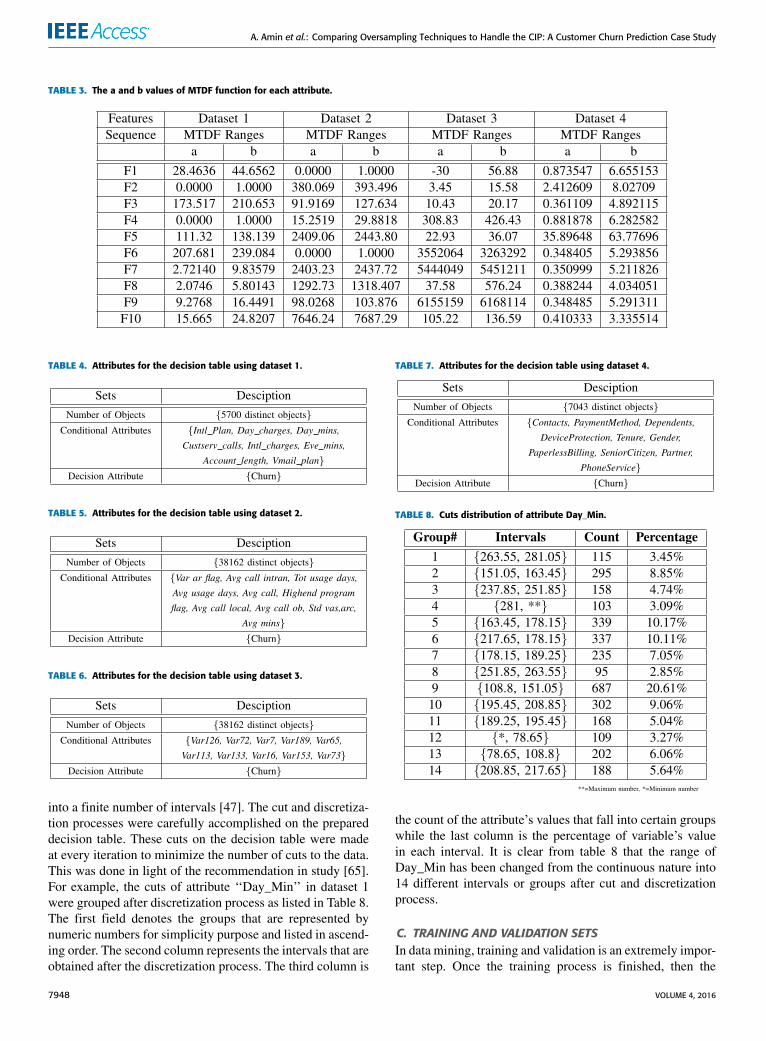
To focus on the CIP using available datasets, SMOTE,MTDF, ADASYN, MWMOTE, ICOTE and TRkNN meth-ods are used to generate artificial samples in minority class.SMOTE algorithm is used using the Weka toolkit [75] andMTDF is used manually while ADASYN technique [9],TRkNN [60], ICOTE [61]and MWMOTE [59] are appliedusing MATLAB Code. Table 3 reflects the ranges of eachfeature based on obtained values for ‘‘a’’ and ‘‘b’’ after apply-ing MTDF. The artificial samples are produced for ‘‘churn’’based on ranges of ‘‘a’’ and ‘‘b’’ while the churn and non-churn class size was equal to each other. It was investigatedthat MTDF method produces values between 0 and 5 rangefor both features ‘‘VMail_Plan’’ and ‘‘Intl_Plan”, but it isobserved that the required values for these features were inthe range between 0 and 1. Therefore, normalization processwas applied by using a standardized function to obtained therequired values [76].
Once the range of individual attributes (i.e., a and b) isdefined by using MTDF, the next step is to generate theartificial samples using the above mentioned oversamplingtechnique. Then prepare the decision tables to apply thebase-classifier (i.e., rough set theory). Tables 4, 5, 6 and 7represent the prepared decision tables for dataset 1, 2, 3and 4 respectively.
These tables contain objects, attributes with conditionthat needs to be fulfilled and the decision attributes. Foreach experiment (i.e. original population extended byMTDF,SMOTE, ADASYN, MWMOTE, ICOTE and TRkNN over-sampling techniques) the same structure of decision tableswith four different datasets were used.
The cut and discretization process is an important approachto reduce the dataset horizontally in order to handle the largedata efficiently. It is a common approach used in the RSTwhere the attributes that contain continuous values are split
TABLE 2. Feature subset extracted through mRMR.
VOLUME 4, 2016 7947
A. Amin et al.: Comparing Oversampling Techniques to Handle the CIP: A Customer Churn Prediction Case Study
TABLE 3. The a and b values of MTDF function for each attribute.
TABLE 4. Attributes for the decision table using dataset 1.
TABLE 5. Attributes for the decision table using dataset 2.
TABLE 6. Attributes for the decision table using dataset 3.
into a finite number of intervals [47]. The cut and discretiza-tion processes were carefully accomplished on the prepareddecision table. These cuts on the decision table were madeat every iteration to minimize the number of cuts to the data.This was done in light of the recommendation in study [65].For example, the cuts of attribute ‘‘Day_Min’’ in dataset 1were grouped after discretization process as listed in Table 8.The first field denotes the groups that are represented bynumeric numbers for simplicity purpose and listed in ascend-ing order. The second column represents the intervals that areobtained after the discretization process. The third column is
TABLE 7. Attributes for the decision table using dataset 4.
TABLE 8. Cuts distribution of attribute Day_Min.
the count of the attribute’s values that fall into certain groupswhile the last column is the percentage of variable’s valuein each interval. It is clear from table 8 that the range ofDay_Min has been changed from the continuous nature into14 different intervals or groups after cut and discretizationprocess.
C. TRAINING AND VALIDATION SETSIn data mining, training and validation is an extremely impor-tant step. Once the training process is finished, then the
7948 VOLUME 4, 2016

A. Amin et al.: Comparing Oversampling Techniques to Handle the CIP: A Customer Churn Prediction Case Study
validation step is to be performed to confirm the performanceof the predictive models on known and unknown objects [77].To perform the validation process, the following procedure isapplied: (i) some of the data is excluded from the trainingset that is used for the learning process of the classifier,(ii) when the training process is finished, and the classifieris to be considered as trained, the excluded samples can beincluded to validate the results of the trained classifier onunseen data samples. This procedure is known as the cross-validation process. The K-fold cross-validation is applied inthe proposed study to avoid bias during the validation ofmethods.
V. RESULTS AND DISCUSSIONIn this section, the four rules-generation algorithms usingRST on dataset 1, 2, 3, and 4 that were expanded usingMTDF,SMOTE, ADASYN, ICOTE,MWMOTE and TRkNN to han-dle the CIP were considered. Tables 9, 10, 11 and 12 reflectthe performance of classifiers through evaluation measures.The following tables 9, 10, 11 and 12 clearly shows the per-formance of various oversampling techniques (i.e., MTDF,SMOTE, ADASYN, MWMOTE, ICOTE and TRkNN) onpublically available telecommunication’s dataset by apply-ing classification process based on rough set theory andfour rules generation algorithms (i.e., Gen, Exh, Cov andLEM2). It can be observed (i.e., as given tables 9-12) that the
Cov and LEM2 rules generation algorithms have achievedmaximum performances as compared to Gen and Exh algo-rithms but these two (i.e. Cov & LEM2) have not been cov-ered all the instances available in the dataset. Therefore, allthe underlined values corresponding to targeted oversamplingtechniques are ignored from further analysis in this studywhile the bold values reflect the best performed techniquesin our empirical environment.
To report RQ2 and RQ3, the results reflect in Tables 9, 10,11, and 12 were thoroughly analyzed to cover each relevantdetail. It is observed that both algorithms (e.g., Cov & LEM2)shown higher accuracy, but do not deliver full coverage (e.g.,the underlined values does not seem to follow from fullcoverage). The coverage of a learning algorithm is the numberof samples or instances that can be learned by that algorithmfrom samples of a given size for given accuracy [78].
On the other hand, both algorithms (i.e. Exh and Gen)have covered all instances in given datasets (i.e. Dataset 1,2, 3 & 4). It can be observed in Figure 4 that both the Covand LEM2 algorithms achieved higher accuracy as comparedto Exh and Gen algorithms but these results seem not tofollow the full objects coverage. So these results (i.e. not fullycovering the dataset objects) were ignored and not shownin Figures 5 (a), (b), (c) and (d) for datasets 1, 2, 3 and 4respectively. Figure 5 describes the performance of oversam-pling algorithms (e.g., MTDF, SMOTE, ADASYN, ICOTE,
TABLE 9. Performance evaluation of classifier for dataset 1.
VOLUME 4, 2016 7949
A. Amin et al.: Comparing Oversampling Techniques to Handle the CIP: A Customer Churn Prediction Case Study
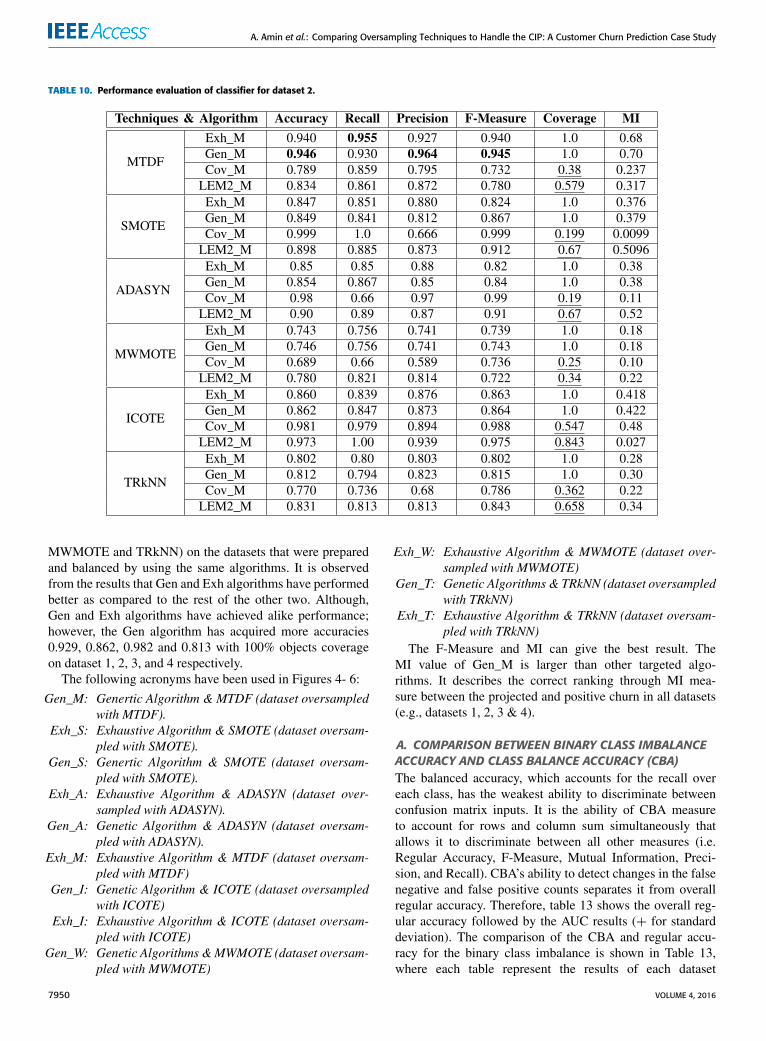
TABLE 10. Performance evaluation of classifier for dataset 2.
MWMOTE and TRkNN) on the datasets that were preparedand balanced by using the same algorithms. It is observedfrom the results that Gen and Exh algorithms have performedbetter as compared to the rest of the other two. Although,Gen and Exh algorithms have achieved alike performance;however, the Gen algorithm has acquired more accuracies0.929, 0.862, 0.982 and 0.813 with 100% objects coverageon dataset 1, 2, 3, and 4 respectively.
The following acronyms have been used in Figures 4- 6:
Gen_M: Genertic Algorithm & MTDF (dataset oversampledwith MTDF).
Exh_S: Exhaustive Algorithm & SMOTE (dataset oversam-pled with SMOTE).
Gen_S: Genertic Algorithm & SMOTE (dataset oversam-pled with SMOTE).
Exh_A: Exhaustive Algorithm & ADASYN (dataset over-sampled with ADASYN).
Gen_A: Genetic Algorithm & ADASYN (dataset oversam-pled with ADASYN).
Exh_M: Exhaustive Algorithm & MTDF (dataset oversam-pled with MTDF)
Gen_I: Genetic Algorithm & ICOTE (dataset oversampledwith ICOTE)
Exh_I: Exhaustive Algorithm & ICOTE (dataset oversam-pled with ICOTE)
Gen_W: Genetic Algorithms &MWMOTE (dataset oversam-pled with MWMOTE)
Exh_W: Exhaustive Algorithm & MWMOTE (dataset over-sampled with MWMOTE)
Gen_T: Genetic Algorithms & TRkNN (dataset oversampledwith TRkNN)
Exh_T: Exhaustive Algorithm & TRkNN (dataset oversam-pled with TRkNN)
The F-Measure and MI can give the best result. TheMI value of Gen_M is larger than other targeted algo-rithms. It describes the correct ranking through MI mea-sure between the projected and positive churn in all datasets(e.g., datasets 1, 2, 3 & 4).
A. COMPARISON BETWEEN BINARY CLASS IMBALANCEACCURACY AND CLASS BALANCE ACCURACY (CBA)The balanced accuracy, which accounts for the recall overeach class, has the weakest ability to discriminate betweenconfusion matrix inputs. It is the ability of CBA measureto account for rows and column sum simultaneously thatallows it to discriminate between all other measures (i.e.Regular Accuracy, F-Measure, Mutual Information, Preci-sion, and Recall). CBA’s ability to detect changes in the falsenegative and false positive counts separates it from overallregular accuracy. Therefore, table 13 shows the overall reg-ular accuracy followed by the AUC results (+ for standarddeviation). The comparison of the CBA and regular accu-racy for the binary class imbalance is shown in Table 13,where each table represent the results of each dataset
7950 VOLUME 4, 2016

A. Amin et al.: Comparing Oversampling Techniques to Handle the CIP: A Customer Churn Prediction Case Study
TABLE 11. Performance evaluation of classifier for dataset 3.
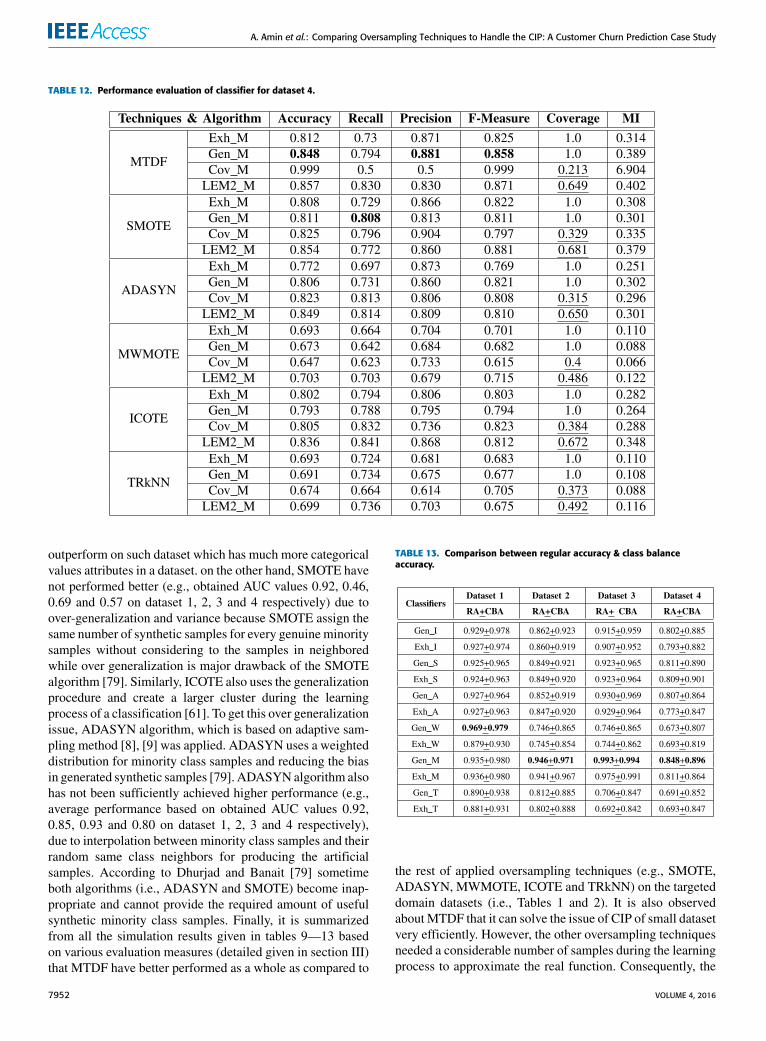
(i.e. datasets 1, 2, 3 & 4) respectively. The bold values ineach table represent the best-performing method. it can beobserved in the tables 13 that both Gen_M (genetic algorithmapplied on oversampled dataset using MTDF) and Exh_M(exhaustive algorithm applied on oversampled dataset usingMTDF) performed better as compared to the rest of the tech-niques. It is also investigated that out of these two techniques(i.e. Gen_M and Exh_M) the Gen_M have achieved overallmuch better results.
The AUC can be used as evaluation measure to evaluate theperformance of classifiers. It is observed that the best samplesdistribution for training set tends to be very balanced classsamples distribution [48]. The CIP significantly decreases theperformance of imbalanced datasets. It might be projectedthat the AUC decreases for the very imbalanced dataset.The results obtained for AUC from experiments are shownin figure 6. As stated earlier, these results were calculatedthrough 10-fold cross validation and AUCs were obtainedfrom the over-sampled dataset by applying target algorithms.However, here only two algorithms (i.e. the Genetic andExhaustive) have been shown because these two algorithmsprovided full coverage during classification of the validationset instances (e.g. shown in figure 4).
B. SIMULATION RESULTSTables 9, 10, 11, 12 and 13 summarize the results of SMOTE,ADASYN, MTDF, MWMOTE, ICOTE and TRkNN
algorithms on four publically available telecommunicationrelated datasets. Each result is the average of the 10 inde-pendent executions of classifiers and selected the best resultof each targeted algorithms for this study. In tables 9—12precision, recall also included as evaluation measures ofdifferent techniques but these evaluations are also used asinput for other evaluation measures (i.e., F-measure). Thebold-face values in the recall column of each techniquein all datasets (e.g., Tables 9—12) have misclassify manymajority class samples as minority. Hence, in spite of thehigher recall, these targeted techniques reduce the F-measureand AUC because the erroneous generation of the syntheticminority class samples falls inside the majority class region.The probability of wrongly classified minority class sam-ples thus providing improve precision and decrease recall.Unlike recall and precision, the overall simulation results arebased on F-measure, AUC and CBA. The AUC values areshown in figure 6 which illustrate a comparison of selectedalgorithms. It is observed that the performances of SMOTE,ADASYN and ICOTE algorithms are closed to each otherand these algorithms have achieved a performance higherthan TRkNN algorithm and lower than the performanceof MTDF. It is also investigated that the performance ofSMOTE, ADASYN and ICOTE have much better resultsthan MWMOTE where the dataset have less categoricalvalues attributes but low performance obtainedwhere the datahave too many categorical values in attributes as compareto MWMOTE. It is also investigated that MWMOTE can
VOLUME 4, 2016 7951
A. Amin et al.: Comparing Oversampling Techniques to Handle the CIP: A Customer Churn Prediction Case Study
TABLE 12. Performance evaluation of classifier for dataset 4.
outperform on such dataset which has much more categoricalvalues attributes in a dataset. on the other hand, SMOTE havenot performed better (e.g., obtained AUC values 0.92, 0.46,0.69 and 0.57 on dataset 1, 2, 3 and 4 respectively) due toover-generalization and variance because SMOTE assign thesame number of synthetic samples for every genuine minoritysamples without considering to the samples in neighboredwhile over generalization is major drawback of the SMOTEalgorithm [79]. Similarly, ICOTE also uses the generalizationprocedure and create a larger cluster during the learningprocess of a classification [61]. To get this over generalizationissue, ADASYN algorithm, which is based on adaptive sam-pling method [8], [9] was applied. ADASYN uses a weighteddistribution for minority class samples and reducing the biasin generated synthetic samples [79]. ADASYNalgorithm alsohas not been sufficiently achieved higher performance (e.g.,average performance based on obtained AUC values 0.92,0.85, 0.93 and 0.80 on dataset 1, 2, 3 and 4 respectively),due to interpolation between minority class samples and theirrandom same class neighbors for producing the artificialsamples. According to Dhurjad and Banait [79] sometimeboth algorithms (i.e., ADASYN and SMOTE) become inap-propriate and cannot provide the required amount of usefulsynthetic minority class samples. Finally, it is summarizedfrom all the simulation results given in tables 9—13 basedon various evaluation measures (detailed given in section III)that MTDF have better performed as a whole as compared to
TABLE 13. Comparison between regular accuracy & class balanceaccuracy.
the rest of applied oversampling techniques (e.g., SMOTE,ADASYN, MWMOTE, ICOTE and TRkNN) on the targeteddomain datasets (i.e., Tables 1 and 2). It is also observedaboutMTDF that it can solve the issue of CIP of small datasetvery efficiently. However, the other oversampling techniquesneeded a considerable number of samples during the learningprocess to approximate the real function. Consequently, the
7952 VOLUME 4, 2016

A. Amin et al.: Comparing Oversampling Techniques to Handle the CIP: A Customer Churn Prediction Case Study
FIGURE 4. Coverage of objects and Accuracy of techniques on all datasets(1-4), where (a), (b), (c) and (d) represents the accuracy and coverage ofselected algorithms on dataset 1,2, 3 and 4 respectively. List of algorithmsis given on x-axis while y-axis reflects the number of samples (instances).
existing number of samples of used datasets have createddifficulty when using small datasets for average performed(i.e., SMOTE, ADASYN and ICOTE) and worst performed(MWMOTE and TRkNN) algorithms in this study. In orderto completely cover the information gap in datasets (e.g.,Tables 1 and 2) and avoid the over estimation of samples,MTDF more appropriately substituted the required sampleswith the help of both data trend estimation and mega dif-fusion [80]. On the other hand, MTDF is based on normaldistribution which is a compulsory condition in the statisticaldata-analysis [11]. Therefore, MTDF is best techniques for
FIGURE 5. The positive predictive value (precision) and sensitivity (recall)followed by F-measure (the weighted harmonic mean of precision andrecall) evaluate the classifiers’ performance on dataset (1-4) where (a),(b), (c) and (d) reflects the preciseness and robustness the targetedalgorithms. F-measure reaches its worst value at 0 & best value at 1.
more systematically estimating the existing samples or datain the dataset.
C. STATISTICAL TESTIn order to compare different classifiers and algorithms, thisstudy supports our comparative assumptions through statisti-cal evidence. For this work, a non-parametric test was used toprovide statistical comparisons of some classifiers according
VOLUME 4, 2016 7953

A. Amin et al.: Comparing Oversampling Techniques to Handle the CIP: A Customer Churn Prediction Case Study
FIGURE 6. Comparison of selected algorithms based on AUC values.
to recommendation suggested by [4], [70], and [81]. Thereasons why this study uses a nonparametric statistical testas follows [81], [82]: (i) these tests can handle both nor-mally and non-normally distributed data while parametrictest, usually apply on normally distributed data only, (ii) non-parametric test are guaranteed the reliability of the parametrictest, and (iii) parametric tests are more closed to reject thenull-hypothesis than the non-parametric tests unless theirassumptions are violated. Therefore, Demsar [81] recom-mended using the non-parametric tests than using parametrictest. These tests may not be satisfied causing the statisti-cal analysis to lose its credibility. Furthermore, McNemar’stest [83] was applied to evaluate the classifiers’ performanceby comparing the results of best-performing algorithms (e.g.Gen_M, Gen_S, Gen_A, Gen_I, Gen_W and Gen_T).
Under the H0 (e.g., null hypothesis), different algorithmsshould have the same error rate, which means that classifierA = Classifier B. McNemar’s test is based on the chi statisticdistribution χ2 test for goodness-of-fit that compares the dis-tribution of the counts expected under the H0 to the observedvalues. it is sufficed that to reject the H0 in favor of thehypothesis that the multiple algorithms have different perfor-mance when trained on the targeted data set. McNemar’s Testvalue can be calculated using the following formula given inequation (22) [83], [84]:
M =(|n01 − n10|)2
n01 − n10> χ2
1,α (22)
The probability for the quantity of M is larger thanχ21,0.95 = 3.841459 is less than 0.05 for 95% confidence
test with 1 degree of freedom [84]. If the null hypothesis thatthe debate had no effect were true then Gen_M = Gen_S =Gen_A and so on, as chi statistic χ2 where the degree offreedom is 1. In case the H0 is correct, then the probabilitythat this quantity is greater than the χ2
1,0.95 = 3.841459 is lessthan 0.05 for 95% confidence test [84].McNemar’s Test valuecan be calculated using a formula (i.e. equation (22)). Wecan reject the H0, as these classifiers have the same error ratewhich may also consider in favor of the null hypothesis thatthese algorithms have different performance when trained onthe same datasets (e.g. dataset 1, 2, 3 and 4). Table 14 reflectsthe performance of classifiers.
TABLE 14. p-value (P), M values obtained from McNemar’s test.
‘‘M’’ values is greater than chi statistic χ2= 3.841459
reflecting to reject the null hypothesis with 95% confidenceand 1 degree of freedom while ‘‘P’’ values is lower than 0.05indicating that the performance difference between classifiersis statistically significant. The overall best average perfor-mance between the classifiers is shown in bold.
D. THREATS TO VALIDITY• Open source tools and public dataset: To investigatethe performance of the proposed solution, this studyhas used four publicly available datasets from differentsources related to the telecom sector. Also open sourcetools for evaluation and classification process were used;therefore, the results may not be generalizable to closed-source tools or proprietary data, which may lead tovariance in performance.
• Distribution of artificial samples: this study has alsoapplied the randomization of artificial samples to avoidthe biases in the distribution of samples populationover the decision classes through the adoption of thefollowing steps: (i) producing a unique number, usedas sequence for each class label using a rand-betweenstatistical function, then (ii) sorting function is used toarrange the generated values, (iii) finally, the normal-ization procedure using standardized statistical func-tion particularly on ‘‘VMail_Message and Intl_Plan”.Applying different function or method for normalizationmay not lead to consistent results.
• Evaluation methods: our work has used K-fold crossvalidation to avoid biases in the proposed work. Apply-ing other validation methods (e.g., hold-out validationmethod) might not provide the same results. Differentsplits may also yield different performances.
VI. CONCLUSION AND FUTURE WORKThis study has addressed the class imbalance problem (CIP)and has focused on comparing the performance of sixoversampling solutions for dealing with CIP—Mega-trendDiffusion Function (MTDF), Synthetic Minority Oversam-pling Technique (SMOTE), Adaptive Synthetic Sampling
7954 VOLUME 4, 2016
A. Amin et al.: Comparing Oversampling Techniques to Handle the CIP: A Customer Churn Prediction Case Study
approach (ADASYN), Majority Weighted Minority Over-sampling Technique (MWMOTE), immune centroids over-sampling technique (ICOTE) and Couples Top-N Reversek-Nearest Neighbor (TRkNN)—on four publicly availabledatasets for the telecommunications sector. We examined theperformance of these oversampling techniques with four (4)different rules-generation algorithms based on the Rough SetTheory (RST) classification approach—i.e., Learning fromExample Module, version 2 (LEM2), Covering, Exhaustiveand Genetic algorithms. The experiments performed showthat the Genetic algorithm using MTDF for oversamplingyielded the best performance in dealing with the CIP. Futurestudies might delineate more specific issues such as anextension to address themulti-class learning problems insteadof considering only two class problem, analyzing time com-plexity of targeted oversampling techniques (i.e. applied inproposed study). This will further help in investigating theperformances of the over-sampling techniques not only ontwo-class but also multi-class problems. Moreover, anothernatural extension of this study is to analyze the Receiveroperating characteristic (ROC) curves obtained from thetwo-class & multi-class classifiers. This might provide uswith a deeper understanding of the behavior of balancingand data preparation of large imbalanced datasets. Finally,it is also important to investigate the nature of the outliersbefore oversampling because none of the methods considerremoving outliers before oversampling.
ACKNOWLEDGMENTSThe authors are grateful to the anonymous reviewers for theirinsightful comments and suggestions, which helped improvethe quality of this paper.
REFERENCES[1] W. Verbeke, D. Martens, C. Mues, and B. Baesens, ‘‘Building compre-
hensible customer churn prediction models with advanced rule inductiontechniques,’’ Expert Syst. Appl., vol. 38, no. 3, pp. 2354–2364, 2011.
[2] J. Burez and D. Van den Poel, ‘‘Handling class imbalance in customerchurn prediction,’’ Expert Syst. Appl., vol. 36, no. 3, pp. 4626–4636, 2009.
[3] T. Jo and N. Japkowicz, ‘‘Class imbalances versus small disjuncts,’’ ACMSIGKDD Explorations Newslett., vol. 6, no. 1, pp. 40–49, 2004.
[4] M. Galar, A. Fernandez, E. Barrenechea, H. Bustince, and F. Herrera, ‘‘Areview on ensembles for the class imbalance problem: Bagging-, boosting-, and hybrid-based approaches,’’ IEEE Trans. Syst., Man, Cybern. C, Appl.Rev., vol. 42, no. 4, pp. 463–484, Jul. 2012.
[5] S. Maheshwari, J. Agrawal, and S. Sharma, ‘‘New approach for classifica-tion of highly imbalanced datasets using evolutionary algorithms,’’ Int. J.Sci. Eng. Res., vol. 2, no. 7, pp. 1–5, 2011.
[6] N. V. Chawla, K. W. Bowyer, L. O. Hall, andW. P. Kegelmeyer, ‘‘SMOTE:Synthetic minority over-sampling technique,’’ J. Artif. Intell. Res., vol. 16,no. 1, pp. 321–357, 2002.
[7] J. Wang, M. Xu, H. Wang, and J. Zhang, ‘‘Classification of imbalanceddata by using the smote algorithm and locally linear embedding,’’ in Proc.8th Int. Conf. Signal Process., vol. 3. 2006, pp. 1–4.
[8] C. S. Ertekin, ‘‘Adaptive oversampling for imbalanced data classification,’’inProc. 28th Int. Symp. Comput. Inf. Sci., vol. 264. Sep. 2013, pp. 261–269.
[9] H. He, Y. Bai, E. A. Garcia, and S. Li, ‘‘ADASYN: Adaptive syn-thetic sampling approach for imbalanced learning,’’ in Proc. IEEE Int.Joint Conf. Neural Netw., IEEE World Congr. Comput. Intell., Jun. 2008,pp. 1322–1328.
[10] D.-C. Li, C.-S.Wu, T.-I. Tsai, and Y.-S. Lina, ‘‘Usingmega-trend-diffusionand artificial samples in small data set learning for early flexible manufac-turing system scheduling knowledge,’’ Comput. Oper. Res., vol. 34, no. 4,pp. 966–982, 2007.
[11] C. C. Teck, L. Xiang, Z. Junhong, L. Xiaoli, C. Hong, and D. Woon,‘‘Hybrid rebalancing approach to handle imbalanced dataset for fault diag-nosis in manufacturing systems,’’ in Proc. 7th IEEE Conf. Ind. Electron.Appl. (ICIEA), Jul. 2012, pp. 1224–1229.
[12] J.-C. Deville and Y. Tillé, ‘‘Efficient balanced sampling: The cubemethod,’’ Biometrika, vol. 91, no. 4, pp. 893–912, 2004.
[13] N. Japkowicz, ‘‘The class imbalance problem: Significance and strate-gies,’’ in Proc. Int. Conf. Artif. Intell., 2000, pp. 1–7.
[14] A. Amin, F. Rahim, I. Ali, C. Khan, and S. Anwar, ‘‘A comparison oftwo oversampling techniques (smote vs mtdf) for handling class imbalanceproblem: A case study of customer churn prediction,’’ in Proc. 3rd WorldConf. Inf. Syst. Technol. (WorldCIST), Apr. 2015, pp. 215–225.
[15] W. Verbeke, K. Dejaeger, D. Martens, J. Hur, and B. Baesens, ‘‘Newinsights into churn prediction in the telecommunication sector: A profitdriven data mining approach,’’ Eur. J. Oper. Res., vol. 218, no. 1,pp. 211–229, 2012.
[16] D. Van den Poel and B. Lariviere, ‘‘Customer attrition analysis for financialservices using proportional hazard models,’’ Eur. J. Oper. Res., vol. 157,no. 1, pp. 196–217, 2004.
[17] R. O. Duda, P. E. Hart, and D. G. Stork, Pattern Classification. New York,NY, USA: Wiley, 2012.
[18] M. Karnstedt, M. Rowe, J. Chan, H. Alani, and C. Hayes, ‘‘The effect ofuser features on churn in social networks,’’ in Proc. 3rd Int. Web Sci. Conf.,2011, p. 23.
[19] X. Long et al., ‘‘Churn analysis of online social network users using datamining techniques,’’ in Proc. Int. Multi Conf. Eng. Comput. Sci., vol. 1.2012, pp. 551–556.
[20] W. Verbeke, D. Martens, and B. Baesens, ‘‘Social network analysis forcustomer churn prediction,’’ Appl. Soft Comput., vol. 14, pp. 431–446,Jan. 2014.
[21] P. D. Kusuma, D. Radosavljevik, F. W. Takes, and P. van der Putten,‘‘Combining customer attribute and social network mining for prepaidmobile churn prediction,’’ in Proc. 23rd Annu. Belgian Dutch Conf. Mach.Learn. (BENELEARN), 2013, pp. 50–58.
[22] J. Wang, C. Jiang, T. Q. S. Quek, X. Wang, and Y. Ren, ‘‘The valuestrength aided information diffusion in socially-aware mobile networks,’’IEEE Access, vol. 4, pp. 3907–3919, Aug. 2016.
[23] U. D. Prasad and S. Madhavi, ‘‘Prediction of churn behavior of bankcustomers using datamining tools,’’Bus. Intell. J., vol. 5, no. 1, pp. 96–101,2012.
[24] K. Chitra and B. Subashini, ‘‘Customer retention in banking sector usingpredictive data mining technique,’’ in Proc. 5th Int. Conf. Inf. Technol.,2011, pp. 1–4.
[25] J. Bloemer, K. de Ruyter, and P. Peeters, ‘‘Investigating drivers of bankloyalty: The complex relationship between image, service quality andsatisfaction,’’ Int. J. Bank Marketing, vol. 16, no. 7, pp. 276–286, 1998.
[26] M. A. H. Farquad, V. Ravi, and S. B. Raju, ‘‘Churn prediction usingcomprehensible support vector machine: An analytical CRM application,’’Appl. Soft Comput., vol. 19, pp. 31–40, Jun. 2014.
[27] C.-S. Lin, G.-H. Tzeng, and Y.-C. Chin, ‘‘Combined rough set theory andflow network graph to predict customer churn in credit card accounts,’’Expert Syst. Appl., vol. 38, no. 1, pp. 8–15, 2011.
[28] K. Lee, N. Chung, and K. Shin, ‘‘An artificial intelligence-based datamining approach to extracting strategies for reducing the churning rate incredit card industry,’’ J. Intell. Inf. Syst., vol. 8, no. 2, pp. 15–35, 2002.
[29] M. Suznjevic, I. Stupar, and M. Matijasevic, ‘‘MMORPG player behaviormodel based on player action categories,’’ in Proc. 10th Annu. WorkshopNetw. Syst. Support Games, 2011, Art. no. 6.
[30] J. Kawale, A. Pal, and J. Srivastava, ‘‘Churn prediction in MMORPGs:A social influence based approach,’’ in Proc. Int. Conf. Comput. Sci.Eng. (CSE), vol. 4. 2009, pp. 423–428.
[31] M. L. Kane-Sellers, ‘‘Predictive models of employee voluntary turnoverin a north American professional sales force using data-mining analy-sis,’’ Ph.D. dissertation, Texas A&M Univ., College Station, TX, USA,Aug. 2007.
[32] V. V. Saradhi and G. K. Palshikar, ‘‘Employee churn prediction,’’ ExpertSyst. Appl., vol. 38, no. 3, pp. 1999–2006, 2011.
[33] M. Saron and Z. A. Othman, ‘‘Academic talent model based on humanresource data mart,’’ Int. J. Res. Comput. Sci., vol. 2, no. 5, p. 29, 2012.
[34] G. Dror, D. Pelleg, O. Rokhlenko, and I. Szpektor, ‘‘Churn prediction innew users of Yahoo! Answers,’’ in Proc. 21st Int. Conf. World Wide Web,2012, pp. 829–834.
VOLUME 4, 2016 7955

A. Amin et al.: Comparing Oversampling Techniques to Handle the CIP: A Customer Churn Prediction Case Study
[35] M. Jaudet, N. Iqbal, and A. Hussain, ‘‘Neural networks for fault-predictionin a telecommunications network,’’ in Proc. 8th Int. IEEE MultitopicConf. (INMIC), Dec. 2014, pp. 315–320.
[36] A. Hawalah and M. Fasli, ‘‘Dynamic user profiles for Web personalisa-tion,’’ Expert Syst. Appl., vol. 42, no. 5, pp. 2547–2569, 2015.
[37] N. Ahad, J. Qadir, and N. Ahsan, ‘‘Neural networks in wireless networks:Techniques, applications and guidelines,’’ J. Netw. Comput. Appl., vol. 68,pp. 1–27, Jun. 2016.
[38] C. Fang, J. Liu, and Z. Lei, ‘‘Fine-grained HTTP Web traffic analysisbased on large-scale mobile datasets,’’ IEEE Access, vol. 4, pp. 4364–4373,Aug. 2016.
[39] T. S. Rappaport et al., ‘‘Millimeter wave mobile communications for 5Gcellular: It will work!’’ IEEE Access, vol. 1, pp. 335–349, May 2013.
[40] R. A. Soeini and K. V. Rodpysh, ‘‘Applying data mining to insurance cus-tomer churn management,’’ Int. Proc. Comput. Sci. Inf. Technol., vol. 30,pp. 82–92, Feb. 2012.
[41] K. Coussement and D. Van den Poel, ‘‘Churn prediction in subscriptionservices: An application of support vector machines while comparingtwo parameter-selection techniques,’’ Expert Syst. Appl., vol. 34, no. 1,pp. 313–327, 2008.
[42] J. Burez and D. Van den Poel, ‘‘CRM at a pay-TV company: Usinganalytical models to reduce customer attrition by targeted marketing forsubscription services,’’ Expert Syst. Appl., vol. 32, no. 2, pp. 277–288,2007.
[43] N. Chawla, N. Japkowicz, and A. Kolcz, ‘‘Special issue on learningfrom imbalanced datasets,’’ ACM SIGKDD Explorations, vol. 6, no. 1,pp. 1–6, 2004.
[44] S. Visa and A. Ralescu, ‘‘Issues in mining imbalanced data sets—A reviewpaper,’’ in Proc. 16th Midwest Artif. Intell. Cognit. Sci. Conf., 2005,pp. 67–73.
[45] N. V. Chawla, ‘‘Data mining for imbalanced datasets: An overview,’’in Data Mining and Knowledge Discovery Handbook. Springer, 2005,pp. 853–867.
[46] G. M.Weiss, ‘‘Mining with rarity: A unifying framework,’’ ACM SIGKDDExplorations Newslett., vol. 6, no. 1, pp. 7–19, 2004.
[47] F. He, X. Wang, and B. Liu, ‘‘Attack detection by rough set theory in rec-ommendation system,’’ in Proc. IEEE Int. Conf. Granular Comput. (GrC),2010, pp. 692–695.
[48] G. E. Batista, R. C. Prati, and M. C. Monard, ‘‘A study of the behaviorof several methods for balancing machine learning training data,’’ ACMSIGKDD Explorations Newslett., vol. 6, no. 1, pp. 20–29, 2004.
[49] N.V. Chawla, A. Lazarevic, L. O.Hall, andK.W.Bowyer, ‘‘SMOTEBoost:Improving prediction of the minority class in boosting,’’ in Proc. Eur. Conf.Principles Data Mining Knowl. Discovery, 2003, pp. 107–119.
[50] B. Liu, Y. Ma, and C. K. Wong, ‘‘Improving an association rule basedclassifier,’’ in Proc. Eur. Conf. Principles Data Mining Knowl. Discovery,2000, pp. 504–509.
[51] K. P. Satyasree and J. Murthy, ‘‘An exhaustive literature review on classimbalance problem,’’ Int. J. Emerg. Trends Technol. Comput. Sci., vol. 2,pp. 109–118, May 2013.
[52] M. Kubat and S. Matwin, ‘‘Addressing the curse of imbalanced trainingsets: One-sided selection,’’ in Proc. 4th Int. Conf. Mach. Learn., vol. 97.Nashville, TN, USA, Jul. 1997, pp. 179–186.
[53] C. X. Ling and C. Li, ‘‘Data mining for direct marketing: Problems andsolutions,’’ in Proc. KDD, 1998, pp. 73–79.
[54] Y. Tang, S. Krasser, D. Alperovitch, and P. Judge, ‘‘Spam sender detectionwith classification modeling on highly imbalanced mail server behaviordata,’’ in Proc. Artif. Intell. Pattern Recognit., 2008, pp. 174–180.
[55] G. Wu and E. Y. Chang, ‘‘KBA: Kernel boundary alignment consideringimbalanced data distribution,’’ IEEE Trans. Knowl. Data Eng., vol. 17,no. 6, pp. 786–796, Jun. 2006.
[56] P. Foster, ‘‘Machine learning from imbalanced data sets 101,’’ in Proc.AAAI Workshop Imbalanced Data Sets, 2000, pp. 1–3.
[57] H. Guo and H. L. Viktor, ‘‘Learning from imbalanced data sets with boost-ing and data generation: The DataBoost-IM approach,’’ ACM SIGKDDExplorations Newslett., vol. 6, no. 1, pp. 30–39, 2004.
[58] H. Peng, F. Long, and C. Ding, ‘‘Feature selection based on mutual infor-mation criteria of max-dependency, max-relevance, and min-redundancy,’’IEEE Trans. Pattern Anal. Mach. Intell., vol. 27, no. 8, pp. 1226–1238,Aug. 2005.
[59] S. Barua, M. M. Islam, X. Yao, and K. Murase, ‘‘MWMOTE—Majorityweighted minority oversampling technique for imbalanced data set learn-ing,’’ IEEE Trans. Knowl. Data Eng., vol. 26, no. 2, pp. 405–425,Feb. 2014.
[60] M.-F. Tsai and S.-S. Yu, ‘‘Distance metric based oversampling method forbioinformatics and performance evaluation,’’ J. Med. Syst., vol. 40, no. 7,pp. 1–9, 2016.
[61] X. Ai, J. Wu, V. S. Sheng, P. Zhao, Y. Yao, and Z. Cui, ‘‘Immune centroidsover-sampling method for multi-class classification,’’ in Proc. Pacific-AsiaConf. Knowl. Discovery Data Mining, 2015, pp. 251–263.
[62] Z. Pawlak, ‘‘Rough sets,’’ Int. J. Comput. Inf. Sci., vol. 11, no. 5,pp. 341–356, Oct. 1982.
[63] Z. Pawlak and A. Skowron, ‘‘Rough sets and conflict analysis,’’ inE-Service Intelligence (Studies in Computational Intelligence), vol. 37.Springer, 2007, pp. 35–74.
[64] J. G. Bazan, H. S. Nguyen, S. H. Nguyen, P. Synak, and J. Wróblewski,‘‘Rough set algorithms in classification problem,’’ in Rough Set Methodsand Applications (Studies in Fuzziness and Soft Computing), vol. 56.Springer, 2000, pp. 49–88.
[65] J. G. Bazan and M. Szczuka, ‘‘The rough set exploration system,’’ inTransactions on Rough Sets III (Lecture Notes in Computer Science),vol. 3400. Springer, 2005, pp. 37–56.
[66] H. Nguyen and S. Nguyen, ‘‘Analysis of STULONG data by rough setexploration system (RSES),’’ in Proc. ECML/PKDD Workshop, 2003,pp. 71–82.
[67] J. Wróblewski, ‘‘Genetic algorithms in decomposition and classificationproblems,’’ in Rough Sets in Knowledge Discovery 2 (Studies in Fuzzinessand Soft Computing), vol. 19. Springer, 1997, pp. 471–487.
[68] J. W. Grzymala-Busse, ‘‘A new version of the rule induction systemLERS,’’ Fundam. Inform., vol. 31, no. 1, pp. 27–39, 1997.
[69] J. W. Grzymala-Busse, ‘‘LERS—A system for learning from examplesbased on rough sets,’’ in Intelligent Decision Support (Theory andDecisionLibrary), vol. 11. Springer, 1992, pp. 3–18.
[70] V. López, A. Fernández, S. García, V. Palade, and F. Herrera, ‘‘Aninsight into classification with imbalanced data: Empirical results andcurrent trends on using data intrinsic characteristics,’’ Inf. Sci., vol. 250,pp. 113–141, Nov. 2013.
[71] (Aug. 2015). Data Source, accessed on Aug. 1, 2015. [Online]. Available:http://www.sgi.com/tech/mlc/db/
[72] (Oct. 2015). Data Source, accessed on Oct. 15, 2015. [Online]. Available:http://lamda.nju.edu.cn/yuy/dm07/assign2.htm
[73] (Oct. 2015). KDD’06 Challenge Dataset, accessed on Oct. 15, 2015.[Online]. Available: http://www3.ntu.edu.sg/sce/pakdd2006/
[74] (Jan. 2016). IBM Telecom Dataset, accessed on Jan. 1, 2016. [Online].Available: https://www.ibm.com/analytics/watson-analytics/community/predictive-insights-in-the-telco-customer-churn-data-set/
[75] G. Holmes, A. Donkin, and I. H. Witten, ‘‘WEKA: A machine learningworkbench,’’ in Proc. 2nd Austral. New Zealand Conf. Intell. Inf. Syst.,Nov./Dec. 1994, pp. 357–361.
[76] Microsoft. (2014). Standardize Function, accessed on Nov. 9, 2014.[Online]. Available: http://office.microsoft.com/en-001/excel-help/standardize-function-HP010342919.aspx
[77] R. Bellazzi and B. Zupan, ‘‘Predictive data mining in clinical medicine:Current issues and guidelines,’’ Int. J. Med. Informat., vol. 77, no. 2,pp. 81–97, 2008.
[78] H. S. Almuallim, ‘‘Concept coverage and its application to two learn-ing tasks,’’ Ph.D. dissertation, Oregon State Univ., Corvallis, OR, USA,Apr. 1992, pp. 10–30.
[79] M. R. K. Dhurjad andM. S. Banait, ‘‘A survey on oversampling techniquesfor imbalanced learning,’’ Int. J. Appl. Innov. Eng. Manage., vol. 3, no. 1,pp. 279–284, 2014.
[80] N. H. Ruparel, N. M. Shahane, and D. P. Bhamare, ‘‘Learning from smalldata set to build classification model: A survey,’’ in Proc. IJCA Int. Conf.Recent Trends Eng. Technol. (ICRTET), May 2013, pp. 23–26.
[81] J. Demšar, ‘‘Statistical comparisons of classifiers over multiple data sets,’’J. Mach. Learn. Res., vol. 7, pp. 1–30, Jan. 2006.
[82] Minitab. (2015). Choosing Between a Nonparametric Test and aParametric Test, accessed on Dec. 19, 2015. [Online]. Available:http://blog.minitab.com/blog/adventures-in-statistics/choosing-between-a-nonparametric-test-and-a-parametric-test
[83] B. S. Everitt, The Analysis of Contingency Tables. Boca Raton, FL, USA:CRC Press, 1992.
[84] T. G. Dietterich, ‘‘Approximate statistical tests for comparing super-vised classification learning algorithms,’’ Neural Comput., vol. 10, no. 7,pp. 1895–1923, 1998.
[85] K. Dashtipour et al., ‘‘Multilingual sentiment analysis: State of the art andindependent comparison of techniques,’’ Cognit. Comput., vol. 8, no. 4,pp. 757–771, 2016.
7956 VOLUME 4, 2016
A. Amin et al.: Comparing Oversampling Techniques to Handle the CIP: A Customer Churn Prediction Case Study
[86] Z. Tang, J. Lu, and P. Wang, ‘‘A unified biologically-inspired predictionframework for classification of movement-related potentials based on alogistic regression model,’’ Cognit. Computat., vol. 7, no. 6, pp. 731–739,2015.
ADNAN AMIN received theM.Sc. degree in com-puter science from the University of Peshawar,and the M.S. degree (with distinction) in computerscience with major databases from the Instituteof Management Sciences, Peshawar, Pakistan, in2008 and 2015, respectively. He is currently aPh.D. Scholar and a Lecturer with the Departmentof Computer Science, Institute of ManagementSciences, Peshawar. His research interests includedata mining, databases, big data, and machine
learning.
SAJID ANWAR received the B.Sc. and M.Sc.degrees in computer science from the Universityof Peshawar in 1997 and 1999, respectively, andthe M.S. degree in computer science and the Ph.D.degree in software architecture from theUniversityof NUCES-FAST, Pakistan, in 2007 and 2011,respectively. He is currently an Assistant Pro-fessor of Computing Science, and a Coordinatorof the B.S.-Software Engineering with the Insti-tute of Management Sciences, Peshawar, Pakistan.
His research interests are concerned with software architecture, softwarerequirement engineering, searched-based software engineering, and miningsoftware repository.
AWAIS ADNAN received the Ph.D. degree fromIMSciences, Peshawar, Pakistan, and the M.S.degree from NUST, Islamabad, Pakistan. He iscurrently an Assistant Professor and a Coordina-tor of Master Program with the Department ofComptuer Science, Institute of Management Sci-ences, Peshawar, where he is also a Manager ofORIC. His major areas of interest are multimediaand machine learning.
MUHAMMAD NAWAZ received the M.Sc.degree in computer science and the M.S. degreein information technology from the Universityof Peshawar, Pakistan. He was a Lecturer withthe University of Peshawar, and also a Com-puter ProgrammerwithKhyber TeachingHospital,Peshawar. He is currently an Assistant Professorin multimedia with the Institute of ManagementSciences, Peshawar, he is also the Head of Ph.D.and M.S.-computer sciences with IMSciences,
Peshawar.
NEWTON HOWARD is currently an AssociateProfessor of Computational Neuroscience andFunctional Neurosurgery with the University ofOxford, where he manages the newly formedComputational Neuroscience Laboratory. He isalso the Director of the Synthetic Intelligence Lab-oratory, MIT, where he served as the Founder andthe Director of the MIT Mind Machine Projectfrom 2008 to 2012. He is also the Chairman ofthe Brain Sciences Foundation. He is an active
member of several research laboratories worldwide, including the DescartesInstitute, the Brain Physics Group, and INSERM, Paris.
JUNAID QADIR (SM’14) received the Ph.D.degree from the University of New South Wales,Australia, in 2008, and the bachelor’s degreein electrical engineering from UET, Lahore,Pakistan, in 2000. He was an Assistant Profes-sor with the School of Electrical Engineering andComputer Sciences, National University of Sci-ences and Technology from 2008 to 2015. In 2015,he joined as an Associate Professor with the Infor-mation Technology University-Punjab, Lahore.
He has 7+ years of teaching experience in which he has taught a wideportfolio of courses in systems and networking, signal processing, andwireless communications and networking. His primary research interestsare in the areas of computer systems and networking and using ICT fordevelopment. He has served in the program committee of a number ofinternational conferences and reviews regularly for various high-qualityjournals. He is a member of ACM. He is the award-winning teacher whohas been awarded the highest National Teaching Award in Pakistan andthe higher education commission’s (HEC) Best University Teacher Award,in 2012 and 2013, respectively. He has been nominated for the HEC BestUniversity Teacher Award twice from NUST in 2011, and 2012–2013. He isan Associate Editor for the IEEE Access, the Central’s Big Data Analyticsjournal (Springer/BioMed), and the IEEE Communications Magazine.
AHMAD HAWALAH is currently the Vice Deanand the Head of IS Department with the Collegeof the Computer Science and Engineering, TaibahUniversity, Medina, Saudi Arabia. He received theM.Sc degree from Sussex University, Brighton,UK, and the Ph.D. degree in information retrievaland data mining from Essex University, Colch-ester, UK, in 2012. He is currently the Vice Deanand the Head of IS Department with the Collegeof the Computer Science and Engineering, Taibah
University, Medina, Saudi Arabia. His research interests include data min-ing, artificial intelligence, and information sciences. His research interestsinclude data mining, artificial intelligence, and information sciences.
AMIR HUSSAIN received the B.Eng. degree(Hons.) and the Ph.D. degree in novel neuralnetwork architectures and algorithms from theUniversity of Strathclyde, Glasgow, U.K., in 1992and 1997, respectively. He is currently a Pro-fessor of Computing Science and the FoundingDirector of the Cognitive Big Data Informatics(CogBID)Research Laboratory, University of Stir-ling, U.K. He has conducted and led collaborativeresearch with industry; partnered in major Euro-
pean research programs, and supervised over 30 Ph.D. students. He hasauthored over 300 papers, including over a dozen books and 100+ journalpapers. He is the founding Editor-in-Chief of the journals: Cognitive Com-putation (Springer Nature), and Big Data Analytics (BioMed Central), andChief-Editor of the Springer Book Series on Socio-Affective Computing,and Springer Briefs on Cognitive Computation. He is Associate Editor ofthe IEEE Transactions on Neural Networks and Learning Systems, the IEEETransactions on Systems, Man, and Cybernetics: Systems, and the IEEEComputational Intelligence Magazine. He is a Senior Fellow of the BrainScience Foundation (USA), SeniorMember of the IEEE, amember of severalTechnical Committees of the IEEE Computational Intelligence Society, andChapter Chair of the IEEE U.K. & RI Industry Applications Society.
VOLUME 4, 2016 7957