Comparing N-Node Set Importance Representative results ...
15
International Journal of Computer Engineering Science (IJCES) Volume 2 Issue 8 (August 2012) ISSN : 2250:3439 https://sites.google.com/site/ijcesjournal http://www.ijces.com/ 1 Comparing N-Node Set Importance Representative results with Node Importance Representative results for Categorical Clustering: An exploratory study H.Venkateswara Reddy 1 , Dr.S.Viswanadha Raju 2 , B.Ramasubba Reddy 3 , 1 Depatment of CSE, Vardhaman College of Engineering, Hyderabad, India [email protected] 2 Depatment of CSE, JNTUH College of Engineering, Karim Nagar, India [email protected] 3 Depatment of CSE, Ramappa College of Engineering, Warangal, India b. [email protected] Abstract. The proportionate increase in the size of the data with increase in space implies that clustering a very large data set becomes difficult and is a time consuming process. Sampling is one important technique to scale down the size of dataset and to improve the efficiency of clustering. After sampling, allocating unlabeled objects into proper clusters is impossible in the categorical domain. To address the problem, Chen employed a method called MARDL to allocate each unlabeled data point to the appropriate cluster based on NIR and NNIR algorithms. This paper took off from Chen’s investigation and analyzed and compared the results of NIR and NNIR, leading to the conclusion that the two processes contradict each other when it comes to finding the resemblance between an unlabeled data point and a cluster. A new and better way of solving the problem was arrived at that finds resemblance between unlabeled data point within all clusters, while also providing maximal resemblance for allocation of data in the required cluster.
Transcript of Comparing N-Node Set Importance Representative results ...

International Journal of Computer Engineering Science (IJCES)
Volume 2 Issue 8 (August 2012) ISSN : 2250:3439
https://sites.google.com/site/ijcesjournal http://www.ijces.com/
1
Comparing N-Node Set Importance
Representative results with Node Importance
Representative results for Categorical Clustering:
An exploratory study
H.Venkateswara Reddy1, Dr.S.Viswanadha Raju2, B.Ramasubba Reddy3,
1 Depatment of CSE, Vardhaman College of Engineering, Hyderabad, India [email protected]
2 Depatment of CSE, JNTUH College of Engineering, Karim Nagar, India [email protected]
3 Depatment of CSE, Ramappa College of Engineering, Warangal, India b. [email protected]
Abstract. The proportionate increase in the size of the data with
increase in space implies that clustering a very large data set becomes
difficult and is a time consuming process. Sampling is one important
technique to scale down the size of dataset and to improve the
efficiency of clustering. After sampling, allocating unlabeled objects
into proper clusters is impossible in the categorical domain. To address
the problem, Chen employed a method called MARDL to allocate each
unlabeled data point to the appropriate cluster based on NIR and NNIR
algorithms. This paper took off from Chen’s investigation and analyzed
and compared the results of NIR and NNIR, leading to the conclusion
that the two processes contradict each other when it comes to finding
the resemblance between an unlabeled data point and a cluster. A new
and better way of solving the problem was arrived at that finds
resemblance between unlabeled data point within all clusters, while also
providing maximal resemblance for allocation of data in the required
cluster.

International Journal of Computer Engineering Science (IJCES)
Volume 2 Issue 8 (August 2012) ISSN : 2250:3439
https://sites.google.com/site/ijcesjournal http://www.ijces.com/
2
Keywords: Categorical Clustering, Data lebeling, Independent
nodesets, Node Importance Representative, Resemblance.
1 Introduction
Clustering is an important technique in data mining to partition a dataset into
several groups so that data points within the same group are very similar to each other
than to data points in other groups, according to some predefined similarity
measurements [1]-[5]. The similar groups are labeled clusters. Clustering finds
application in manufacturing, medicine, machine learning, information retrieval and
research and development planning [6, 7]. Clustering very large datasets is difficult
and time consuming [8]-[11]. Sampling is therefore employed to scale down the size
of the database to improve the efficiency of clustering [12]-[15]. In sampling, the
clustering chosen is a randomly small set of data points (from the given data set)
which are used in a clustering algorithm on the sampled data set, which is generally
small. The clustering result thus obtained from the sampled data set is expected to be
similar to the clustering result of original data set. This makes for an efficient
sampling method. However, within the sampling taken, those data points that are not
sampled will not have their labels and these data points go by the name of unlabeled
or unclustered data points. The problem confronting the investigator is - how does one
allocate the unlabeled data point into appropriate clusters [13, 16, 17]. Without loss of
generality, the goal of clustering is to allocate every data point into an appropriate
cluster. Therefore an efficient algorithm is necessary to allocate the unclustered data
points into proper clusters [18]-[20].
In numerical domain [4, 8, 9, 10], the distance between the unclustered data
point and the centroid of the cluster give the similarity between them. Each
unclustered data point can be assigned to a cluster with the minimal distance. In
reality, categorical attributes also prevalently exist in real data. Therefore, allocating

International Journal of Computer Engineering Science (IJCES)
Volume 2 Issue 8 (August 2012) ISSN : 2250:3439
https://sites.google.com/site/ijcesjournal http://www.ijces.com/
3
unlabeled data point to appropriate clusters remains a challenging issue in the
categorical domain considering that the centroid of cluster is difficult to define.
S.Chen proposed Maximal Resemblance Data Labeling (MARDL)
mechanism [16] to partially remedy the difficulty. MARDL has two phases: a. cluster
analysis phase and b. data labeling phase. In cluster analysis phase, a cluster
representative is generated to characterize the clustering result. Chen attached
significance to Node Importance Representatives as a categorical cluster
representative, emphasizing the importance of attribute values in that cluster [16, 21,
22]. In data labeling phase, an appropriate cluster label was given to unclustered data
point according to maximal resemblance, which generates points of similarity based
on Node Importance Representative (NIR) and N-Node Importance Representative
(NNIR) values. This facilitates allocation to each categorical unclustered data point to
the appropriate cluster called data labeling. This paper sets out to investigate and draw
comparisons between resemblance values obtained using both NIR and NNIR.
The paper is organized as follows. Section 2 supplies the relevant background
to the study; section 3 deals with basic definitions and cluster representatives, such as
N-Node Importance Representative and Node Importance Representatives while
section 4 is devoted to cluster analysis, data labeling methods in use for investigation
and comparison of NIR and NNIR methods, while the final section – section 5 ,
concludes the study with recommendations.
2 Review of Related Literature
This section provides an exhaustive discussion of various clustering
algorithms on categorical data along with cluster representatives and data labeling
[23-25]. Cluster representative is used to summarize and characterize the clustering
result, which is not discussed in a detailed fashion in categorical domain unlike
numerical domain. In K-modes algorithm [4], the most frequent attribute value in
each attribute domain of a cluster represents what is known as a mode for that
cluster. Finding modes may be simple, but only use one attribute value in each

International Journal of Computer Engineering Science (IJCES)
Volume 2 Issue 8 (August 2012) ISSN : 2250:3439
https://sites.google.com/site/ijcesjournal http://www.ijces.com/
4
attribute domain to represent a cluster is questionable. It composed of the attribute
values with high co-occurrence.
ROCK clustering algorithm [26] is a form of agglomerative hierarchical
clustering algorithm. This algorithm is based on links between data points, instead of
distances between data points. The notion of links between data helps overcome the
problems with distance based coefficients. The link between point i (pi) and point j
(pj), denoted as link(pi,pj), and is defined as the number of common neighbours
between pi and pj. ROCK's hierarchical clustering algorithm accepts as input the set S
of n sampled points as the representatives of those clusters, drawn randomly from the
original data set to be clustered, and the number of desired clusters k. The procedure
begins by computing the number of links between pairs of points. The number of
links is then used in algorithm to cluster the data set. The first step in implementing
the algorithm is to create a Boolean matrix with entries 1 and 0 based on adjacency
matrix. The entry is 1 if the two corresponding points are adjacent neighbours or 0 if
otherwise. As this algorithm simply focuses on the adjacents of every data point,
some data points may be left out or ignored; hence an algorithm based on entropy of
the data points is assumed.
In the statistical categorical clustering algorithms [27] such as COOLCAT
[21] and LIMBO [28], data points are grouped based on the statistics. In algorithm
COOLCAT, data points are separated in such a way that the expected entropy of the
whole arrangements is minimized. In algorithm LIMBO, the information bottleneck
method is applied to minimize the information lost which resulted from summarizing
data points into clusters. However, these algorithms perform clustering based on
minimizing or maximizing the statistical objective function, and the clustering
representatives in these algorithms are not clearly defined. Therefore, the
summarization and characteristic information of the clustering results cannot be
obtained using these algorithms [29]. A different approach is called for, which is the
aim of the paper.

International Journal of Computer Engineering Science (IJCES)
Volume 2 Issue 8 (August 2012) ISSN : 2250:3439
https://sites.google.com/site/ijcesjournal http://www.ijces.com/
5
3 N-Node Importance Representative
3.1 Notations
Assume that C is a clustering result which consists of C={ c1, c2, … ck}
where ci, ( i= 1,2, ….k) is the ith
cluster. There are mi data points in cluster ci, whose
class label is*
iC . i.e., ( ,1) ( ,2) ( , ){ , ,.... }ii i i i mc p p p , where each data point is a vector
of q attribute values, i.e., 1 2
( , ) ( , ) ( , ) ( , ){ , ,... }q
i j i j i j i jp p p p . Let A={A1, A2, … Aq},
where Aa is the ath
categorical attribute, 1≤a≤q. The unlabeled data set
( ,1) ( ,2) ( , ){ , ,.... }iU U U mU p p p is also given, where p(U ,j) is the j
th data point in data
set U. Without loss of generality, the attribute set of U is A. The aim of MARDL is
―to decide the most appropriate cluster label ci* for each data point of U”.
We have taken an example of Fig. 1. Here there are three attributes A1, A2 and
A3 and three clusters c1, c2 and c3 and unlabeled data set U. The task is to label all the
data points of set U of most appropriate cluster. Before assigning values and beginning
data labeling, we define the following terms.
Node: A Node Ir is defined as attribute name + attribute value.
Basically a node is an attribute value, and two or more attribute values of
different attributes may be identical, where those attribute domains intersection is
non-empty, which is possible in real life. To avoid this ambiguity, we define node not
only with attribute value and also with attribute name. For example,
Nodes[height=60-69] and [weight=60-69] are different nodes even though the
attribute values of attributes height and weight are same i.e.60-69. Because the
attribute names height and weight are different then the nodes are different.
n-nodeset: An n-nodeset, Irn, is defined as a set of n-nodes in which every
node is a member of the distinct attribute Aa.
A nodeset is simply a collection of nodes. If there are n nodes in that
collection then that nodeset is n-nodeset. A 1- nodeset contains only one node. For

International Journal of Computer Engineering Science (IJCES)
Volume 2 Issue 8 (August 2012) ISSN : 2250:3439
https://sites.google.com/site/ijcesjournal http://www.ijces.com/
6
example {[A1=a]} is a one nodeset. Similarly {[A2=b], [A3=c]} is an example for a 2-
nodeset. However, {[A1=a], [A1=b]} is not a 2-nodeset because both attribute values
{a} and {b}, are values of same attribute A1.
Independent nodesets: Two nodesets Irn1
and Irn2
in a represented cluster are
said to independent if they do not form larger nodesets and do not contain nodes from
the same attributes.
The above definition indicates that two node-sets Irn1
and Irn2
together 1 2( . ., )n n
r ri e I I do not come in the cluster representative and nodes in Irn1
and Irn2
do not come from the same attribute. If the two node-sets are independent,
then the probability of their intersection in the cluster can be estimated by multiplying
the probabilities of the two node-sets in question.
3.2 Node Importance Representative
NIR is used to represent a cluster as the distribution of the attribute values. A
node Ir, is defined as attribute name plus attribute value. NIR considers both the
intracluster and intercluster similarity. The importance of the node in a cluster is
measured making use of the two concepts that figure below:

International Journal of Computer Engineering Science (IJCES)
Volume 2 Issue 8 (August 2012) ISSN : 2250:3439
https://sites.google.com/site/ijcesjournal http://www.ijces.com/
7
(i) The node is important in the cluster when the frequency of the node is
high in this cluster.
(ii) The node is important in the cluster if the node appears predominantly in
this cluster rather than in other clusters.
The idea of NNIR is to represent a cluster as the distribution of the n-
nodesets, which are already defined in this section. NNIR is an extension of NIR
where each attribute value combinations are considered to characterize the clustering
results.
Based on the above two concepts, we define the n-nodeset Inir in equation (1):
Where mi is the number of data points in cluster Ci. , |In
ir| is the frequency of the
nodeset In
ir , and k is number of clusters, since this is a product of two factors. The
first factor is the probability of Iir being in Ci using rule (i), which aims to maximize
the intra cluster similarity and the second factor is the weighting function arrived at
using rule (ii) which minimizes the inter cluster similarity. Entropy E(x) is defined as
1
( ) ( ) log( ( ))k
yr yr
y
E X p I p I
, a measurement of information and uncertainty on a
random variable [30]. The minimum entropy value of a node between clustered is
equals to logk. The entropy value of a node between clusters is divided by logk to
normalize the weighting function from zero to one. If we subtract this quantity by
one, the node containing large entropy will obtain a small weight. Since the range

International Journal of Computer Engineering Science (IJCES)
Volume 2 Issue 8 (August 2012) ISSN : 2250:3439
https://sites.google.com/site/ijcesjournal http://www.ijces.com/
8
probability of Inir being in ci is zero to one, it is implied that W(ci,I
nir) range is also [0
1].
4 Cluster Analysis and Data Labeling Methods and Comparison
of NIR/NNIR results
In cluster analysis phase, an NNIR lattice tree is constructed by considering
all the combinations of attribute values which occur in the cluster with their n-nodeset
values. This helps in establishing the tree which represents the clustering results.
Because the size of the tree is large as the number of attribute value combinations is
much, NNIR tree pruning algorithms (i.e. Threshold Pruning, Relative Maximum
Pruning and Hybrid Pruning, discussed in [16]) are applied so as to preserve
significant n-nodesets and ignore insignificant node-sets.
In data labeling phases, a lot of resemblance is found between unlabeled data
point and the existing clusters; using MARDL, the cluster label c* pertaining to the
relevant unlabeled data point is identified.
Nodeset combination: For a given cluster ci, having a fixed NNIR tree, and
an unlabelled data point p(U, J), the nodeset combination is defined by a set of nodesets
whose union is p(U, J) and are independent of each other. These are also found in the
NNIR tree of ci.
For example, the nodeset combinations of unlabeled data point p(U, 1)
={[A1=a], [A2=m], [A3=c]} given in Fig.1 are the following :
{[A1=a], [A2=m]}, {[A3=c]}
{[A1=a], [A3=c]}, {[A2=m]}
{[A1=a]}, {[A2=m]}, {[A3=c]}
Resemblance: Suppose a cluster ci is represented by an NNIR tree and a
given unlabeled data point p(U, j), then the formula (2) gives the resemblance between
these two.
(2)

International Journal of Computer Engineering Science (IJCES)
Volume 2 Issue 8 (August 2012) ISSN : 2250:3439
https://sites.google.com/site/ijcesjournal http://www.ijces.com/
9
Where 0<nu= n, nu=n n
u
n
inI are independent to each other and there union is
p(U, j).
The resemblance with all nu- nodesets are thus found. The combination
which gives maximum resemblance is chosen as the resemblance R(ci, p(U, J)),
between p(U, j) and ci. Since all nu- nodesets are independent of each other, the
probability of the combination in cluster can be measured by the product of the
probabilities of Inu
iru in cluster ci, and the weight of the combination is estimated by
the expected value of the weight of n
u
n
inI i.e. ( ( ))n
u
n
inE f I .
Example 1: A dataset given in Fig.1 with three different attributes A1, A2 and A3
and 15 data points which are divided into three clusters c1, c2 and c3 using some
clustering technique. In Fig.1 an unlabeled dataset U is also given. The following
lattice tree in Fig. 2 is the NNIR tree of cluster c1 and similarly the lattice NNIR trees
of cluster c2 and c3 are also given in Fig. 3 and Fig. 4 respectively.
Fig.2 The pruned NNIR tree of Cluster c1

International Journal of Computer Engineering Science (IJCES)
Volume 2 Issue 8 (August 2012) ISSN : 2250:3439
https://sites.google.com/site/ijcesjournal http://www.ijces.com/
10
Fig.3 The pruned NNIR tree of Cluster c2.
Fig.4 The pruned NNIR tree of Cluster c3
International Journal of Computer Engineering Science (IJCES)
Volume 2 Issue 8 (August 2012) ISSN : 2250:3439
https://sites.google.com/site/ijcesjournal http://www.ijces.com/
11
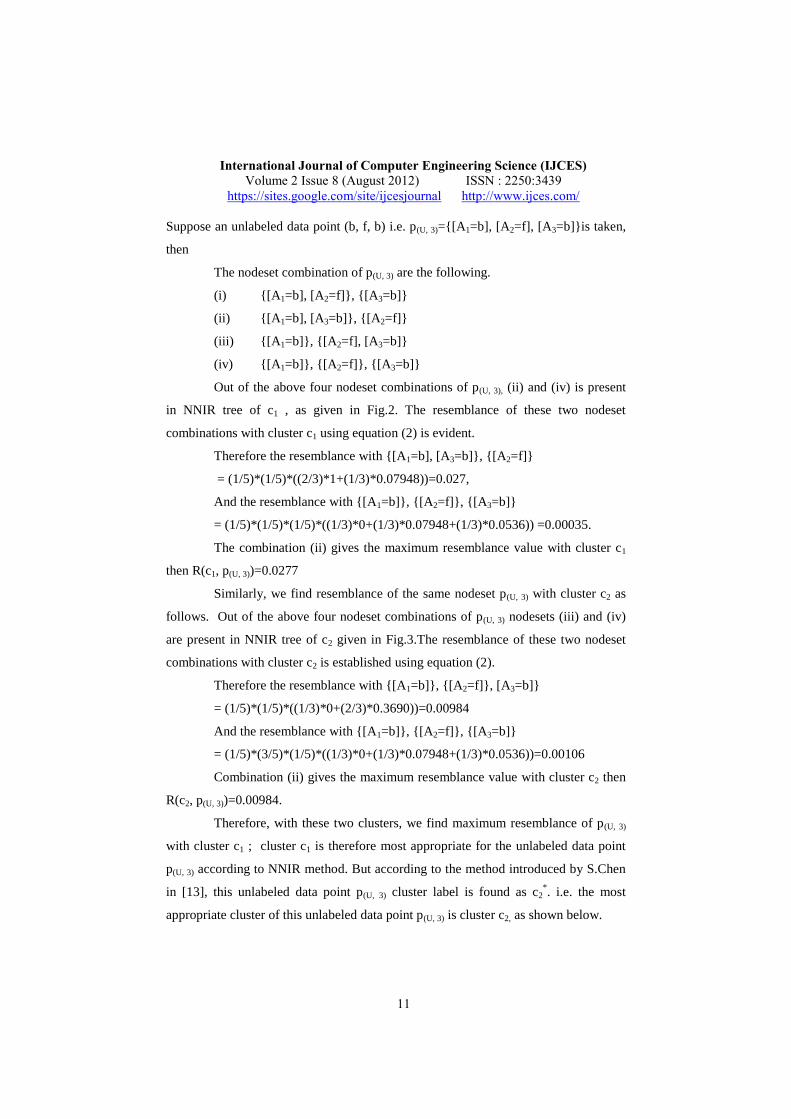
Suppose an unlabeled data point (b, f, b) i.e. p(U, 3)={[A1=b], [A2=f], [A3=b]}is taken,
then
The nodeset combination of p(U, 3) are the following.
(i) {[A1=b], [A2=f]}, {[A3=b]}
(ii) {[A1=b], [A3=b]}, {[A2=f]}
(iii) {[A1=b]}, {[A2=f], [A3=b]}
(iv) {[A1=b]}, {[A2=f]}, {[A3=b]}
Out of the above four nodeset combinations of p(U, 3), (ii) and (iv) is present
in NNIR tree of c1 , as given in Fig.2. The resemblance of these two nodeset
combinations with cluster c1 using equation (2) is evident.
Therefore the resemblance with {[A1=b], [A3=b]}, {[A2=f]}
= (1/5)*(1/5)*((2/3)*1+(1/3)*0.07948))=0.027,
And the resemblance with {[A1=b]}, {[A2=f]}, {[A3=b]}
= (1/5)*(1/5)*(1/5)*((1/3)*0+(1/3)*0.07948+(1/3)*0.0536)) =0.00035.
The combination (ii) gives the maximum resemblance value with cluster c1
then R(c1, p(U, 3))=0.0277
Similarly, we find resemblance of the same nodeset p(U, 3) with cluster c2 as
follows. Out of the above four nodeset combinations of p(U, 3) nodesets (iii) and (iv)
are present in NNIR tree of c2 given in Fig.3.The resemblance of these two nodeset
combinations with cluster c2 is established using equation (2).
Therefore the resemblance with {[A1=b]}, {[A2=f]}, [A3=b]}
= (1/5)*(1/5)*((1/3)*0+(2/3)*0.3690))=0.00984
And the resemblance with {[A1=b]}, {[A2=f]}, {[A3=b]}
= (1/5)*(3/5)*(1/5)*((1/3)*0+(1/3)*0.07948+(1/3)*0.0536))=0.00106
Combination (ii) gives the maximum resemblance value with cluster c2 then
R(c2, p(U, 3))=0.00984.
Therefore, with these two clusters, we find maximum resemblance of p(U, 3)
with cluster c1 ; cluster c1 is therefore most appropriate for the unlabeled data point
p(U, 3) according to NNIR method. But according to the method introduced by S.Chen
in [13], this unlabeled data point p(U, 3) cluster label is found as c2*. i.e. the most
appropriate cluster of this unlabeled data point p(U, 3) is cluster c2, as shown below.

International Journal of Computer Engineering Science (IJCES)
Volume 2 Issue 8 (August 2012) ISSN : 2250:3439
https://sites.google.com/site/ijcesjournal http://www.ijces.com/
12
In S.Chen’s method, not all the nodeset combinations of unlabeled data point
are considered; only a single node importance (i.e. NIR) is considered in MARDL
method to decide the cluster label and that gives rise to the discrepancy.
Now consider the same clusters c1, c2 and c3 as shown in Fig. 1, and the
unlabeled dataset U. Consider same unlabeled data point p(U, 3)={[A1=b], [A2=f],
[A3=b]}
Using Chen’s method one obtains resemblance, using the formula (3):
R(pj, ci)=∑ w(ci, Iir) (3)
Since we measure the similarity between the data point and cluster ci as R(pj,
ci), the cluster with the maximal resemblance is the most appropriate cluster for that
data point.
R(c1, p(U, 3))=0+0.015+0.0107=0.0257
R(c2, p(U, 3))=0+0.047+0.01=0.057
But the maximum value is obtained in c2 with this method thereby
contradicting the result of the method used by us to arrive the result.
The new method is therefore advanced to remedy and better the results
obtained using Chen’s method. The new formula for finding resemblance which can
be used in MARDL clustering given in equation (4):
( , ) max ( ( , ))nu nu
iru i iru i
nu
R I c E w I c (4)
Using of this formula in MARDL, both the methods yield the same results.
5. Conclusions
This paper employed MARDL method to allocate each unlabeled data point
for an appropriate cluster because in sampling techniques, clustering is done on a small
sampled data set from the categorical database. This is because sampling technique
clustering uses many unlabeled data points to which appropriate cluster labels should
be given. This MARDL method works based on NIR/NNIR. NNIR is an extension of
and an improvement on NIR which works better than NIR because all nodeset

International Journal of Computer Engineering Science (IJCES)
Volume 2 Issue 8 (August 2012) ISSN : 2250:3439
https://sites.google.com/site/ijcesjournal http://www.ijces.com/
13
combinations are considered to find the resemblance. Both NIR and NNIR have been
proposed and used in MARDL by S.Chen. This paper investigated and compared the
results derived using NIR and NNIR for cluster and unlabelled data points and found
that the results obtained are contradictory, revealing different values for different
methods when they ought to be the same. To redress this, another method was
proposed to find the maximal resemblance between an unlabeled data point and a
cluster.
Acknowledgments. We wish to thank our supervisor Dr.Vinay Babu,
JNTUniversity Hyderabad, India and all our friends who helped us in writing this
paper.
References
1. Aggarwal, C., Han, J., Wang, J. and Yu P, A Framework for Clustering
Evolving Data Streams, Very Large Data Bases (VLDB), 2003.
2. Aggarwal, C., Wolf, J.L. , Yu, P.S. , Procopiuc, C. and Park, J.S., Fast
Algorithms for Projected Clustering,, ACM SIGMOD ’99, pp. 61-72, 1999.
3. Anil K. Jain and Richard C. Dubes., Algorithms for Clustering Data,
Prentice-Hall International, 1988.
4. Han,J. and Kamber,M., Data Mining Concepts and Techniques, ( Morgan
Kaufmann, 2001).
5. Jain A K MN Murthy and P J Flyn, Data Clustering: A Review, ACM
Computing Survey, 1999.
6. Kaufman L, P. Rousseuw, Finding Groups in Data- An Introduction to
Cluster Analysis,( Wiley Series in Probability and Math. Sciences, 1990).
7. Michael R. Anderberg, Cluster analysis for applications, (Academic Press,
1973).

International Journal of Computer Engineering Science (IJCES)
Volume 2 Issue 8 (August 2012) ISSN : 2250:3439
https://sites.google.com/site/ijcesjournal http://www.ijces.com/
14
8. S. Guha, R. Rastogi, K. Shim. CURE, An Efficient Clustering Algorithm
for Large Databases, ACM SIGMOD International Conference on
Management of Data, pp.73-84, 1998.
9. Ng, R.T. Jiawei Han, CLARANS: a method for clustering objects for spatial
data mining, Knowledge and Data Engineering, IEEE Transactions, 2002.
10. Tian Zhang, Raghu Ramakrishnan, and Miron Livny, BIRCH: An Efficient
Data Clustering Method for Very Large Databases, ACM SIGMOD
International Conference on Management of Data,1996.
11. Sudhakar Reddy.N , Efficient Clustering Algorithm for Large Data Set,
International Journal of Advanced Research in Computer Science and
Software Engineering,2012.
12. Bradley,P.S., Usama Fayyad, and Cory Reina, Scaling clustering algorithms
to large databases, Fourth International Conference on Knowledge
Discovery and Data Mining, 1998.
13. Chen H.L, M.-S. Chen, and S-U Chen Lin , Frame work for clustering
Concept –Drifting categorical data, IEEE Transaction Knowledge and Data
Engineering v21 no 5 , 2009.
14. Fredrik Farnstrom, James Lewis, and Charles Elkan, Scalability for
clustering algorithms revisited, ACM SIGKDD pp.:51–57, 2000.
15. Joydeep Ghosh. Scalable clustering methods for data mining. In Nong Ye,
editor, Handbook of Data Mining, chapter 10, pp. 247–277. Lawrence
Ealbaum Assoc, 2003.
16. Chen, H.L., Chuang, K.T. and Chen, M.S. Labeling Un clustered
Categorical Data into Clusters Based on the Important Attribute Values,
IEEE International Conference. Data Mining (ICDM), 2005.
17. Klinkenberg, R., Using labeled and unlabeled data to learn drifting concepts,
IJCAI-01Workshop on Learning from Temporal and Spatial Data, pp. 16-24,
2001.
18. Venkateswara Reddy.H, Viswanadha Raju.S, A Threshold for clustering
Concept – Drifting Categorical Data, ELSEVIER, 2011.
International Journal of Computer Engineering Science (IJCES)
Volume 2 Issue 8 (August 2012) ISSN : 2250:3439
https://sites.google.com/site/ijcesjournal http://www.ijces.com/
15
19. Venkateswara Reddy.H, Viswanadha Raju.S, Our-NIR: Node Importance
Representative for Clustering of Categorical Data, International Journal of
Computer Science and Technology , pp. 80-82,2011.
20. Venkateswara Reddy.H, Viswanadha Raju.S, POur-NIR: Modified Node
Importance Representative for Clustering of Categorical Data, International
Journal of Computer Science and Information Security, pp.146-150, 2011.
21. Barbara, D., Li, Y. and Couto, J., Coolcat: An Entropy-Based Algorithm for
Categorical Clustering, ACM International Conf. Information and
Knowledge Management (CIKM), 2002.
22. Venkateswara Reddy.H, Viswanadha Raju.S, A Threshold for clustering
Concept – Drifting Categorical Data, IEEE Computer Society, ICMLC 2011.
23. Ganti, V., Gehrke, J. and Ramakrishnan, R, CACTUS—Clustering
Categorical Data Using Summaries, ACM SIGKDD, 1999.
24. Gibson, D., Kleinberg, J.M. and Raghavan,P. Clustering Categorical Data
An Approach Based on Dynamical Systems, VLDB pp. 3-4, pp. 222-236,
2000.
25. Vapnik, V.N, The nature of statistical learning theory,(Springer,1995).
26. Guha,S., Rastogi,R. and Shim, K, ROCK: A Robust Clustering Algorithm
for Categorical Attributes, International Conference On Data Eng. (ICDE),
1999.
27. Sudipto Guha, Adam Meyerson, Nina Mishra, Rajeev Motwani, and Liadan
O’Callaghan, Clustering data streams: Theory and practice, IEEE
Transactions on Knowledge and Data Engineering, pp.515–528, 2003.
28. Andritsos, P, Tsaparas, P, Miller R.J and Sevcik, K.C.Limbo: Scalable
Clustering of Categorical Data, Extending Database Technology (EDBT),
2004.
29. Shannon, C.E, A Mathematical Theory of Communication, Bell System
Technical J., 1948.
30. Gluck, M.A. and Corter, J.E., Information Uncertainty and the Utility of
Categories, Cognitive Science Society, pp. 283-287, 1985.