Comparing models
66
Comparing models Lines, quadratics, and exponential equations
-
Upload
yuri-lancaster -
Category
Documents
-
view
48 -
download
0
description
Comparing models. Lines, quadratics, and exponential equations. This table of values shows the depreciation of the value of a car from year to year, where x is the number of years after it was purchased, which was in 2000 . Calculate the rate of change in value from 2000 to 2003 . - PowerPoint PPT Presentation
Transcript of Comparing models
Comparing modelsLines, quadratics, and exponential equations

Minds on
• This table of values shows the depreciation of the value of a car from year to year, where x is the number of years after it was purchased, which was in 2000.
• Calculate the rate of change in value from 2000 to 2003.
• What units should be used todescribe the rate of change?
• Describe the rate of change.
Years after purchase
Value of car ($)
0 23 0001 21 6202 20 3233 19 1034 17 957

Units for Rate of Change
• Rate of change is calculated by finding:
Rate of Change = Change in y
Change in x• aka Change in y / Change in x
• So the units work the same way!
• Unitsfor Rate of Change = Unitsfor y / Unitsfor x

Examples
• In a distance vs. time graph, the units for the rate of change could be…
• In a table showing earnings over time, the units for the rate of change could be…
• In measuring the class average against the number of students added to a class, the units would be…

Learning Goals
• I can distinguish between linear, quadratic, and exponential models
• I can compare pairs of relations
LINEAR MODELSCharacteristics of graphs, equations, rates of change, and first differences
Linear Models
• A linear model represents quantities that increase or decrease by a constant amount over equal intervals
• In a table of values, the first differences are equal• The graph is a straight line• The equation can be written in the form y = m x
+ b, where m = slope, and b = y-intercept• The rate of change is constant
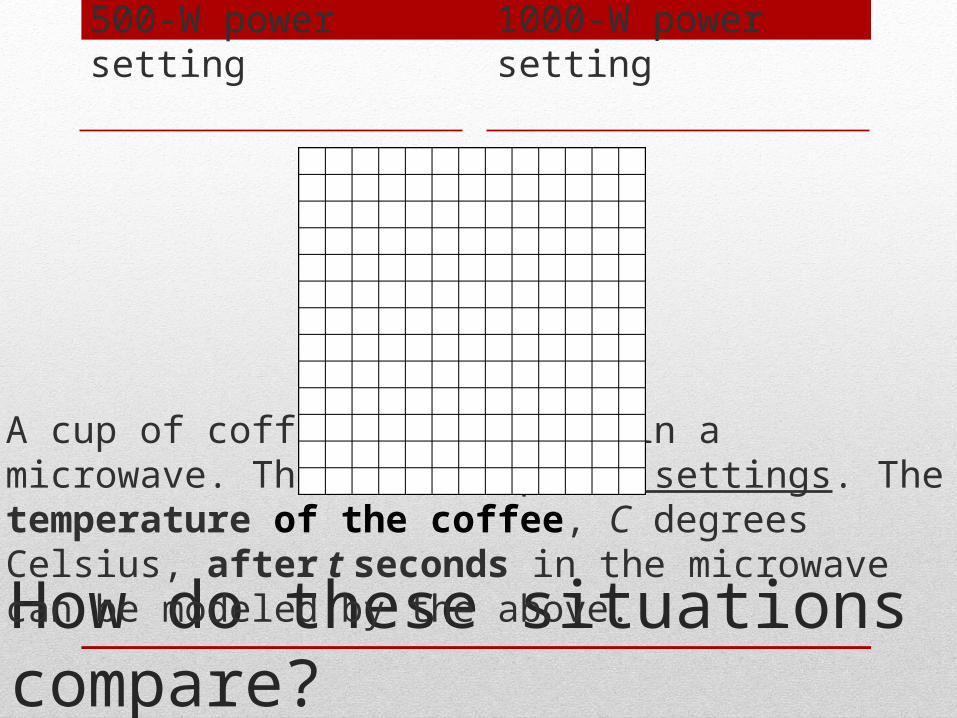
How do these situations compare?
500-W power setting
1000-W power setting
A cup of coffee is reheated in a microwave. There are 2 power settings. The temperature of the coffee, C degrees Celsius, after t seconds in the microwave can be modeled by the above.
Fitting a Linear Model to Data
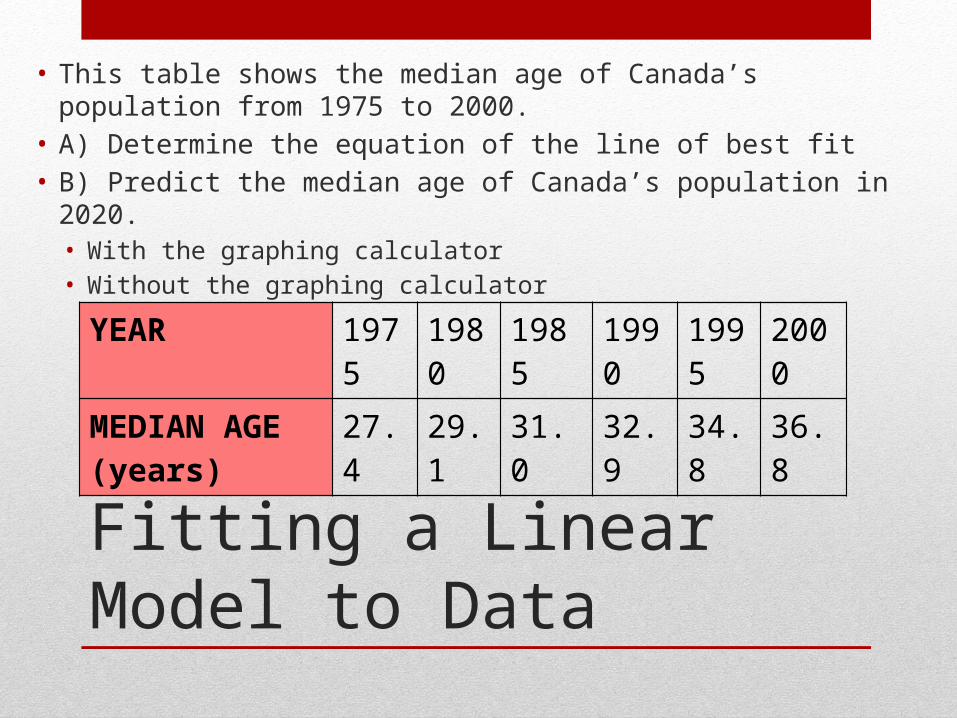
• This table shows the median age of Canada’s population from 1975 to 2000.
• A) Determine the equation of the line of best fit• B) Predict the median age of Canada’s population in 2020.
• With the graphing calculator• Without the graphing calculator
YEAR 1975 1980 1985 1990 1995 2000
MEDIAN AGE (years)
27.4 29.1 31.0 32.9 34.8 36.8

Fitting a Linear Model to Data
YEAR 1975 1980 1985 1990 1995 2000
MEDIAN AGE (years)
27.4 29.1 31.0 32.9 34.8 36.8
y = 0.38x –
723.3
http://ww
w.m
eta-calculator.com/online/

Homework
• Pg. 293 # 1-3, 7, 10, 14• Homework Quiz on MONDAY!

GRAPHICAL MODEL INVESTIGATIONComplete in pairs using the graphing calculators

QUADRATIC MODELSHow are they different from linear models?

Learning Goals
• I can describe quadratic models in terms of their:• Visual graphs• Equations• Rates of change• First and second differences

Math in Basketball
• http://www.thirteen.org/get-the-math/the-challenges/math-in-basketball/introduction/181/

Characteristics of Quadratic Models
• In a table of values, the second differences are equal, and not zero
• The graph is a curve called a parabola• The equation can be written in the form
ax2+bx+c =0 where a is not zero. WHY???• The rate of change is always changing either
from increasing to decreasing or from decreasing to increasing

EXAMPLE 1 Stopping Distances The graph shows the stopping distance (in metres) and speed of a car (in kilometres per hour) (a) Describe the relationship between stopping distance and speed As speed increases, the stopping distance
also increases (b) Use the graph to estimate the stopping distance at (i) 50 km / h At 50 km/h, stopping distance is approximately 10 metres (ii) 100 km / h
At 100 km/h, stopping distance is approximately 40 metres
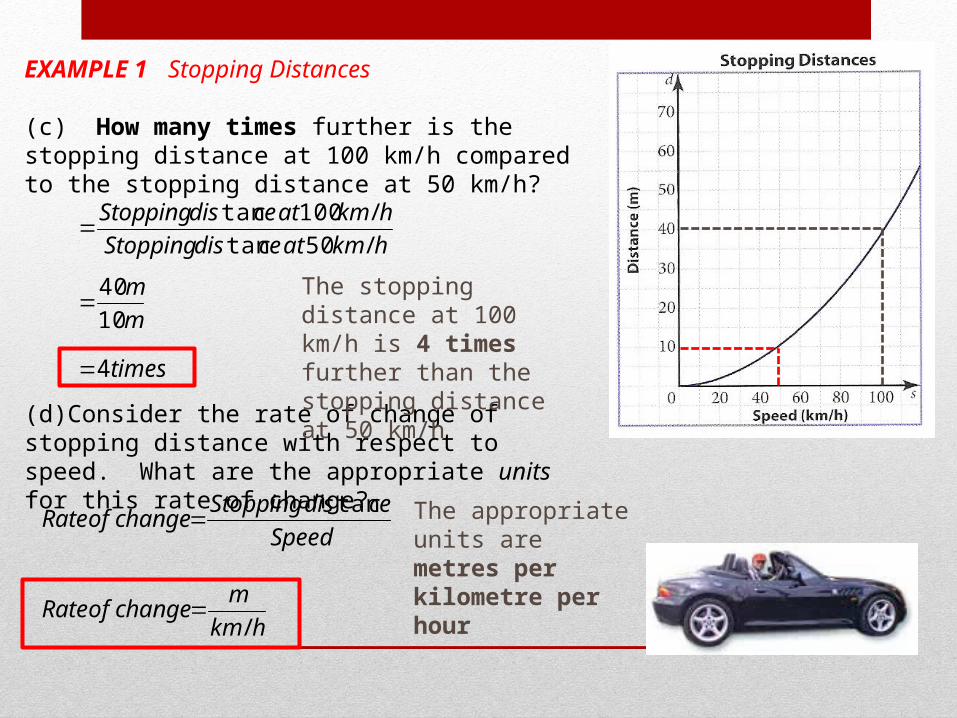
EXAMPLE 1 Stopping Distances (c) How many times further is the stopping distance at 100 km/h compared to the stopping distance at 50 km/h?
(d)Consider the rate of change of stopping distance with respect to speed. What are the appropriate units for this rate of change?
hkmatcedisStopping
hkmatcedisStopping
/50tan
/100tan
m
m
10
40
times4
The stopping distance at 100 km/h is 4 times further than the stopping distance at 50 km/h
Speed
cedisStoppingchangeofRate
tan
hkm
mchangeofRate
/
The appropriate units are metres per kilometre per hour
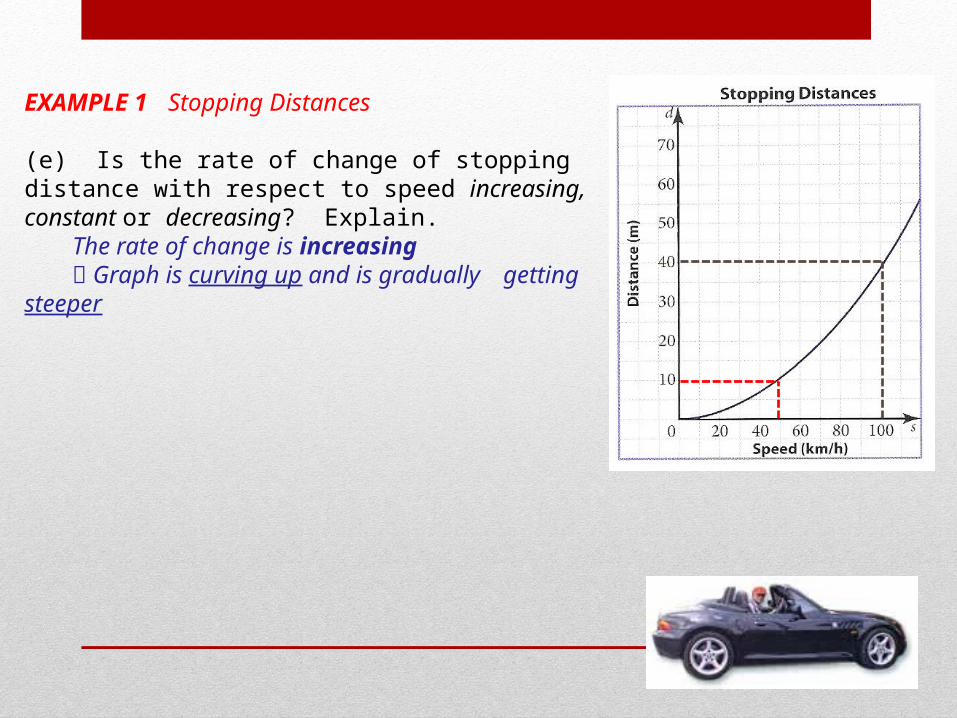
EXAMPLE 1 Stopping Distances (e) Is the rate of change of stopping distance with respect to speed increasing, constant or decreasing? Explain.
The rate of change is increasing Graph is curving up and is gradually getting steeper

EXAMPLE 2Analysing a Free Fall
The table shows distance and time data for the Drop Zone ride at Canada’s Wonderland. (a) Does the time column show equal time intervals? Yes Each time interval is going
up by 0.2 seconds
+ 0.2+ 0.2+ 0.2+ 0.2+ 0.2
+ 0.2+ 0.2+ 0.2+ 0.2+ 0.2+ 0.2+ 0.2+ 0.2

EXAMPLE 2Analysing a Free Fall
(b) Calculate the 1st Differences and record it in the table. (i)Does this model a linear relationship? Explain. No
1st Differences are not constant
(ii) Do the 1st Differences imply an increasing, constant or decreasing rate of change of distance with respect to time?
Since 1st differences are becoming more positive, the rate of change is increasing
+ 0.2+ 0.2+ 0.2+ 0.2+ 0.2
+ 0.2+ 0.2+ 0.2+ 0.2+ 0.2+ 0.2+ 0.2+ 0.2
0.2 – 0.00.8 – 0.2
= + 0.2= + 0.6
1.8 – 0.8 = + 1.0+ 1.4+ 1.8+ 2.2+ 2.6+ 3.0+ 3.4+ 3.8+ 4.2+ 4.6+ 5.0

EXAMPLE 2Analysing a Free Fall
(c) Calculate and record the 2nd Differences. Do the 2nd Differences imply a quadratic model? Explain.
Yes 2nd Differences are
constant
+ 0.2+ 0.6+ 1.0
+ 1.4+ 1.8+ 2.2+ 2.6+ 3.0+ 3.4+ 3.8+ 4.2+ 4.6+ 5.0
0.6 – 0.2 = + 0.41.0 – 0.6 = + 0.41.4 – 1.0 = + 0.4+ 0.4
+ 0.4+ 0.4+ 0.4+ 0.4+ 0.4+ 0.4
+ 0.4+ 0.4
PREVIOUS

EXAMPLE 2Analysing a Free Fall
(d) Create a scatterplot with time on the horizontal axis and distance on the vertical axis.
Time (seconds)
Distance (metres)
Time vs. Distance

EXAMPLE 2Analysing a Free Fall
(e) Does the graph imply a linear or non-linear relation?
NON-LINEAR Points form a
smooth curve
(f) Compare the table and the graph. Does the rate of change of distance with respect to time appear to be increasing, constant or decreasing.
INCREASING- curve on graph is going up and
becoming steeperTime (seconds)
Distance (metres)
Time vs. Distance
Consolidate
How can I tell if I’m looking at quadratic data?• First differences are NOT equal• Second differences are equal• Graph looks like a curve – specifically parabolic• Equation has a squared term in it: usually written as x2
Learning Goals
• I can describe quadratic models in terms of their:• Visual graphs• Equations• Rates of change• First and second differences
Homework: Pg. 303
# 1-3, 5-8, 10

Learning Goals
• I can describe exponential models in terms of their:• Visual graphs• Equations• Rates of change• First and second differences

KEY CONCEPTS For all exponential models, the first and second differences are always non-constant The ratios can be calculated by DIVIDING each y-value by the y-value that comes BEFORE it.
When RATIOS are CONSTANT, the relation is exponential. In an exponential relation, there is a constant percent increase over equal intervals

EXAMPLE 1 Bacteria Growth (b) Use the graph to estimate the number of bacteria after each time period (i) 20 minutes ________ (ii) 40 minutes ________ (iii) 60 minutes ________ (c) Calculate the ratios Divide the number of bacteria after 40 min by the number after 20 min Divide the number of bacteria after 60 min by the number after 40 min
20 40
80
min20#
min40#
atBacteriaof
atBacteriaof
20
40 2
min40#
min60#
atBacteriaof
atBacteriaof
40
80 2

EXAMPLE 1 Bacteria Growth Divide the number of bacteria after 40 min by the number after 20 min Divide the number of bacteria after 60 min by the number after 40 min
(d) What happens to the number of bacteria every 20 minutes?
The number of bacteria doubles
min20#
min40#
atBacteriaof
atBacteriaof
20
40 2
min40#
min60#
atBacteriaof
atBacteriaof
40
80 2

EXAMPLE 1 Bacteria Growth (e) Consider the rate of change of number of bacteria with respect to time. What are suitable units for this rate of change?
(f) Is the rate of change of number of bacteria with respect to time increasing, constant or decreasing. Explain.
INCREASING Curve is going upwards Curve is getting steeper
Time
BacteriaofchangeofRate
#
ute
BacteriachangeofRate
min
The units for rate of change is bacteria per minute

EXAMPLE 2Smoke Detectors Americium-241 (Am-241) is a manufactured element. It is a silvery radioactive metal, which is used in smoke detectors. Household smoke detectors contain about 200 micrograms (g) of Am-241. The amount of Am-241 present in the detector decreases or decays over time. The table shows the mass of Am-241 remaining, in micrograms, over 1000 years. (a) Does the Years column show
equal time intervals?Yes Going up by 100 years
+ 100+ 100+ 100+ 100+ 100+ 100+ 100+ 100+ 100+ 100

EXAMPLE 2Smoke Detectors (b) Calculate the 1st Differences and 2nd Differences. Is the relationship linear, quadratic or neither? Explain.
+ 100+ 100+ 100+ 100+ 100+ 100+ 100+ 100+ 100+ 100
170 - 200 = – 30145 - 170 = – 25124 – 145= – 21– 19– 15– 14– 11– 10– 8– 7
1st DifferencesNot constantNot Linear!
PREV

EXAMPLE 2Smoke Detectors (b) Calculate the 1st Differences and 2nd Differences. Is the relationship linear, quadratic or neither? Explain.
+ 100+ 100+ 100+ 100+ 100+ 100+ 100+ 100+ 100+ 100
– 30– 25– 21– 19– 15– 14– 11– 10– 8– 7
– 25 – (– 30)= – 25 + 30= + 5
+ 5+ 4+ 2+ 4+ 1+ 3+ 1+ 2+ 1
– 21 – (– 25)= – 21 + 25= + 4
– 19 – (– 21)= – 19 + 21= + 2
1st DifferencesNot constantNot Linear!
2nd DifferencesNot constantNot Quadratic!
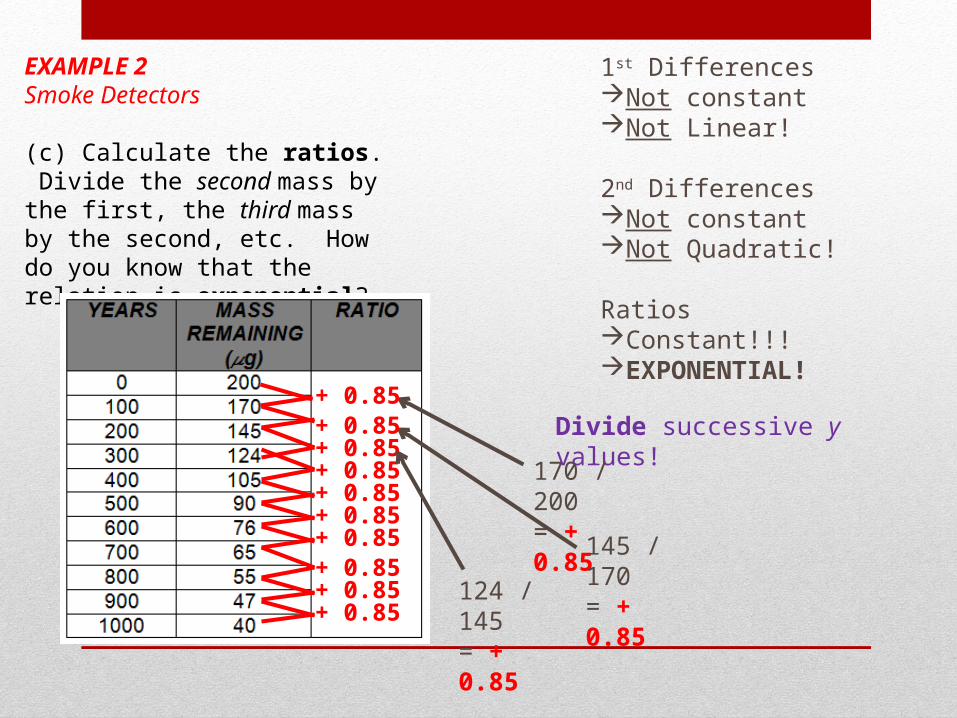
EXAMPLE 2Smoke Detectors (c) Calculate the ratios. Divide the second mass by the first, the third mass by the second, etc. How do you know that the relation is exponential?
1st DifferencesNot constantNot Linear!
2nd DifferencesNot constantNot Quadratic!
RatiosConstant!!!EXPONENTIAL!
Divide successive y values!
170 / 200= + 0.85
145 / 170= + 0.85
+ 0.85+ 0.85+ 0.85+ 0.85+ 0.85+ 0.85+ 0.85+ 0.85+ 0.85+ 0.85
124 / 145= + 0.85
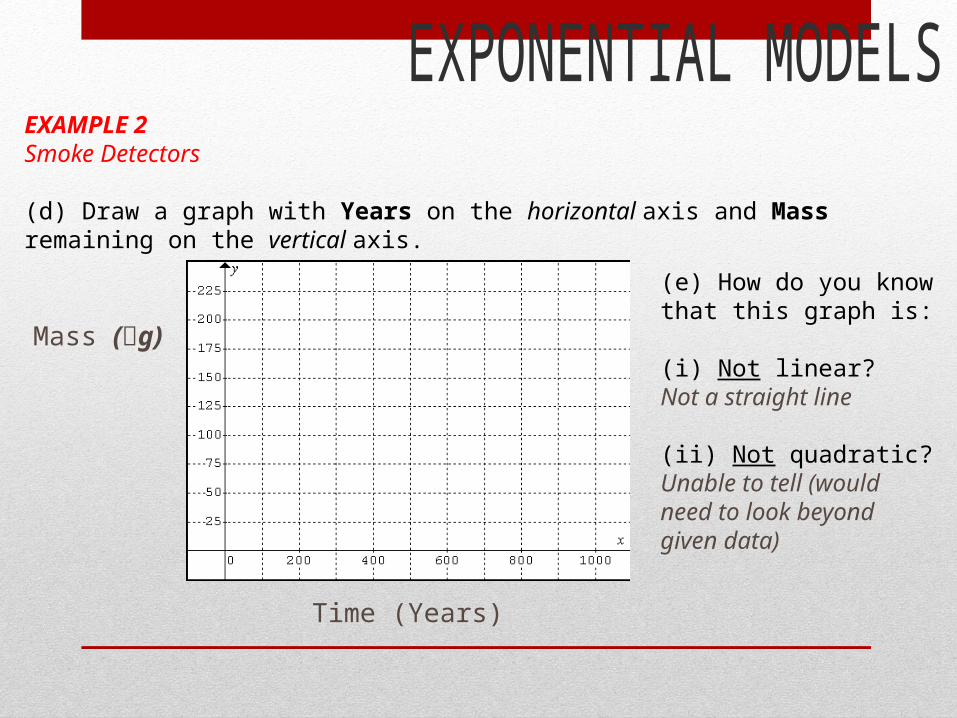
EXAMPLE 2Smoke Detectors (d) Draw a graph with Years on the horizontal axis and Mass remaining on the vertical axis.
Time (Years)
Mass (g)
(e) How do you know that this graph is: (i) Not linear?Not a straight line (ii) Not quadratic?Unable to tell (would need to look beyond given data)

EXAMPLE 2Smoke Detectors (d) Draw a graph with Years on the horizontal axis and Mass remaining on the vertical axis.
Time (Years)
Mass (g)
(f) Compare the table and graph. Does the rate of change of mass remaining with respect to years appear to be constant, increasing or decreasing? Explain.Look at 1st DifferencesThey are increasingBUT...Graph is decreasing
Curve is becoming less steep

EXAMPLE 2Smoke Detectors (g) What are the suitable units for the rate of change of mass remaining with respect to years?
Time
remainingMasschangeofRate
Year
gchangeofRate
The units for the rate of change of mass remaining with respect to years is micrograms per year
Learning Goals
• I can describe exponential models in terms of their:• Visual graphs• Equations• Rates of change• First and second differences

EXPONENTIAL MODELS With technology
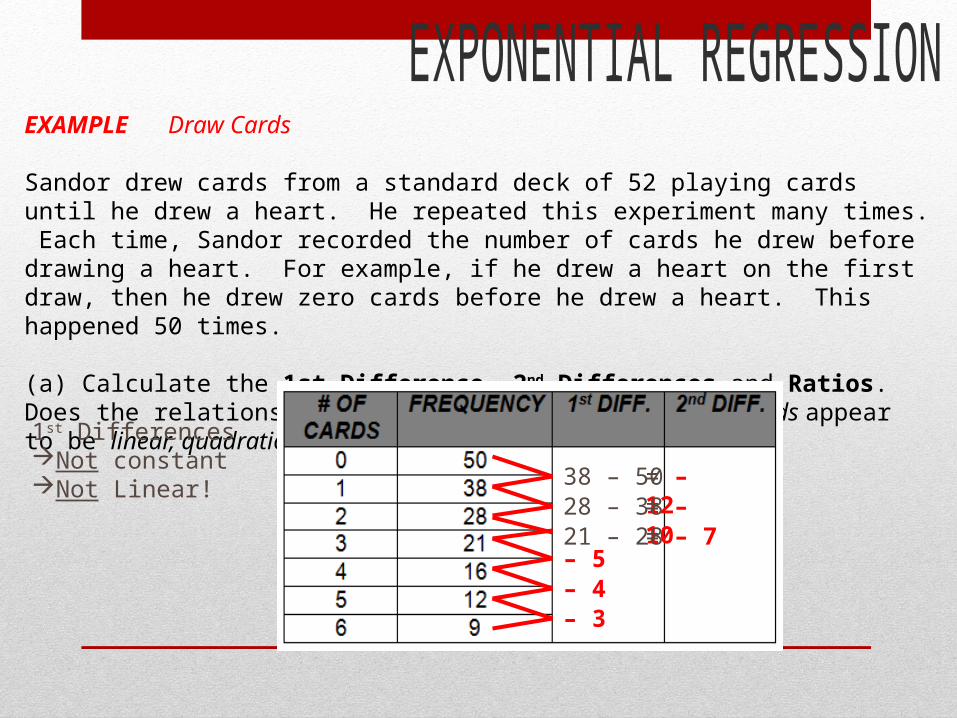
EXAMPLE Draw Cards Sandor drew cards from a standard deck of 52 playing cards until he drew a heart. He repeated this experiment many times. Each time, Sandor recorded the number of cards he drew before drawing a heart. For example, if he drew a heart on the first draw, then he drew zero cards before he drew a heart. This happened 50 times.
(a) Calculate the 1st Difference, 2nd Differences and Ratios. Does the relationship between frequency and number of cards appear to be linear, quadratic or exponential. Explain.
1st DifferencesNot constantNot Linear! 38 – 50= – 12
28 – 38 = – 1021 – 28= – 7– 5– 4– 3

EXAMPLE Draw Cards Sandor drew cards from a standard deck of 52 playing cards until he drew a heart. He repeated this experiment many times. Each time, Sandor recorded the number of cards he drew before drawing a heart. For example, if he drew a heart on the first draw, then he drew zero cards before he drew a heart. This happened 50 times.
(a) Calculate the 1st Difference, 2nd Differences and Ratios. Does the relationship between frequency and number of cards appear to be linear, quadratic or exponential. Explain.
1st DifferencesNot constantNot Linear!
2nd DifferencesNot constantNot Quadratic!
– 12– 10– 7– 5– 4– 3
– 10 – (– 12)– 10 + 12= + 2
+ 2+ 3+ 2+ 1
+ 1
– 7 – (– 10)– 7 + 10= + 3
– 5 – (– 7)– 5 + 7= + 2

EXAMPLE Draw Cards Sandor drew cards from a standard deck of 52 playing cards until he drew a heart. He repeated this experiment many times. Each time, Sandor recorded the number of cards he drew before drawing a heart. For example, if he drew a heart on the first draw, then he drew zero cards before he drew a heart. This happened 50 times.
(a) Calculate the 1st Difference, 2nd Differences and Ratios. Does the relationship between frequency and number of cards appear to be linear, quadratic or exponential. Explain. 1st Differences
Not constantNot Linear!
2nd DifferencesNot constantNot Quadratic!
RatiosRelatively CONSTANTEXPONENTIAL!
38 / 50= + 0.76
28 / 38= + 0.74
21 / 28= + 0.75
+ 0.76+ 0.74
+ 0.75+ 0.76+ 0.75+ 0.75
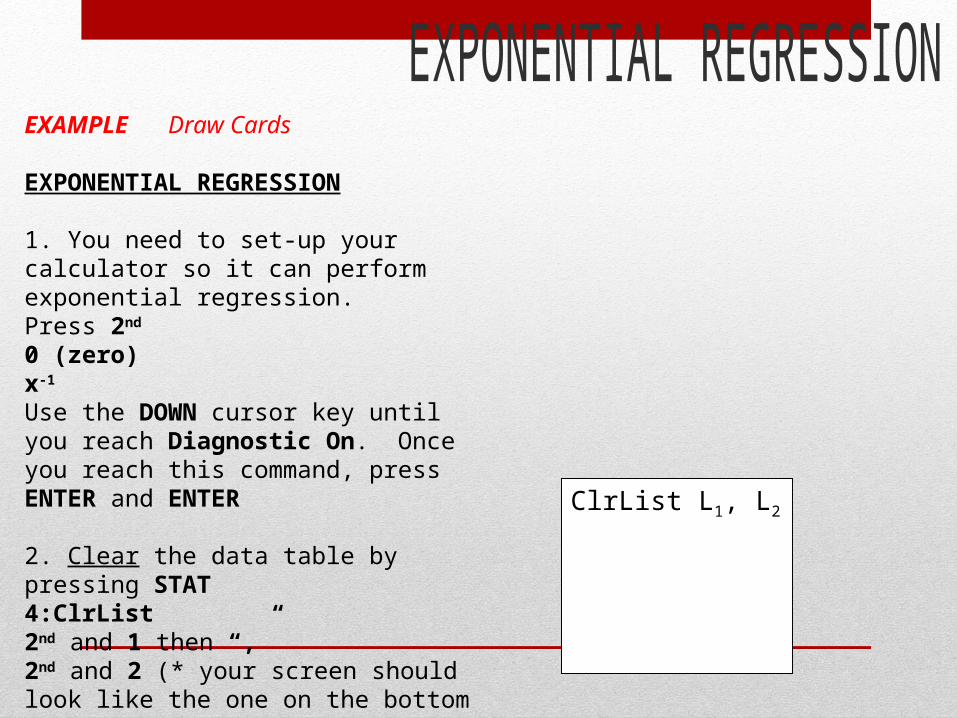
EXAMPLE Draw Cards EXPONENTIAL REGRESSION 1. You need to set-up your calculator so it can perform exponential regression. Press 2nd
0 (zero)x-1 Use the DOWN cursor key until you reach Diagnostic On. Once you reach this command, press ENTER and ENTER 2. Clear the data table by pressing STAT4:ClrList2nd and 1 then “,” 2nd and 2 (* your screen should look like the one on the bottom right)ENTER
ClrList L1, L2

EXAMPLE Draw Cards EXPONENTIAL REGRESSION 3. Enter the data into the lists by pressing STAT and 1:Edit. Enter the “# OF CARDS” data in L1 and “FREQUENCY” data in L2. 4. Create a scatter plot by pressing 2nd, Y=, 1 and ENTER. Make sure that the cursor is on “On” when you press Enter. By default, your Xlist should be L1 and Ylist should be L2. 5. To display your graph, press ZOOM and 9.

EXAMPLE Draw Cards EXPONENTIAL REGRESSION 3. Enter the data into the lists by pressing STAT and 1:Edit. Enter the “# OF CARDS” data in L1 and “FREQUENCY” data in L2. 4. Create a scatter plot by pressing 2nd, Y=, 1 and ENTER. Make sure that the cursor is on “On” when you press Enter. By default, your Xlist should be L1 and Ylist should be L2. 5. To display your graph, press ZOOM and 9.
Sketch the scatterplot below. Label all axes
# of Cards
Frequency

EXAMPLE Draw Cards REGRESSION ANALYSIS and EXPONENTIAL EQUATION OF BEST FIT 1. To perform regression analysis, press
STATMove the right cursor over to CALCPress 0:ExpReg (this activates the exponential regression function)
2. You must tell the calculator which data to perform the quadratic regression on. We do this by entering the lists from our data table. You do this by pressing
2nd, 1 (this will tell it to pick L1) then “,” (comma key)
2nd, 2 (this will tell it to pick L2) then “,” (comma key)
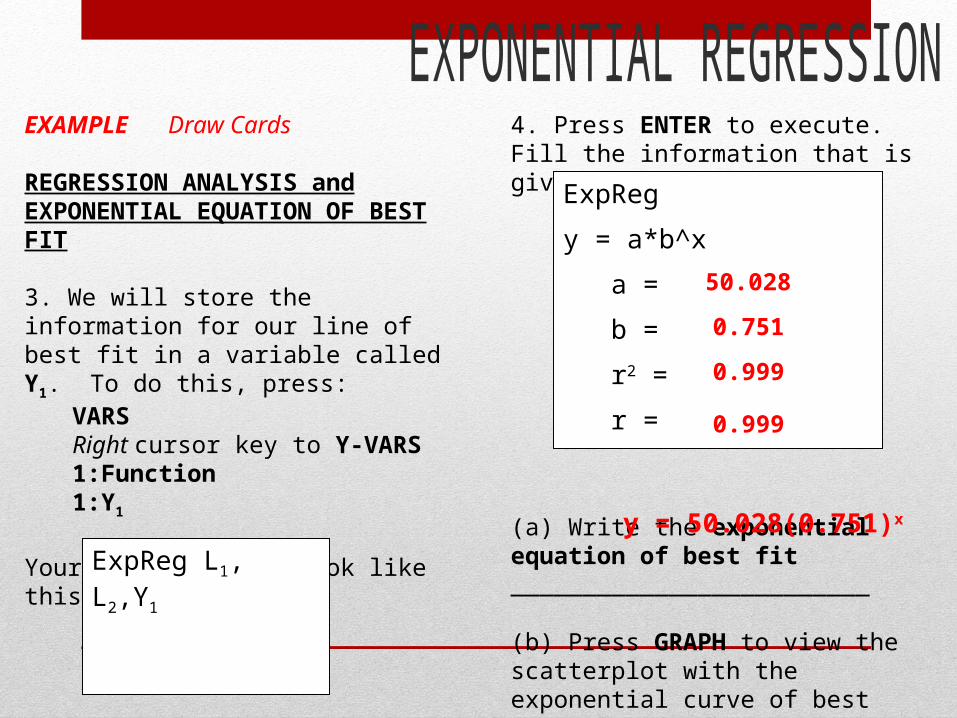
EXAMPLE Draw Cards REGRESSION ANALYSIS and EXPONENTIAL EQUATION OF BEST FIT 3. We will store the information for our line of best fit in a variable called Y1. To do this, press: VARS
Right cursor key to Y-VARS1:Function 1:Y1
Your screen should look like this:ExpReg L1, L2,Y1
4. Press ENTER to execute. Fill the information that is given to you:
(a) Write the exponential equation of best fit _________________________
(b) Press GRAPH to view the scatterplot with the exponential curve of best fit. Draw the curve on your sketch in #5 above.
ExpReg
y = a*b^x
a =
b =
r2 =
r =
50.028
0.751
0.999
0.999
y = 50.028(0.751)x

EXAMPLE Draw Cards
4. Press ENTER to execute. Fill the information that is given to you:
(a) Write the exponential equation of best fit _________________________
(b) Press GRAPH to view the scatterplot with the exponential curve of best fit. Draw the curve on your sketch in #5 above.
ExpReg
y = a*b^x
a =
b =
r2 =
r =
50.028
0.751
0.999
0.999
y = 50.028(0.751)x
# of Cards
Frequency

EXAMPLE Draw Cards (c) Use the equation from 4(a) to answer to predict the frequency of drawing eight (8) cards before drawing a heart
Substitute x = 8 into the equation
y = 50.028(0.751)x
y = 50.028(0.751)8
y = 50.028(0.1012)y = 5
The frequency of drawing 8 cards before drawing a heart is 5
4. Press ENTER to execute. Fill the information that is given to you:
(a) Write the exponential equation of best fit _________________________
(b) Press GRAPH to view the scatterplot with the exponential curve of best fit. Draw the curve on your sketch in #5 above.
ExpReg
y = a*b^x
a =
b =
r2 =
r =
50.028
0.751
0.999
0.999
y = 50.028(0.751)x
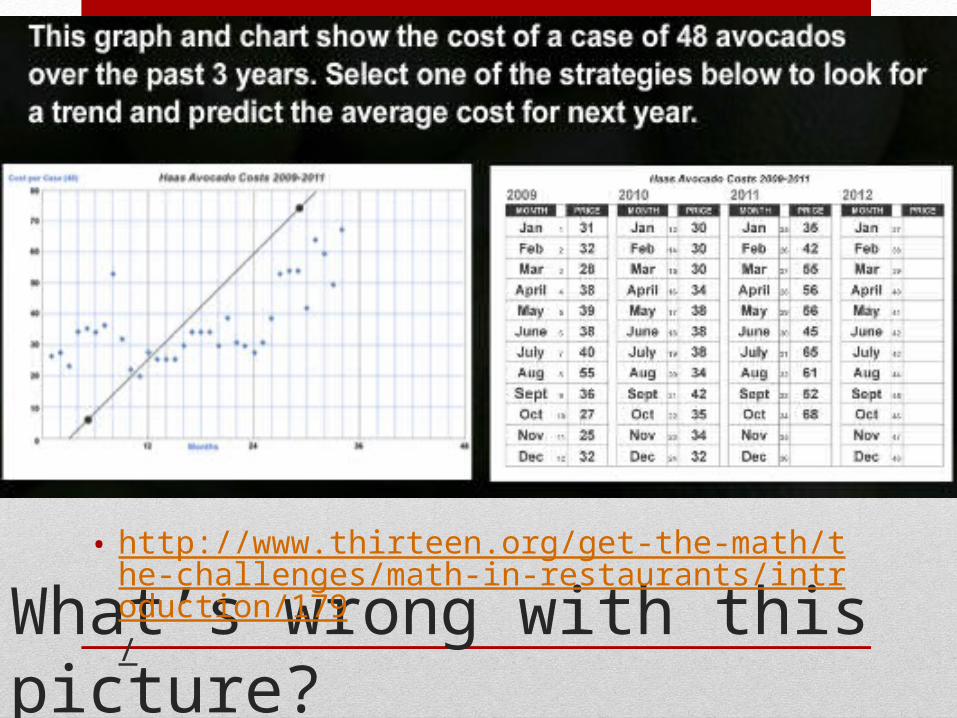
What’s wrong with this picture?
• http://www.thirteen.org/get-the-math/the-challenges/math-in-restaurants/introduction/179/

MINDS ON: Now to our friendly unit study guide…
LINEAR GRAPHS QUADRATIC GRAPHS EXPONENTIAL GRAPHS
y = y = y =
m > 0 m < 0 a > 0 a < 0 a >0 & b > 1 a >0 & 0 < b < 1
___________________ differences
are ___________________
___________________ differences
are ___________________
___________________ factors are
___________________
Using Technology
• Quadratic and Exponential Regression Graphing Calculators!

Use Technology to Select the Best Model
• In a science experiment, students punched a hole near the bottom of a 2-L pop bottle. They filled the bottle with water and measured how the water level changed over time. The results are shown in the table.
TIME (s) 0 25 50 75 100WATER LEVEL (cm)
30.0 22.3 16.1 11.2 7.8
Using the graphing calculators, perform linear, quadratic, and exponential regression to determine the best model to represent this data.
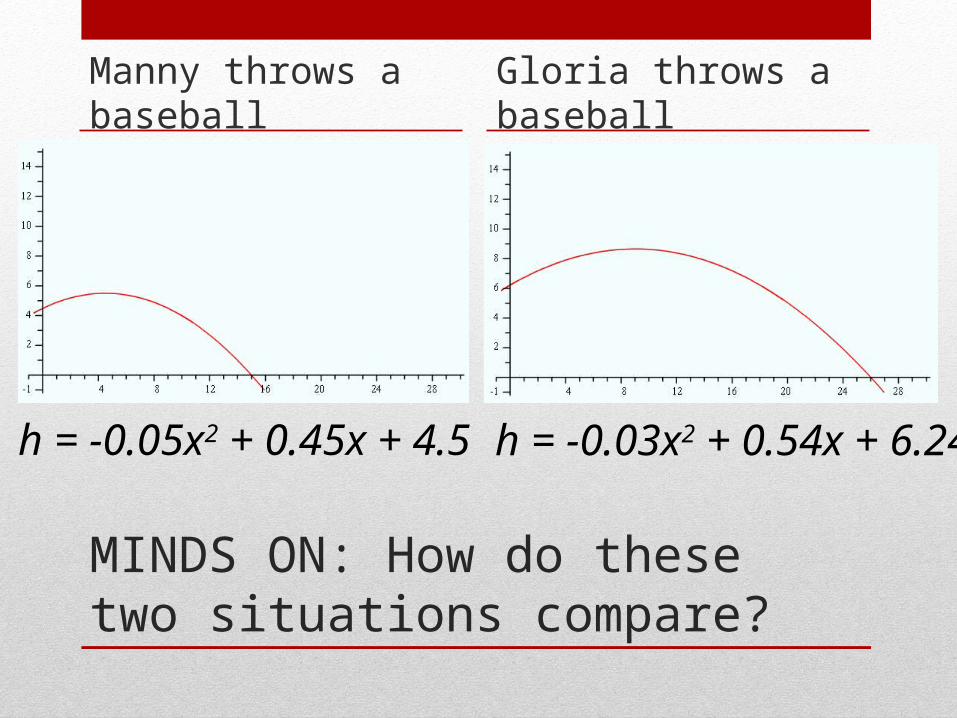
MINDS ON: How do these two situations compare?
Manny throws a baseball
Gloria throws a baseball
h = -0.03x2 + 0.54x + 6.24h = -0.05x2 + 0.45x + 4.5

How do these two situations compare?
Simple Interest Compound Interest
A = 250(1.07x)A = 250 +(0.07 ✕ 250)x


Learning Goals
• I can distinguish between linear, quadratic, and exponential models
• I can compare pairs of relations

Learning Goals
• I can select an appropriate mathematical model to represent a situation

Make a prediction
• PROBLEM 1
• The population of Town X started at 90 000 and increased by 25 000 every year.
• The population of Town Y started at 4000 and doubled every year.
• PROBLEM 2• Ing has the choice of two
payment options for her new job.
• Option A: Starting salary of $48 000, with a $1000 raise every following year
• Option B: Starting salary of $45 000, with a 2.5% raise every following year
Based on what you know about LINES, QUADRATICS and EXPONENTIAL FUNCTIONS, make a prediction about which graph would suit each situation.


On your own
• Come up with an equation to represent the following situations. For each, write “let” statements i.e. “Let x represent…. Let y represent….” before you write your equation:• The number of people who hear a rumour, started by one
person, triples every day. • The value of my computer depreciates by 12% each year,
and I bought it for $875• When Bob and Jeanette got married, the only piece of
jewelry she owned was her wedding ring. Bob likes shiny things, so he buys her a piece of jewelry every year on her birthday, their anniversary, and Valentine’s day.


Learning Goals
• I can select an appropriate mathematical model to represent a situation
• “Seatwork Handout” due at the end of class