Comparing influenza virus hemagglutinin (HA) expression in ...
144
Comparing influenza virus hemagglutinin (HA) expression in three different baculovirus expression systems by Alexandra Elliott A thesis presented to The University of Guelph In partial fulfilment of requirements for the degree of Master of Science in Molecular and Cellular Biology Guelph, ON, Canada ©Alexandra Elliott, August, 2012
Transcript of Comparing influenza virus hemagglutinin (HA) expression in ...

Comparing influenza virus hemagglutinin (HA) expression in three different
baculovirus expression systems
by
Alexandra Elliott
A thesis
presented to
The University of Guelph
In partial fulfilment of requirements
for the degree of
Master of Science
in
Molecular and Cellular Biology
Guelph, ON, Canada
©Alexandra Elliott, August, 2012

ABSTRACT
COMPARING INFLUENZA VIRUS HEMAGGLUTININ (HA) EXPRESSION IN
THREE DIFFERENT BACULOVIRUS EXPRESSION SYSTEMS
Alexandra Elliott Advisor:
University of Guelph, 2012 Professor P.J. Krell
Co-advisor:
Dr. Éva Nagy
In this study, the expression of HA, a key immunogenic protein of influenza viruses, in
insect cells was compared using three baculovirus expression strategies: protein over-expression,
surface (GP64) display, and capsid (VP39) display. Further, a recombinant virus expressing NA,
another immunogenic influenza virus protein, was generated and fused to an HA epitope-tag.
Western immunoblot using various antibodies, including those against HA, demonstrated the
expression of HA and NA for all recombinant viruses. HA showed stronger expression when
fused to the C-terminus of VP39 than the N-terminus, but unlike other expression methods, there
was no observable cleavage of HA in VP39-displayed viruses. Cells infected with only over-
expressed and surfaced-displayed HA were biologically active, and capable of hemadsorption
and hemagglutination of chicken red blood cells. These results suggest that GP64 display or
over-expression are the most efficacious modes of HA-expression for use as antigen to detect
anti-HA antibodies in poultry.

iii
ACKNOWLEDGEMENTS
My gratitude goes to my co-advisors, Dr. Peter Krell and Dr. Éva Nagy for giving me the
opportunity to complete my graduate research in their laboratories. I would also like to thank
you for your consistent support, advice, and for thoroughly enriching my graduate experience. I
would also like to acknowledge Dr. Sarah Wootton, the third member of my committee, for
contributing ideas, offering guidance and supporting me throughout this research.
A number of materials were received from colleagues, enabling this research to take
place. Thank you to Dr. Gary Blissard at Cornell University in Ithaca NY, for supplying us with
the monoclonal anti-GP64 antibody. Thank you to Dr. Congyi Zheng and Qingzhen Liu (Wuhan
University, Wuhan, China) for supplying us with the H5, N1 and M2 cDNA clones. Thank-you
to Dr. Robert Webster at the St. Jude’s Childrens’ Research Hospital in Memphis, TN for
supplying the monoclonal anti-HA antibodies. Thank you to Dr. Rob Kotin for supplying us with
the anti-VP39 antibody. Thank-you to Dan-hui Yang, a previous post-doctoral fellow in the Krell
and Nagy labs for supplying us with the FAdV-HA viruses and serum from vaccinated chickens.
Thank you to OGS, OMAFRA and NSERC for funding this research.
The members of the Krell lab have been indispensible to the completion of this research.
Thank you to Jeffrey Hodgson for training me in the lab and for your continued support and
plentiful guidance throughout this research. Thank you to James Ackford, an undergraduate
project student for your contribution to the NA over-expression work. Thank you to Yang, Dave,
Mike, J.D. and Guozhong for your friendship, advice and encouragement.
Without the support of my family and friends, the completion of this Masters would not
have been possible. Thank you to my parents, Anne and Morris, brother Cameron, sister Lauren,
and brother-in-law Ned for your love and support. Finally, I would like to thank my partner and
best friend Nathan for your continued emotional support throughout the past two years. It is such
a comfort to know that no matter what, you are always in my corner.
iv
TABLE OF CONTENTS
Title Page ........................................................................................................................................ i
Abstract .......................................................................................................................................... ii
Acknowledgements ....................................................................................................................... iii
Table of Contents .......................................................................................................................... iv
List of Figures .............................................................................................................................. vii
List of Tables ................................................................................................................................ ix
List of Abbreviations ......................................................................................................................x
List of Virus and Protein Abbreviations ...................................................................................... xii
Chapter 1: Review of the Literature .................................................................................................1
1.1 Influenza and influenza virus ...........................................................................................1
1.2 Hemagglutinin and neuraminidase ...................................................................................5
1.3 Evolution of influenza viruses and avian influenza virus ................................................8
1.4 HPAI control strategies in humans ................................................................................11
1.5 HPAI control strategies in poultry ..................................................................................14
1.6 Baculoviruses as expression vectors ..............................................................................15
1.7 Baculovirus expression, overexpression and display .....................................................18
1.8 Applications of baculoviral foreign gene expression to influenza virus research .........23
1.9 Research objectives and experimental design ................................................................27
Chapter 2: Materials and Methods .................................................................................................30
2.1 Cells and virus ...............................................................................................................30
2.1.1 Insect cell culture ...............................................................................................30
2.1.2 Influenza virus, HA and NA clones ...................................................................30
2.2.General DNA manipulation ............................................................................................30
2.2.1 Bacterial cultures and plasmid isolation ...........................................................30
2.2.2 Restriction digestions and PCR..........................................................................31
2.2.3 Plasmid construction and cell transformation ...................................................32
2.3 Generation of recombinant baculovirus constructs ......................................................32
2.3.1 Removal of histidine (6-His) tag from pFastbacB ............................................32
2.3.2 Generation of ΔHispFastBacBHAFLAG .............................................................35
2.3.3 Generation of ΔHispFastBacBHA:VP39FLAG and ΔHispFastBacBVP39:HAFLAG
(VP39 fusion constructs) .............................................................................................35
2.3.4 Generation of ΔHispFastBacBHA:GP64FLAG ...................................................37
2.3.5 Generation of ΔHisPFastbacBNAHA .................................................................38
v
2.4 Construction, amplification and titration of recombinant baculoviruses .......................38
2.4.1 Generation of recombinant bacmids using the Bac-toBac system ....................38
2.4.2 Purification of bacmid DNA ..............................................................................39
2.4.3 Transfection, amplification and titration of recombinant viruses ......................40
2.5 Infections and concentration of recombinant budded virions .......................................41
2.5.1 Infection of insect cells with recombinant virus ..............................................41
2.5.2 Virus growth curve.............................................................................................42
2.5.3 Recovery of infected cells and general protein sample preparation ..................42
2.5.4 Concentration of recombinant budded virions ...................................................43
2.5.5 Quantification of total protein (Bradford assay) ................................................43
2.6 General SDS-PAGE and Western Immunoblot ............................................................44
2.6.1 SDS-PAGE.........................................................................................................44
2.6.2 Western Immunoblot..........................................................................................44
2.6.3 Coomassie blue staining to confirm equal loading ............................................45
2.7 Assessment of HA activity in insect cells ......................................................................46
2.7.1 Collection and preparation of red blood cells ...................................................46
2.7.2 Hemagglutination assays ...................................................................................46
2.7.3 Hemadsorption assays ........................................................................................47
2.8 NA activity in the insect cell .........................................................................................47
2.8.1 NA assay ............................................................................................................47
Chapter 3: Results .........................................................................................................................50
3.1 Generation of Recombinant viruses ..............................................................................50
3.1.1 Development of the baculovirus recombinant HA viruses ..............................52
3.1.2 Viral growth kinetics ..........................................................................................52
3.2 Expression of HA by three different methods as measured using anti-FLAG antibody
.....................................................................................................................................52
3.2.1 HAFLAG overexpression ....................................................................................54
3.2.2 HAFLAG expression in Sf21 cells ........................................................................54
3.2.3 AcHAFLAG expression in Hi-FiveTM
cells .........................................................53
3.2.4 Comparison of HAFLAG recovery between NP40 and RIPA lysis buffers for
ELISA .........................................................................................................................58
3.2.5 Nature of 65 and 74 kDa bands: serum-containing versus serum-free media.. .60
3.2.6 HAFLAG expression in Sf21 cells in the presence or absence of tunicamycin ...60
3.2.7 AcGP64:HAFLAG expression ............................................................................63
3.2.8 AcHA:VP39FLAG and AcVP39:HAFLAG expression .........................................65
3.2.9 Relative levels of HA expression between all HA-expressing baculoviruses ..68
3.3 Recognition of HA expressed by recombinant viruses by antibodies against HA ........71
3.3.1 Detection of HAFLAG with a commercial polyclonal, mono-specific (H5) HA
antibody ......................................................................................................................72
3.3.2 Detection of HA from recombinant HA-display and HAFLAG viruses using a

vi
commercial polyclonal, monospecific anti-HA antibody ..........................................70
3.3.3 Detection of HA from all recombinant baculoviruses with monoclonal anti H5
HA antibodies ............................................................................................................72 3.3.4 Detection of HA in Sf21 cells infected with each recombinant HA-expressing
baculovirus using polyclonal anti-serum to H5N1 virus ...........................................77
3.3.5 Testing of serum from FAdV-HA vaccinated birds using HAFLAG as antigen .79
3.4 Biological activity of HA expressed in the insect cell ..................................................79
3.4.1 Hemagglutination assays....................................................................................79
3.4.2 Hemadsorption assays .......................................................................................83
3.4.3 Formation of syncytia (CPE) in Sf21 cells infected with recombinant HA-
expressing baculoviruses ............................................................................................87
3.5 Neuraminidase expression ............................................................................................89
3.5.1 Neuraminidase overexpression .........................................................................89
3.5.2 Neuraminidase assay .........................................................................................89
Chapter 4: Discussion ............................................................................................................................. 93
4.1 Characterization of expressed HAs using an anti-FLAG antibody .......................94
4.2 Characterization of expressed HAs using anti-HA antibodies ............................104
4.3 Biological activity of recombinant HAs .............................................................108
4.4 Neuraminidase expression ..................................................................................110
4.5 Summary and future directions ...........................................................................111
References .............................................................................................................................................. 115
Appendices ............................................................................................................................................. 127

vii
LIST OF FIGURES
Figure Page
1.1 Influenza virus virion 4
1.2 Hemagglutinin protein and schematic 7
1.3 Geographic distribution of H5N1 in humans 12
1.4 Baculovirus budded virion 17
1.5 Flowchart of recombinant baculovirus generation using Bac-to-Bac
(Invitrogen)
20
1.6 Schematic of GP64 and VP39 display 24
2.1 Schematic representation of ΔHispFastbacB 33
2.2 Schematic representation of all recombinant baculoviruses generated 49
3.1 Schematic representation of recombinant HA-expressing baculoviruses
generated
51
3.2 Virus growth kinetics 53
3.3 Western blot of AcHAFLAG transfected Sf21 cells using anti-FLAG
antibody
55
3.4 Western blot of AcHAFLAG infected Sf21 and Hi-FiveTM
cells using anti-
FLAG antibody
56
3.5 Western Immunoblot of AcHAFLAG infected Hi-FiveTM
cells, comparing
NP40 and RIPA lysis buffers using anti-FLAG antibody
59
3.6 Western Immunoblot comparing serum free and serum containing
medium in AcHAFLAG infected Hi-FiveTM
cells using anti-FLAG
antibody
61
3.7 Western Immunoblot comparing AcHAFLAG infected Sf21 cells in
presence or absence of tunicamycin using anti-FLAG antibody
62

viii
3.8 Western Immunoblot of AcHA:GP64FLAG infected Sf21 and Hi-FiveTM
cells using anti-FLAG antibody
64
3.9 Western Immunoblot of AcHA:VP39FLAG and AcVP39:HAFLAG infected
Sf21 and Hi-FiveTM
cells using anti-FLAG antibody
67
3.10 Western Immunoblot comparing all HA-expressing baculoviruses using
anti-FLAG antibody
69
3.11 Western Immunoblot comparing HA expression in budded virions of all
HA-expressing viruses using anti-FLAG antibody
70
3.12 Western Immunoblot of AcHAFLAG infected Sf21 cells using polyclonal
anti H5 monospecific antibody #3425
73
3.13 Western Immunoblot of Sf21 cells infected with all HA-expressing
viruses, using the polyclonal anti H5 monospecific antibody #3425
74
3.14 Western Immunoblot of Sf21 cells infected with all HA-expressing
viruses, using a monoclonal anti-H5 HA antibody
76
3.15 Western Immunoblot of Sf21 cells infected with all HA-expressing
viruses, using a polyclonal H5 chicken serum
78
3.16 Western Immunoblot of Sf21 cells infected with AcHAFLAG using serum
from chickens vaccinated with FAdV-HAR as primary antibody
80
3.17 Hemagglutination assays 82
3.18 Hemadsorption assays 84
3.19 Syncytia formation in AcHAFLAG and AcHA:GP64FLAG infected cells 88
3.20 Western Blot of AcNAHA infected Sf21 cells 91
3.21 Biological activity of NA 92

ix
LIST OF TABLES
Table Page
2.1 PCR conditions 31
2.2 List of primers used for
cloning
34
2.3 List of primers used for
sequencing
36
x
LIST OF ABBREVIATIONS
AI avian influenza
bp base pairs
BEVS baculovirus expression vector systems
cDNA complementary DNA
CP circumsporozoite protein
CPE cytopathic effect
DIVA differentiation of infected from vaccinated
DNA deoxyribonucleic acid
DNA pol DNA polymerase
dsDNA double stranded DNA
ELISA enzyme-linked immunosorbent assay
ER endoplasmic reticulum
FAdV fowl adenovirus
FBS fetal bovine serum
GOI gene of interest
GST glutathione-S-transferase
GP64 glycoprotein 64
HA hemagluttinin
His histdine-tag
HPAI highly pathogenic avian influenza
h.p.i. hours post infection
h.p.t. hours post transfection
Kb kilobases
kDa kilodaltons
M1 matrix 1 protein
M2 matrix 2 ion channel
LPAI low pathogenic avian influenza
LB Luria Bertanni
min minute(s)
MOI multiplicity of infection
mRNA messenger ribonucleic acid
NA neuraminidase
NP nucleoprotein
NS1 non-structural protein 1
NS2 non-structural protein 2
ODV occlusion derived virus
ORF open reading frame
ori origin of DNA replication
PBS phosphate buffered saline
PCR polymerase chain reaction
Pfu plaque-forming units
PHAC Public Health Agency of Canada
pi post-infection
polh polyhedrin promoter
rBV recombinant budded virus
xi
rpm rotations per minute
SAα2,3gal sialic acid alpha 2, 3 galactose receptor
SAα2,6gal sialic acid alpha 2,6 galactose receptor
SDS sodium dodecyl sulphate
SDS-PAGE sodium dodecyl sulphate polyacrylamide gel electrophoresis
SP signal peptide
TBE tris borate EDTA
TIV trivalent inactivated vaccine
UV ultraviolet
VLP virus-like particle
VP39 viral protein 39
WHO World Health Organization
wt wild-type

xii
VIRUS AND PROTEIN NAMES
Virus Abbreviation
AcMNPV Wild-type Autographa californa
multiplenucleopolyherovirus
AcΔCC Recombinant AcMNPV with the chitinase and
cathepsin ORFs removed
AcCHIAFLAG Recombinant AcMNPV ΔCC expressing
chitinase and a FLAG epitope tag
AcCHIA(ASD)FLAG Recombinant AcMNPV ΔCC expressing the
active site domain of chitinase and a FLAG
epitope tag
FAdV Fowl adenovirus
FAdV-9Δ4 Fowl adenovirus with the 9-4 region removed
FAdV-HA Fowl adenovirus 9Δ4 with HA cloned either in
the left (L)or right (R) orientation
AcHAFLAG Recombinant AcMNPV ΔCC expressing
FLAG-tagged HA
AcHA:GP64FLAG Recombinant AcMNPV ΔCC expressing
FLAG-tagged HA:GP64 fusion
AcHA:VP39FLAG Recombinant AcMNPV ΔCC expressing
FLAG-tagged HA :VP39 fusion
AcVP39:HAFLAG Recombinant AcMNPV ΔCC expressing
FLAG-tagged VP39:HA fusion protein
CHIAFLAG FLAG tagged chitinase protein
CHIA(ASD)FLAG FLAG tagged active site domain of chitinase
protein
HAFLAG FLAG tagged HA
HA:GP64FLAG FLAG tagged HA:GP64 fusion protein

xiii
HA:VP39FLAG FLAG tagged HA:VP39 fusion protein
AcVP39:HAFLAG FLAG tagged VP39:HA fusion protein

1
Chapter 1: Introduction
1.1 Influenza and influenza viruses
Influenza (flu) is a highly infectious, acute respiratory illness caused by influenza viruses,
and is associated with significant mortality and morbidity worldwide (Simonsen et al., 1998).
Influenza epidemics occur both annually and seasonally in most parts of the world, with peak
activity reported between December and March in northern temperate climates, and throughout
the year in tropical climates (Cox and Subbarao, 2003). In humans, influenza virus infection is
characterized by a broad collection of symptoms, including: extreme fatigue, headache, fever,
general achiness, sore throat, and occasionally dry cough or runny nose. In susceptible
individuals, such as the elderly, the very young, or those with compromised immunity, serious
pulmonary, neurological, or cardiovascular complications can arise in association with influenza
virus infection (Cox and Subbarao, 2003). Cases of bacterial pneumonia (Rothberg and Haessler,
2010), myocarditis (Ison et al., 2005) and encephalopathy (Studahl, 2003) have all been
documented in patients admitted to hospital and diagnosed with primary influenza virus
infection. Additionally, this disease can exacerbate underlying or pre-existing medical conditions
such as asthma, or atherosclerosis (Rothberg and Haessler, 2010).
The symptoms of influenza are often ambiguously described, and since complications
associated with this illness can be broad, influenza-related deaths tend to be underreported. As a
result, the true burden of this disease on the Canadian population has most likely been
underestimated. For instance, in 2011 there were approximately 18,000 laboratory-confirmed
cases of influenza virus in Canada (Public Health Agency of Canada, 2012), representing 0.5%
of the Canadian population, of 34 million (World Bank, 2010). However, it has been estimated
that up to 20% of the population (roughly 6.8 million Canadians) may become infected during

2
any given flu season (Parkins et al., 2009). These numbers, which are significantly greater than
what is actually reported in hospitals, are likely indicative of the seriousness of this disease,
emphasizing the importance of prevention. Further, while the indirect implications of influenza
on populations may be less overtly obvious, they are in fact consequential. For instance, it has
been noted that during a pandemic, influenza-related absenteeism and reduced household
consumption can result in a 10% loss of gross domestic product (Verikios et al., 2010), making it
clear that influenza virus infection can have far-reaching and negative implications.
Currently, the most efficacious way to prevent influenza virus infection and its
potentially detrimental complications is through vaccination (Fiore et al., 2010). In addition, two
classes of antiviral drugs, including neuraminidase inhibitors (such as Zanamivir) and ion
channel (M2) blockers (such as Rimantadine) have been approved for use against influenza virus
(Fiore et al., 2010). Unfortunately, antiviral drugs are beneficial only when administered 24 to 48
hours post-infection, and therefore are often rendered ineffective (Fiore et al., 2010). Further,
there is growing concern that the virus population is becoming resistant to anti-viral drugs. Due
to their several limitations, antiviral drugs are generally prescribed only for individuals that are
considered to be at high-risk for contracting influenza virus, are in direct contact with farm
animals which may carry the virus, or in individuals where vaccination is contraindicated (e.g.
egg allergy).
Influenza viruses belong to the family Orthomyxoviridae, which comprises five genera:
Influenzavirus A, Influenzavirus B, Influenzavirus C, Isavirus and Thogotovirus (9th
International
Committee on the Taxonomy of Viruses (ICTV) report, 2011). The influenza virus genome is
segmented and consists of eight linear, single-stranded ribonucleic acids (RNA) of negative
polarity (Fig 1.1). The enveloped influenza viral particles are comprised of ten structural

3
proteins, including hemagglutinin (HA) and neuraminidase (NA) (Samji, 2009). Two of the eight
viral transcripts are alternatively spliced and encode four polypeptides while the other six encode
six polypeptides. Influenza virus particles, which range from 80-120 nm in length, are spherical
or filamentous in nature, and this distinctive morphology is mediated in part by interactions of
the well conserved cytoplasmic tails of the viral proteins HA and NA with internal viral
constituents such as the matrix 1 protein (M1) (Jin et al., 1997). Without these tails, budding of
influenza virus appears to be inefficient (Jin et al., 1997). HA and NA are abundant surface
glycoproteins which also mediate critical interactions between virus and host cell (Samji, 2009).
The three genera, Influenza virus A, Influenza virus B, and Influenza virus C, comprise
type species, Influenza A virus, Influenza B virus and Influenza C virus, respectively. While
viruses of all three species are capable of infecting humans, influenza viruses A and B are
primarily responsible for causing epidemics. Historically, pandemics are caused exclusively by
influenza A virus. The nomenclature of influenza A virus is defined by the antigenic variation of
the surface glycoproteins HA and NA (Bouvier and Palese, 2008). There are at least sixteen
subtypes of HA (H1-16) and nine subtypes of NA (N1-9), but only H1- H3, as well as N1 and
N2 have been identified in human influenza virus epidemics (Bouvier and Palese, 2008).

4
Figure 1.1 The influenza virion. Eight RNA segments code for ten viral proteins via alternative
splicing. HA, NA and M2 are the surface glycoproteins. Image from
http://www.virology.ws/2009/04/30/structure-of-influenza-virus/.

5
1.2 Hemagglutinin and neuraminidase
The influenza virus major ~64 kilodalton (kDa) glycoprotein HA, is a trimeric fusion
protein and is critical for attachment to sialic acid receptors on the host cell. HA0 represents the
inactive form of this protein. Being an integral membrane protein, HA is translated and modified
through the endoplasmic reticulum (ER), and is subsequently transported through the Golgi
apparatus to the cell membrane. During this translocation, HA0 undergoes several post-
translational modifications, including: formation of disulfide bonds, whose quantity varies
among different HAs but which all function to stabilize the protein (Chreighton, 1988, and Segal
et al., 1992), addition of N-glycosidic oligosaccharide side chains (Keil et al., 1985), acylation
(Schmidt, 1982), and proteolytic cleavage into two active subunits, amino-terminal HA1 and
carboxy-terminal HA2 (Huang et al., 1981, Klenk et al., 1975, and Lazarowitz et al., 1975) .
Proteolytic cleavage of HA0 is particularly important for influenza virus pathogenicity
and apathogenic and pathogenic strains tend to be activated by different types of proteases
(Stieneke-Grober et al., 1992). Cleavage of HA0 in apathogenic strains is facilitated by non-
ubiquitous proteases and therefore causes only localized infection in certain types of cells
(Stieneke-Grober et al., 1992). Conversely, HA found in pathogenic strains of influenza virus
undergoes cleavage by subtilisin-like endoproteases, which are ubiquitous and therefore present
in numerous cell types, allowing for systemic infection rather than localized infection.
Specifically, HAs from pathogenic strains are cleaved by furin proteases, a substituent of the
subtilisin-like protease family (Stieneke-Grober et al., 1992). HA cleavability is largely
determined by the amino acid sequence found at the cleavage site. Apathogenic strains have one
arginine at this site while pathogenic strains have numerous lysines and arginines, with a specific
6
consensus sequence of R-X-K/R-R required for cleavage activation at these sites (Vey et al.,
1992).
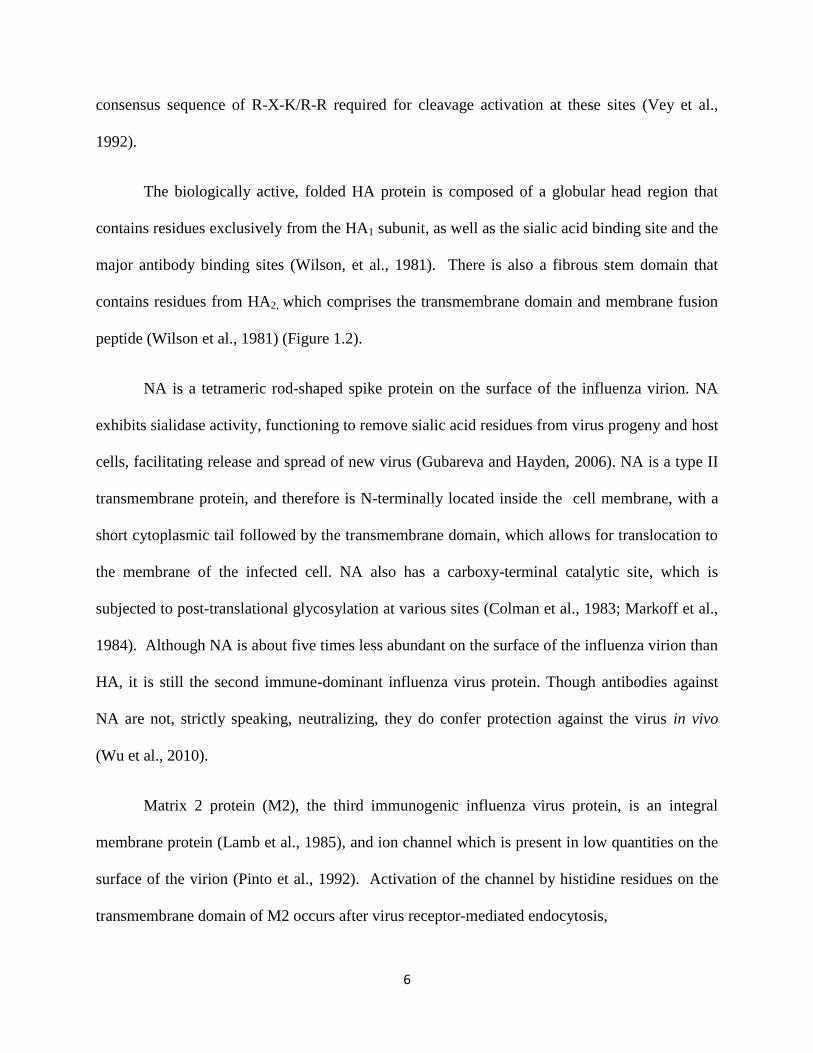
The biologically active, folded HA protein is composed of a globular head region that
contains residues exclusively from the HA1 subunit, as well as the sialic acid binding site and the
major antibody binding sites (Wilson, et al., 1981). There is also a fibrous stem domain that
contains residues from HA2, which comprises the transmembrane domain and membrane fusion
peptide (Wilson et al., 1981) (Figure 1.2).
NA is a tetrameric rod-shaped spike protein on the surface of the influenza virion. NA
exhibits sialidase activity, functioning to remove sialic acid residues from virus progeny and host
cells, facilitating release and spread of new virus (Gubareva and Hayden, 2006). NA is a type II
transmembrane protein, and therefore is N-terminally located inside the cell membrane, with a
short cytoplasmic tail followed by the transmembrane domain, which allows for translocation to
the membrane of the infected cell. NA also has a carboxy-terminal catalytic site, which is
subjected to post-translational glycosylation at various sites (Colman et al., 1983; Markoff et al.,
1984). Although NA is about five times less abundant on the surface of the influenza virion than
HA, it is still the second immune-dominant influenza virus protein. Though antibodies against
NA are not, strictly speaking, neutralizing, they do confer protection against the virus in vivo
(Wu et al., 2010).
Matrix 2 protein (M2), the third immunogenic influenza virus protein, is an integral
membrane protein (Lamb et al., 1985), and ion channel which is present in low quantities on the
surface of the virion (Pinto et al., 1992). Activation of the channel by histidine residues on the
transmembrane domain of M2 occurs after virus receptor-mediated endocytosis,
7
Figure 1.2 A) 3D structure of globular HA protein. HA0 undergoes proteolytic cleavage into 328
amino acid HA1 (green) and 222 amino acid HA2 subunits (cyan) (structure from Rachakonda
2006). B) Schematic representation of the HA protein. HA0 has an amino terminal signal peptide
(SP) and a carboxy-terminal 38 aa transmembrane domain (TM) followed by a short cytoplasmic
domain (CD). HA1 has several glycosylation (G) sites.

8
when the M2 ion channel encounters the low pH of the endosome inside the host cell, eventually
leading to viral uncoating. This occurs via the dissociation of the M1 from the ribonucleoprotein
(RNP), a critical step in the infection process (Wang et al., 1995). RNP is formed by binding of
the viral nucleoprotein (NP) to the viral RNAs, and this bound complex is the active particle
responsible for viral transcription and replication (Klumpp et al., 1997).
Other viral proteins include non-structural proteins 1 and 2 (NS1 and NS2), involved in
viral processing (Lin et al., 2007) and the host anti-viral response, and the viral RNA polymerase
subunits PB1, PB2, and PA.
1.3 Evolution of influenza viruses and avian influenza virus
Influenza virus evolution occurs through two distinct processes, antigenic drift and
antigenic shift. Antigenic drift represents mutations leading to slight antigenic changes incurred
by the circulating HA or NA subtype within a population over a period of time (Subbarao, 2006).
Antgenic drift does not cause the HA subtype to change, but is sufficient to necessitate a newly
designed seasonal influenza vaccine each year because antibodies can no longer neutralize, or
can only weakly neutralize, the mutated form of the virus (Subbaroao, 2006). In contrast,
antigenic shift represents a significant change in which a circulating HA or NA subtype is
exchanged either for a different one, or for the same subtype from a different virus. This creates
a mosaic virus which then may be introduced into an immunologically naive population.
Antigenic shift occurs when there is a genetic reassortment of different influenza viruses
within the same cell in a common host, infected by two different HA (or NA) subtype viruses.
The most recent example of this type of shift is that which resulted in the 2009 HIN1 pandemic,
which originated and reassorted in swine (Vijaykrishna et al., 2010). This novel virus was the

9
result of a quadruple reassortment event in which classical swine H1N1, North American avian
H1N1, human seasonal H3N2 and Eurasian avian-like swine H1N1 viruses all reassorted in
swine, which acted as a mixing vessel for the three, and subsequently infected humans
(Schnitzler and Schnitzler, 2009). While different influenza virus proteins came from these
various sources, the HA was linked to classical North American swine and the NA originated
from Eurasian avian-like swine viruses (Schnitzler and Schnitzler, 2009).
Influenza virus is endemic in many bird species, including migratory birds and
waterfowl. While generally asymptomatic in wild birds, which serve as a natural reservoir for the
virus, some influenza viruses can be extremely pathogenic in poultry. There are two distinctive
pathotypes of avian influenza (AI) viruses based on their ability to cause disease in chickens
(Alexander, 2000; Booy et al., 2006): low pathogenicity AI (LPAI) or high pathogenicity AI
(HPAI). LPAI viruses can occur in domestic chickens and are not typically lethal (Subbaroao,
2006), while HPAI viruses can cause severe disease. The majority of avian influenza viruses are
LPAI viruses, and are comprised of all HA subtypes. In contrast, HPAI is extremely lethal and to
date has traditionally involved only the H5 and H7 subtype viruses (Subbaroao, 2006).
A HPAI virus H5N1, which emerged in domestic poultry in the late 1990’s in Asia,
carries significant pandemic potential due to its observed capability for avian to human
transmission (Webster, 2006). This virus originated in geese in the Guandong region of China in
1996, and was the initial source of influenza virus which later infected a child in 1997 and
resulted in the death of eighteen other individuals in Hong Kong (Lignon, 2005). Further, despite
the culling of infected poultry following the outbreak, this virus still circulates in wild geese and
ducks within China, and has since been responsible for other H5N1 human infections (Webster,
2006). Normally, avian and human influenza viruses preferentially bind to receptors with

10
saccharides that terminate at sialic-acid α2, 3 galactose (SAα2,3gal), and SAα2,6gal, respectively
(Caroll et al., 1981). For a HPAI H5N1 virus to be directly transmitted from birds to humans, it
must have undergone a mutation which allowed for recognition of SAα2,6gal receptors.
However, because the virus lacks sustained human-to-human transmission, recognition of a
SAα2,6gal receptor must be limited (Yamada et al., 2006). In order for this HPAI H5N1 virus to
cause a human pandemic, it must mutate further to recognize SAα2,6gal with greater efficiency
than it currently does (Yamada et al., 2006).
In addition to the obvious threat HPAI poses to human health, the detrimental effects of
this virus on the poultry industry are also significant. HPAI is currently present in poultry farms
all over the world, particularly in developing countries. In China, HPAI H5N1 is more
widespread than in other parts of the world, and this has been attributed to a number of factors.
First, 70% of poultry production occurs in backyard flocks, meaning that many humans tend to
be in close proximity to live chickens daily (Peiris et al., 2007). Second, live poultry markets are
customary in China, and often include ducks and other waterfowl, which can be asymptomatic
and shed the virus for up to 17 days (Peiris et al., 2007). Once HPAI H5N1 has been introduced
to a live poultry market, eradicating the outbreak becomes nearly impossible (Peiris et al., 2007).
Finally, many poultry farms are located in remote areas of China, where access to veterinary care
may be limited, so improper or non-identification of HPAI H5N1 virus results in endemics.
Chickens inoculated with HPAI H5N1 virus have a mortality rate of up to 75% in a
laboratory setting, however flock mortality can be up to 100% following natural infection. Thus
the impact of HPAI on the economies of countries that strongly rely on poultry production can be
devastating (Swayne and Suarez, 2000 and Webster et al., 1992). Consequently there is a
substantial need for a reliable and universal vaccine-based control strategy in poultry, along with

11
a strong commitment from political leaders, veterinarians and public health officials to ensure
successful implementation and surveillance of vaccinated and infected birds.
1.4 HPAI control strategies in humans
In Canada, human influenza virus surveillance is by the Public Health Agency of Canada
(PHAC) and in coordination with the World Health Organization (WHO). The PHAC collects
data on confirmed influenza cases, school absenteeism, and circulating influenza viruses, and
reports weekly on activity within Canada. This information is provided to the WHO and is used
in part to develop official recommendations for the components of the next seasonal vaccine.
The currently recommended and used vaccine is a trivalent inactivated vaccine (TIV), which is
produced in chicken embryos. In general, two influenza A viruses and one influenza B virus are
present in the seasonal vaccine. For instance, in February 2012, the WHO, based on data
collected from September 2011 to January 2012, recommended that the three candidate influenza
viruses for the 2012/2013 northern hemisphere vaccine be: A/California/7/2009 (H1N1) pdm-09-
like virus, A/Victoria/361/2011(H3N1)-like virus, and B/Wisconsin/1/2010-like virus (WHO,
2012). The names of human influenza viruses are based on the genus, geographic location of
origin, isolate number, year of origin and subtype, respectively. For instance, the official name
for one isolate of the pandemic influenza H1N1 virus of 2009 is: A/Mexico/4108/2009 (H1N1)
(WHO, 2010).
Import of animals and animal products which may have been exposed to influenza virus
is strictly regulated. In Canada, this responsibility falls primarily under the Canadian Food
Inspection Agency (CFIA), and the Canadian Border Control Services (CBCS), which carry out
surveillance via the Canadian Notifiable Avian Influenza Surveillance System (CanNAISS).
12
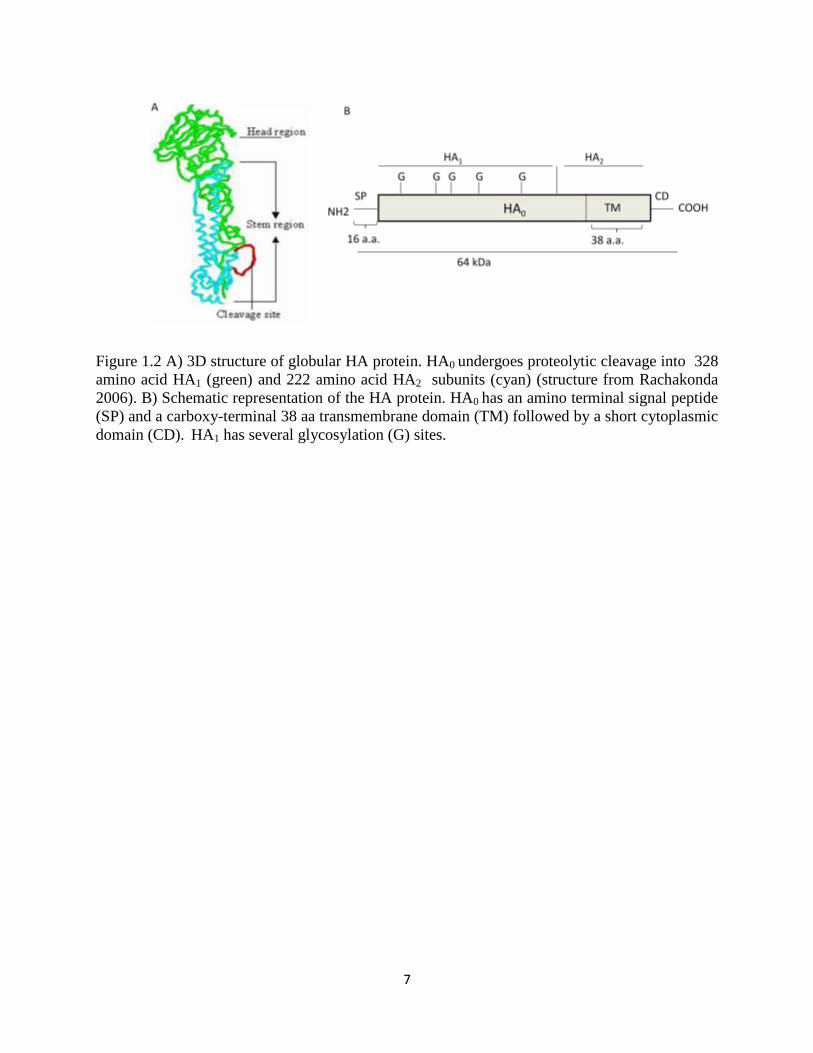
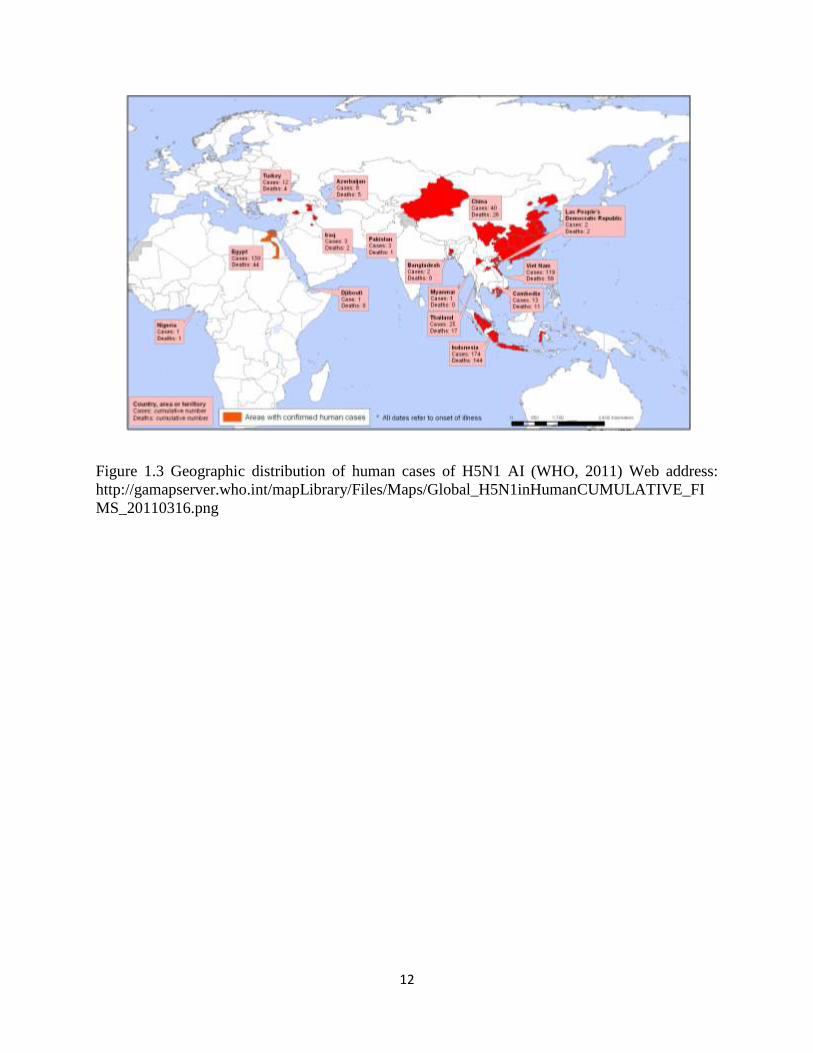
Figure 1.3 Geographic distribution of human cases of H5N1 AI (WHO, 2011) Web address:
http://gamapserver.who.int/mapLibrary/Files/Maps/Global_H5N1inHumanCUMULATIVE_FI
MS_20110316.png
13
This surveillance system carries out a number of activities, including: wild bird
surveillance, passive and targeted surveillance when clinical signs of avian influenza are
reported, pre-slaughter surveillance in commercial poultry, hatchery supply flock surveillance,
and voluntary surveillance in the poultry genetics export sector (CFIA, Government of Canada,
2012). The Canadian Government also follows guidelines established by the WHO which state
that those AI viruses with high pathogenicity, as well as all AI viruses of the H5 and H7
subtypes, regardless of pathogenicity, must be reported to the Canadian Food Inspection Agency
(CFIA). Moreover, import of chickens and chicken products from countries where avian
influenza virus outbreaks are frequent or widespread is strictly prohibited. Currently, for
example, import of birds from China, Bangladesh, Egypt, India, Indonesia and Vietnam is
banned due to the strong presence of HPAI AI in these areas.
Though current vaccine strategies in humans are sufficient for managing seasonal
influenza virus, they do have some distinct limitations. For instance, the production of virus in
chicken embryos is rather slow, and typically takes anywhere from 7 to 11 months (Booy et al.,
2006) to produce and scale up, and therefore would be insufficient to respond in an emergency
situation, such as a pandemic, or in the event of a new or late-appearing strain. Additionally,
vaccination of an entire population with an egg-based vaccine is unlikely, since those with egg
allergies and other sensitivities may be less inclined to be vaccinated even with the availability of
non-egg derived vaccines. Further, a problem that applies to H5N1 avian influenza virus
specifically is that the virus kills chicken embryos, and therefore less vaccine can be produced,
making the production process more costly. This in itself poses significant problems when
considering that HPAI H5N1 carries pandemic potential, as sufficient and reliable vaccine
production would be an absolute necessity in an emergency situation. Additionally, the loss of
14
embryos due to highly virulent H5N1 in the development process would be extremely costly.
Clearly, these inadequacies with the traditional vaccine necessitate the development of a new
vaccination strategy that will be sufficient to handle H5N1 avian influenza virus and overcome
some of these current challenges.
1.5 HPAI control in poultry
In conjunction with an effective human HPAI H5N1 influenza virus vaccine,
immunization of poultry represents an important strategy for HPAI H5N1 control and
prevention. Currently two vaccines expressing HA, one which is an inactivated whole virus
vaccine and the other which is a recombinant fowlpox virus vectored vaccine (Swayne et al.,
2000), have been approved for vaccination of poultry (Subbaroao, 2006). While this practice has
not yet been officially approved as a control mechanism in Canada (CFIA, 2009), other countries
including Italy (Capua et al.,2003) the USA (Halvorsen et al., 2002 ), Pakistan (Naeem et al.,
2006) and Mexico (Villareal and Flores, 2003) have successfully vaccinated against circulating
LPAI viruses, suggesting that vaccination of poultry against HPAI viruses may also be
promising.
In Canada and elsewhere, there are a few key barriers to the successful implementation of
HPAI H5N1 vaccination in poultry. First, unless a dependable strategy is implemented to
differentiate vaccinated from infected animals (DIVA), it is difficult to ensure that antibodies
present in chickens are due to vaccination rather than a new or pre-existing influenza virus
infection. Because live birds showing serological evidence of influenza virus infection cannot be
exported or imported according to Canadian law (CFIA 2012), a reliable DIVA is imperative in
order to execute successful vaccination of poultry. While several candidate vectors for antigen
15
have been established for the DIVA approach, all require diligent serological monitoring and
therefore can be both laborious and expensive.
Enzyme-linked immunosorbent assays (ELISAs) may be promising in the development
of a DIVA. An ELISA is a rapid serological diagnostic test which entails exposing a serum
sample to antigen and visually observing, using an alkaline phosphotase (most commonly)
conjugated secondary antibody, whether that serum contains antibodies against it. ELISAs are
often employed as an initial test in the diagnoses of various diseases. For example, ELISAs are
used as an initial test in determining whether an individual is producing anti-HIV antibodies
(Tamashiro et al., 1993).
Another barrier associated with the successful execution of poultry vaccination is that due
to its bio-safety containment requirements, live HPAI H5N1 virus cannot be used as a source of
HA in many laboratories. As a result, the only way to monitor antibody response to an H5N1
virus vaccine is to use an alternative source for H5 HA. A potential expression vector to produce
large amounts of biologically active HA, safely and robustly, is the Baculovirus Expression
Vectors System (BEVS).
1.6 Baculoviruses as expression vectors
Insect baculoviruses provide a potential effective vector for the development of a subunit
vaccine or diagnostic antigen based on HA or NA. Baculoviruses, belonging to the
Baculoviridae family, are a large group of covalently closed, circular, double–stranded DNA
viruses with genomes ranging from 88-153 kb (Blissard et al., 1990). Baculoviruses infect at
least six hundred insect species (Martignoni et al., 1986) and are classified into four genera:
Alphabaculovirus, Betabaculovirus, Deltabaculovirus and Gammabaculovirus (9th
International

16
Committee on the Taxonomy of Viruses (ICTV) report, 2011). Baculoviruses have two distinct
phenotypes, the occlusion derived virus (ODV), required for environmental dissemination of the
virus, and the budded virion (BV), necessary for systemic spread of the virus in the infected
insect (budded virion depicted in Fig 1.4). The genus Alphabaculovirus is comprised of all
lepidopteran-specific nucleopolyhedroviruses and notably, contains the prototypic and most
characterized baculovirus, Autographica californica multiple nucleopolyhedrovirus (AcMNPV),
which is also the basis for most baculovirus expression vectors. Baculoviruses are attractive
vectors for the expression of foreign proteins for a few key reasons. First, in comparison to other
viral vectors, e.g. adenovirus, baculovirus is capable of incorporating extremely large DNA
inserts. In fact, the successful development of a recombinant baculovirus containing a 38 kb
DNA insert producing adenoviral proteins in mammalian cells has been demonstrated
(Cheshenko et al., 2001). These authors predict that the upper packaging limit of baculovirus
may even exceed 50 kb. Other properties which make baculoviruses excellent for use in
expressing foreign proteins include the simplicity and speed in which recombinant baculoviruses
can be generated, their ability to concurrently incorporate numerous genes, and their capacity to
transduce a wide variety of cell types, including even mammalian cells (Hofmann et al., 1995;
Condreay et al., 1999; Shoji et al., 1997). Further, because recombinant baculoviruses replicate
in insect cells, post-translational modifications critical for the production of biologically active
protein from eukaryotic sources still occur. In recombinant baculovirus-expressed HA, for
example, when processed in insect cells, recombinant HA still undergoes proteolytic cleavage
and glycosylation, and these cells produce properly folded, biologically active protein (Kuroda et
al., 1986).

17
Figure 1.4 Schematic of baculovirus budded virion morphology (ExPASy Bioinformatics
Resource Portal, www.expasy.org, 2012).

18
Baculoviruses have been used very successfully as vectors for foreign genes both in vitro
and more recently, in vivo (Bai et al., 2008; Facciabene et al., 2004) particularly in the
development of pharmaceuticals, gene therapies, diagnostic reagents and vaccines. The latter
application represents one of the more popular uses of baculovirus expression vector systems,
and several vaccines have been developed which use recombinant AcMNPV as a delivery
vehicle for immunogenic proteins.
Examples of recombinant baculovirus-based vaccines are numerous. Some notable
vaccines developed using baculovirus expression vector systems (BEVS) include anti-malaria
vaccines, which use BEVS to express either Plasmodium falciparum circumsporozoite protein
(CP) (Strauss et al., 2007), or Plasmodium yoelli merozoite surface protein (Yoshida et al.,
2010), a SARS-like corona virus vaccine construct which expresses the immunogenic spike
protein to elicit an immune response (Bai et al., 2008), a Newcastle disease virus (NDV) vaccine
which expresses hemagglutinin-neuraminidase (Nagy et al., 1994) and a vaccine targeting
porcine reproductive and respiratory syndrome virus, expressing the GP5 and M proteins (Wang
et al., 2007) just to mention a few. Of current interest to human disease and cancer prevention is
the human papillomavirus (HPV)-like-particle vaccine Cervarix (GlaxoSmithKline), produced in
insect cells BEVS (Senger et al., 2009). Cervarix, which was recently approved for use in
Canada, is the first-ever baculovirus-based vaccine to be commercialized. The fact that this type
of vaccine has been approved by the designated governing bodies based on safety and efficacy
studies further confirms baculovirus as a promising vaccine vector for foreign protein.
Additionally, it promotes further research into large-scale production of foreign proteins as
reagents or antigen in diagnostics, for a number of potential applications in research, healthcare,
and industry.

19
1.7 Baculovirus vector systems, overexpression and display
AcMNPV was developed into a protein expression system in the early 1980’s (Smith,
1983), and since then, the precision and versatility with which balculoviral expression can be
accomplished has only improved. The traditional method for development of baculovirus
expression vectors depended on homologous recombination, and co-transfection of insect cells
with both baculovirus and transfer plasmid DNA containing the gene of interest (Kost et al.,
2005). This method, which was immensely laborious and generally yielded less than 0.1%
recombinant viral progeny (Luckow et al., 1993), was later replaced by a bacmid expression
system, Bac-to-Bac (Invitrogen) (Fig. 1.5), which was originally developed by Luckow et al.
(1993). This bacmid system uses a baculovirus-containing transfer vector equipped with the very
late polyhedrin and/or p10 promoter, gentamicin resistance gene, and two Tn7 elements which
allow for localized transposition of the expression cassette into the baculovirus genome. The
recombinant bacmid is harvested and transfected into Spodoptera frugiperda (Sf21) insect cells
initiating an infection and resulting in the production of recombinant virions. The supernatant
from the transfection is then collected as the P1 recombinant virus stock, and then can be
amplified. Once the recombinant virus is amplified and titred, it can be used for experimental
infections, and if desired, for the development of diagnostic reagent. In 1995, a novel system in
which a baculovirus could display a foreign protein of interest on the GP64 baculovirus major
envelope protein was established (Boublik et al., 1995) (Fig.1.6). GP64 is a trimeric 64 kDa
protein whose function is to facilitate pH-dependent membrane fusion, and initiate viral entry.
GP64, which is 512 amino acids, has an N-terminal signal peptide (which is part of a
glycosylated N-terminal ectodomain), and a C terminal transmembrane domain followed by a
small cytoplasmic domain (Kadlec et al, 2008). GP64 is packaged in dense peplomers (Monsma

20
Figure 1.5 Flowchart of generation of a recombinant baculovirus using the Bac-to-Bac System
(Invitrogen).

21
et al., 1996) on the surface of the baculovirus virion, and can be neutralized by anti-GP64
antibodies, illustrating the importance of this protein in the infectivity of the virus. In studies
where the AcMNPV GP64 protein was inactivated, cell-to-cell transmission of baculovirus was
limited, suggesting that without GP64, the likelihood of a successful virus infection is greatly
minimized (Monsma et al., 1996).
Because of its role in the infectivity of baculovirus, it has been proposed that fusion of a
foreign protein or antigen directly to GP64 might provide more efficient expression and antibody
detection. While GP64 display has not been extensively studied, the proof-of-principle study
showed that two proteins, glutathione-S-transferase (GST), and HIV major envelope protein
gp120, can successfully be displayed on the baculovirus surface (Boublik et al., 1995).
Researchers suggest that this display system might be superior to protein overexpression because
it facilitates the display of foreign protein directly on the surface of budded virus particles, while
the immunogenic activity of the foreign protein remains intact (Boublik et al., 1995), ultimately
allowing for use of the budded virions rather than cellular lysates or purified protein as a source
of the antigen.
In a recent study, the human enterovirus VP1 major capsid protein was inserted between
the GP64 signal peptide and ectodomain (Meng et al., 2011). Using the baculovirus expression
system, the fused GP64 protein was then expressed under a novel promoter, the white spot
syndrome virus immediate early 1 (ie1) promoter. This promoter is active in both insect and
mammalian cells, allowing for recombinant protein expression of transducer bacmids in both
Sf21 cells and mice (Meng et al., 2011). The use of this promoter in conjunction with GP64
display encourages application of this baculovirus expression method as an alternative vaccine
delivery platform.

22
While GP64 surface display represented a novel achievement in the field of baculoviral
expression, and has some clear advantages such as its ability to actively display immunogenic
proteins of other viruses directly on its surface, it does have some limitations. First, there is some
speculation that because the foreign protein may alter the 3D structure of GP64, the infectivity of
the recombinant baculovirus might also be compromised (Kukkonen et al., 2003). Second, with
GP64 display, the protein of interest can be fused to only the N-terminus of the protein because
when it was fused to the C-terminus or incorporated into the middle of GP64, virus was
recovered, but the fusion protein was not effectively expressed (Boublik et al., 1995). Being able
to fuse the protein of interest to only GP64 could make expression of foreign protein more
challenging depending on the properties of the fusion gene (Boublik et al., 1995).
The newest baculovirus display method, capsid (VP39) display, involves fusion of
foreign protein directly to the baculovirus major capsid protein (Fig 1.6). VP39, the major capsid
protein forming the protective protein shell which surrounds the genetic material, has a notably
versatile structure that can accommodate fusions of a foreign peptide to both the N and C
termini, making it a practical and promising new baculovirus display system, analogous to phage
display. This system, which was developed in 2003 (Kukkonen et al., 2003), has not been
extensively reported on in the literature. There are only two other groups known to have
successfully fused foreign protein to the baculovirus capsid. The first group, Song et al. (2010)
fused ZnO, an inorganic peptide complex to the baculovirus capsid and a high titre of
recombinant virus was subsequently produced. While this paper substantiates the potential
usefulness and effectiveness of capsid display, the field to which the method was applied was

23
Figure 1.6 Schematic representation of GP64 fusion and VP39 fusion, and depiction of where the
fusion proteins should be located on the budded virion or nucleocapsid (figure adapted from
Kukkonen et al., 2003). This schematic is not accurate.
24
chemical technology, rather than biological or medical technology. The second and more recent
publication, which is more applicable to the field of molecular biology, describes the use of
VP39 major capsid protein as a delivery vector for ovalbumin (OVA) in mice (Molinari et al.,
2011). OVA was successfully fused to the carboxy terminus of the VP39 protein, and was shown
to effectively access the MHC I pathway for presentation on CD8 cells (Molinari et al., 2011).
This research established that baculovirus capsid can successfully display heterologous antigens
that retain their biological activity in the cell (Molinari et al., 2011), demonstrating preliminary
evidence that baculovirus capsid display is an effective form for baculovirus-based expression.
1.8 Applications of baculoviral foreign gene expression to influenza virus research
Because of the limitations to the current trivalent influenza virus vaccine and in light of
the fact that another influenza virus pandemic in the 21st century is highly likely, several research
entities are investigating more effective vaccine alternatives, for both humans and poultry.
Further, because of the pathogenicity of HPAI H5N1 and its increasing distribution throughout
the world, there is a renewed sense of urgency within the scientific and health communities to
develop a pandemic prevention plan that includes vaccination of chickens. To that end, a number
of alternative influenza virus vaccines are currently undergoing stage 1 clinical trials. For
instance, the efficacy of a vaccine containing HA fused with a flagellin ligand from a toll-like-
receptor (TLR) and expressed in E. coli (Huleatt et al., 2008) is currently being investigated by
Vaxinnate Corp. Other examples include: an HA-containing human adenovirus-vectored
vaccine produced by Vaxin (Toro et al., 2007), and a vaccine in which matrix 2 (M2) protein is
linked to a Hepatitis B virus-derived virus-like-particle (VLP), a non-infectious particle that
resembles an influenza virion but contains no genetic material (Fiers et al., 2009). An M2 protein
vaccine may be advantageous because this protein tends to be highly conserved in both avian and
25
human influenza viruses and could provide protection against different subtypes (Fiers et al.,
2009).
Recombinant baculoviruses have also been used in a variety of contexts to corroborate
evidence that influenza virus proteins can successfully be expressed by baculoviruses and elicit
an immune response in vivo. For instance, Tao et al.(2009) used an avian H5N1 virus isolate to
develop a VLP HA, NA and M1-containing influenza virus vaccine, and after assessing this
vaccine in vivo, using a mouse model, confirmed that it was indeed sufficient for conferring
protection against H5N1 isolates (Tao et al.,2009). This finding indicates that the utilization of
HA, NA and M1 proteins from an avian-source influenza virus for the development of a vaccine
should not only confer resistance to that particular strain of influenza virus, but also against
circulating human strains which carry the same HA and NA subtypes. Another study of a similar
nature found that a recombinant baculovirus-based 2009 pandemic H1N1 VLP vaccine
expressing the same three proteins as the one aforementioned, HA, NA and M1, conferred
protective immunity in ferrets against challenge with H1N1 influenza virus (Pushko et al., 2005).
These studies, in combination with research that indicates influenza virus VLPs are capable of
conferring resistance to a broader array of antigenic isolates (Bright et al., 2007) make
baculovirus-based VLPs an attractive option when considering the different HPAI H5N1
influenza viruses, particularly in a pandemic situation.
Other examples of influenza virus vaccines developed in recombinant baculoviruses
include: an HA-expressing vaccine derived from HPAI H5N1 in baculovirus pseudotyped with
vesicular stomatitis virus glycoprotein (Wu et al., 2009), a recombinant vaccine expressing HPAI
H5N1 HA on the surface protein GP64 of the baculovirus BmNPV (Jin et al., 2008), and a
recombinant vaccine expressing HPAI H5N1 HA on GP64 of AcMNPV (Tang et al., 2010).
26
Clearly, baculoviruses have been employed extensively as a vector for the development of a
variety of influenza virus targeted vaccines. Interestingly, a baculovirus-based vaccine, Flublok,
manufactured by Protein Sciences, has completed all necessary phases of testing and is currently
seeking FDA approval. This vaccine, which is trivalent and recombinant, expresses HA as
antigen from the three circulating seasonal strains (Cox et al., 2008) , and researchers are
optimistic that it could ultimately replace the current vaccine.
While the aforementioned research emphasizes the capacity of baculovirus to effectively
package and display immunogenic influenza virus proteins, it fails to provide insight into the
application of these recombinant baculoviruses for other relevant purposes. For instance,
recombinant baculoviruses expressing HA might be a better diagnostic source than HPAI H5N1
to measure the immune response of an influenza virus vaccine using ELISAs.
Several avenues related to baculovirus expression have yet to be explored. For instance,
very few publications exist in which baculovirus capsid display has been employed or studied,
and it would be interesting to determine the usefulness of this new approach in expression of
HPAI H5N1 influenza virus proteins. Additionally, a comparison of different baculovirus
expression systems and their efficiency has not been conducted to date. If the advantages and
disadvantages to protein overexpression, capsid display, and surface display could be determined
in controlled experiments using the same foreign protein(s), then it might help identify the best
baculovirus expression system for this purpose. Some ways in which these expression systems
could be compared include their ability to incorporate foreign protein for use as antigen (e.g.
their ability to elicit antibody response by a vaccine) and the amount of functional foreign
protein actually produced. If further research helps to optimize baculovirus expression, the use of
recombinant baculovirus as antigen in DIVA analysis or for vaccine development may be

27
deemed more efficient and reliable, and ultimately may result in the more widespread adoption
of baculovirus-based diagnostic antigens for the incorporation into a pandemic preparedness
strategy involving immunization of poultry against HPAI H5N1.
1.9 Research objectives and experimental design
In response to the need for the development of a robust and effective vaccine for poultry,
Nagy et al. (unpublished) have generated prototype fowl adenovirus vectored HA-based vaccine
(FAdV-HA). The recombinant vector employed for the development of this candidate vaccine
was described extensively by Corredor and Nagy in 2010 (Corredor and Nagy, 2010). In order to
make this vaccine marketable, there must be a rapid test to show that vaccinated chickens are
actually producing anti-HA antibodies effectively. This test must be cost-effective, rapid and
efficient. Due to the highly pathogenic and infectious nature of H5N1 virus, whole live virus is
unsuitable and unsafe for use as antigen, and therefore, an alternative source of H5 HA is
required. An ELISA using a heterologous source for antigen (i.e. antigen not produced in FAdV)
may represent an effective way to test sera from chickens vaccinated with FAdV-HA.
The major objective of this research was to establish the most proficient vector for
producing hemagglutinin (HA) from highly pathogenic avian influenza (HPAI) H5N1 virus
through BEVS. To achieve this end, the research was subdivided into three objectives.
The first objective was to generate several H5N1 HA-expressing recombinant
baculoviruses, using three expression strategies: protein overexpression, envelope (GP64)
display, and capsid (VP39) display. The latter of the three is a newly developed approach, and
the expression of HA via this method would represent a novel achievement in the field. The
experimental basis for comparison of these expression systems was mainly through monitoring

28
HA expression levels in cell lysates infected with each recombinant baculovirus, using SDS-
PAGE and Western immunoblot. Additionally, recombinant virus growth kinetics in the insect
cell were compared to each other and wild-type AcMNPV. Finally, the level of HA activity in
Sf21 insect cells infected with each recombinant baculovirus was compared by using
hemagglutination and hemadsorption assays.
The second objective was to compare each recombinant BV as an alternative to H5N1 as
a source of H5 HA antigen to detect anti-HA antibodies produced following vaccination of
chickens with FAdV-HA. The experimental approach was to conduct SDS-PAGE and Western
immunoblots with sera from chickens vaccinated with FAdV-HA as the primary antibody.
The final goal of this research was to generate a recombinant baculovirus expressing the
immunogenic influenza virus protein neuraminidase (NA) as an alternative antigen to be
eventually used in conjunction with recombinant baculoviruses expressing HA, with the ultimate
goal of applying it to an ELISA-based DIVA. While the ELISA has yet to be developed, the
principle for the experimental approach is dependent on the generation of a baculovirus-
expressed NA. If two recombinant baculoviruses are used as antigen in two separate ELISAs
conducted in tandem, serum from an H5N1 influenza virus infected chicken would be positive
for both HA and NA. Conversely, if the chicken was vaccinated with our prototype FAdV-HA,
then the chicken serum should be positive only in the HA but not NA based ELISAs
It was hypothesized that envelope display is the most optimal expression system for HA,
because unlike protein overexpression HA should be incorporated directly into the baculovirus
virion, rather than just in the insect cells. Further, and unlike the major capsid protein, the major
envelope protein is expressed directly on the surface of the virion and cells, and is processed

29
through the ER, suggesting that HA should undergo its regular post-translational modifications
and therefore would perhaps be more likely to be detected by anti HA antibody.

30
Chapter Two: Materials and Methods
2.1. Cells and Virus
2.1.1 Insect cell culture
Spodoptera frugiperda 21 (Sf21) and Trichopulsia ni. (Hi-FiveTM
) cells were maintained
at 27°C in Graces Insect Medium (Invitrogen), and were supplemented with 10% foetal bovine
serum (FBS) (Invitrogen) and 0.1% penicillin. Cells were routinely sub-cultured at 3 day
intervals (when they reach about 80% confluency), in a 1:5 ratio. Sf21 cells were also grown in
suspension, but for infection and assessment of virus activity, these cells were seeded as
monolayers in T-25 or T-75 flasks. All aspects of cell culture maintenance were performed in a
laminar flow hood.
2.1.2 Influenza virus strain, HA and NA
cDNA clones of HPAI A/489/Hubei (H5N1) HA and NA in separate PMD-18T cloning
vectors were obtained from Dr. Chongyi Zheng and sent by Dr. Qingzhen Liu, both from Wuhan
University in China, and stored at -70°C. This strain of influenza virus was amongst one of the
first isolated in Hong Kong during the initial HPAI H5N1 outbreak, and is considered to be of
clinical significance by the WHO. Glycerol stocks of PMD-18T: NA and PMD-18T: HA were
streaked on LB medium containing 50 µg/ml carbenicillin. The next day, individual colonies
were picked, and overnight cultures were grown using 0.1% ampicillin to select for growth of
bacteria carrying the gene of interest (either HA or NA).
2.2 General DNA manipulation
2.2.1 Bacterial cultures and plasmid DNA isolation

31
Unless otherwise stated, all DNA clones were grown in DH5α E. coli cells on selective
Luria-Bertani (LB) liquid or agar (16 mg/ml) growth media containing ampicillin (100 µg/ml) at
37°C. A single E. coli DH5α colony was picked, inoculated in 5 ml of LB supplemented with
0.1% ampicillin to select for growth of bacteria containing HA or NA plasmids, and rocked for
16 hours. Unless otherwise stated, plasmid DNA was isolated using either the GeneJET Plasmid
Miniprep Kit, according to the manufacturer’s instructions (Fermentas Life Sciences or
BioBasic). Unless otherwise stated, all DNA samples were subjected to electrophoresis at 15
volts/cm in 0.8% agarose gels supplemented with 200 ng/ml ethidium bromide.
2.2.2 Restriction enzyme digestions and polymerase chain reaction (PCR)
Unless otherwise stated, all restriction enzyme digestions were carried out in 50 µl
reactions, using 1 µl of Fermentas Fast Digest restriction enzymes, 5 µl of 10x FastDigest Green
buffer, and 5 µl of template, at 37°C for one hour. For cloning, PCR amplification was
conducted using the Novagen Kod Hot Start Polymerase Kit and the BioRad MyCycler Thermal
Cycler. In contrast, for PCR screening, Taq polymerase was employed. PCR conditions for both
Taq and Kod polymerase, unless otherwise stated, are summarized in Table 2.1.
Table 2.1 PCR Conditions for either Kod or Taq Polymerase based on manufacturer’s
instructions
Step Kod Polymerase Taq Polymerase
1. Polymerase 95°C for 5 Minutes 95°C for 5 Minutes
2. Denaturation 95°C for 20 seconds 95°C for 1 Minute
3. Annealing Lowest Primer Tm for
10 seconds
Lowest Primer Tm for
30 seconds
4. Extension 70°C for 10
seconds/kb
70°C for 1 minute /kb
Repeat Steps 2-4 25 Cycles 25 Cycles
32
For cloning, PCR amplicons were purified using Wizard SV Gel and PCR Column Clean-up
System (Promega) according to the manufacturer’s protocol.
2.2.3 Plasmid construction and cell transformation
DNA derived by PCR, restriction digestion, or plasmids were cloned into various vectors.
Following electrophoresis, gel purification was accomplished using the Lamda Biotech Inc
Direct-Gel Spin DNA Recovery Kit (Catalogue # D210). Ligation reactions were prepared using
T4 DNA Ligase (Invitrogen) and 5x T4 DNA Ligase Buffer (Invitrogen), and incubated at room
temperature for one hour or overnight at 4°C. Transformation of ligated DNA was conducted by
incubating 5-7 µl of the ligation reaction with 100 µl of CaCl2 competent E. coli DH5α cells on
ice for thirty minutes, followed by a ninety second heat-shock at 42°C and incubated on ice for
five minutes. Transformed cells were then plated on LB-containing agar plates supplemented
with 50 µg/ml carbenicillin and incubated at 27°C overnight. The next day, individual colonies
were picked and isolated as previously described.
2.3 Generation of recombinant virus constructs
2.3.1 Removal of the histidine tag (6x-His tag) from pFastBacB (Invitrogen)
To ensure effective detection and prevent potential complications with detection of
recombinant HA, which has an N-terminal signal peptide that is cleaved during translocation to
the ER, the 6x-His epitope tag was removed from pFastBacB via inverse PCR. Inverse forward
and reverse primers were designed (Table 2.2) which amplified pFASTBacB, but excluded the
start codon and the His-tag (Figure 2.1). Successful removal of the His-tag was confirmed by
sequencing. The manipulated vector was named ΔHispFastBacB.
33
Figure 2.1 Schematic representation of ΔHispFastbacB. The Histidine tag has been removed via
inverse PCR (Figure adapted from Invitrogen).
34
Table 2.2 Primers used for the generation of all recombinant baculoviruses. Restriction sites are
italicized and underlined. Epitope tags are bolded and underlined.
End Product Gene Forward 5’-3’ Reverse 5’-3’
ΔHispFastBacB
FastBac TTTGGGCCCTGGATCC
GGAATTCAAAGGC
AAAGGGCCCTGGT
TTCGGACCGAGATCC
AcHAFLAG HA AAACTCGAGAAAATGG
AGAAAATAGTGCTTCTTC
AAAAAGCTTACTTGT
CGTCATCGTCTTTGT
AGTCATCTGAACTCAC
AAATTTAAATG
AcHA:GP64FLAG GP64 AAAGGATCCCTGCAGACTAG
TGAGCACTGCAACGCGCAAA
AAAAAAGCTTTTAATAT
TGTCTATTACGGTTTC
AcHA:GP64FLAG HA AAAAGGATCCCAAAATGG
AGAAAATAGTGCTTC
AAAACTAGTTTTGTCGTC
ATCGTCTTTGTAGTCGT
AAGTTCCTATTGATTCCAA
TTT
AcVP39: HA
FLAG
VP39 AAAGGATCCATGCGGCCGCT
GCAGGGAGGAGGAGGAAGTG
CGCTAGTGCCCGTGGG
AAAAAGCTTTTACTC
GAGACTAGTGACGGC
TATTCCTCCACCT
AcVP39: HA
FLAG
HA AAAACTAGTGATGACTACAAA
GACGATGACGACAAGCAGAT
TTGCATTGGTTACCATG
TTTCTCGAGGTAAG
TTCCTATTGATTCCA
ATTTT
AcHA:VP39
FLAG
VP39 AAAGGATCCATGCGGCCGC
TGCAGGGAGGAGGAGGAAG
TGCGCTAGTGCCCGTGGG
AAAAAGCTTTTACTC
GAGACTAGTGACGGC
TATTCCTCCACCT
AcHA:VP39
FLAG
HA AAAGGATCCTGGATGACTA
CAAAGACGATGACGACAAG
CAGATTTGCATTGGTTACCATG
AAAGCGGCCGCATGT
AAGTTCCTATTGATTC
CAATTTT
AcNAHA NA AAAAAGAGCTCATG
AATCCAAATCAGAA
GATAATAAC
AAAAAAGCTTCTAAGC
GTAATCTGGAACATC
TATGGGTACTTGTCA
ATGGTGAATGGC

35
2.3.2 Generation of ΔHispFastBacBHAFLAG
After being prepared from an overnight culture, the HA ORF DNA was amplified via
PCR to introduce 5’ Xho1 and 3’ HindIII restriction sites (Table 2.2). Additionally, the sequence
encoding a FLAG epitope tag (DYKDDDDK) was incorporated into the reverse primer to
introduce the tag on the carboxyl end of HA (Table 2.2). Following PCR amplification and
confirmation via gel electrophoresis (1% agarose, 15V/s), both HA and ΔHispFastbacB (Figure
2.2) were digested with Xho1 and HindIII. The digested template and plasmid DNA were
recovered, ligated and transformed into DH5α E.coli cells. Individual colonies were selected and
PCR screens were conducted using primers specific to the multiple cloning site in the
ΔHispFastbacB vector (Table 2.3) to ensure that the appropriate sized DNA band, of 2 kb was
present when the PCR product was subjected to agarose gel electrophoresis. This construct was
also confirmed to be correct by sequencing.
2.3.3. Generation of ΔHispFastBacBHA:VP39FLAG and ΔHispFastBacBVP39:HAFLAG (VP39
fusion constructs)
To generate the N-terminal fusion construct, ΔHispFastBacBHA:VP39FLAG, the wild-type
VP39 ORF was PCR-amplified from AcΔCC, which represents the baculovirus bacmid with
nothing cloned into the expression cassette. Primers used in this reaction also introduced 5’
BamHI, NotI and PstI restriction sites, respectively (Table 2.2), and 3’ Spe1, BamH1, and
HindIII restriction sites, respectively. Both the PCR product and ΔHisFastbacB were digested
with BamHI and HindIII at 37°C for 1 hour, and DNA was separated via agarose gel
electrophoresis. Appropriate DNA fragments were extracted from the bands and purified from
the gel, ligated and transformed into DH5α E. coli cells. The new construct,
ΔHispFastBacBVP39 was sequenced.

36
Table 2.3 Primers used for PCR screening and sequencing of various clones in ΔHispFastbacB.
Target Forward Reverse
FastBac TCTCGAGGCATGCGGTACC
ACCGAGATCCGCGCCCG
Bacmid-
Universal M13
Primers
GTTTTCCCAGTCACGAC CAGGAAACAGCTATGAC
HA- Internal GGAAAATGAGAGAACTCTAGAC
ATTCGTCACACATTGGGTTTCC

37
Next, to generate the HA:VP39FLAG and VP39:HAFLAG fusions, HA was PCR-amplified,
introducing 5’ BamHI and 3’ Not1, or 5’ SpeI and 3’ XhoI restriction sites, respectively.
Additionally, in order to prevent problems with ER/Golgi trafficking of the VP39 fusions in the
cell, both the 17 amino-acid N-terminal SP (MEKIVLLLAIVSLVKSD), and C-terminal TM
domain (QILSIYSTVASSLALAIMVAGLSLWMCSN) as determined by Tatulian et al. (2000),
were removed from HA in both PCR reactions. Further, the sequence encoding a FLAG epitope
tag (N-DYKDDDDK-C) was incorporated into the reverse (for N-terminal fusion) or forward
primer (for C-terminal fusion) to introduce the tag on either the N- or C-terminal end of HA.
Both the PCR product and ΔHispFastBacB were digested with BamHI and Not1, for the
HA:VP39FLAG construct, or 5’ SpeI and 3’ XhoI for the VP39:HAFLAG construct. Digested vector
and PCR product were then ligated and transformed. PCR screening of this vector using HA
forward and FastbacB reverse primers was conducted (Table 2.3). Additionally, the cloned
products were sequenced.
2.3.4 Generation of ΔHispFastBacBHA:GP64FLAG
The HA ORF was PCR-amplified from the original PMD-I8T cloning vector in order to
introduce a 5’ BamHI restriction site, a C-terminal FLAG tag and a 3’ SpeI restriction site (Table
2.2). Additionally, in order to ensure effective display and trafficking to the ER via the GP64 TM
domain, the sequence coding for the 30- amino acid TM of HA
(QILSIYSTVASSLALAIMVAGLSLWMCSN) as determined by Tatulian et al. (2000), was
removed (Table 2.2) . Both HA and ΔHisFastBacB were digested with BamHI and SpeI and
cloned together as previously described. This construct, ΔHisFastBacBHAFLAG was sequenced.

38
To create ΔHispFastBacBHA:GP64FLAG fusion construct, the baculovirus ORF for major
envelope protein GP64 was PCR-amplified from a previously constructed bacmid (Table 2.2),
introducing a 5’BamHI and SpeI restriction site, as well as a 3’ HindIII restriction site. Both the
PCR product and ΔHisFastBacBHAFLAG were digested with SpeI and HindIII for one hour at
37°C. Digestion reactions were subjected to agarose gel electrophoresis and appropriate bands
were extracted and purified. HA was then ligated into ΔHisFastBacB, and after 1 hour incubation
at room temperature, the reaction mixture was transformed into DH5α E.coli and individual
colonies were selected. Cloned plasmid DNA was sequenced.
2.3.5 Generation of ΔHisPFastbacBNAHA
The cDNA ORF of viral NA in a PMD-18T plasmid (constructed by Dr. Chongyi Zheng
and sent by Dr. Qingzhen Liu, both from Wuhan University in China), was isolated from E. coli.
The NA ORF was PCR-amplified from PMD-18T using forward and reverse primers introducing
a SacI restriction site to the 5’ end of NA and a HindIII restriction site on the 3’ end of NA
(Table 2.2). Further, the reverse primer introduced a C-terminal HA-epitope tag to NA (N-
YPYDVPDY-C). Both ΔHisPFastbacB and the NAHA PCR product were digested with HindIII
and SacI, ligated and the resultant plasmid was transformed into E.coli. The constructs were
further purified as previously described and sequenced.
2.4 Construction, amplification and titration of recombinant baculoviruses
2.4.1 Generation of recombinant bacmids using the Bac-to-Bac System (Invitrogen)
Manipulated ΔHisFastBacB, now containing the gene of interest (GOI), was mixed with
50 µl of ΔCCBac+ Helper Cells (Bac-toBac, Invitrogen) and subjected to electric shock using a
Gene Pulser (Bio-Rad) at 200 mV to initiate homologous recombination via the Tn7attn

39
transposition cassette. Transformants were then recovered at room temperature for four hours
with shaking. Recovered, transformed cells were then diluted to 103 in LB, and these dilutions
were plated on LB containing-plates supplemented with 10 μg/ml kanamycin, 7 μg/ml
gentamicin, 12 μg/ml tetracyclin, and 10 μg/ml chloramphenicol. EZ-Gal (Bioshop) was added
to the plates to allow for blue/white colony selection. Plates were incubated overnight at 37°C.
Transformed colonies were selected and amplified in overnight LB cultures supplemented with 7
μg/ml gentamicin, 50 μg/ml kanamycin, and 10 μg/ml chloramphenicol. Bacmid DNA was then
purified from these cultures.
2.4.2 Purification of bacmid DNA
A modified version of the protocol that accompanies the EZ-10 Spin Column Plasmid
DNA kit (Bio Basic) was used to purify bacmid DNA. Essentially, the protocol was employed
until after the addition of the potassium acetate (Solution 3). After the 1-minute incubation, the
samples were centrifuged for 5 minutes at 12,000 rpm. The supernatant was collected and mixed
with 500 μl of isopropanol and incubated at room temperature for thirty minutes and the samples
were centrifuged at 12,000 rpm for 10 minutes. The supernatant was discarded and 1 ml of 70%
ethanol was added to each sample to wash the DNA. The samples were centrifuged again for 5
minutes at 12,000 rpm and the remainder of the ethanol was removed. Samples were then air-
dried, and 20 μl of sterile elution buffer provided in the EZ-10 Spin Column Plasmid DNA kit
(Bio Basic) was used to re-suspend the recombinant bacmid DNA. PCR screens using universal
MI3 forward and reverse primers (Table 2.2) were conducted to ensure that an insert of the
appropriate size was observed using gel electrophoresis. If no insert was present in the cloned
bacmid, then a 3 kb band would be expected. If the bacmid contained the expected fragment
however, a larger PCR product would be observed.

40
2.4.3 Transfection, amplification and titration of recombinant viruses
Approximately 9 x10⁵
Sf21cells suspended in 2 ml of incomplete Graces Insect Medium
were seeded in 35 mm dishes to obtain a final concentration of 4.5 x10⁵ cells /ml. Plates were
incubated for one hour at room temperature to allow for attachment. For each transfection 5-10
µl of purified recombinant baculovirus DNA diluted in 100 µl of incomplete Grace’s Medium
(ThermoScientific) was combined with 100 µl of Cellfectin (diluted 1:10 in incomplete Grace’s
Medium). After a thirty minutes incubation at room temperature, 800 µl of incomplete Grace’s
Medium was added to each Cellfectin-baculovirus DNA mixture to obtain a total volume of 1
ml, and this was then added to the plated cells. The cells were then incubated at 27°C for four
hours. The transfection mixture was aspirated from the cells and replaced with 2 ml of complete
Grace’s Medium, containing 5% FBS and 0.1% PenStrep (ThermoScientific).
After incubation at 27°C for forty-eight hours, both cells and medium were collected and
the cells were pelleted by centrifugation (10 minutes, at 2,500 rpm). The supernatant was
collected as the P1 recombinant virus stock, and cells were either discarded or reserved for future
experiments. For amplification of recombinant viruses, approximately 2 x 10⁶ Sf21 cells in 10 ml
of complete Grace’s Insect Medium (ThermoScientfic) were added to T-75 (Corning) tissue
culture flasks. Ten to fifty µl of recombinant virus (the P1 stock) was then added to each flask,
and the cells were incubated at room temperature for approximately one week, or until all cells
had been successfully infected, which was determined via microscopy. At this point, cells and
media were collected in 50 ml tubes and centrifuged at 2,500 rpm for five minutes to remove
cellular debris. Supernatant was collected and stored at 4°C as the P2 recombinant virus stock.

41
All recombinant viruses were titrated using a serial end-point dilution method first
described for baculoviruses by O’Reilly et al. (1992). Briefly, a 10 ml solution of Sf-21 cells
and complete Grace’s Insect Medium at 1 x10⁵
cells/ml was prepared. Rows A-H and wells 1-10,
and 12 of a 96-well microtitre plate were seeded with 100 µl of this suspension. A dilution series
of recombinant baculovirus was prepared in 1.5 ml Eppendorf tubes. The 10-1
dilution was
prepared by adding 50 µl of rBV to 450 µl of complete Grace’s media. The 10-2
dilution was
prepared using 50 µl of the 101 dilution, and 450 µl of complete Grace’s media. This procedure
was repeated until a 10-8
dilution of rBV was obtained. Nine-hundred µl of Grace’s media was
added to each tube. BV dilutions were then aliquoted into a fresh disposable cell reservoir after
which 30 µl of diluted BV was then dispensed into each of the first ten wells of Row A. This
process was repeated with each dilution until wells 1-10 of rows A-H contained virus dilutions.
Well 12 of each row was not inoculated with virus, to serve as an uninfected control. The plates
were incubated for one week at 27°C. Each well was examined for cytopathic effect (CPE) at
seven days post-infection (p.i.). Since CPE was difficult to identify in wells with a low virus
concentration, a blind passage to fresh wells seeded with Sf21 monolayers was done at seven
days p.i. and monitored for CPE for seven days. Titrations were calculated by the Reed and
Muench method and expressed as a TCID50/ml (Reed, 1983)
2.5 Infections and preparation of recombinant budded virions
2.5.1 Infection of cells with recombinant virus
For temporal analysis of protein expression in recombinant baculovirus infected Sf21 or
Hi-Five insect cells, 1 x 10⁶ cells were seeded per 35 mm dish, and were infected with the
recombinant virus at a multiplicity of infection (MOI) of 10 (unless otherwise stated). At various

42
times p.i., infected cells were collected and pelleted by centrifugation (for 10 minutes at 3,000 x
g)
2.5.2 One step growth curve
To assess BV production in each recombinant BV, the kinetics of viral growth were
compared over a time course of 96-hours, at 12 hour intervals. Monolayers of Sf21 (3.5 x10 6)
cells were seeded in 75 cm2
flasks (Corning), and incubated at room temperature for 30 minutes
to allow for cell attachment. Monolayers were then infected with one of each recombinant HA-
expressing baculoviruses at an MOI of 1. Infections were carried out in duplicate. Infected cells
were gently rocked for 1 hour at room temperature. Following virus infection, the virus dilution
was replaced with fresh medium, and the cells were incubated at 27°C. At 0, 12, 24, 36, 48, 72
and 96 h.p.i., 1 ml aliquots were collected from the medium and centrifuged at 1,000 rpm for 5
minutes to pellet the cells. Supernatants (200 µl) were added to fresh microcentrifuge tubes, and
stored at 4°C. For all virus infections, time “0” was considered to be the time immediately upon
addition of virus. Viral titres were determined by end-point dilutions and titres were determined
using the Reed-Muench method (Reed, 1983) (Appendix).
2.5.3 Recovery of infected cells and protein sample preparation
Cells infected with recombinant baculovirus were recovered via gentle scraping and
centrifugation (5 minutes at 4,000 rpm) Supernatant was removed and discarded and the cell
pellet was resuspended in, unless otherwise stated, 0.5% NP-40 (20 mM Tris, 100 mM NaCl, and
0.5% NP-40, pH 7.5). Occasionally, 1% radio-immuno precipitation (RIPA) (50 mM Tris, 150
mM NaCl, 1% NP40, 0.5% sodium deoxycholate, and 0.1% SDS) lysis buffer was used.
Additionally, cells were supplemented with the complete mini EDTA protease inhibitor (Roche).

43
In some instances, the whole cell lysates were further separated into soluble (nuclear and
cytoplasmic) and insoluble (membrane) components. In these cases, the whole cell lysate was
further centrifuged at 4°C at 12,000 rpm for five minutes. The supernatant was then aspirated
and collected as the soluble fraction. The insoluble pellet was then re-suspended in 200 µl of
lysis buffer (either NP40 or RIPA) and supplemented with 1 µl of benzonase (Fermentas) to
increase the fluidity of the pellet and ease of loading. Crude cell lysates were stored at -70°C for
later use.
2.5.4 Concentration of recombinant budded virions
At various times p.i. medium (containing recombinant budded virions) of Sf21 cells
infected with recombinant baculoviruses, was collected. Medium was loaded onto a 3 ml sucrose
cushion and subjected to ultracentrifugation at 126,000 rpm (using a SW32Ti rotor by Beckman
Coulter ) for 1 hour at 4°C. Supernatant was aspirated from the tube and the concentrated virion
pellet was resuspended in 500 µl PBS (pH 6.2) and stored at 4°C.
2.5.5 Quantification of total protein (Bradford Assays)
For all Bradford Assays, the BioRad Protein Assay kit (Cat# 500-0001) was employed.
Briefly, 1 part Dye Reagent Concentrate was diluted in 4 parts distilled H2O. Ten µl of each of
the ten BSA protein standards (concentrations ranging from 100 µg/ml to 1 mg/ml), along with
protein samples diluted 1:10, were pipetted into microtiter plates (in triplicate). Two hundred µl
of diluted Dye Reagent (diluted 1:5) was added to each well, and the plate was incubated at RT
for five minutes. Absorbance was measured at 595 nm using a kinetic microplate reader (E2500,
Tek-Trol Multiple Outlet, Molecular Devices), along with the computer program SOFTmax
(version 2.35). The absorbance values for the BSA standards were used to generate a standard

44
curve. Using the equation of the linear trend line for the standard curve, the values of the
unknown samples were extrapolated. Values for each sample were averaged to generate an
average total protein concentration, and dilution factors were accounted for.
2.6 SDS-PAGE and Western immunoblot
2.6.1 SDS-PAGE
For all SDS-PAGE, 10 µl of 6x SDS-PAGE loading buffer supplemented with 2-
mercaptoethanol was added to every 20 µl sample of cell lysate (both soluble and insoluble
fractions) for a final SDS concentration of 2x. Unless otherwise stated, total cellular protein was
measured for each Western blot and an equal quantity of protein was loaded into the gel. The
samples were boiled at 100 °C for five minutes to denature proteins. Unless otherwise stated, 4
µl of PAGE-runner ladder was loaded onto the gel (BLUeye pre-stained protein ladder,
FroggaBio). Two to ten ug of each sample was separated via SDS-polyacrylamide gel
electrophoresis (SDS-PAGE). Ten percent gels were prepared using recipes obtained from the
Roche Lab FAQs Handbook, Section C, pages 152-153, and contained: dH2O, 10 % acryl-
bisacrylamide (Bio-Rad), 4 M Tris for resolving [pH 8.8] and 5M Tris for stacking [pH 6.8] for
resolving, 1% SDS, 1-5% ammonium persulfate and TEMED). The gels were then run at 150 V
for 1 hour in running buffer (3% tris, 14.41 % glycine and 1% SDS).
2.6.2 Western immunoblotting
Following SDS-PAGE, samples were electroblotted onto polyvinylidene difluoride
(PVDF) membranes at 100 V for 1 hour in 1 L of 1x transfer buffer (0.3% Glycine, 0.58 % Tris,
20% methanol, pH 7) in a Mini Trans-Blot Electrophoretic Transfer Cell (Bio-Rad) as directed
by the manufacturer. Unless otherwise stated, all antibody solutions and membrane wash

45
solutions were composed of 1x Tris-buffered saline, supplemented with 0.1%Tween 20 (TBS-T)
(50 mM Tris, 150 mM NaCl and 0.1% Tween 20) (pH 7.5). Proteins on PVDF membranes were
incubated overnight with primary antibody at 4°C. Blots were then washed three times in
1xTBS-T for 10 minutes each, with shaking. The blots were then incubated in secondary
antibody for 1 hour with gentle shaking. Blots were then washed 3 times for ten minutes in
1xTBS-T, and were then incubated in West Pico SuperBright Chemiluminescent Substrate
(Pierce) for five minutes to detect specific proteins. X-ray film (Bioflex) was developed after
varying exposure times
Occasionally, and depending on the primary antibody, instead of chemiluminescence, a
colorimetric reaction was conducted in which alkaline phosphatase conjugated NBT/BCIP
substrate (ThermoScientific) was added directly to the membrane.
2.6.3 Coomassie blue staining to confirm equal loading
Coomassie blue staining was conducted to confirm equal loading of total protein
quantitated via Bradford Assay. Briefly, 0.2 g of Coomassie Brilliant Blue (ThermoScientific)
was dissolved in a solution of 20% methanol and 10% acetic acid, prepared in distilled H2O.
Following SDS-PAGE in which equal amounts of total protein were separated, 5 ml of the dye
were added to the gel, and incubated overnight at room temperature with shaking. The following
day the dye was removed, and the gel was de-stained in a 20% methanol, 10% acetic acid
solution. Equal loading was visually assessed, and was considered to be successful when protein
bands appeared to be equal in density and intensity across the blot.
2.7 Assessment of HA activity in insect cells
2.7.1 Collection and preparation of red blood cells

46
Chicken red blood cells (cRBCs) supplemented with Alsever’s Solution (Rockland Inc.,
Catalogue # R3020110) were gently washed three times with 5 ml PBS (pH 7.4) and centrifuged
at 1,000 rpm for 10 minutes. The cell pellet was resuspended in PBS (pH 7.4) to a final
concentration of either 1% or 0.5 %, for hemagglutination and hemadsorption assays,
respectively.
2.7.2 Hemagglutination assays
The hemagglutination activities of HA derived from recombinant baculovirus-infected
cells was determined at several times p.i. of Sf21. Cells were seeded in 35 mm dishes at a
density of 1 x 10⁶ and infected at an MOI of 10 with recombinant virus. At 48, 72 and 96 h.p.i.,
cells were aspirated from each dish and were centrifuged in an Eppendorf microfuge tube for 5
minutes at 1000 rpm to pellet detached cells. The supernatant fraction was aspirated from the
tube, and retained as the budded virus fraction, and 1 ml of PBS was used to re-suspend the
infected Sf21 cells. Both cell fractions and extracellular material were disrupted by sonication (3
x 30s intervals) (Mandel Scientific Model XL2020). One hundred µl of each sample (sonicates,
whole infected cells and budded virus) was added to wells of a 96-well plate and two-fold serial
dilutions were prepared. Fifty μl of 1% chicken RBCs were added to each well, which was
incubated for 30 minutes at room temperature. The plates were examined for either the formation
of a cross-linked matrix (indicating hemagglutination) or a button (indicating hemagglutination
was absent).
In addition to assessing the hemagglutinating ability of infected cell lysates, the
hemagglutination activity of whole (non-lysed) infected cells was also assessed. Cells were
infected with one of each recombinant HA-expressing baculoviruses at an MOI of 10. At 48
h.p.i. infected cells were collected and counted using a hemocytometer and a phase contrast light
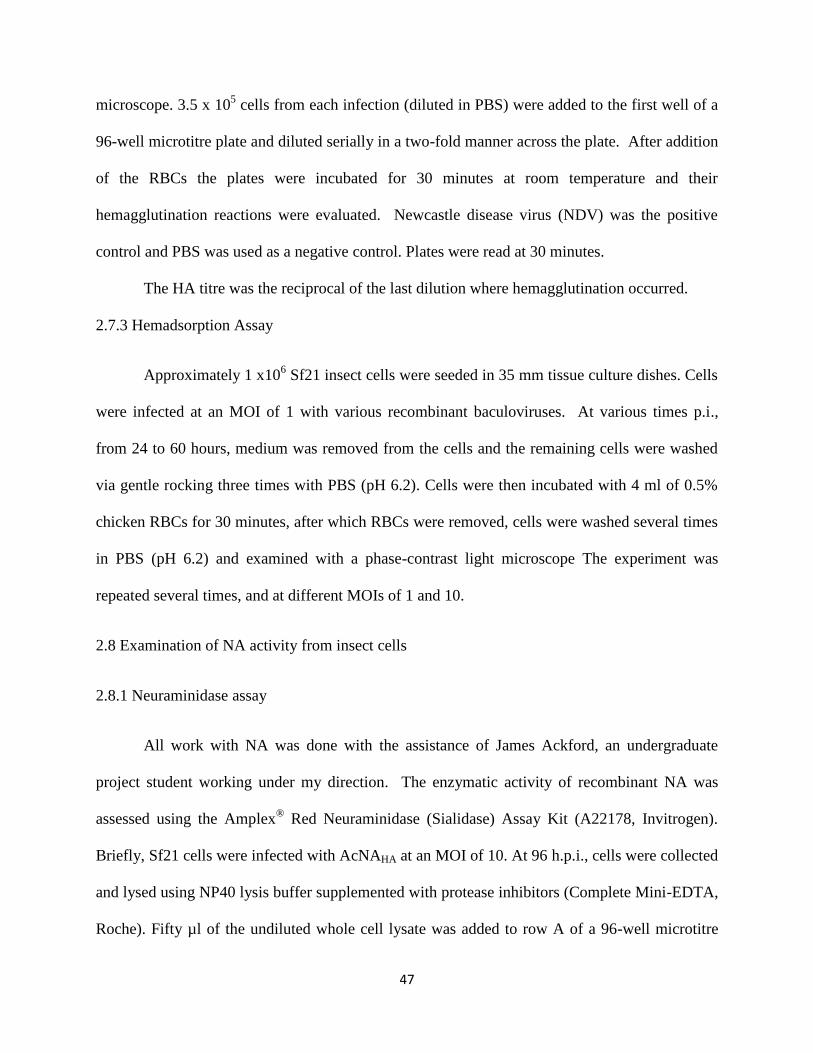
47
microscope. 3.5 x 10⁵ cells from each infection (diluted in PBS) were added to the first well of a
96-well microtitre plate and diluted serially in a two-fold manner across the plate. After addition
of the RBCs the plates were incubated for 30 minutes at room temperature and their
hemagglutination reactions were evaluated. Newcastle disease virus (NDV) was the positive
control and PBS was used as a negative control. Plates were read at 30 minutes.
The HA titre was the reciprocal of the last dilution where hemagglutination occurred.
2.7.3 Hemadsorption Assay
Approximately 1 x10⁶ Sf21 insect cells were seeded in 35 mm tissue culture dishes. Cells
were infected at an MOI of 1 with various recombinant baculoviruses. At various times p.i.,
from 24 to 60 hours, medium was removed from the cells and the remaining cells were washed
via gentle rocking three times with PBS (pH 6.2). Cells were then incubated with 4 ml of 0.5%
chicken RBCs for 30 minutes, after which RBCs were removed, cells were washed several times
in PBS (pH 6.2) and examined with a phase-contrast light microscope The experiment was
repeated several times, and at different MOIs of 1 and 10.
2.8 Examination of NA activity from insect cells
2.8.1 Neuraminidase assay
All work with NA was done with the assistance of James Ackford, an undergraduate
project student working under my direction. The enzymatic activity of recombinant NA was
assessed using the Amplex® Red Neuraminidase (Sialidase) Assay Kit (A22178, Invitrogen).
Briefly, Sf21 cells were infected with AcNAHA at an MOI of 10. At 96 h.p.i., cells were collected
and lysed using NP40 lysis buffer supplemented with protease inhibitors (Complete Mini-EDTA,
Roche). Fifty µl of the undiluted whole cell lysate was added to row A of a 96-well microtitre
48
plate and serially diluted in a two-fold manner. A positive control, NA derived from Clostridium
perfringens, was diluted 50-fold in 1x reaction Buffer and 50 μl of this was added to the 96-well
plate in triplicate. In addition, a 10 μM H2O2 positive product control was plated in triplicate
along with a negative control containing only 1X reaction buffer. A 2X working solution was
made using 50 μl of 10 mM Amplex Red reagent stock solution, 10 μl of 100 U/ml horseradish
peroxidase stock solution, 100 μl of 200 U/ml galactose oxidase stock solution, 250 μl of 10
mg/ml fetuin stock solution, and 4.59 ml of 1X Reaction Buffer. Fifty μl of the 2X working
solution was added to all samples and controls using a multi-channel pipette. The 96-well plate
was incubated for 30 minutes at 37 °C, shielded from light. Absorbance was measured at 560
nm, and the empty wells were used as a blank for absorbance readings and these values were
subtracted from all samples and controls. Each sample was assessed in triplicate.

49
Figure 2.2 Schematic representation of the recombinant baculoviruses generated. All GOIs were
first cloned into ΔHispFastBacB, and then subsequently electroporated into the mini Tn7 attn
transposition sites present in the AcΔCC recombinant bacmid, under the very late polyhedrin
promoter. AcΔCC contains the entire baculovirus genome, but lacks the chitinase/cathepsin
genes.
50
Chapter 3: Results
3.1 Generation of recombinant viruses
The overall goal of this research was to assess and compare the effectiveness of three
baculovirus expression methods, specifically protein overexpression, surface display and capsid
display for production of influenza virus HA. Recombinant viruses were generated using the
commercially available Bac-to-Bac BEVS system (Invitrogen).
3.1.1 Development of the baculovirus recombinant HA constructs
Four recombinant HA-expressing viruses were generated: AcHAFLAG, AcHA:GP64FLAG,
AcHA:VP39FLAG and AcVP39:HAFLAG through the corresponding bacmid intermediates (Fig.
3.1). AcHAFLAG represented the traditional overexpression system and included the entire HA
ORF with its signal peptide. For AcHA:GP64FLAG, the HAFLAG was inserted at the amino end of
GP64, using the signal peptide of GP64. For this, the HA:GP64FLAG should be processed and
located in the plasma membrane of the cell and envelope of the virus. The normal GP64 was
retained to ensure proper virus budding. For AcHA:VP39FLAG and AcVP39:HAFLAG the HA
signal peptide and transmembrane domains were removed to ensure HA did not go to the ER or
plasma membrane, respectively. Additionally, normal VP39 was retained in the virions to ensure
proper nucleocapsid formation. In all cases, the different constructs were driven by the
polyhedrin promoter. To confirm proper cloning, each bacmid was PCR-screened using M13
specific primers (Table 2.3), and the PCR products were separated by agarose gel
electrophoresis. All recombinant bacmids contained DNA fragments of the expected sizes.
Sequence analysis confirmed that all recombinant-HA expressing bacmids were correct.
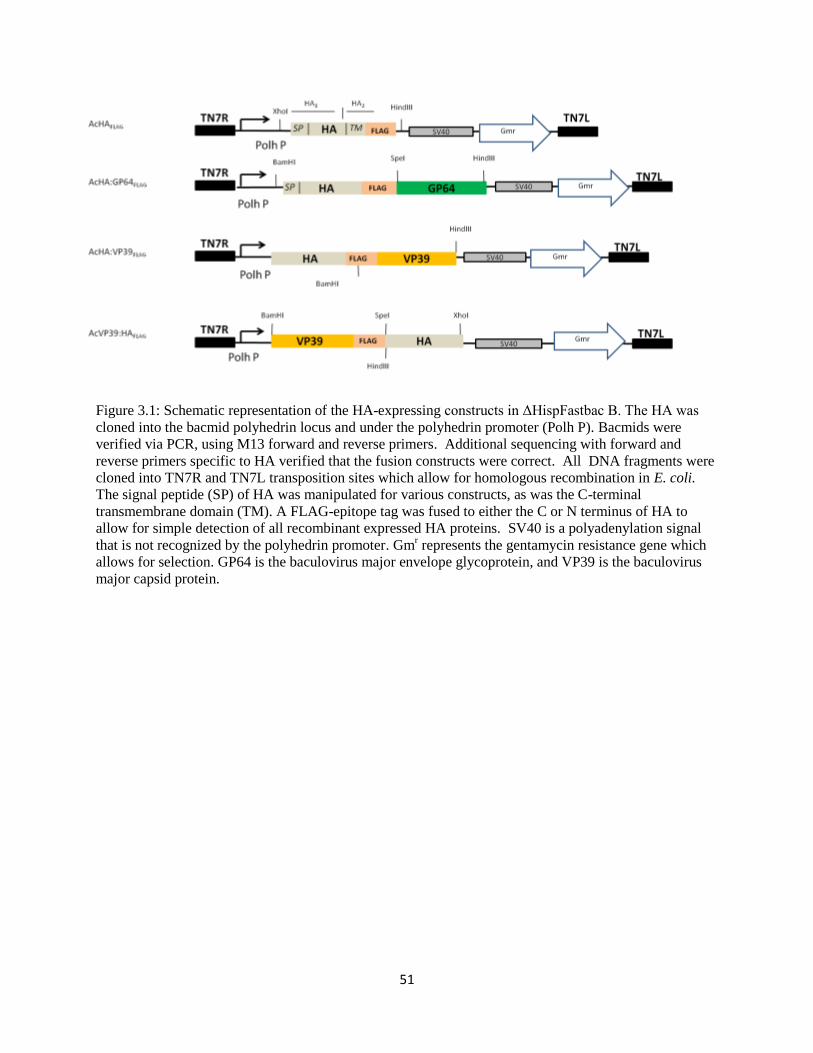
51
Figure 3.1: Schematic representation of the HA-expressing constructs in ΔHispFastbac B. The HA was
cloned into the bacmid polyhedrin locus and under the polyhedrin promoter (Polh P). Bacmids were
verified via PCR, using M13 forward and reverse primers. Additional sequencing with forward and
reverse primers specific to HA verified that the fusion constructs were correct. All DNA fragments were
cloned into TN7R and TN7L transposition sites which allow for homologous recombination in E. coli.
The signal peptide (SP) of HA was manipulated for various constructs, as was the C-terminal
transmembrane domain (TM). A FLAG-epitope tag was fused to either the C or N terminus of HA to
allow for simple detection of all recombinant expressed HA proteins. SV40 is a polyadenylation signal
that is not recognized by the polyhedrin promoter. Gmr represents the gentamycin resistance gene which
allows for selection. GP64 is the baculovirus major envelope glycoprotein, and VP39 is the baculovirus
major capsid protein.

52
3.1.2 Viral growth kinetics
Viral growth kinetics were compared among the four recombinant HA-expressing viruses
and the reference AcΔCC to determine whether the alterations to the baculovirus genome
affected virus replication and growth (Fig 3.2). AcΔCC was the backbone for the constructs and
lacks the chitinase and cathepsin genes to protect the HA from proteolytic cleavage.
Approximately 3x10⁶
Sf21 cells were seeded in T-75 flasks and infected at an MOI of 0.1 with
each of the four recombinant viruses, along with AcΔCC. All infections were carried out in
duplicate. Fifty µl of medium containing the budded virions from each infection was collected at
twelve-hour intervals from 12 to 96 h.p.i. Infectious budded virus in the extracellular medium
was titred using the TCID50 titration method (Reed, 1983). The growth rate of infectious budded
virions was comparable among the viruses. Statistical analysis using two-factor ANOVA
confirmed that virus titres at each time point were not statistically different from one another,
with 95% confidence (p-value > 0.05) (see appendix for Microsoft Excel output).
3.2 Expression of HA by three different methods as measured using anti FLAG antibody
Expression of HA by the four different recombinant baculoviruses was followed by
Western immunoblots of infected cells using an anti-FLAG antibody to determine the size and
relative level of the expressed HA.

53
Figure 3.2 Comparison of recombinant virus replication in Sf21 cells. Mean budded virus titres in the
supernatants of Sf21 cell infected at an MOI of 1 were determined by TCID50. AcΔCC and all four
recombinant HA-expressing viruses had similar growth kinetics.
1.00E+00
1.00E+01
1.00E+02
1.00E+03
1.00E+04
1.00E+05
1.00E+06
1.00E+07
1.00E+08
1.00E+09
0 12 24 36 48 72 96
log
TCID
50/
ml
Hours p.i.
AcHA:VP39FLAG
Ac.VP39:HAFLAG
Ac.HA:GP64FLAG
AcHAFLAG
AcΔCC

54
3.2.1 HAFLAG overexpression
To determine whether transfected Sf21 cells expressed recombinant HAFLAG, cells
transfected with each of two clones of BAC.HAFLAG were collected at 48 h.p.t., resuspended in
PBS, pelleted and lysed. Proteins were separated by SDS-PAGE, blotted and probed using a
monoclonal anti-FLAG antibody (Sigma). AcCHIAFLAG, a recombinant virus expressing a
FLAG-tagged baculovirus chitinase protein was the positive control for the anti-FLAG antibody.
A band at 58 kDa (Fig. 3.3, lane 3) was detected corresponding with that of CHIAFLAG,
indicating the ability of the antibody to detect FLAG-tagged protein. Lysate from Sf21 cells
infected with AcΔCC (empty bacmid, lane 4) was the negative control for the anti-FLAG
antibody, and as expected, no band was detected for AcΔCC. The anti-FLAG antibody identified
two specific bands of BAC.HAFLAG 1 and 2 (lanes 1 and 2, respectively). These bands migrated
at 74 kDa and 25 kDa, respectively, as determined using linear regression of marker band
migration (see appendix for sample calculation). In lane 1, a very faint 65 kDa band was also
visible. This band was not observed for the BAC.HAFLAG cell lysate in lane 2, which appeared to
have less protein than lane 1. BAC.HAFLAG from lane 1 was selected for virus amplification and
further experiments.
3.2.2 AcHAFLAG expression in S21 cells
Temporal expression of HAFLAG was examined in Sf21 cells by Western immunoblot.
Sf21 cells were infected at an MOI of 10 with AcHAFLAG, and collected at intervals from 24 to
96 h.p.i. Ten µg of protein from each lysate was separated by SDS-PAGE, blotted, and the blot
was probed using the anti-FLAG antibody (Fig 3.4A).

55
Figure 3.3 Western immunoblot (12% PAGE) of lysate from Sf21 cells transfected with Bac.HAFLAG at
48 hours h.p.t. MW is molecular weight marker. Calculated protein sizes are represented on the right side
of the figure. Lanes 1 and 2: Sf21 cells transfected with BacHAFLAG1 and BacHAFLAG2. Lane 3: Sf21
cells infected with AcCHIAFLAG. Lane 4: Sf21 cells infected with bacmid containing only the empty
expression cassette (AcΔCC). The blot was probed with a primary murine anti-FLAG antibody (diluted
1:20,000 in TBS-T) and a secondary anti-mouse antibody (diluted 1:10,000 in TBS-T).

56
Figure 3.4 Western immunoblot of AcHAFLAG in Sf21 (A) and Hi-FiveTM
(B) infected cell lysate, from 24
to 96 h.p.i. MW is molecular weight marker. Calculated protein sizes are represented on the right side of
the figure. For Sf21 cells, 10 µg of lysate was used while for Hi-FiveTM
cells, only 5 µg of lysate was
used. Primary murine anti-FLAG antibody diluted 1:20,000. The secondary antibody was an anti-mouse
HRP-conjugated antibody (1:10,000). Controls included lysates from Hi-FiveTM
cells infected with
either AcCHIAFLAG (FLAG control), or AcΔCC (negative) at 96 h.p.i. Lysates from mock infected Hi-
FiveTM
cells were also probed with anti-FLAG Ab as an additional negative control. (C) Schematic of
HAFLAG construct.
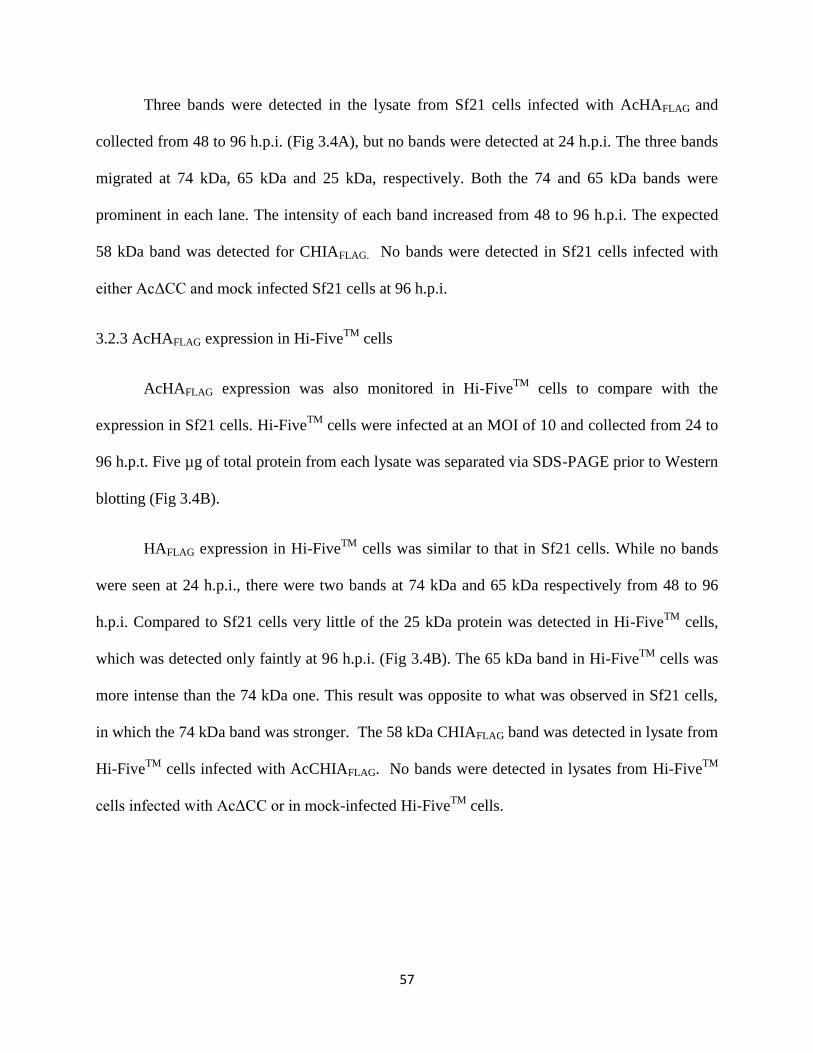
57
Three bands were detected in the lysate from Sf21 cells infected with AcHAFLAG and
collected from 48 to 96 h.p.i. (Fig 3.4A), but no bands were detected at 24 h.p.i. The three bands
migrated at 74 kDa, 65 kDa and 25 kDa, respectively. Both the 74 and 65 kDa bands were
prominent in each lane. The intensity of each band increased from 48 to 96 h.p.i. The expected
58 kDa band was detected for CHIAFLAG. No bands were detected in Sf21 cells infected with
either AcΔCC and mock infected Sf21 cells at 96 h.p.i.
3.2.3 AcHAFLAG expression in Hi-FiveTM
cells
AcHAFLAG expression was also monitored in Hi-FiveTM
cells to compare with the
expression in Sf21 cells. Hi-FiveTM
cells were infected at an MOI of 10 and collected from 24 to
96 h.p.t. Five µg of total protein from each lysate was separated via SDS-PAGE prior to Western
blotting (Fig 3.4B).
HAFLAG expression in Hi-FiveTM
cells was similar to that in Sf21 cells. While no bands
were seen at 24 h.p.i., there were two bands at 74 kDa and 65 kDa respectively from 48 to 96
h.p.i. Compared to Sf21 cells very little of the 25 kDa protein was detected in Hi-FiveTM
cells,
which was detected only faintly at 96 h.p.i. (Fig 3.4B). The 65 kDa band in Hi-FiveTM
cells was
more intense than the 74 kDa one. This result was opposite to what was observed in Sf21 cells,
in which the 74 kDa band was stronger. The 58 kDa CHIAFLAG band was detected in lysate from
Hi-FiveTM
cells infected with AcCHIAFLAG. No bands were detected in lysates from Hi-FiveTM
cells infected with AcΔCC or in mock-infected Hi-FiveTM
cells.

58
3.2.4 Comparison of HAFLAG recovery between NP40 and RIPA lysis buffers for ELISA
The ultimate goal of the recombinant HA is for it to be used as antigen in ELISA. Since
ELISA plates are generally coated with soluble antigen, an experiment was conducted to
compare the recovery of HAFLAG in the soluble fraction of infected Hi-FiveTM
cells lysed with
either NP40 or RIPA lysis buffers from 48 to 96 h.p.i. Hi-FiveTM
cells were grown in serum-free
medium and were infected with AcHAFLAG at an MOI of 10. Cells were then lysed with either
NP40 buffer or RIPA buffer (lanes N and R, respectively in Fig 3.5), and total proteins were
separated via SDS-PAGE. The expected 65 kDa protein that corresponds with full-length
HAFLAG was easily detectable with the anti-FLAG antibody (Fig 3.5). At 96 h.p.i. a second band
was distinguishable at 74 kDa for both buffers. A band at this size was also observed in previous
infections of Sf21 and Hi-FiveTM
cells, but at earlier times p.i. In general the intensity of the
bands was similar regardless of the lysis buffer employed. However, the bands resulting from
cells lysed with RIPA appear slightly more intense at 72 and 96 h.p.i. compared to NP40. The
upper 74 kDa band was observed in Figures 3.3 and 3.4 but was much less distinct (Fig 3.5)
when only the soluble fraction was used in the Western blot, and in Hi-FiveTM
cells grown in the
absence of FBS. It is possible that the 74 kDa band corresponds to the full-length HAFLAG fusion,
and the 65 kDa band corresponds to an HA cleavage product. Further investigation was required
to determine the identity of the 65 and 74 kDa protein bands in Sf21 and Hi-FiveTM
cells infected
with AcHAFLAG.

59
Figure 3.5 (A) Western immunoblot of temporal expression of HAFLAG in Hi-FiveTM
cells. Protein was
detected using anti-FLAG antibody (1:20.000), and a secondary anti-mouse antibody (1:10,000). MW is
molecular weight marker. The times p.i. are indicated above the lanes, and the lysis buffer employed,
either NP40 (N) or RIPA (R), are indicated below the lanes. Calculated protein sizes are represented on
the right side of the figure. The positive FLAG control was CHIAFLAG and the negative control was
AcΔCC. (B) Schematic representation of the recombinant HAFLAG construct.

60
3.2.5 Nature of 65 and 74 kDa bands: serum –containing versus serum-free media
Western blots of cell lysates of cells grown in the presence of FBS showed strong
expression of both 65 and 74 kDa bands (Fig 3.4), while cells grown in serum-free medium had a
less intense 74 kDa band, detectable only at 96 h.p.i. (Fig 3.5.) To determine if this was
reproducible, AcHAFLAG expression was followed in Hi-FiveTM
cells grown in either serum-free
or FBS-supplemented medium for the cleavage and the relative amounts of the two proteins were
monitored.
Cells were infected at an MOI of 10. At 72 h.p.i. infected cells were collected, lysed and
proteins were separated using SDS-PAGE and subjected to Western immunoblot. There was no
qualitative difference in HAFLAG expression in Hi-FiveTM
cells grown in either serum-free
medium or serum-containing medium (Fig 3.6). Both the 74 and 65 kDa forms of HAFLAG were
detected, regardless of the type of medium used, and therefore it was concluded that presence or
absence of serum was not responsible for the differential detection of the 65 and 74 kDa protein
bands. However, it was noted that there was less of the 74 kDa band in serum-free medium as
also seen in figure 3.5, corroborating these earlier results.
3.2.6 HAFLAG expression in Sf21 cells in the presence or absence of tunicamycin
Since presence or absence of serum did not alter the detection of the 65 and 74 kDa
bands, it was rationalized that perhaps the 74 kDa band for AcHAFLAG was a result of
glycosylation of HA. To investigate this possibility, Sf21 cells were infected with AcHAFLAG,
and supplemented with tunicamycin (10 µg/ml), a known inhibitor of glycosylation. Infected
cells were collected at 48 h.p.i. For AcHAFLAG infected Sf21 cells treated with tunicamycin, only
the 65 kDa band was detected (Fig 3.7, lane 2). However both the 65 and 74 kDa bands

61
Figure 3.6 Western immunoblot of HAFLAG expression in Sf21 cells at 72 h.p.i., grown in the presence
(+FBS) or absence (-FBS) of serum. MW is molecular weight marker. Protein bands at 74 and 65 kDa
were detected using a primary murine anti-FLAG antibody (1:20,000), and a secondary anti-mouse
antibody (1:10,000). The FLAG control was CHIAFLAG and the negative controls were AcΔCC infected
Sf21 cells and mock-infected Sf21 in the presence of serum.
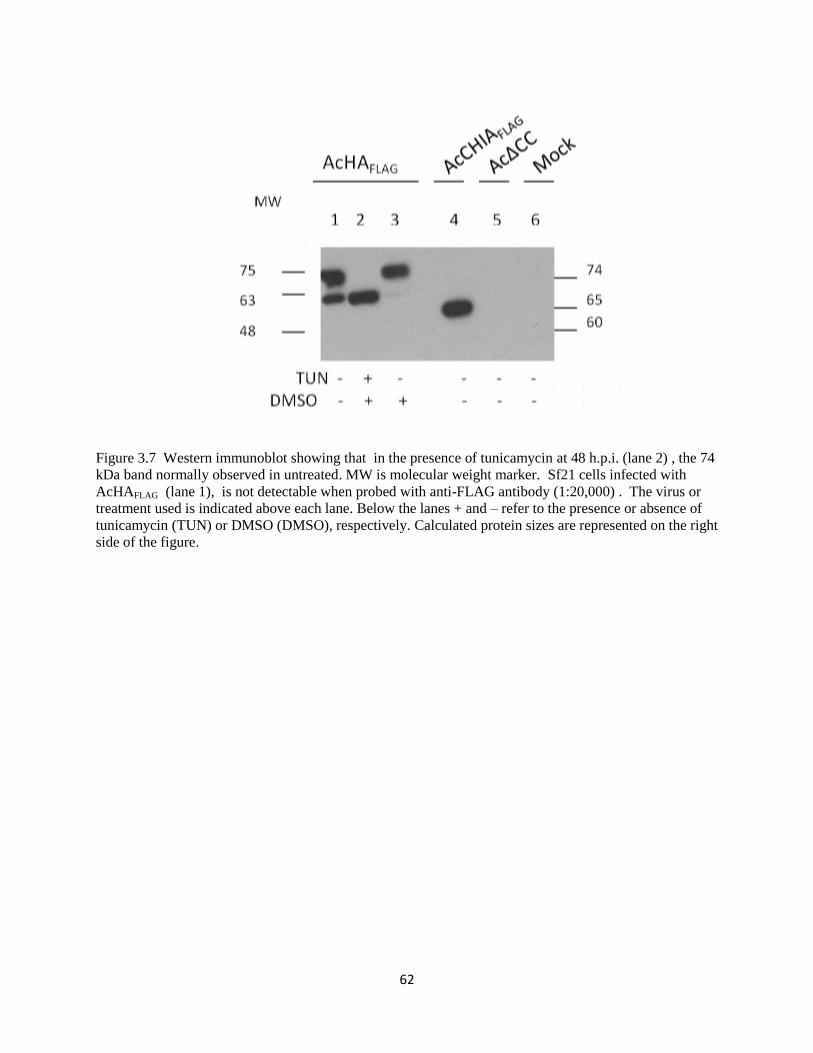
62
Figure 3.7 Western immunoblot showing that in the presence of tunicamycin at 48 h.p.i. (lane 2) , the 74
kDa band normally observed in untreated. MW is molecular weight marker. Sf21 cells infected with
AcHAFLAG (lane 1), is not detectable when probed with anti-FLAG antibody (1:20,000) . The virus or
treatment used is indicated above each lane. Below the lanes + and – refer to the presence or absence of
tunicamycin (TUN) or DMSO (DMSO), respectively. Calculated protein sizes are represented on the right
side of the figure.

63
were detected in Sf21 cells in the absence of tunicamycin (Fig 7, lane 1). Cells were also treated
with DMSO, the carrier for tunicamycin, to ensure that it was not responsible for the absence of
the 74 kDa band. In the presence of DMSO only, there was a strong 74 kDa band but only a very
faint 65 kDa band (Fig 3.7, lane 3). It was expected that both bands would be detected at levels
similar to each other and similar to that in lane 1. Nonetheless, because the 74 kDa band
remained intense in the presence of DMSO, it is unlikely that DMSO is responsible for the
observed effect of tunicamycin on cells infected with AcHAFLAG. These results suggested that the
74 kDa protein strongly expressed in both Sf21 and Hi-FiveTM
cells infected with AcHAFLAG was
a consequence of glycosylation, and that the 65 kDa band represents HA0, the full-length,
uncleaved and non-glycosylated protein.
3.2.7 AcHA:GP64FLAG expression
The second construct, AcHA:GP64FLAG, was designed to have the HA fused to the amino
end of the major envelope glycoprotein GP64 using the HA signal peptide. The genome still
retained the native GP64 gene to ensure that virus budding was not compromised by fusion of
the HA to GP64.
HA:GP64FLAG expression was monitored in Sf21 cells infected with AcHA:GP64FLAG at
an MOI of 10 and collected at 72 h.p.i. Two µg of total protein was separated via SDS-PAGE
and analyzed by Western immunoblot using the anti-FLAG antibody (Fig 3.8A).
When probed with anti-FLAG Ab, HA:GP64FLAG was detected at 72 h.p.i. as a band at
130 kDa (lanes 1), which corresponds in size with the full-length HA protein fused to both the
FLAG epitope tag and the GP64 major fusion protein (Figure 3.8C). Additionally, there was a
faster migrating band at 90 kDa, which corresponded to the cleaved HA2 subunit (27 kDa),

64
Figure 3.8 Western immunoblot of (A) Sf21 cells or (B) Hi-FiveTM
cells infected with AcHA:GP64FLAG at
72 h.p.i. MW is molecular weight marker. Two µg of each sample was loaded in duplicate, and probed
with either the anti-FLAG antibody (1:20,000) (left panels), or a monoclonal murine anti-GP64 antibody,
(1:10,000) (right panels). The secondary antibody was anti-mouse HRP conjugated antibody (1:10,000).
Calculated protein sizes are represented on the right side of each blot. Lane 1 (A) and (B): cells infected
with AcHA:GP64FLAG. Lane 2 (A): Sf21 cells infected with AcCHIA(ASD)FLAG Lane 2 (B): Hi-FiveTM
cells infected with AcCHIAFLAG Lane 3 (A) and (B): AcΔCC infected cells Lane 4 (A) and (B): mock-
infected cells (C). Schematic representation of the fusion construct in which the HA TM domain was
removed, and HA was fused with FLAG at its carboxy terminus. HAFLAG was then fused to the N
terminus of GP64. The N-terminal HA SP was retained.

65
fused with the FLAG epitope tag, followed by the GP64 protein (64 kDa) (Fig 3.8 B). The
expected band at 45 kDa was detected for CHIA(ASD)FLAG, a different FLAG control expressing
only the active site domain (ASD) of chitinase rather than the full-length protein (lanes 2). No
bands were detected for Sf21 cells infected with AcΔCC and mock infected Sf21 cells (lanes 3
and 4, respectively).
Alternatively when Sf21 cells infected with AcHA:GP64FLAG were probed with
monoclonal anti-GP64 antibody, three bands at 130 kDa, 90 kDa and 64 kDa, respectively, were
detected. The 130 and 90 kDa bands corresponded to those detected by the anti-FLAG antibody.
The lower band at 64 kDa corresponded to the wild-type GP64, which was purposefully retained
in the recombinant baculovirus, in addition to the HA:GP64 fused version. A single 64 kDa
protein band corresponding to the wild-type GP64 protein was detected for AcΔCC (lane 3). This
band was very faint for CHIA(ASD)FLAG (lane 2), perhaps because only the soluble fraction of
cells infected with AcCHIA(ASD)FLAG was blotted, and GP64, as a membrane protein, would be
expected to remain mostly insoluble whereas total cell lysate was blotted for AcΔCC and
AcHAFLAG samples. No bands were detected for the mock infected Sf21 cells (lane 4).
The same experiment was repeated in Hi-FiveTM
cells, with the exception of the positive
FLAG control, which was total protein from cells infected with AcCHIAFLAG. When probed with
anti-GP64 Ab, the expected 64 kDa band for CHIAFLAG was also very faint. In this case it was
perhaps because the titre of this virus was about 100 fold less than that of all other viruses used
in these experiments. Otherwise, this experiment confirmed qualitatively that AcHA:GP64FLAG
expression between Sf21 and Hi-FiveTM
cells was comparable.
3.2.8 AcHA:VP39FLAG and AcVP39:HAFLAG expression

66
The recombinant baculoviruses AcHA:VP39FLAG and AcVP39:HAFLAG were designed to
have HA fused to the major capsid protein VP39 at its amino and carboxy termini, respectively.
The genome for each recombinant virus still retained the wild-type VP39 gene to ensure that
nucleocapsid formation was not compromised by fusion of HA to VP39.
Sf21 cells were infected with either AcHA:VP39FLAG or AcVP39:HAFLAG and monitored
for HA:VP39FLAG and VP39:HAFLAG expression at 72 h.p.i. by probing with the anti-FLAG
antibody and a monoclonal anti-VP39 antibody (Fig 3.9A). A 104 kDa protein band was
detected for AcHA:VP39FLAG and AcVP39:HAFLAG infected Sf21 cells using the anti-FLAG
antibody (Fig 3.9A, lanes 1 and 2, left panels). This size reflects the size of the 39 kDa VP39
protein fused with the 65 kDa HAFLAG or FLAGHA. A band of the expected size of 58 kDa was
detected for CHIAFLAG (lanes 3) while no bands were detected for Sf21 cells infected with
AcΔCC or mock-infected cells (lanes 4 and 5, respectively).
A similar band at 104 kDa which was detected for HA:VP39FLAG and VP39:HAFLAG
when probed with anti-FLAG Ab (lanes 1 and 2) was observed using anti-VP39 (lanes 5 and 6)
antibody, and reflects the size of the full-length HA:VP39 fusion protein (Figure 3.9B). In
addition to the 104 kDa band, a 39 kDa band was detected with the anti-VP39 antibody (lanes 6-
9). This band corresponded to wild-type VP39. CHIAFLAG and AcΔCC (lanes 8 and 9
respectively) also yielded a 39 kDa band, representing wild-type VP39, which is present in all
baculoviruses. The 39 kDa band for CHIAFLAG was very faint (lane 8), likely due to the low titre
of the AcCHIAFLAG.

67
Figure 3.9 Western immunoblots of (A) Sf21 or (B) Hi-FiveTM
cells infected with either AcHA:VP39FLAG
or AcVP39:HAFLAG, (lanes 1 and 2 and 6 and 7, respectively, on each blot) at 72 h.p.i. MW is molecular
weight marker. For (A), the FLAG control was AcCHIA(ASD)FLAG, in lanes 3 and 8. For (B), the FLAG
control was AcCHIAFLAG, in lanes 3 and 8. Lanes 4 and 5 and 9 and 10 for both (A) and (B) contained
lysates for AcΔCC and mock infected cells, respectively. Two µg of each sample was loaded in
duplicate and the blots were probed with either anti-FLAG antibody on the left panel of A and B
(1:20,000) or a monoclonal murine anti-VP39 antibody on the right panel of A and B (1:10,000). All
samples were probed with a secondary anti-mouse HRP conjugated antibody (1:10,000). Calculated
protein sizes are represented on the right side of each blot. (C) Schematic representation of the fusion
construct in which both the HA TM domain and signal peptides were removed, and HA was fused with
FLAG at either its carboxy (N-terminal fusion) or amino (C-terminal fusion) terminus. HAFLAG/FLAGHA
was then fused to the N or C terminus of VP39.

68
virus. Finally no bands were detected for mock infected Sf21 cells lysate using the anti-VP39
antibody.
The same experiment was repeated with Hi-FiveTM
cells, and the protein expression for
the two cell lines was similar (Fig 3.9B).
3.2.9 Relative levels of HA expression among all HA-expressing baculoviruses
The main objective of this research was to determine which baculovirus expression
method is the most efficient and economical for production of HA as an antigen. HA expression
levels among all recombinant HA-expressing baculoviruses were compared using anti-FLAG
Ab. Sf21 cells infected at an MOI of 10 with each of the four recombinant baculoviruses
expressing HA were collected at 72 h.p.i. Two µg of each lysate was separated by
electrophoresis and the proteins were transferred and probed with the anti-FLAG antibody. The
Western blot (Fig 3.10) shows that when the same amount of protein was loaded, HA:GP64FLAG
showed the most intense bands (at 130 and 90 kDa), followed by HAFLAG, (at 74 and 65 kDa)
and then by VP39:HAFLAG (at 104 kDa). Intensity of the bands for HA:VP39FLAG (104 kDa) was
the weakest in which HA was cloned into the N-terminus of VP39. No bands were detected for
AcΔCC and mock-infected Sf21 cell lysates.
3.2.10 Detection of HA in budded virions from HA recombinant virus infected cells
To determine whether FLAG-tagged HA was present in the budded virions, Sf21 cells
were infected with each of the recombinant viruses at an MOI of 1. At 96 h.p.i., cells were
pelleted and discarded, while supernatant containing budded virions was collected, and
concentrated by ultracentrifugation. Budded virions were lysed in NP40 lysis buffer, and 5 µg of

69
Figure 3.10 Comparison of HA expression by recombinant HA-expressing baculoviruses, along with
AcΔCC and mock infected Sf21cells at 72 h.p.i. Cells were infected at an MOI of 10. MW is molecular
weight marker. Two µg of each cell lysate sample was loaded and probed with the anti-FLAG antibody
(1:20,000) followed by a secondary anti-mouse HRP conjugated antibody (1:10.000). Calculated protein
sizes are represented on the right side of the figure. All bands were at the expected sizes, as previously
described.
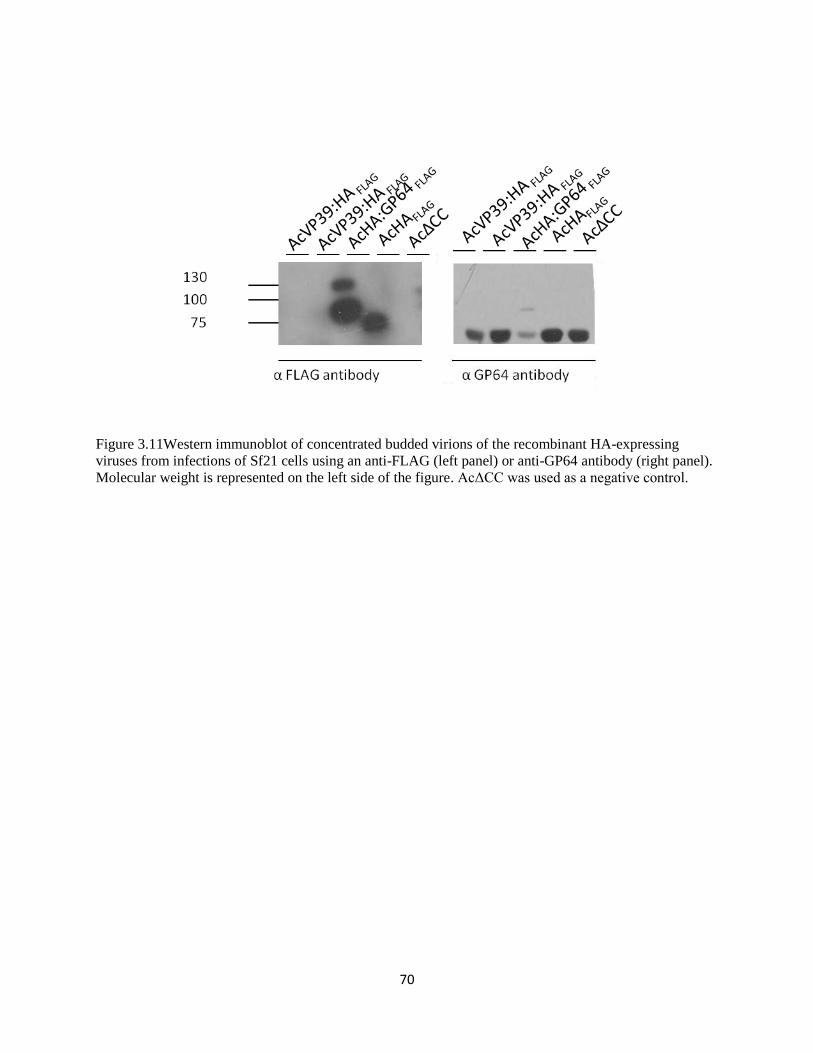
70
Figure 3.11Western immunoblot of concentrated budded virions of the recombinant HA-expressing
viruses from infections of Sf21 cells using an anti-FLAG (left panel) or anti-GP64 antibody (right panel).
Molecular weight is represented on the left side of the figure. AcΔCC was used as a negative control.

71
each lysate was subjected to Western immunoblot and probed with anti-FLAG antibody. FLAG-
tagged HA was detectable in the budded virions of all HA-expressing baculoviruses, but not in
budded virions of AcΔCC (Fig 3.11). However, the bands detected by anti-FLAG Ab in the
budded virions of AcHA:GP64FLAG and AcHAFLAG (130 kDa and 74 and 65 kDa, respectively)
were much stronger than those of the two VP39 display viruses, both of which showed only faint
bands of the expected size of 104 kDa, and only when the blot was over-exposed. Further,
budded virions of AcHAFLAG contained the glycosylated 74 kDa protein. This suggests that post-
translational modifications occurred efficiently during the processing of HA.
The GP64 antibody (Fig 3.11 right panel) was the positive control for the budded virions.
Bands for VP39:HAFLAG, HA:VP39FLAG, HA:GP64FLAG, and HAFLAG and AcΔCC were detected
at the expected size of 64 kDa, confirming that the budded virions were present. In addition to
the 64 kDa band corresponding to full-length GP64, two bands at 90 and 130 kDa were detected
for HA:GP64FLAG, but they were very faint on the blot, and were most apparent when the blot
was over-exposed.
3.3 Recognition of HA expressed by recombinant viruses by antibodies against HA
Previously, expression of HA by the four recombinant viruses was demonstrated by
Western blot with an anti-FLAG antibody. However, for the HA to be useful for diagnostic
purposes they also have to be able to react with anti-HA antibodies. For this, the HA expression
in cells was monitored using a variety of antibodies against HA to provide more conclusive
evidence for immune recognition of HA.
3.3.1 Detection of HAFLAG with a commercial polyclonal, mono-specific (H5) HA antibody

72
To determine whether HAFLAG can be detected by a commercially available rabbit
polyclonal anti-H5 HA antibody (ProSci, Catalogue #3425) Sf21 cells were infected with
AcHAFLAG at an MOI of 10, collected at 72 h.p.i. and lysed. Bands suggestive of both the
glycosylated (74 kDa) and non-glycosylated (65 kDa) forms of HAFLAG were detected from 48 to
96 h.p.i. (Fig 3.12, lanes1-4). HA expression by a fowl-adenovirus vector (FAdV) in which the
HA was cloned in the rightward (FAdV-HAR) or leftward (FAdV-HAL) orientations was also
followed. Chicken liver cells (CH-SAH) infected with FAdV-HAR and FAdV-HAL recombinant
viruses yielded a strong band at 55 kDa, detected by the anti H5 HA antibody and a faint one at
74 kDa. No HA protein was detected for the empty FAdV vector, FAdV9Δ4 infected CH-SAH
cells (lane 8). For AcCHIAFLAG or AcΔCC, neither the 74 kDa nor the 65 kDa bands were
detected (lanes 7 and 9, respectively). No bands were detected for mock-infected avian CH-SAH
or insect Sf21 cells (lanes 10 and 11, respectively). There was an unexpected, specific 45 kDa
band detected in cells infected with AcHAFLAG, AcCHIAFLAG and AcΔCC, but not in mock-
infected Sf21 cells. Because this 45 kDa band was not detected in Sf21 cells, this protein,
detected by the polyclonal anti-H5 antibody must be present in cells infected with any
baculovirus.
3.3.2 Detection of HA from recombinant HA-display and HAFLAG viruses using a commercial
monospecific polyclonal, anti-HA antibody
To determine whether Sf21 cells infected with each HA-expressing display virus reacted
with the commercial polyclonal anti-H5 HA antibody #3425, Sf21 cells were infected with each
of the recombinant baculoviruses at an MOI of 10, collected at 72 h.p.i. and lysed. When probed
with the anti-H5 antibody, lysates from both C and N terminal VP39 display viruses yielded
bands at the expected size, at 104 kDa (Fig 3.13 lanes 1 and 2, respectively). An expected band

73
Figure 3.12 Western immunoblot showing lysates of Sf21 cells infected with AcHAFLAG and probed with
a polyclonal rabbit anti-HA antibody (ProSci, diluted 1:10,000) , from 24 to 96 h.p.i. (lanes 1-4). Lanes 5
and 6 are FAdV-HA (R and L, respectively) infected CH-SAH cells, showing a doublet. Controls were
cells infected with AcCHIAFLAG (Sf21, lane 7), FadV-9Δ4 (CH-SAH, lane 8), AcΔCC (Sf21, lane 9), as
well as mock infected CH-SAH (lane 10) and Sf21 cells (lane 11). Molecular weight marker is
represented on left. Calculated protein sizes are represented on the right side of the figure.

74
Figure 3.13 Western immunoblot of Sf21 cells infected with AcVP39:HAFLAG and AcHA:VP39FLAG (lane
1 and 2, respectively), AcHA:GP64FLAG (lane 3) or AcHAFLAG (lane 4). Lanes 5 and 6 are FAdV-HA (R
and L, respectively) infected CH-SAH cells. Lanes 7-11 include cells infected with AcCHIAFLAG (Sf21,
lane 7), AcΔCC (Sf21, lane 8), and mock infected Sf21 cells (lane 9) and CH-SAH (lane 10). All lysates
were probed with a polyclonal rabbit anti-HA antibody (#3425) (ProSci, diluted 1:10,000) and a
secondary anti-rabbit antibody (1:20,000). Molecular weight marker is represented on left.
75
at 130 kDa was observed in lysates from Sf21 cells infected with AcHA:GP64FLAG (lane 3). The
two expected bands at 74 and 65 kDa were detected in the AcHAFLAG lysate from 72 h.p.i. (lane
4). Both FAdV-HAR and FAdV-HAL had a 95 kDa and a weaker 55 kDa band, and a very faint
60 kDa band as well (lanes 5 and 6, respectively).
FAdV-HAR appeared to have stronger HA expression than FAdV-HAL. AcCHIAFLAG and
AcΔCC had no bands corresponding to HA (lanes 7 and 8, respectively). However a 45 kDa
band, observed in Fig 3.12, was also detected for these, and in all other baculovirus-derived
lysates (lanes 1-4, 7-8). Wild-type AcMNPV infected cell lysate at 72 h.p.i. also showed a 45
kDa band (lane 11). This is suggestive of cross-reactivity between the commercial polyclonal
anti-HA antibody and a protein from baculovirus infected cells. No bands were detected for the
mock infected CH-SAH or Sf21cells (lanes 9-10).
3.3.3 Detection of HA from the recombinant baculoviruses with monoclonal anti-H5 HA
antibodies
Recombinant baculovirus-expressed H5 HA was also monitored for its ability to react
with monoclonal anti-H5 HA antibodies. Initially a panel of six monoclonal antibodies against
H5 HA, kindly provided by Dr. Robert Webster and Bindumadhav Marathe (St. Jude’s
Children’s Research Hospital, TN), were assessed for detection of HAFLAG at 72 h.p.i. AcHAFLAG
and FAdV-HA samples were alternately loaded along the gel, and following immunoblotting, the
PVDF membranes were sliced so that each strip included one lane for AcHAFLAG and the second
for FAdV-HAR. Each membrane strip was incubated with different monoclonal antibodies (1:500
dilution). Based on this Western blot, VN04-2, one of the six antibodies tested, showed the
strongest reaction and it was selected for further studies.
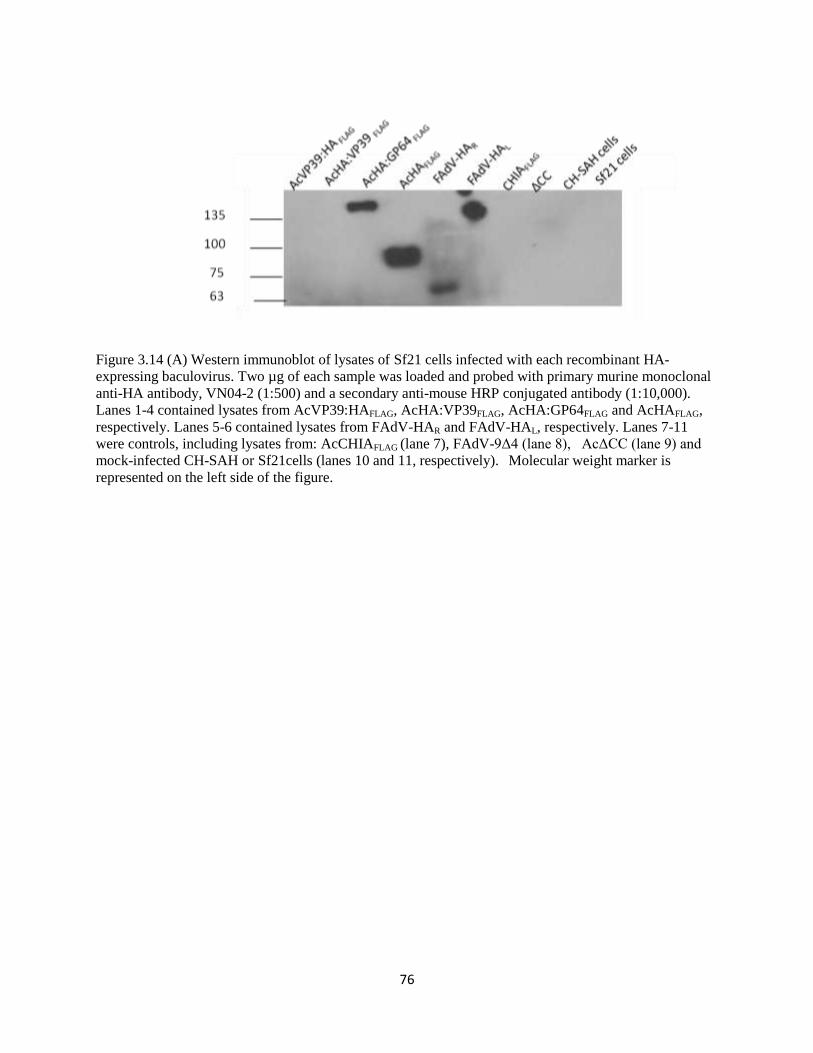
76
Figure 3.14 (A) Western immunoblot of lysates of Sf21 cells infected with each recombinant HA-
expressing baculovirus. Two µg of each sample was loaded and probed with primary murine monoclonal
anti-HA antibody, VN04-2 (1:500) and a secondary anti-mouse HRP conjugated antibody (1:10,000).
Lanes 1-4 contained lysates from AcVP39:HAFLAG, AcHA:VP39FLAG, AcHA:GP64FLAG and AcHAFLAG,
respectively. Lanes 5-6 contained lysates from FAdV-HAR and FAdV-HAL, respectively. Lanes 7-11
were controls, including lysates from: AcCHIAFLAG (lane 7), FAdV-9Δ4 (lane 8), AcΔCC (lane 9) and
mock-infected CH-SAH or Sf21cells (lanes 10 and 11, respectively). Molecular weight marker is
represented on the left side of the figure.

77
Cells infected with each recombinant HA expressing baculovirus were harvested at 72
h.p.i. and probed with mAb VN04-2 at a dilution of 1 in 500 (Fig 3.14). VN04-2 positive HA
bands were detected for HA:GP64FLAG at 130 kDa (lane 3) and HAFLAG, at 74 kDa and a faint
one at 25 kDa (lane 4). No bands were detected for either of the VP39 display viruses (lane 1 and
2, Fig. 3.16). Only a faint band was detected for FAdV-HAR, while none were detected for
FAdV-HAL (lanes 5 and 6, respectively). There were no detectable bands in any of the controls,
including AcCHIAFLAG (lane 7), FAdV-9Δ4 lysate (lane 8), AcΔCC (lane 9) and mock-infected
CH-SAH or Sf21mock cells (lanes 10 and 11, respectively). This Western blot indicated that the
anti H5 HA monoclonal antibody VN04-2 detected only the overexpressed or GP64-displayed
HA but neither of the VP39 displayed HAs.
3.3.4 Detection of HA in Sf21 cells infected with recombinant HA-expressing baculoviruses with
polyclonal anti-serum to H5N1 virus
A colorimetric Western blot was conducted to determine whether HA from lysed Sf21
cells infected with the recombinant HA-expressing baculoviruses was recognized by chicken-
sera from H5N1 infected birds as the primary antibody, kindly provided by Dr. Robert Webster
and Bindumadhav Marathe at St. Jude’s Children’s Research Hospital, (Memphis, TN) (Fig
3.15). This anti-sera reacted with a 104 kDa band for both C and N terminal capsid displayed
HA, VP39:HAFLAG and HA:VP39FLAG (names shown above lanes), 130 and 90 kDa bands for
HA:GP64FLAG, and 74 and 65 kDa bands for HAFLAG. Bands at 64 kDa corresponding to full-
length HA were detected for both FAdV-HAR and FAdV-HAL samples along with some lower
molecular weight bands. Additionally, these FAdV-HA samples had a lower mass 37 kDa band,

78
Figure 3.15 Colorimetric Western immunoblot for Sf21 cells infected with each recombinant HA
expressing virus, probed with a H5N1 specific polyclonal Ab (1:500). All samples were probed with a
secondary anti-chicken AP conjugated antibody (1:1,000). M denotes the marker protein lane. FAdV-
HA (R and L, respectively) infected CH-SAH cells were also used. Cells infected with AcCHIAFLAG
(Sf21 cells) mock infected CH-SAH cells, and Sf21 cells were employed as controls. M is molecular
weight marker.

79
corresponding to the HA1 subunit of HA. Some minor bands were detected for CHIAFLAG, mock-
infected CH-SAH and Sf21 cells, (lanes 7, 8 and 9, respectively).
3.3.5 Testing of serum from FAdV-HA vaccinated birds using HAFLAG as antigen
Having established that known HA antibodies reacted with HAFLAG, sera from FAdV-HA
vaccinated birds were tested for the presence of anti-HA antibodies. For this a Western blot was
conducted with HAFLAG protein from infected cells collected at 72 h.p.i. and using serum from
chickens vaccinated with FAdV-HAR. The preimmune sera were the negative control. Alkaline
phosphotase conjugated anti-chicken IgG was the secondary antibody. A 65 kDa band,
corresponding to HAFLAG was detected for the sera from the vaccinated chickens, but no 65 kDa
bands were detected using preimmune sera (Fig 3.16).
3.4 Biological activity of HA expressed in the insect cells
The various recombinant viruses expressed HA as shown by anti-FLAG antibody in
Western immunoblots. The HAs also reacted with different monoclonal and polyclonal
antibodies raised against H5 specific HA. In addition, the biological activity of the recombinant
HA was assessed by hemagglutination and hemadsorption assays and by syncytia formation of
infected cells.
3.4.1 Hemagglutination assays
One of the biological activities of HA present in influenza virus virions is that it can
mediate hemagglutination of RBCs. The hemagglutinating activity of both sonicated and whole
Sf21 cells infected with each of the recombinant HA-expressing baculoviruses, as well as

80
Figure 3.16 (A) Colorimetric Western immunoblot of Sf21 cells infected with AcHAFLAG (lanes 1-5) and
at 72 h.p.i., and probed with serum from chickens vaccinated with the FAdV-HA vaccine as the primary
antibody (+ve) (1:500) (lanes 1-3), or with naive chicken serum (-ve) (1:500) (lanes 4 and 5). All samples
were probed with a secondary anti-chicken AP conjugated antibody (1:1,000). (B) Schematic of HAFLAG
construct that comprises the recombinant HA overexpressed HAFLAG.MW is molecular weight marker.
1 2 3 4 5
81
recombinant budded virions of display viruses, was assessed. Sonicates were used over lysates
for the hemagglutination assays to ensure that the detergent did not interfere with the test.
Approximately 1x10⁶ Sf21 cells were infected with one of each of the recombinant HA-
expressing baculoviruses. Cells infected with AcCHIAFLAG, a non-HA recombinant baculovirus,
and AcΔCC and non-infected Sf21 cells were also assessed. Cells were infected at an MOI of 10,
collected at 48 h.p.i., and pelleted by centrifugation. Cells were then resuspended in 1 ml of PBS
(pH 6.2) and disrupted by sonication. Total sonicate was then quantified and 50 µl was added to
the first well of the microtitre plate, and the assay was done as described in Materials and
Methods. Purified Newcastle Disease Virus, which has hemagglutinating activity, was the
positive control. Although low, hemagglutination was detected for sonicates for AcHAFLAG,
which had an HA titre of 4, and AcHA:GP64FLAG, which had an HA titre of 2 (Fig 3.17A).
Infected Sf21 cells with all other viruses including AcHA:VP39FLAG, AcVP39:HAFLAG,
AcCHIAFLAG and AcΔCC showed no evidence of hemagglutination.
In the absence or low levels of hemagglutination of cell sonicates, the hemagglutinating
activity of whole (non-sonicated) infected cells was also assessed (Fig 3.17B). Cells were
infected with each recombinant HA-expressing baculovirus at an MOI of 10. At 48 h.p.i.
infected cells were collected and counted using a hemocytometer. Approximately 3.5 x 10⁵ cells
from each infection (diluted in PBS) were added to the first well of a 96-well microtitre plate and
diluted two-fold across the plate. Cells infected with the HAFLAG overexpression virus had an HA
titre of 8. Those by AcHA:GP64FLAG had an HA titre of 4, and HA:VP39FLAG and VP39:HAFLAG
had HA titres of 2 and 0 respectively, although VP39:HAFLAG showed some evidence of
hemagglutination in the first well. The NDV preparation had an HA titre of 2048 while AcΔCC-
infected Sf21 cells had a titre of 0.

82
A
B
Figure 3.17 Hemagglutination of virus-infected cells. Cells were infected with each recombinant virus as
indicated to the left of each row and collected at 48 h.p.i. Samples were added to the first well of a 96-
well plate, and diluted two-fold across the plate. 3.5 x10⁵ cells were either sonicated (A) or added to the
plate without sonication (B).
83
Because surface and capsid display involved the direct fusion of HA to baculovirus
envelope and capsid proteins, the hemagglutinating ability of budded virions of the
HA:GP64FLAG , VP39:HAFLAG and HA:VP39FLAG was also determined. Medium from Sf21 cells
infected at an MOI of 10 was collected at 96 h.p.i. and the viruses were concentrated. 100 µl of
concentrated viruses were added to the microtitre plate and diluted two-fold. There was no
hemagglutination by the recombinant budded virions (data not shown).
3.4.2 Hemadsorption assays
Since cells with biologically active HA in their membranes are capable of adsorbing red
blood cells, hemadsorption assays were conducted to determine whether Sf21 cells infected with
the recombinant HA-expressing baculoviruses also demonstrated this biological activity.
Hemadsorption was not observed for mock infected cells (Fig. 3.18D) or
AcCHIA(ASD)FLAG infected cells, suggesting that Sf21 cells or the FLAG tag on its own do not
promote hemadsorption. AcΔCC infected cells showed no evidence of hemadsorption,
confirming that wild-type baculovirus is not capable of adsorbing RBCs. Cells infected with
AcHAFLAG (Fig 3.18 B) and AcHA:GP64FLAG (Fig 3.18 C) were capable of adsorbing RBCs, but
cells infected with AcHA:VP39FLAG or AcVP39:HAFLAG were not. Both the number of
RBCs/cell and the number of cells with adsorbed RBCs increased with the MOI and with time
p.i., up to 60 h.p.i. Hemadsorption was not detected in cells infected at an MOI of 1 with any of
the recombinant viruses at 20 hours. However, at 40 and 60 h.p.i., hemadsorption was observed
in cells infected with either AcHAFLAG or AcHA:GP64FLAG. When cells were infected at an MOI
of 10 with either AcHAFLAG or AcHA:GP64FLAG, hemadsorption was apparent earlier, at 20
h.p.i., when compared to the earliest detection at 40 h.p.i. for cells infected at a MOI of 1.
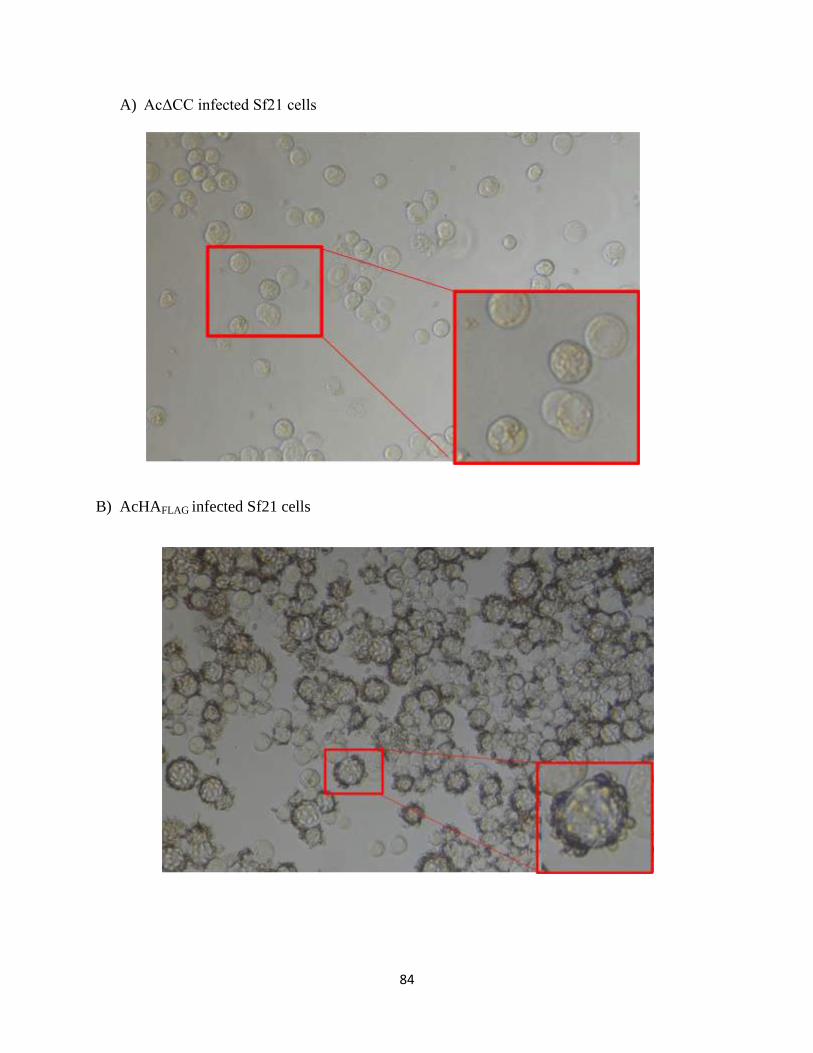
84
A) AcΔCC infected Sf21 cells
B) AcHAFLAG infected Sf21 cells

85
C) AcHA:GP64FLAG infected Sf21 cells
D) Mock infected Sf21 cells
3.18 Hemadsorption assays. Sf21 cells infected with one of each recombinant viruses at an MOI of 1. At
60 h.p.i. 1% RBCs were added to the monolayer of cells infected with (A) AcHAFLAG (B)

86
AcHA:GP64FLAG (C) AcΔCC or (D) Mock infected Sf21cells. A magnified image of a hemadsorbed (B)
and (C), or non adsorbed cells (A) is depicted in the lower right corner of each panel.

87
Sf21 cells infected with AcHA:VP39FLAG or AcVP39:HAFLAG showed no evidence of
hemadsorption, even at 60 h.p.i.
3.4.3 Syncytia formation in Sf21 cells infected with recombinant HA- expressing baculoviruses
It appeared that some of the HA recombinant baculovirus infected cells showed evidence
of hemifusion and syncytia formation. This occurred for cells that were infected with AcHAFLAG
and AcHA:GP64FLAG where HA would be transported to the membrane, but not
AcHA:VP39FLAG or AcVP39:HAFLAG where HA would remain intracellular. For a more in-depth
analysis, cells infected with each of the recombinant viruses at an MOI of 10 were monitored for
syncytia formation. Control cells included AcΔCC infected, and mock infected cells. Cells
infected with AcHAFLAG and AcHA:GP64FLAG showed evidence of syncytia (Fig. 3.19). This
suggests that the HA was present on the infected Sf21 cell membrane and was biologically
active, being cleaved and mediating fusion with adjacent cells. Syncytia formation was not
observed in cells infected with either AcHA:VP39FLAG or AcVP39:HAFLAG nor in AcΔCC
infected or mock infected Sf21cells. Since biologically active influenza virus HA mediates
syncytia formation between infected cells, this result suggests that HA is present on the
membranes of cells infected with AcHAFLAG and AcHA:GP64FLAG, but not those infected with
AcHA:VP39FLAG or AcVP39:HAFLAG.

88
Figure 3.19 Syncytia formation of AcHAFLAG and AcHAFLAGGP64 infected cells compared to
AcCHIAFLAG and mock infected cells. Cells were infected at an MOI of 10 and examined using a phase
contrast light microscope at 72 h.p.i.

89
3.5 Neuraminidase expression
A second major membrane protein of the influenza virus is the immunogenic, sialic acid
degrading enzyme neuraminidase. Birds infected with influenza virus develop antibodies against
both HA and NA. Thus NA was overexpressed in baculovirus for potential use as an alternate
diagnostic reagent. The following experiments were conducted with the assistance of an
undergraduate project student, James Ackford, who worked under my direction.
3.5.1 NA expression
NA from an H5N1 virus was cloned into a baculovirus vector under the polyhedrin
promoter in a similar manner to HAFLAG, except that NA was tagged with the short (9 amino-
acid) HA tag (N-YPYDVPDYA-C). Accuracy of cloning was confirmed by PCR analysis using
M13 forward and reverse primers, and the cloned region of NAHA was sequenced.
The temporal expression of NAHA was examined via Western blot analysis using a
murine anti-HA epitope primary and murine secondary antibody. Sf21 cells were infected with
AcNAHA at an MOI of 10, collected from 48 to 96 h.p.i., pelleted and lysed with NP40 lysis
buffer. Two µg of lysate from each time point was analyzed.
NAHA was detected at all time points tested at the expected size of 60 kDa (Fig. 3.20). As
the course of infection increased, so did the relative amount of the expressed NAHA (Fig 3.20). A
38 kDa band was detected for AcCATHHA infected Sf21 cell lysate reflecting the size of
CATHHA and confirming that the anti-HA tag antibody was capable of detecting an HA-tagged
protein. No bands were detected for cells infected with AcCHIA(ASD)FLAG or for mock-infected
cells.
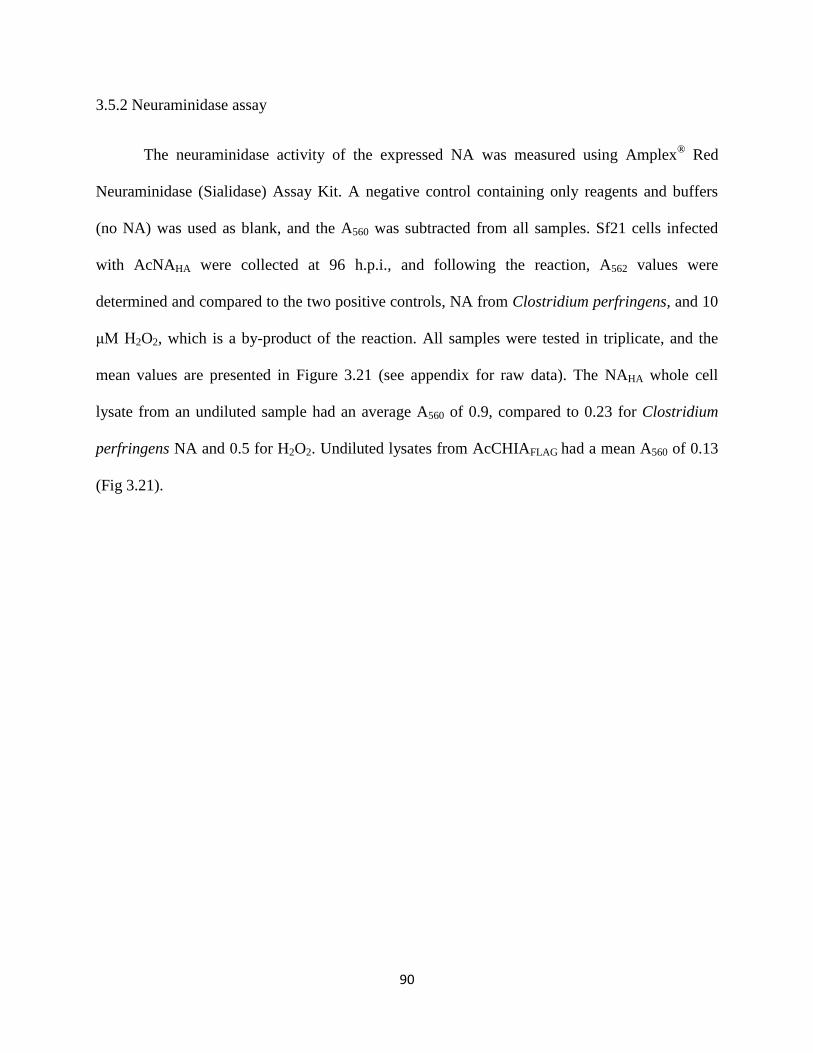
90
3.5.2 Neuraminidase assay
The neuraminidase activity of the expressed NA was measured using Amplex® Red
Neuraminidase (Sialidase) Assay Kit. A negative control containing only reagents and buffers
(no NA) was used as blank, and the A560 was subtracted from all samples. Sf21 cells infected
with AcNAHA were collected at 96 h.p.i., and following the reaction, A562 values were
determined and compared to the two positive controls, NA from Clostridium perfringens, and 10
μM H2O2, which is a by-product of the reaction. All samples were tested in triplicate, and the
mean values are presented in Figure 3.21 (see appendix for raw data). The NAHA whole cell
lysate from an undiluted sample had an average A560 of 0.9, compared to 0.23 for Clostridium
perfringens NA and 0.5 for H2O2. Undiluted lysates from AcCHIAFLAG had a mean A560 of 0.13
(Fig 3.21).
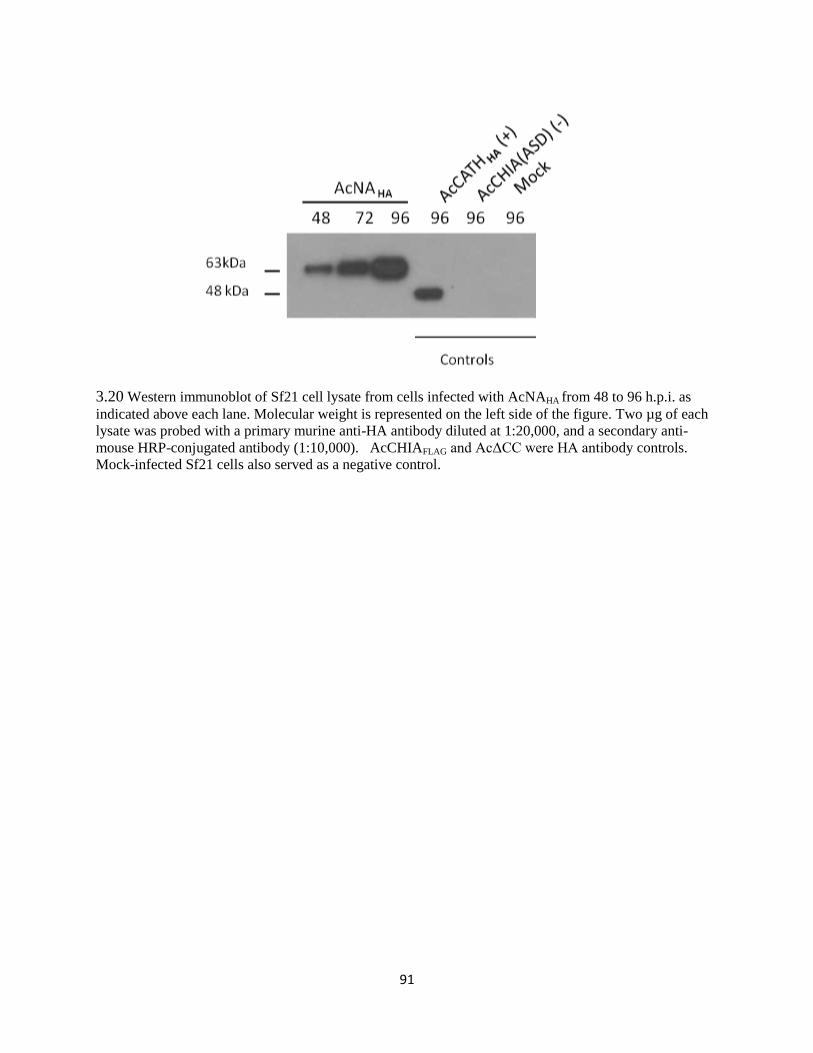
91
3.20 Western immunoblot of Sf21 cell lysate from cells infected with AcNAHA from 48 to 96 h.p.i. as
indicated above each lane. Molecular weight is represented on the left side of the figure. Two µg of each
lysate was probed with a primary murine anti-HA antibody diluted at 1:20,000, and a secondary anti-
mouse HRP-conjugated antibody (1:10,000). AcCHIAFLAG and AcΔCC were HA antibody controls.
Mock-infected Sf21 cells also served as a negative control.
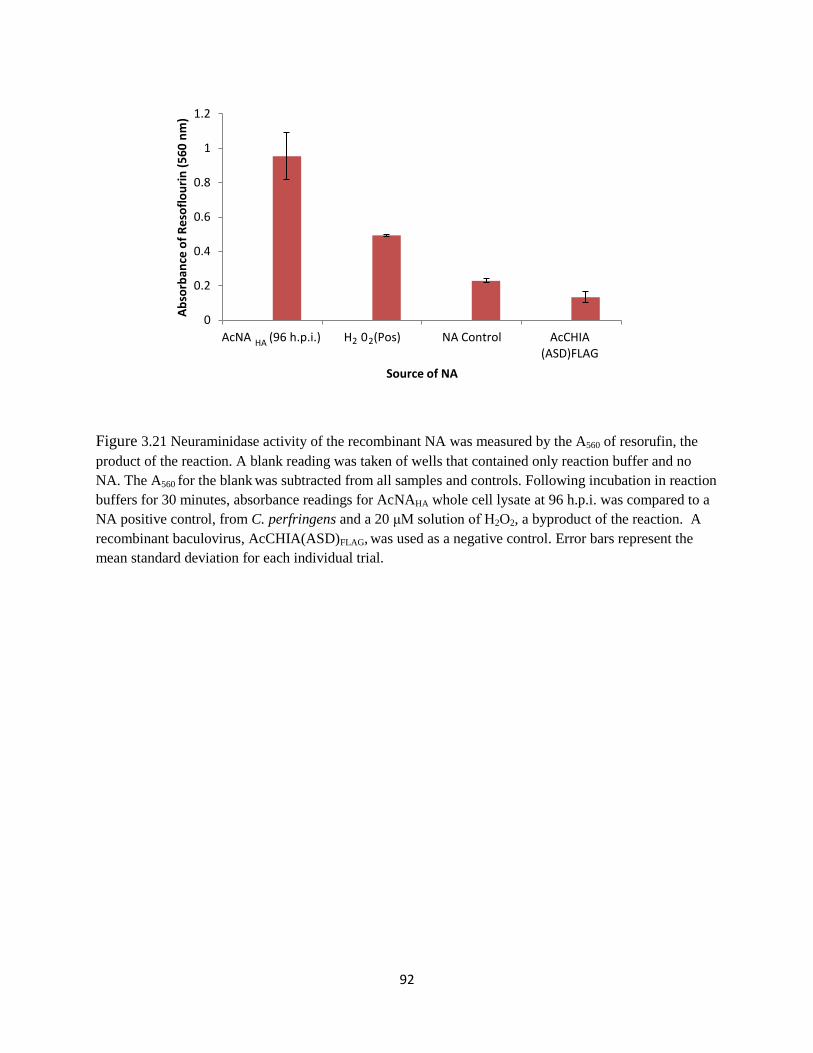
92
Figure 3.21 Neuraminidase activity of the recombinant NA was measured by the A560 of resorufin, the
product of the reaction. A blank reading was taken of wells that contained only reaction buffer and no
NA. The A560 for the blank was subtracted from all samples and controls. Following incubation in reaction
buffers for 30 minutes, absorbance readings for AcNAHA whole cell lysate at 96 h.p.i. was compared to a
NA positive control, from C. perfringens and a 20 μM solution of H2O2, a byproduct of the reaction. A
recombinant baculovirus, AcCHIA(ASD)FLAG, was used as a negative control. Error bars represent the
mean standard deviation for each individual trial.
0
0.2
0.4
0.6
0.8
1
1.2
AcNA (96 h.p.i.) H 0 (Pos) NA Control AcCHIA (ASD)FLAG
Ab
sorb
ance
of
Re
sofl
ou
rin
(5
60
nm
)
Source of NA
HA 2 2
93
Chapter 4: Discussion
The goal of this study was to construct four baculovirus expression vectors based on:
protein overexpression, surface display and capsid display for the production of HA and to assess
and compare the relative yield of HA and their utility as antigen to detect anti H5 Abs. All four
recombinant viruses were generated and the constructs were confirmed by sequence analysis.
Growth of the viruses was compared to ensure that it was not compromised by insertion
of the various HA gene ORF constructs. All four viruses had similar growth kinetics, as
expected, since replication of recombinant viruses generated via baculovirus overexpression is
typically comparable to that of wild-type AcMNPV (Oker-Blom et al., 2003; Luckow et al.,
1993). Furthermore, high-titre recombinant viruses have been produced when foreign proteins
are displayed on either the baculovirus surface or capsid (Ernst et al., 1998; Ernst et al., 2000;
Molinari et al., 2011; Song et al., 2010). These results confirmed that budded virus production
was not compromised by the expression of HA via overexpression, surface display or capsid
display. Further, these results implied that any differences observed in HA expression, reactivity,
or biological activity among these recombinant viruses would not be due to poor or delayed
budded virus production.
The most commonly employed expression method assessed for HA production was
protein overexpression. Overexpression of influenza virus HA via BEVS is conceptually not
new, and was first described by Kuroda et al. (1986) in which HA was expressed in insect cells
and was demonstrated to maintain its biological activity. Since then, numerous studies have been
conducted in which HA has been expressed in baculovirus and employed in vaccine
development or in diagnostics (Johansson, et al., 1999; Brett et al., 2005; Tao, et al., 2009; Prel

94
et al., 2007; Wang et al., 2006; Bright et al., 2007; Pushko et al., 2005). Further, a patented and
soon-to-be commercially available baculovirus-based seasonal influenza virus vaccine has
demonstrated success in ongoing clinical trials (Wang et al., 2006).
4.1 Characterization of expressed HAs using an anti-FLAG antibody
In the present study, HA derived from HPAI A/chicken/Hubei/489(H5N1) was
overexpressed using a commercially available BEVS, and protein expression was monitored
temporally in both Sf21 and Hi-FiveTM
insect cells. The expected size of the full-length,
unprocessed protein H5 HA0 was 65 kDa, corresponding to the full-length HA0 and the carboxy
terminal FLAG epitope tag, which was added to the HA to allow for detection. Further, because
HA0 can undergo proteolytic cleavage by furin proteases (Klenk et al., 1975) into HA1 and HA2
subunits with masses of 37 and 27 kDa, respectively, it was predicted that there would be two
distinct products on the Western blot, of 65 kDa, for the full length HA0, and 27 kDa,
corresponding to the HA2 subunit including the FLAG tag. The HA1 subunit was not expected to
appear on the blot because the FLAG tag was fused to the C-terminus of the protein, meaning
that the 37 kDa HA1 would not be detected upon cleavage of HA. SDS-PAGE and Western
immunoblot (Figures 3.1- 3.4) revealed the two bands using an anti-FLAG antibody from 48 to
96 h.p.i. in both Sf21 and Hi-Five TM
insect cells. The 65 kDa band was suggestive of the full-
length, unprocessed HAFLAG fusion. It is probable that the 25 kDa band, though ~2 kDa less than
the expected size, corresponds with the HA2 cleavage product, fused to the C-terminal FLAG tag.
These results confirmed that HAFLAG was expressed as H5 HA protein by AcHAFLAG, and
correlated with previous studies which found that HA undergoes cleavage in insect cells. For
instance, Kuroda et al. (1986) reported that when probed with an anti-HA antibody, three bands,
corresponding to HA0 (65 kDa), HA1 (37 kDa) and HA2 (27 kDa) were detected. An additional

95
strongly expressed band at 74 kDa was detected on the Western blot and suggested that further
elucidation of the source of this protein was necessary.
Throughout the replication cycle greater HA expression was observed in Hi-FiveTM
cells
than in Sf21 cells. For instance, even when only 5 µg of total protein was loaded into the SDS-
polyacrylamide gel, the intensity of the HAFLAG bands in Hi-FiveTM
cells was greater than
HAFLAG bands in Sf21 cells when 10 µg of protein was loaded. This is consistent with other
studies showing that expression in Hi-FiveTM
is greater than in Sf21 cells (Grandos et al. 1994;
Davis et al., 1993; Zhang et al., 2008). Further, Krammer et al. (2010) demonstrated that
expression of H5N1 HA (for the development of a virus-like particle–based vaccine) was greater
in Hi-FiveTM
cells than in Sf21 cells, in both the budded virions and infected cellular extracts
(Krammer et al., 2010). They concluded that Hi-FiveTM
cells represent the most advantageous,
cost-effective and viable option for the production of large amounts of recombinant baculovirus-
derived proteins, particularly if the ultimate goal is vaccine development (Krammer et al., 2010).
Despite these results, Sf21 cells were employed more frequently throughout this research,
because of their ease of use. Further, Hi-FiveTM
cells are more easily maintained in serum free
medium, which is more costly than serum-containing medium. Because one end goal of this
research was to develop an economical diagnostic reagent, we wanted to be cognisant of cost at
each point throughout the research.
We compared the recovery of HAFLAG in NP40 lysis buffer with a RIPA lysis one for
possible application in ELISA. RIPA contains sodium deoxycholate which functions to solubilise
membranes, while maintaining the integrity and biological activity of the proteins, ultimately
making it an ideal candidate antigen in ELISAs. There was only a marginal difference in the
extent of detection of HAFLAG between RIPA and NP40 based buffers at 72 h.p.i. in which the

96
HAFLAG band appeared stronger for RIPA buffer. Otherwise, HA recovery seemed comparable
between NP40 and RIPA lysis buffers. These results suggest that RIPA buffer would be efficient
for cell lysis and solubilisation of HA.
In these studies two bands at 74 kDa and 65 kDa were consistently detected. In previous
Western blots using either Sf21 or Hi-FiveTM
cells grown in the presence of serum and infected
with AcHAFLAG, the highest molecular weight band at 74 kDa was detected earlier, at 48 h.p.i. In
comparison, it was not detected in the soluble fraction of Hi-FiveTM
cells grown in serum-free
medium until 96 h.p.i. in Fig 3.6, regardless of the lysis buffer employed. This difference in
timing was unexpected, raising questions about the nature of both the 74 kDa and 65 kDa
proteins.
I had two hypotheses regarding the nature of the 65 kDa and 74 kDa bands. The first was
that the slowest migrating, 74 kDa band actually represented the full-length HAFLAG, and that the
65 kDa band was a cleavage product due to protease activity derived from foetal bovine serum.
While bands of 74 kDa and 65 kDa would not correspond with natural HA cleavage, in which
bands at 65 kDa and 27 kDa would be expected, it is possible that HA undergoes cleavage by a
protease other than furin at a different cleavage site of the HA protein. While research on
protease containing-serum is limited, one group found that when expressed in cells grown in the
presence of FBS-containing medium, recombinant human hepatocyte growth factor (r-HgGF)
underwent cleavage (Shimomura et al., 1992). This cleavage was not observed when cells were
grown in serum free medium. Researchers identified and purified a novel serine protease present
in FBS, and when they added this protease to serum free medium, cleavage of r-hHGF was noted
(Shimomura et al., 1992). While H5 HA undergoes cleavage by furin proteases and not by serine
97
proteases, this research provides evidence that proteases in serum can alter the cleavage pattern
of various proteins.
My second hypothesis was that the 65 kDa band represented the full-length non
glycosylated HAFLAG and the 74 kDa band corresponded to a glycosylated version of HAFLAG.
HA undergoes several post-translational modifications, including formation of disulfide bonds,
(Chreighton et al., 1988; Segal et al., 1992), addition of N-glycosidic oligosaccharide side chains
(Keil et al., 1985) and acylation (Schmidt et al., 1982). Glycosylation of HA is a possible source
for the higher 74 kDa band of HAFLAG observed in immunoblots. Since each N-linked
glycosylation adds approximately 2.5 kDa to a protein (Kornfeld et al., 1985), and it has been
well documented that HA undergoes significant N-linked glycosylation to its HA1 subunit, it is
possible that that 65 kDa band corresponds to non glycosylated HA while the 74 kDa band
corresponds with the processed, full-length version of HA. This hypothesis is consistent with
other reports in which recombinant HA produced via BEVS remained biologically functional and
properly glycosylated (Wang et al., 2006).
The hypothesis that proteases present in FBS were responsible for the 74 kDa and 65 kDa
bands was investigated first. When expression of HAFLAG in Hi-FiveTM
cells was compared in the
presence or absence of serum containing medium, both the 74 kDa and 65 kDa bands were
present in both samples at similar levels (Fig 3.6). Expression of HAFLAG was marginally higher
in cells grown in the presence of FBS than in the absence of FBS. It was expected that if
proteases in FBS were responsible for cleavage, then the 74 kDa protein would undergo greater
cleavage in infected cells grown in the presence of serum. Alternatively, there should have been
a single, stronger band in infected cells grown in the absence of serum. However, the results
were the opposite with the levels of the 74 kDa band in cells grown in the presence of serum
98
being higher. This led to the conclusion that FBS is not responsible for cleavage and for the
presence of the 74 and 65 kDa bands. This experiment was repeated in Sf21 cells and the result
was the same (data not shown). While some have found that serum enhances cleavage, others
have reported that cleavage activity is actually enhanced in the absence of serum (Gardner et al.,
1994), as many sera contain protease inhibitors. This may provide an explanation as to why
expression of the 74 kDa protein for HAFLAG was slightly greater in infected cells grown in the
presence of serum. This result led me to investigate whether glycosylation was responsible for
the observed 74 and 65 kDa proteins from Sf21 and Hi-FiveTM
cells infected with AcHAFLAG.
To determine if the 74 kDa protein is a glycosylated form, AcHAFLAG was grown in the
presence or absence of tunicamycin (Fig 3.7). In the presence of tunicamycin, a known inhibitor
of glycosylation (Duksin et al., 1982), the 74 kDa protein was absent while the 65 kDa protein
remained, suggesting that the 74 kDa protein resulted from glycosylation of the 65 kDa HA.
Because the difference in size is about 10 kDa, it can be inferred that four sites of the HA protein
were glycosylated. This concurs with other reports suggesting that the HA protein is heavily
glycosylated, with H5 and H7 subtypes having anywhere from 4-6 glycosylation sites
(Matrosovich et al., 1999). While some glycosylation sites are conserved in the H5 subtype, such
as at position 161 (Matrosovich et al., 1999), others vary (Matrosovich et al., 1999; Baigent et
al., 2001). Interestingly, while the H5 and H7 subtypes of HPAI viruses that infect poultry have
up to four (Banks and Plowright, 2003), this is not necessarily correlated with increased
pathogenicity (Banks and Plowright, 2003). Regardless, one of the main advantages of BEVS is
that it allows for the production of fully processed protein that is post translationally modified in
the insect cells (Luckow et al., 1995). My results are consistent with previous reports that
baculovirus expressed HA has at least two distinct bands on a Western blot, and that in the

99
presence of PNGase F, an enzyme which cleaves N-linked glycans, and endoglycosidase H, an
enzyme that cleaves oligosaccharides, the upper band disappears (Wang et al., 2006). These
results clearly show that glycosylation of the HA protein occurs when it is overexpressed via
BEVS making it an attractive candidate for production of immunologically reactive HA.
GP64 display represents a relatively new advancement in the field of baculovirus
expression yet it has already been extensively described in the literature (Ernst et al., 2000;
Grabherr et al., 2001; Jin et al., 2008; Boublik et al., 1995). Here, HAFLAG was fused to the N-
terminus of the baculovirus GP64 protein. The expected 129 kDa band was observed in both
Sf21 and Hi-FiveTM
insect cells when probed with the anti-FLAG and anti-GP64 antibodies (Fig
3.8). Additionally, a smaller 90 kDa band was present on the blots. This band corresponds with
only the HA2 subunit and FLAG-fused epitope tag to the GP64 protein, suggesting that GP64
fusion can produce some proteolytically cleaved HA. Finally, because wild-type GP64 was
retained in the bacmid, a 64 kDa band was observed using the anti-GP64 antibody but not the
FLAG antibody. While surface-displayed H5 HA has been described (Jin et al., 2008; Yang et
al., 2006), my work is the first to include the HA signal peptide rather than the GP64 signal
peptide for translocation to the ER (Jin et al., 2008; Yang et al., 2006). Retaining the native
signal peptide of a glycoprotein for translocation has been shown to be superior to replacing it.
For example, when the signal peptide of Lassa virus glycoprotein GP-C was substituted with the
signal peptides of influenza virus HA or CD8, proteolytic cleavage of GP-C into GP-1 and GP-2
did not occur (Eichler et al., 2003).
Recently, Yang et al. (2006) conducted a study which compared the effect of employing
only small domains from the GP64 protein, such as the signal peptide and cytoplasmic domain,
for fusion of HA rather than the entire full length GP64 protein. Interestingly, they found that

100
when HA was fused between the N-terminal GP64 signal peptide and the C-terminal
cytoplasmic domain of GP64, while omitting the rest of the GP64 protein, HA was sufficiently
expressed on the envelope of the virion. For this fusion, the GP64 TM domain was removed,
and instead the HA TM domain was employed for translocation to the membrane. The major
difference between this fusion, which employed only small portions of the GP64 protein, and the
HA:GP64FLAG produced in my work is the size of the entire GP64 protein plus HAFLAG. The
HA:GP64FLAG fusion produced in my work was over 130 kDa, whereas the fusion produced by
Yang et al (2006), comprising only the GP64 signal peptide, HA (minus its 16 amino acid signal
peptide), and the GP64 CTD, was not much larger than the HA itself. This smaller fusion may
better provide for proper folding of HA, or budding of the virus, and therefore future
experiments could compare these two approaches.
VP39 display is the most novel form for baculovirus expression (Kukkonen et al., 2003).
VP39 is not a glycoprotein and therefore is not directed to the ER and Golgi apparatus but
remains cytoplasmic and nuclear. Hence the HA transmembrane C-terminal domain and N-
terminal signal peptide were removed to ensure that the VP39 fusion proteins remained
intracellular and could be incorporated into viral nucleocapsids. The predicted size of each
VP39 fusion was 104 kDa based on the amino acid sequence. Both the anti-FLAG antibody and
the anti-VP39 antibody revealed the expected 104 kDa protein in cells infected with either the
HA:VP39FLAG or VP39:HAFLAG fusion viruses (Fig 3.9). The anti-VP39 antibody detected the
same 104 kDa HA, as well as a 39 kDa band corresponding to the wild-type VP39 protein, which
was retained in the bacmid so that virus production would not be compromised. Also noteworthy
is that C-terminal VP39 (VP39:HAFLAG) display was expressed at higher levels in both Sf21 and
Hi-FiveTM
cells than N-terminal VP39 (HA:VP39FLAG) display. My data are in accordance with

101
the reports of Kukkonen et al. (2003), that HA can be successfully fused to either end of the
VP39 protein and that removal of the SP and TM does not affect detection by the anti-FLAG or
anti-VP39 antibodies. Further, my data indicated that C-terminal VP39 display may promote
greater expression of the foreign protein than N-terminal VP39 display.
A notable difference between capsid display and the other two expression methods was
the lack of a cleavage product by the VP39 display. If HA cleavage occurred, then 77 kDa and
66 kDa bands should have been present on the blots for HA:VP39FLAG and HA:VP39FLAG,
respectively. For the C-terminal fusion, the cleavage product would correspond to VP39, FLAG
and the HA1 subunit (37 kDa) because the HA protein was tagged with FLAG at its N-terminus.
Alternatively, the cleavage product for the N-terminal fusion would correspond to VP39, the
HA2 subunit, and FLAG, as the HA protein was tagged with FLAG at its C terminus. However,
because HA undergoes cleavage by furin proteases, which are present in the trans-Golgi network
of the cell (Stieneke-Grober et al., 1992), and due to the fact that the SP was removed from HA
preventing it from being directed to the ER/Golgi apparatus, cleavage of HA0 was not expected
in VP39 display. Regardless, it is possible that lack of cleavage of HA0 could affect its biological
activity.
One of the most unique attributes of capsid display is that the VP39 protein tolerates
fusions to both its C and N termini (Kukkonen et al., 2003). Kukkonen et al. (2003) showed that
fusion to either the amino or carboxy terminus of VP39 allowed for sufficient display of foreign
protein (EGFP) on the baculovirus capsid. My thesis research is the first to apply VP39 display
to a viral protein, specifically the HA of influenza virus, corroborating previous research by
Kukkonen et al. (2003), and two others conducting capsid display by fusing their protein of
interest to the N-terminus of VP39 (Song et al., 2010; Molinari et al., 2011). Further, because

102
the present results suggest that C-terminal VP39 display may yield more recombinant protein,
future researchers should consider employing C-terminal, rather than N-terminal VP39 display,
particularly when trying to produce large amounts of foreign protein.
One of the main advantages of baculovirus display is that it allows for localization of the
protein of interest directly on the budded virion, (Kukkonen et al., 2003; Luckow et al., 1995;
Oker-Blom et al., 2003; Song et al., 2010; Molinari et al., 2011). My research has confirmed that
recombinant baculovirus produced HA is detectable in both Sf21 and Hi-FiveTM
insect cells,
regardless of the expression method used. Not surprisingly the concentrated AcHAFLAG budded
virions also contained HAFLAG. Because HA on its own goes to the cell membrane, it is possible
that the baculovirus trapped some HA in the envelope of its virion as it buds from the cell. The
HA in either HAFLAG or HA:GP64FLAG virions was present at consistently higher levels than in
the capsid display virions. While the hypothesis that GP64 displayed HA expression would be
strongest was confirmed by these results, the prediction that capsid displayed HA, particularly at
the C-terminus, would produce strong HA expression, was not. Though the majority of research
on capsid display to date has been on localization rather than protein expression and recovery, it
was shown using both EM and Western immunoblot that capsid display is an effective tool for
recovery of the protein of interest from the budded virions (Kukkonen et al., 2003; Molinari et
al., 2012). Instead, I was able to demonstrate only a very faint HA-specific band for both capsid-
displayed viruses at the expected size of 104 kDa. In contrast, strong bands corresponding to
overexpressed HA were observed for the recombinant budded virions. These results dispute
research that baculovirus capsid display is superior to overexpression of membrane bound
proteins for the successful generation of budded virions containing the protein of interest

103
(Kukkonen et al., 2003). My results suggest that overexpression is an effective method for
producing budded virions which contain the protein of interest.
One overarching observation from my results is that HAFLAG and HA:GP64FLAG
appeared to undergo proteolytic cleavage in both Sf21 and Hi-FiveTM
cells while VP39:HAFLAG
and HA:VP39FLAG did not. In a natural host, influenza virus infection is facilitated by binding of
HA to sialic acid receptors on the host cells. Following internalization of the virion by
endocytosis, the acidic pH of the cell facilitates fusion of the virion to the endosomal membrane
of the cell, allowing viral uncoating. The acidic pH also activates the proteases, such as furin,
required for cleavage of HA0 into HA1 and HA2 subunits which is considered a prerequisite for
successful influenza virus infection. My results up to this point indicated that HAFLAG and
HA:GP64FLAG underwent cleavage, it is probable that the pH needed for activation of HA
(which is about 6) corresponded to the pH of the infected Sf21 cells (6.2) Conversely, because
the HA in capsid display viruses did not undergo cleavage, it seems that the pH of activation of
HA did not correspond with the pH of the insect cells. Because the pH of insect cells would have
been expected to remain consistent at 6.2, mutations to the HA protein (i.e. removal of the signal
peptide) and fusion of VP39 might have led to an alteration of the pH of activation of HA0. This
prediction is consistent with research that shows minor mutations to various regions of HA can
lead to significant changes in the required pH for activation (Daniels et al., 1987; Cross et al.,
2001, Reed et al., 2009)
Cleavage of overexpressed HA0 into HA1 and HA2 by Sf21 cells was expected, as it has
been demonstrated in the literature (Kuroda et al., 1986; Wang et al. 2006; Cox et al., 2008).
Additionally, the observed cleavage of HA:GP64FLAG by Sf21 cells was expected, as
HA:GP64FLAG was translocated to the ER and then the membrane of the infected cell. However,
104
the cleavage of GP64-fused HA shown in my results has not actually been reported in the
literature. For instance, when HA was fused between the signal peptide and cytoplasmic domain
of GP64 by Yang et al. (2007), cleavage into HA1 and HA2 subunits was not observed. Yang et
al. (2007) stated that cleavage did not occur because Sf9 cells lack furin, citing a review by Kost
and Condreay (1999). However, it seems that Yang et al. may have misinterpreted Kost and
Condreay because the review explicitly states that a gene homologous to furin has been
identified in Sf9 cells by Ceiplik et al. (1998) and further suggests that lower levels of HA
cleavage by insect cells compared to mammalian cells could be due to a smaller quantity of furin
in insect cells, rather than an absence of it. Based on my research, it seems that furin (or a furin-
like protease) is indeed present in insect cells, as the proteins detected by anti-FLAG for HAFLAG
and HA:GP64FLAG corresponded to HA0 and the natural HA2 cleavage product. My result is
therefore in agreement with Ceiplik et al (1998), but not Yang et al. (2007) and Jin et al (2008).
Further, because furin is actually a constituent of Sf9 cells, it might be possible that the lack of
cleavage of the HA:GP64 fusions reported by Yang et al. and Jin et al was actually because they
used the GP64 signal peptide and not that of native HA.
4.2 Characterization of expressed HAs using anti HA antibodies
The HAs were first tested with the anti-FLAG antibody to confirm that HA was
expressed in Sf21 cells infected with each recombinant virus. However the baculovirus-
expressed HA should also be recognized by anti H5 HA antibodies. Therefore the HAs were first
tested with a commercial monospecific polyclonal anti-H5 HA antibody (ProSci 3425), which
was raised in rabbits against a synthetic peptide corresponding to 15 relatively conserved amino
acids in the middle of the avian influenza HA protein. Both the glycosylated (74 kDa) and non-
glycosylated (65 kDa) forms of AcHAFLAG were detected with this antibody from 48 to 96 h.p.i.

105
and that was similar to the results obtained with the anti-FLAG antibody. The C-terminal HA2
subunit was not detected since the recognition site for the antibody was only on the HA1 subunit.
The results of this Western blot suggest that overexpressed HA can be detected by polyclonal
anti-HA antibodies generated against an H5 avian influenza virus.
HA bands were also detected for each display virus at the expected sizes with the
polyclonal (#3425) antibody. This result implies that the specific amino acid sequence required
for detection of HA by this commercial polyclonal antibody was retained on each recombinant
HA. HA:GP64FLAG also reacted with the polyclonal anti-HA antibody as evidenced by bands
corresponding to the full-length fusion as well as the 90 kDa cleavage product. This was
expected because not only did Western immunoblot using the anti-FLAG antibody against the
same lysates yield a positive result, but also that cleavage, and therefore processing of HA,
occurred in Sf21 cells infected with AcHAFLAGGP64.
Capsid display viruses also produced the expected bands when probed with the
polyclonal anti-HA antibody. While the anti-FLAG antibody detected the full-length fusion in
both capsid displayed viruses, no cleavage products were visible, suggesting that processing of
HA by Sf21 cells infected with these viruses was impaired. This was expected due to the
removal of the HA SP and TM domains in these recombinant constructs, which can alter the pH
at which HA activation is triggered (Reed et al., 2009). Due to the lack of cleavage along with
the fact that two domains critical for processing and production of HA were removed in the
capsid displayed viruses, it was predicted that detection of capsid-fused HA by the polyclonal
anti-HA antibody might be impaired. However, this was not the case, and instead, the same 104
kDa band detected by anti-FLAG was detected using anti-HA. Clearly, the epitope sequence
required for detection of HA by #3425 remained intact in the capsid-displayed viruses, despite
106
their observed lack of cleavage in previous Western blots when using the anti-FLAG antibody
for detection.
The baculovirus based HAs were also evaluated against several monoclonal anti-H5 HA
antibodies. One antibody, VN04-2 showed detectable levels of HA. This monoclonal antibody
detected HA from cells infected with either the surface displayed (130 kDa) or overexpressed (75
kDa) viruses. In contrast, VP39:HAFLAG and HA:FLAGVP39 were not detected using this
monoclonal antibody. The neutralizing VN04-2 antibody recognizes the lysine, which is an
absolute requirement, at the 140s antigenic loop on the HA1 subunit of the folded globular head
of the HA protein (Lim et al., 2008; Kaverin et al. 2007). Previous results have shown that even
a single mutation to the lysine codon results in poor or absent reactivity of the antibody to HA.
The fact that VN04-2 recognizes an epitope in the HA1 subunit explains why no HA2 cleavage
products were detected for GP64:HAFLAG or HAFLAG. Additionally, it seems that VN04-2 is
sensitive, reacting with HA only if lysine is present on the globular head region of the HA1
subunit. Removal of the signal peptide and transmembrane domains of the HA in the VP39
display viruses might alter the folding of HA, concealing the epitope on the protein thereby
rendering the protein unrecognizable by the monoclonal antibody.
The difference between the recognition of VP39:HAFLAG or HA:VP39FLAG by the
polyclonal and monoclonal anti-HA antibodies may be due to their specificity. It is likely that the
monoclonal antibody recognized properly oriented, processed, folded and cleaved HA, while the
polyclonal HA antibody recognized an amino acid sequence that was detectable regardless of
folding and cleavage of HA0 to HA1 and HA2 subunits.
107
Following confirmation that all four recombinant HAs could be detected at the very least
by the polyclonal anti-H5 antibody (#3425), all four HAs were used to determine their ability to
detect Ab from sera of birds immunized with HA. This chicken serum reacted with all
recombinant HAs and bands were seen at the expected sizes in the Western blots. These results
are similar to those obtained for the rabbit polyclonal anti H5 antibody in that all four
recombinant HAs were detected. This is not surprising as polyclonal antibodies recognize
numerous epitopes These results are encouraging for further investigation into the utility of
these HAs as antigens in an ELISA to test for HA specific antibodies in chicken sera.
HAFLAG protein was detected by FLAG antibodies, and a variety of antibodies as
discussed above suggesting its utility as a potential diagnostic reagent. To this end, I used the
HAFLAG protein in Western blots to test serum samples from chickens vaccinated with a
recombinant fowl adenovirus, FAdV-HA, to see if anti HA antibodies could be detected. A
band at 64 kDa was detected which was not seen when preimmune sera were the primary
antibody source, indicating the specificity of the reaction. While there were clear reactions, the
bands observed were faint (Fig 3.15). One explanation might be that the sera were stored for too
long, and the antibodies might have degraded. Additionally, the only available secondary
antibody was recommended for use in ELISAs rather than Western immunoblot. While these
results are preliminary they suggest that HAFLAG could be used to detect H5 specific antibodies
in sera from chickens vaccinated with FAdV-HA or other HA containing vaccines. Furthermore
it suggests that that this prototype FAdV-HA vaccine may elicit a sufficient anti-HA antibody
response in chickens. Moreover, these results indicate that the baculovirus-derived recombinant
HA has potential for diagnostics purposes.

108
4.3 Biological activity of recombinant HAs
Hemagglutination of red blood cells is a known biological activity of influenza virus HA,
(Vyas and Shulman, 1970) and is still a common diagnostic method for influenza virus infection.
In the present study, the hemagglutination assays was conducted using either sonicated Sf21 cell
extracts or whole Sf21 cells that were infected for 20, 40 and 60 hours, with each recombinant
HA-expressing baculovirus. The hemagglutination potential of concentrated budded virions from
display viruses was also assessed. Some hemagglutinating activity was observed for sonicates of
cells infected by each of the four viruses, but at low levels. Sonicates of AcHAFLAG, infected
cells had an HA titre of 4. This result is not consistent with published data which suggests that
extracts from cells infected with an overexpressed HA-based baculovirus produce strong
hemagglutination with HA titres upwards of 64 (Kuroda et al., 1986).
Whole Sf21 cells infected with the recombinant viruses expressing HA were then tested
in hemagglutination assays, and again the highest HA titre was obtained for AcHAFLAG infected
cells. While HA titres were slightly higher using whole infected cells, they were still relatively
low when compared to those reported by Kuroda et al (1986). The absence of NA in the HA-
expressing baculoviruses may contribute to the poor hemagglutinating activity, however other
factors may have contributed as well. For example, the MOI used in the Kuroda study is not
reported and may have been higher than the 10 that I used.
Another explanation for the poor hemagglutinating ability of infected whole cells is their
larger size compared to HA- containing, virions reducing their ability to form a cross linked
matrix Despite having low titres in the hemagglutination assay the results suggest that
109
AcHAFLAG and AcHA:GP64FLAG infected Sf21 cells can hemagglutinate red blood cells and that
the recombinant HAs are biologically active.
Another biological activity of HA is that it can adsorb red blood cells when exposed on
the surface of infected cells. Only cells infected with either overexpressed or surface displayed
HA viruses showed hemadsorption. While the level of hemadsorption was more strongly
pronounced in cells infected with the overexpression virus, it was also observed in cells infected
with the surface displayed virus. These results are consistent with published data (Kuroda, 1989;
Wang et al., 2006; Van Wyke et al., 1987; Ernst et al., 1998). It also corroborates the results of
the biological activity shown by hemagglutination assays. Not surprisingly cells infected with
either capsid-displayed viruses did not show hemadsorption, since the TM domain of HA was
removed in these two viruses, and therefore HA was not expected to be embedded in the
membranes of infected insect cells.
While suggestive syncytia formation was observed by cells infected with AcHAFLAG and
AcHA:GP64FLAG, the syncytium observed was not typical in that there were no clear
multinucleate cells. The literature seems to generally accept that HA-mediates full fusion
between influenza virus-infected cells (Simpson and Lamb, 1992; Sakai et al., 2002; Melikyan et
al., 1995). However, most papers use the terms “full fusion” and “syncytia formation”
interchangeably, and many count syncytia formation in influenza virus infected cells as an
indicator of full fusion (Simpson and Lamb, 1992; Sakai et al., 2002; Melikyan et al., 1995).
While the difference between HA mediated fusion and syncytia formation is not made clear in
the literature (Simpson and Lamb, 1992; Sakai et al., 2002; Melikyan et al., 1995), there was an
observable fusion occurring between cells infected with AcHAFLAG and AcHA:GP64FLAG, and
not cells infected with AcHA:VP39FLAG or AcVP39:HAFLAG. Even if this was not a typical

110
syncytia formation, this result suggests that the fusion-mediating properties of HA were retained
only when HA was directed to the membrane of infected cells.
4.4 Neuraminidase Expression
Neuraminidase is another major membrane protein of influenza viruses and thus part of
the immune response against influenza viruses is targeted to NA. Therefore baculovirus-
expressed NA could also be used for diagnostic purposes. NA, with a C-terminal HA epitope tag
to follow its synthesis, was overexpressed via baculovirus. The overexpression of NA, including
N1 and N2 subtypes, via BEVS has been well documented (Mather et al., 1992, Pushko et al.,
2005, Latham et al., 2001, Bright et al., 2008). A single 60 kDa band, consistent with the size of
the native N1 NA, was present on the Western immunoblot, and expression increased over time
p.i. This result is consistent with the literature. For instance, Weyer and Possee found that
baculovirus expression of NA resulted in the detection of a single 58 kDa band with a
monoclonal anti-NA antibody (Weyer and Possee, 1991). A similar experiment was conducted
by Mather et al. (1992) and a 60 kDa band corresponding to full-length NA was identified.
The present NA construct was fused with an amino terminal HA epitope tag derived from
the influenza virus HA protein. Therefore use of NAHA in an ELISA has the potential to detect
anti HA antibodies as well as anti NA antibodies. However, the amino acid sequence of the HA-
epitope tag was not present in the H5 HA amino acid sequence. This suggests that there will be
no reactivity between this HA epitope and anti HA antibodies for example in sera from chickens
vaccinated with FAdV-HA.
In addition to its strong expression in the insect cell, as demonstrated by Western
immunoblotting, NAHA was also found to be enzymatically active. Because it was active in Sf21
111
cells, it has likely undergone proper post translational modifications and folding, making NA an
attractive candidate protein for diagnostic purposes such as one arm of a DIVA. For example, the
NA and HA expressing baculoviruses developed here could be used concurrently in separate
ELISAs to test a single serum sample to differentiate infected from vaccinated animals. Serum
from an individual infected with influenza virus would have positive ELISAs for both HA and
NA, while serum from animals vaccinated with an HA-only vaccine would be positive for only
HA. To date, the generation of a reliable DIVA strategy has been challenging. Several different
types of DIVAs have been developed (Avelleneda et al., 2010; Capua et al., 2002), but none
have been readily adopted as part of a standard operational protocol. A DIVA such as the one I
described would have specific advantages over the previously developed DIVAs. First, it would
be versatile. While it could be used to test sera from chickens vaccinated with an HA-specific
vaccine (e.g. FAdV-HA), it could also test sera from chicken vaccinated with an NA-based
vaccine. Finally, the scale-up of baculovirus expressed proteins is rapid, efficient and
inexpensive and therefore an ELISA based on BEVS expressed proteins may be more readily
adopted by governmental regulatory agencies.
4.5 Conclusions and Future Considerations
Several experiments were conducted and baculovirus constructs expressing an H5 avian
influenza virus HA generated to determine which expression method is preferable for the
production of HA. While HA was detected for each of the recombinant baculoviruses by various
antibodies including anti-FLAG and anti-HA, it was biologically active in only the GP64
displayed and overexpression viruses. Further, the recombinant protein expressed by these two
viruses were detected by anti H5 HA monoclonal antibody, while capsid displayed viruses were
not. Finally, processing of HA by glycosylation occurred in cells infected with AcHAFLAG

112
(cleavage and glycosylation), and inferred for AcHA:GP64FLAG., while processing in
AcVP39:HAFLAG and AcHA:VP39FLAG infected cells was not evident. Finally, HAFLAG and
HA:GP64FLAG were found in budded virions, but VP39:HAFLAG and HA:VP39FLAG were not.
Taken together, the baculovirus expression methods of overexpression and surface display
produced greater amounts of HA than capsid display. Furthermore, the HA was biologically
active in terms of hemagglutination and hemadsorption. Thus AcHAFLAG and AcHA:GP64FLAG
would be the best choice for production of HA for use as a diagnostic antigen.
Future directions should focus on developing the various HAs for the detection of HA
antibodies in ELISA. Essentially we have established that baculovirus-derived HA is detectable
by several antibodies including in chicken serum, and that preimmune chicken sera does not
react with BV expressed HA. These results support the development of an ELISA to detect anti-
HA antibodies present in sera from chickens infected with an H5N1 or vaccinated with an HA
based vaccine such as FAdV-HA. If this ELISA proves to be effective at detecting anti-HA
antibodies in chickens, then the next step would be to determine whether overexpressed NA is
capable of detecting anti NA antibodies in sera from chickens infected with N1 containing
influenza viruses but not in sera from chickens vaccinated with an HA derived vaccine. Finally,
if both ELISAs are successful, then their utility in a DIVA system should be assessed.
While hemagglutination was observed, it was only at low levels, which was inconsistent
with the data in the literature. This could be due to poor optimization of the hemagglutination
assay, or incomplete sonication or activation of HA. This assay should be repeated and different
types of cell lysis methods should be explored. If trying to optimize this assay is still
unsuccessful, then the single radio immunodiffusion assay (SRID) should be considered. The
SRID assay measures the interaction between antigen and antibody in an agarose gel, which
113
produces a precipitation zone that is directly proportional to the amount of antigen added to the
gel. Therefore, a reference antigen can be used as a source for comparison and the amount of
antigen in an unknown sample, (e.g. HA) can be better quantified. This method has been
adopted by the Food and Drug Administration in the United States and is considered a reliable
tool for measuring influenza virus antibody response (Williams et al., 1993, Kalbfuss et al.,
2008; Kessel et al., 2012). Further, Cox et al. (2008) successfully employed SRID assays using
HA produced via BEVS. SRID assays may help to corroborate the evidence presented here that
AcHAFLAG and AcHA:GP64FLAG are suitable diagnostic antigens.
With regards to the utility of capsid display, the C-terminal fusion of the HA protein was
more efficient than N-terminal fusion, and this has not yet been reported in the literature.
Therefore, future experiments should try to further elucidate whether C-terminal fusion does
indeed result in more foreign protein of interest for other proteins e.g. NA. Additionally, because
capsid proteins and membrane proteins differ greatly in their trafficking and processing through
infected cells, it is likely that capsid display would be better employed for the expression of a
non membrane bound or nor glycosylated influenza virus protein, such as NP. In the cell, NP is
involved in packaging and virus assembly in the infected cell, and because it does not go to the
membrane, is not trafficked to the ER or Golgi upon virus entry. Further, NP–based vaccines
induce heterosubtypic protection against influenza virus in humans, through a cytotoxic T-
lymphocyte response (Ulmer et al., 1993), and stimulate strong non-neutralizing antibody
response (Carragher et al., 2008). Therefore, capsid displayed NP may be useful in a study of this
nature, particularly for the generation of an alternative influenza virus antigen.
The present study examined and compared the effectiveness of three baculovirus
expression methods, including capsid display, overexpression and surface display, for the
114
production of biologically active, highly expressed, HA for use as antigen. The latter two
expression methods were found to be most effective for this purpose. The long-term goal of this
research is to develop a versatile serological ELISA-based diagnostic assay for influenza virus
antibodies such as HA and NA. Such an assay would provide a means to evaluate the ability of a
vaccine to generate a detectable antibody response in sera from vaccinated animals, and
therefore, help to confirm vaccine response. Together with monitoring for a second influenza
virus protein not present in the vaccine, the DIVA assay could be employed for differentiation of
vaccinated from infected animals, which could ultimately facilitate a means for expansion of the
poultry industry within Canada.

115
REFERENCES
Alexander, D.J., 2000. A review of avian influenza in different bird species. Vet. Microbiol. 74,
3-13.
Avellaneda, G., Sylte, M.J., Lee, C.W., Suarez, D.L., 2010. A heterologous neuraminidase
subtype strategy for the differentiation of infected and vaccinated animals (DIVA) for
avian influenza virus using an alternative neuraminidase inhibition test. Avian Dis. 54,
272-277.
Bai, B., Lu, X., Meng, J., Hu, Q., Mao, P., Lu, B., Chen, Z., Yuan, Z., Wang, H., 2008.
Vaccination of mice with recombinant baculovirus expressing spike or nucleocapsid
protein of SARS-like coronavirus generates humoral and cellular immune responses. Mol.
Immunol. 45, 868-875.
Baigent, S.J., McCauley, J.W., 2001. Glycosylation of haemagglutinin and stalk-length of
neuraminidase combine to regulate the growth of avian influenza viruses in tissue culture.
Virus Res. 79, 177-185.
Banks, J., Plowright, L., 2003. Additional glycosylation at the receptor binding site of the
hemagglutinin (HA) for H5 and H7 viruses may be an adaptation to poultry hosts, but does
it influence pathogenicity? Avian Dis., 942-950.
Blissard, G.W., Rohrmann, G.F., Birch, M., Poppy, G.M., Baker, T.C., Lomer, C.J., Bateman,
R.P., Johnson, D.L., Langewald, J., Thomas, M., 1990. Free access Baculovirus Diversity
and Molecular Biology. Annu. Rev. Entomol. 35, 127-155.
Booy, R., Brown, L.E., Grohmann, G.S., MacIntyre, C.R., 2006. Pandemic vaccines: promises
and pitfalls. Med. J. Aust. 185, 62.
Boublik, Y., Di Bonito, P., Jones, I.M., 1995. Eukaryotic virus display: engineering the major
surface glycoprotein of the Autographa californa nuclear polyhedrosis virus (AcNPV) for
the presentation of foreign proteins on the virus surface. Nat. Biotechnol. 13, 1079-1084.
Bouvier, N.M., Palese, P., 2008. The biology of influenza viruses. Vaccine 26, D49-D53.
Brett, I.C., Johansson, B.E., 2005. Immunization against influenza A virus: comparison of
conventional inactivated, live-attenuated and recombinant baculovirus produced purified
hemagglutinin and neuraminidase vaccines in a murine model system. Virology. 339, 273-
280.
116
Bright, R.A., Carter, D.M., Crevar, C.J., Toapanta, F.R., Steckbeck, J.D., Cole, K.S., Kumar,
N.M., Pushko, P., Smith, G., Tumpey, T.M., 2008. Cross-clade protective immune
responses to influenza viruses with H5N1 HA and NA elicited by an influenza virus-like
particle. PLoS One. 3, e1501.
Bright, R.A., Carter, D.M., Daniluk, S., Toapanta, F.R., Ahmad, A., Gavrilov, V., Massare, M.,
Pushko, P., Mytle, N., Rowe, T., 2007. Influenza virus-like particles elicit broader immune
responses than whole virion inactivated influenza virus or recombinant hemagglutinin.
Vaccine. 25, 3871-3878.
Capua, I., Mutinelli, F., 2001. Mortality in Muscovy ducks (Cairina moschata) and domestic
geese (Anser anser var. domestica) associated with natural infection with a highly
pathogenic avian influenza virus of H7N1 subtype. Avian Pathol. 30, 179-183.
Carragher, D.M., Kaminski, D.A., Moquin, A., Hartson, L., Randall, T.D., 2008. A novel role for
non-neutralizing antibodies against nucleoprotein in facilitating resistance to influenza
virus. Am Assoc Immnol 181, 4168-4176.
Carroll, S., Higa, H., Paulson, J., 1981. Different cell-surface receptor determinants of
antigenically similar influenza virus hemagglutinins. J. Biol. Chem. 256, 8357-8363.
CFIA. 2011. Fact Sheet- avian influenza. Government of Canada. Accessed March 3, 2012.
http://www.inspection.gc.ca/english/anima/disemala/avflu/avflufse.shtml
Cheshenko, N., Krougliak, N., Eisensmith, R., Krougliak, V., 2001. A novel system for the
production of fully deleted adenovirus vectors that does not require helper adenovirus.
Gene Ther. 8, 846-854.
Cieplik, M., Klenk, H.D., Garten, W., 2010. Identification and characterization of Spodoptera
frugiperda furin: A thermostable subtilisin-like endoprotease. Biol.Chem. 379, 1433-1440.
Colman, P. M., Varghese, J. N. Laver, W. G. 1983. Structure of the catalytic and antigenic sites
in influenza virus neuraminidase. Nature, 303, 41-44.
Condreay, J.P., Witherspoon, S.M., Clay, W.C., Kost, T.A., 1999. Transient and stable gene
expression in mammalian cells transduced with a recombinant baculovirus vector. Proc.
Natl. Acad. Sci. U. S. A. 96, 127.
Corredor, J.C., Nagy, É. 2010. The non-essential left end region of the fowl adenovirus 9
genome is suitable for foreign gene insertion/replacement. Virus Research, 142, 167-174.

117
Cox, M.M.J., Patriarca, P.A., Treanor, J., 2008. FluBlok, a recombinant hemagglutinin influenza
vaccine. Influenza and other respiratory viruses 2, 211-219.
Cox, N., Subbarao, K., 2003. Global epidemiology of influenza: past and present. Annual -
Review of Medicine 51, 407-421.
Creighton, T.E., 1988. Toward a better understanding of protein folding pathways. Proc. Natl.
Acad. Sci. 85, 5082.
Cross, K.J., Wharton, S.A., Skehel, J.J., Wiley, D.C., Steinhauer, D.A., 2001. Studies on
influenza haemagglutinin fusion peptide mutants generated by reverse genetics. EMBO J.
20, 4432-4442.
Daniels, P., Jeffries, S., Yates, P., Schild, G., Rogers, G., Paulson, J., Wharton, S., Douglas, A.,
Skehel, J., Wiley, D., 1987. The receptor-binding and membrane-fusion properties of
influenza virus variants selected using anti-haemagglutinin monoclonal antibodies. EMBO
J. 6, 1459.
Davis, T., Wickham, T., McKenna, K., Granados, R., Shuler, M., Wood, H., 1993. Comparative
recombinant protein production of eight insect cell lines. In Vitro Cell. Dev. Biol. 29, 388-
390.
Duksin, D., Mahoney, W., 1982. Relationship of the structure and biological activity of the
natural homologues of tunicamycin. J. Biol. Chem. 257, 3105.
Eichler, R., Lenz, O., Strecker, T., Eickmann, M., Klenk, H.D., Garten, W., 2003. Identification
of Lassa virus glycoprotein signal peptide as a trans-acting maturation factor. EMBO Rep.,
4, 1084-1088.
Ernst, W., Grabherr, R., Wegner, D., Borth, N., Grassauer, A., Katinger, H., 1998. Baculovirus
surface display: construction and screening of a eukaryotic epitope library. Nucleic Acids
Res. 26, 1718-1723.
Ernst, W.J., Spenger, A., Toellner, L., Katinger, H., Grabherr, R.M., 2000. Expanding
baculovirus surface display. European Journal of Biochemistry. 267, 4033-4039.
Facciabene, A., Aurisicchio, L., La Monica, N., 2004. Baculovirus vectors elicit antigen-specific
immune responses in mice. J. Virol. 78, 8663.
Fiers, W., De Filette, M., Bakkouri, K.E., Schepens, B., Roose, K., Schotsaert, M., Birkett, A.,
Saelens, X., 2009. M2e-based universal influenza A vaccine. Vaccine 27, 6280-6283.

118
Fiore, A.E., Uyeki, T.M., Broder, K., Finelli, L., Euler, G.L., Singleton, J.A., Iskander, J.K.,
Wortley, P.M., Shay, D.K., Bresee, J.S., Cox, N.J., Centers for Disease Control and
Prevention (CDC), 2010. Prevention and control of influenza with vaccines:
recommendations of the Advisory Committee on Immunization Practices (ACIP), 2010.
MMWR Recomm Rep. 59, 1-62.
Gardner, D.K., Lane, M., Spitzer, A., Batt, P.A., 1994. Enhanced rates of cleavage and
development for sheep zygotes cultured to the blastocyst stage in vitro in the absence of
serum and somatic cells: amino acids, vitamins, and culturing embryos in groups stimulate
development. Biol. Reprod. 50, 390-400.
Grabherr, R., Ernst, W., Oker-Blom, C., Jones, I., 2001. Developments in the use of
baculoviruses for the surface display of complex eukaryotic proteins. Trends Biotechnol.
19, 231-236.
Granados, R.R., Guoxun, L., Derksen, A.C.G., McKenna, K.A., 1994. A new insect cell line
from Trichoplusia ni (BTI-Tn-5B1-4) susceptible to Trichoplusia ni single enveloped
nuclear polyhedrosis virus. J. Invertebr.Pathol. 64, 260-266.
Gubareva, L.V., Hayden, F.G., 2006. The anti-influenza activity of M2 and neuraminidase
inhibitors. In: Y. Kawaoka (Ed.), Influenza virology current topics. Caister Academic
Press, Norfolk, England, pp. 169.
Halvorson, D.A., 2002. The control of H5 or H7 mildly pathogenic avian influenza: a role for
inactivated vaccine. Avian Pathol. 31, 5-12.
Hofmann, C., Sandig, V., Jennings, G., Rudolph, M., Schlag, P., Strauss, M., 1995. Efficient
gene transfer into human hepatocytes by baculovirus vectors. Proc. Natl. Acad. Sci. U. S.
A. 92, 10099.
Huang, R.T., Wahn,K., Klenk, H.D., Rott, R.T. 1980. Fusion between cell membrane and
liposomes containing the glycoproteins of influenza virus. Virology 104, 294-302.
Huleatt, J.W., Nakaar, V., Desai, P., Huang, Y., Hewitt, D., Jacobs, A., Tang, J., McDonald, W.,
Song, L., Evans, R.K., 2008. Potent immunogenicity and efficacy of a universal influenza
vaccine candidate comprising a recombinant fusion protein linking influenza M2e to the
TLR5 ligand flagellin. Vaccine 26, 201-214.
International Committee on the Taxonomy of Viruses (ICTV). 2009. Accessed on July 7, 2012.
Web address: http://www.ictvonline.org/virusTaxonomy.asp?version=2009
119
Ison, M.G., Campbell, V., Rembold, C., Dent, J., Hayden, F.G., 2005. Cardiac findings during
uncomplicated acute influenza in ambulatory adults. Clin. Infect. Dis. 40, 415-422.
Jehle, J., Blissard, G., Bonning, B., Cory, J., Herniou, E., Rohrmann, G., Theilmann, D., Thiem,
S., Vlak, J., 2006. On the classification and nomenclature of baculoviruses: a proposal for
revision. Arch. Virol. 151, 1257-1266.
Jin, H., Leser, G.P., Zhang, J., Lamb, R.A., 1997. Influenza virus hemagglutinin and
neuraminidase cytoplasmic tails control particle shape. EMBO J. 16, 1236-1247.
Jin, R., Lv, Z., Chen, Q., Quan, Y., Zhang, H., Li, S., Chen, G., Zheng, Q., Jin, L., Wu, X., 2008.
Safety and immunogenicity of H5N1 influenza vaccine based on baculovirus surface
display system of Bombyx mori. PloS One 3, e3933.
Johansson, B.E., 1999. Immunization with influenza A virus hemagglutinin and neuraminidase
produced in recombinant baculovirus results in a balanced and broadened immune
response superior to conventional vaccine. Vaccine. 17, 2073-2080.
Kadlec, J., Loureiro, S., Abrescia, N.G.A., Stuart, D.I., Jones, I.M. 2008. The postfusion
structure of baculovirus gp64 supports a unified view of viral fusion machines. Nature
Structural and Molecular Biology. 10, 1024-1030.
Kalbfuss, B., Knochlein, A., Krober, T., Reichl, U. 2008.Monitoring influenza virus content in
vaccine production: precise assays for the quantitation of hemagglutination and
neuraminidase activity. Biologicals 36, 145-161.
Kaverin, N.V., Rudneva, I.A., Govorkova, E.A., Timofeeva, T.A., Shilov, A.A., Kochergin-
Nikitsky, K.S.K., Krylov, P.S., Webster, R.G. 2007. Epitope mapping of the hemagglutinin
molecules of a highly pathogenic H5N1 influenza virus by using monoclonal antibodies. J
Gen Virol 23, 12911-12917.
Keil, W., Geyer, R., Dabrowski, J., Dabrowski, U., Niemann, H., Stirm, S., Klenk, H., 1985.
Carbohydrates of influenza virus. Structural elucidation of the individual glycans of the
FPV hemagglutinin by two-dimensional 1H nmr and methylation analysis. EMBO J. 4,
2711.
Klenk, H.D., Rott, R., Orlich, M., Blödorn, J., 1975. Activation of influenza A viruses by trypsin
treatment. Virology. 68, 426-439.
Klumpp, K., Ruigrok, R.W.H., Baudin, F., 1997. Roles of the influenza virus polymerase and
nucleoprotein in forming a functional RNP structure. EMBO J. 16, 1248-1257.
120
Kornfeld, R., Kornfeld, S., 1985. Assembly of asparagine-linked oligosaccharides. Annu. Rev.
Biochem. 54, 631-664.
Kost, T.A., Condreay, J.P., Jarvis, D.L., 2005. Baculovirus as versatile vectors for protein
expression in insect and mammalian cells. Nat. Biotechnol. 23, 567-575.
Krammer, F., Schinko, T., Palmberger, D., Tauer, C., Messner, P., Grabherr, R., 2010.
Trichoplusia ni cells (High Five TM) are highly efficient for the production of influenza A
virus-like particles: a comparison of two insect cell lines as production platforms for
influenza vaccines. Mol. Biotechnol. 45, 226-234.
Kukkonen, S.P., Airenne, K.J., Marjomäki, V., Laitinen, O.H., Lehtolainen, P., Kankaanpää, P.,
Mähönen, A.J., Räty, J.K., Nordlund, H.R., Oker-Blom, C., 2003. Baculovirus capsid
display: a novel tool for transduction imaging. Mol. Ther. 8, 853-862.
Kuroda, K., Gröner, A., Frese, K., Drenckhahn, D., Hauser, C., Rott, R., Doerfler, W., Klenk, H.,
1989. Synthesis of biologically active influenza virus hemagglutinin in insect larvae. J.
Virol. 63, 1677-1685.
Kuroda, K., Hauser, C., Rott, R., Klenk, D., Doerfler, W., 1986. Expression of influenza virus
hemagglutinin in insect cells by a baculovirus vector. EMBO, 5, 1359-1365.
Lamb, R.A., Zebedee, S.L., Richardson, C.D., 1985. Influenza virus M2 protein is an integral
membrane protein expressed on the infected-cell surface. Cell 40, 627-633.
Latham, T., Galarza, J.M., 2001. Formation of wild-type and chimeric influenza virus-like
particles following simultaneous expression of only four structural proteins. J. Virol. 75,
6154-6165.
Lazarowitz, S.G., Choppin, P.W. 1975. Enhancement of the infectivity of influenza A and B
viruses by proteolytic cleavage of the hemagglutinin polypeptide.Virology, 68, 440-540.
Lignon, Lee. 2005. Avian influenza virus H5N1: A review of its history and information
regarding its potential to cause the next pandemic. Seminars in pediatric infectious
diseases, 16, 326-335.
Lim, P.C.A., Chan, C.E.Z, Wong, S.K.K., Chan, A H.Y. 2008. Neutralizing human monoclonal
antibody against H5N1 influenza HA selected from a Fab-phage display library. Virology
Journal, 5, 130-140.
Lin, D., Lan, J., Zhang, Z., 2007. Structure and function of the NS1 protein of influenza A virus.
Acta biochimica et biophysica Sinica 39, 155-162.

121
Luckow, V.A., 1995. Protein production and processing from baculovirus expression vectors,
51-90.
Luckow, V.A., Lee, S., Barry, G., Olins, P., 1993. Efficient generation of infectious recombinant
baculoviruses by site-specific transposon-mediated insertion of foreign genes into a
baculovirus genome propagated in Escherichia coli. J. Virol. 67, 4566-4579.
Markoff, L., Lin, B.C., Sveda, M.M., Lai, C.J. 1984. Glycosylation and surface expression of the
influenza virus neuraminidase requires the N terminal hydrophobic region. Molecular and
cellular bio, 4, 8-16.
Martignoni, M.E and Iwai, P. J.,1986. A catalogue of viral diseases of insects, mites and ticks.
Gen. Tech. Rep., 4: PNW-195. Portland, Oregon, US. 51.
Mather, K.A., White, J.F., Hudson, P.J., McKimm-Breschkin, J.L., 1992. Expression of
influenza neuraminidase in baculovirus-infected cells. Virus Res. 26, 127-139.
Matrosovich, M., Zhou, N., Kawaoka, Y., Webster, R., 1999. The surface glycoproteins of H5
influenza viruses isolated from humans, chickens, and wild aquatic birds have
distinguishable properties. J. Virol. 73, 1146-1155.
Melikyan, G.B., White, J.M., Cohen, F.S., 1995. GPI-anchored influenza hemagglutinin induces
hemifusion to both red blood cell and planar bilayer membranes. J. Cell Biol. 131, 679-
691.
Meng, T., Kolpe, A.B., Kiener, T.K., Chow, V.T.K., Kwang, J., 2011. Display of VP1 on the
surface of baculovirus and its immunogenicity against heterologous human enterovirus 71
strains in mice. PLoS One. 6, e21757.
Molinari, P., Crespo, M.I., Gravisaco, M.J., Taboga, O., Morón, G., 2011. Baculovirus capsid
display potentiates OVA cytotoxic and innate immune responses. PLoS One 6, e24108.
Monsma, S.A., Oomens, A.G.P., Bissard, G.W. 1996. The GP64 envelope fusion protein is an
essential baculovirus protein required for cell-to-cell transmission of infection. Journal of
Virology, 70, 4607-4616.
Naeem, K., Siddique, N., 2006. Use of strategic vaccination for the control of avian influenza in
Pakistan. Dev. Biol. 124, 145.
Nagy, É., Brian Derbyshire, J., Dobos, P., Krell, P.J., 1990. Cloning and expression of NDV
hemagglutinin-neuraminidase cDNA in a baculovirus expression vector system. Virology.
176, 426-438.

122
Nagy, E., Krell, P.J., Heckert, R.A., Derbyshire, J.B., 1994. Vaccination of chickens with a
recombinant fowlpox virus containing the hemagglutinin-neuraminidase gene of Newcastle
disease virus under the control of the fowlpox virus thymidine kinase promoter. Can. J.
Vet. Res. 58, 306-308.
Oker-Blom, C., Airenne, K.J., Grabherr, R., 2003. Baculovirus display strategies: Emerging tools
for eukaryotic libraries and gene delivery. Briefings in Functional Genomics and
Proteomics. 2, 244-253.
Parkins, M.D., McNeil, S.A., Laupland, K.B., 2009. Routine immunization of adults in Canada:
review of the epidemiology of vaccine-preventable diseases and current recommendations
for primary prevention. Can. J. Infect. Dis. Med. Microbiol. 20, 81-90.
Peiris, J.S.M., De Jong, M.D., Guan, Y., 2007. Avian influenza virus (H5N1): a threat to human
health. Clin. Microbiol. Rev. 20, 243-267.
Pinto, L.H., Holsinger, L.J., Lamb, R.A., 1992. Influenza virus M2 protein has ion channel
activity. Cell 69, 517-528.
Prel, A., Gall-Reculé, G.L., Cherbonnel, M., Grasland, B., Amelot, M., Jestin, V., 2007.
Assessment of the protection afforded by triple baculovirus recombinant coexpressing H5,
N3, M1 proteins against a homologous H5N3 low-pathogenicity avian influenza virus
challenge in Muscovy ducks. Avian Dis. 51, 484-489.
Pushko, P., Tumpey, T.M., Bu, F., Knell, J., Robinson, R., Smith, G., 2005. Influenza virus-like
particles comprised of the HA, NA, and M1 proteins of H9N2 influenza virus induce
protective immune responses in BALB/c mice. Vaccine. 23, 5751-5759.
Rothberg, M.B., Haessler, S.D., 2010. Complications of seasonal and pandemic influenza. Crit.
Care Med. 38, 91-97.
Reed, C., Angulo, F.J., Swerdlow, D.L., Lipsitch, M., Meltzer, M.I., Jernigan, D., Finelli, L.,
2009. Estimates of the prevalence of pandemic (H1N1) 2009, United States, April-July
2009. Emerging Infect. Dis. 15, 2004-2007.
Sakai, T., Ohuchi, R., Ohuchi, M., 2002. Fatty acids on the A/USSR/77 influenza virus
hemagglutinin facilitate the transition from hemifusion to fusion pore formation. J. Virol.
76, 4603-4611
Samji, T., 2009. Influenza A: understanding the viral life cycle. Yale J. Biol. Med. 82, 153-159.
123
Schmidt, M.F.G., 1982. Acylation of proteins--a new type of modification of membrane
glycoproteins. Trends Biochem. Sci. 7, 322-324.
Schnitzler, S.U., Schnitzler, P., 2009. An update on swine-origin influenza virus A/H1N1: a
review. Virus Genes 39, 279-292.
Segal, M.S., Bye, J.M., Sambrook, J.F., Gething, M., 1992. Disulfide bond formation during the
folding of influenza virus hemagglutinin. J. Cell Biol. 118, 227-244.
Senger, T., Schadlich, L., Gissmann, L., Muller, M., 2009. Enhanced papillomavirus-like particle
production in insect cells. Virology, 388, 344-353.
Shimomura, T., Ochiai, M., Kondo, J., Morimoto, Y., 1992. A novel protease obtained from
FBS-containing culture supernatant, that processes single chain form hepatocyte growth
factor to two chain form in serum-free culture. Cytotechnology. 8, 219-229.
Shoji, I., Aizaki, H., Tani, H., Ishii, K., Chiba, T., Saito, I., Miyamura, T., Matsuura, Y., 1997.
Efficient gene transfer into various mammalian cells, including non-hepatic cells, by
baculovirus vectors. J. Gen. Virol. 78, 2657-2664. .
Simonsen, L., Clarke, M.J., Schonberger, L.B., Arden, N.H., Cox, N.J., Fukuda, K., 1998.
Pandemic versus epidemic influenza mortality: a pattern of changing age distribution. J.
Infect. Dis. 178, 53-60.
Simpson, D.A., Lamb, R., 1992. Alterations to influenza virus hemagglutinin cytoplasmic tail
modulate virus infectivity. J. Virol. 66, 790-803.
Smith, G.E., 1983. Production of human beta interferon in insect cells infected with a
baculovirus expression vector. Mol. Cell Biol.3, 2156-2165.
Song, L., Liu, Y., Chen, J., 2010. Baculoviral capsid display of His-tagged ZnO inorganic
binding peptide. Cytotechnology. 62, 133-141.
Strauss, R., Hüser, A., Ni, S., Tuve, S., Kiviat, N., Sow, P.S., Hofmann, C., Lieber, A., 2007.
Baculovirus-based vaccination vectors allow for efficient induction of immune responses
against Plasmodium falciparum circumsporozoite protein. Molecular Therapy 15, 193-202.
Stieneke-Gröber, A., Vey, M., Angliker, H., Shaw, E., Thomas, G., Roberts, C., Klenk, H.D.,
Garten, W., 1992. Influenza virus hemagglutinin with multibasic cleavage site is activated
by furin, a subtilisin-like endoprotease. EMBO J. 11, 2407.
Studahl, M., 2003. Influenza virus and CNS manifestations. J. Clin. Virol. 28, 225-232.

124
Subbaroao, K., 2006. Epidemiology and control of human and animal influenza. In: Y. Kawaoka
(Ed.), Influenza Virology Current Topics. Caister Academic Press, Norfolk, England, pp.
229.
Swayne, D.E., Garcia, M., Beck, J.R., Kinney, N., Suarez, D.L., 2000. Protection against diverse
highly pathogenic H5 avian influenza viruses in chickens immunized with a recombinant
fowlpox vaccine containing an H5 avian influenza hemagglutinin gene insert. Vaccine 18,
1088-1095.
Tamashiro, H., Fauquex, A., Heymann, D., Emmanuel, J., Sato, P., Maskill, W., 1993. Reducing
the cost of HIV antibody testing. The Lancet, 342, 87-90.
Tang, X.C., Lu, H.R., Ross, T.M., 2010. Hemagglutinin Displayed Baculovirus Protects Against
Highly Pathogenic Influenza. Vaccine 42, 6821-6831.
Tao, P., Luo, M., Zhu, D., Qu, S., Yang, Z., Gao, M., Guo, D., Pan, Z., 2009. Virus-like particle
vaccine comprised of the HA, NA, and M1 proteins of an avian isolated H5N1 influenza
virus induces protective immunity against homologous and heterologous strains in mice.
Viral Immunol. 22, 273-281.
Toro, H., Tang, D.C., Suarez, D.L., Sylte, M.J., Pfeiffer, J., Van Kampen, K.R., 2007. Protective
avian influenza in ovo vaccination with non-replicating human adenovirus vector. Vaccine
25, 2886-2891.
Ulmer, J.B., Donnelly, J.J., Parker, S.E., Rhodes, G.H., Felgner, P.L., Dwarki, V., Gromkowski,
S.H., Deck, R.R., Dewitt, C.M., Friedman, A., 1993. Heterologous protection against
influenza by injection of DNA encoding a viral protein. Science. 259, 1745-1749.
van Kessel, G., Geels, M., de Weerd, S., Buijs, L., de Bruijni, M., Glansbeek, H., van den Bosch,
J., Heldens, J., van den Heuvel, E., 2011. Development and qualification of the parallel line
model for the estimation of human influenza haemagglutinin content using the single radial
immunodiffusion assay. Vaccine. 30, 201-209.
Van Wyke Coelingh, K.L., Murphy, B.R., Collins, P.L., Lebacq-Verheyden, A.M., Battey, J.F.,
1987. Expression of biologically active and antigenically authentic parainfluenza type 3
virus hemagglutinin-neuraminidase glycoprotein by a recombinant baculovirus. Virology.
160, 465-472.
Verikios, G., McCaw, J., McVernon, J., Harris, A.H., 2010. H1N1 influenza in Australia and its
macroeconomic effects. Centre of Policy Studies. General Paper No. G-212 December
2010. Monash University, Australia.
125
Vey, M., Orlich, M., Adler, S., Klenk, H.D., Rott, R., Garten,W. 1992 Hemagglutinin activation
of pathogenic avian influenza viruses of serotype H7 requires the protease recognition
motif R-X-K/R-R. Virology, 188, 408-413.
Vijaykrishna, D., Poon, L., Zhu, H., Ma, S., Li, O., Cheung, C., Smith, G., Peiris, J., Guan, Y.,
2010. Reassortment of pandemic H1N1/2009 influenza A virus in swine. Science 328,
1529.
Villareal, C., Flores, A., 2003. The Mexican avian influenza (H5N2) outbreak. Avian Dis. 47,
18-22.
Vyas, G., Shulman, N., 1970. Hemagglutination assay for antigen and antibody associated with
viral hepatitis. Science. 170, 332-333.
Wang, C., Lamb, R.A., Pinto, L.H., 1995. Activation of the M2 ion channel of influenza virus: a
role for the transmembrane domain histidine residue. Biophys. J. 69, 1363-1371.
Wang, S., Fang, L., Fan, H., Jiang, Y., Pan, Y., Luo, R., Zhao, Q., Chen, H., Xiao, S., 2007.
Construction and immunogenicity of pseudotype baculovirus expressing GP5 and M
protein of porcine reproductive and respiratory syndrome virus. Vaccine 25, 8220-8227.
Wang, K., Holtz, K.M., Anderson, K., Chubet, R., Mahmoud, W., Cox, M.M.J., 2006.
Expression and purification of an influenza hemagglutinin—one step closer to a
recombinant protein-based influenza vaccine. Vaccine. 24, 2176-2185.
Webster, R.G., 2006. H5 influenza viruses. In: Y. Kawaoka (Ed.), Influenza Virology Current
Topics. Caister Academic Press, Norfolk, England, pp. 281.
Weyer, U., Possee, R.D., 1991. A baculovirus dual expression vector derived from the
Autographa californica nuclear polyhedrosis virus polyhedrin and p10 promoters: co-
expression of two influenza virus genes in insect cells. J. Gen. Virol. 72 ( Pt 12), 2967-
2974.
Wilson, I., Skehel, J., Wiley, D., 1981. Structure of the haemagglutinin membrane glycoprotein
of influenza virus at 3angstrom resolution. Nature. 289, 366-373.
World Healh Organization (WHO), 2010. Recommended viruses for influenza vaccines for use
in the 2010-2011 northern hemisphere influenza season 2010, 13.
Wu, Q., Fang, L., Wu, X., Li, B., Luo, R., Yu, Z., Jin, M., Chen, H., Xiao, S., 2009. A
pseudotype baculovirus-mediated vaccine confers protective immunity against lethal

126
challenge with H5N1 avian influenza virus in mice and chickens. Mol. Immunol. 46, 2210-
2217.
Yamada, S., Suzuki, Y., Suzuki, T., Le, M.Q., Nidom, C.A., Sakai-Tagawa, Y., Muramoto, Y.,
Kiso, M., Horimoto, T., Shinya, K. Sawada, T., Kiso, M., Usui,T., Murata, T., Lin, Y.,
Hay, A., Haire, L.F. Stevens, D.J., Russell, R.J., Gamblin, S.J., Skehel, J.J., Kawaoka, Y.,
2006. Haemagglutinin mutations responsible for the binding of H5N1 influenza A viruses
to human-type receptors. Nature, 444, 378-382.
Yang, D.G., Chung, Y.C., Lai, Y.K., Lai, C.W., Liu, H.J., Hu, Y.C., 2007. Avian influenza virus
hemagglutinin display on baculovirus envelope: cytoplasmic domain affects virus
properties and vaccine potential. Mol. Ther. 15, 989-996.
Yoshida, S., Araki, H., Yokomine, T., 2010. Baculovirus-based nasal drop vaccine confers
complete protection against malaria by natural boosting of vaccine-induced antibodies in
mice. Infect. Immun. 78, 595-602
Zhang, F., Manzan, M.A., Peplinski, H.M., Thiem, S.M., 2008. A new Trichoplusia ni cell line
for membrane protein expression using a baculovirus expression vector system. In Vitro
Cell Dev Biol Anim. 44, 214-223.

127
Appedices
Appendix A
Raw data for viral growth curve
Table A1: Individual virus titres for each recombinant HA-expressing virus from individual trials
Trial Virus 12 h.p.i. 24 h.p.i. 36 h.p.i. 48 h.p.i. 72 h.p.i. 96 h.p.i.
1 AcHA:VP39FLAG 2.11E+03 9.17E+02 5.45E+05 5.45E+05 1.23E+08 2.34E+08
2 AcHA:VP39FLAG 4.88E+03 3.46E+04 3.12E+05 3.12E+05 3.62E+08 9.00E+08
1 AcVP39:HAFLAG 1.55E+03 4.99E+03 2.45E+05 2.45E+05 3.68E+08 1.36E+09
2 AcVP39:HAFLAG 3.57E+02 4.99E+03 3.49E+04 3.49E+04 3.80E+08 1.36E+09
1 AcHA:GP64FLAG 8.59E+02 1.85E+03 5.19E+04 5.19E+04 1.90E+07 2.46E+09
2 AcHA:GP64FLAG 2.00E+03 3.50E+03 8.47E+04 8.47E+04 1.30E+08 2.61E+08
1 AcHAFLAG 1.68E+04 4.52E+04 2.70E+05 2.70E+05 4.50E+07 5.70E+08
2 AcHAFLAG 5.17E+02 4.46E+04 2.70E+05 2.70E+05 3.30E+07 2.08E+08
1 AcΔCC 2.08E+03 3.31E+04 8.59E+04 8.59E+04 1.10E+09 1.57E+09
2 AcΔCC 1.01E+03 2.57E+04 4.55E+05 4.55E+05 1.70E+08 4.77E+08
Table A2 Mean virus titres for each recombinant HA-expressing virus
0 12 24 36 48 72 96
AcHA:VP39FLAG 1 3.50E+03 1.78E+04 4.29E+05 1.42E+08 2.43E+08 5.67E+08
Ac.VP39:HAFLAG 1 9.54E+02 4.99E+03 1.40E+05 3.33E+07 3.74E+08 1.36E+09
Ac.HA:GP64FLAG 1 1.43E+03 2.68E+03 6.83E+04 1.56E+07 7.45E+07 1.20E+09
AcHAFLAG 1 8.66E+03 4.49E+04 2.70E+05 1.61E+07 3.90E+07 3.89E+08
AcΔCC 1 1.55E+03 2.94E+04 2.70E+05 3.84E+07 6.35E+08 1.02E+09

128
Table 6.3 Single-Factor ANOVA: Microsoft Excel Output for Statistical analysis of variance
between growth of recombinant HA-expressing viruses
Anova: Two-Factor Without Replication
SUMMARY Count Sum Average Variance
Row 1 6 5E+08 83258005 9.69E+15
Row 2 6 2.07E+09 3.46E+08 1.76E+17
Row 3 6 1.76E+09 2.94E+08 2.94E+17
Row 4 6 1.77E+09 2.96E+08 2.94E+17
Row 5 6 2.49E+09 4.15E+08 1E+18
Row 6 6 4.1E+08 68265033 1.15E+16
Row 7 6 6.3E+08 1.05E+08 5.22E+16
Row 8 6 2.58E+08 43052520 6.7E+15
Row 9 6 2.73E+09 4.55E+08 4.88E+17
Row 10 6 6.67E+08 1.11E+08 3.65E+16
Column 1 10 32163 3216.3 24438029
Column 2 10 199447 19944.7 3.42E+08
Column 3 10 2354410 235441 3.02E+10
Column 4 10 1.16E+09 1.16E+08 6.11E+16
Column 5 10 2.73E+09 2.73E+08 1.04E+17
Column 6 10 9.4E+09 9.4E+08 5.45E+17
ANOVA
Source of
Variation SS df MS F P-value F crit
Rows 1.31E+18 9 1.45E+17 1.285634 0.271092 2.095755
Columns 6.77E+18 5 1.35E+18 11.97277 2.13E-07 2.422085
Error 5.09E+18 45 1.13E+17
Total 1.32E+19 59

129
Appendix B
Sample Calculation of Molecular Weight using Linear Regression
Figure A1: Standard Curve generated from plotting the log10 of the known molecular weight of
several proteins from the Frogga Bio Protein Ladder employed in these experiments against the
distance migrated (cm). The equation of the linear trendline is displayed on the graph.
Using the equation of the line from the standard curve:
Measured distance band 1 migrated: 1.8cm
Y= -0.3212x + 2.3792
Y= -.3212(1.8cm) + 2.3792
Y= 1.801
MW= 10^1.801
MW=63.24kDa
Appendix C
y = -0.3212x + 2.3792 1.5
1.6
1.7
1.8
1.9
2
2.1
2.2
2.3
2.4
0 0.5 1 1.5 2 2.5 3
logM
W
Distance band migrated (cm)

130
Sample Calculation of Protein from a BSA Standard Curve
Figure A2: Graph of A595 readings of known concentrations of BSA. The equation of the linear
trendline is displayed on the graph.
Sample Calculation
Protein of interest A595= 1.94
y=0.0011x +0.5667
1.94 = 0.0011x +0.5667
1.94 -0.5667/0.0011=x
1248 µg/ml
y = 0.0011x + 0.5667
0.5
0.7
0.9
1.1
1.3
1.5
1.7
1.9
0 200 400 600 800 1000 1200
A5
95
Concentration of BSA Standard (µg/ml)
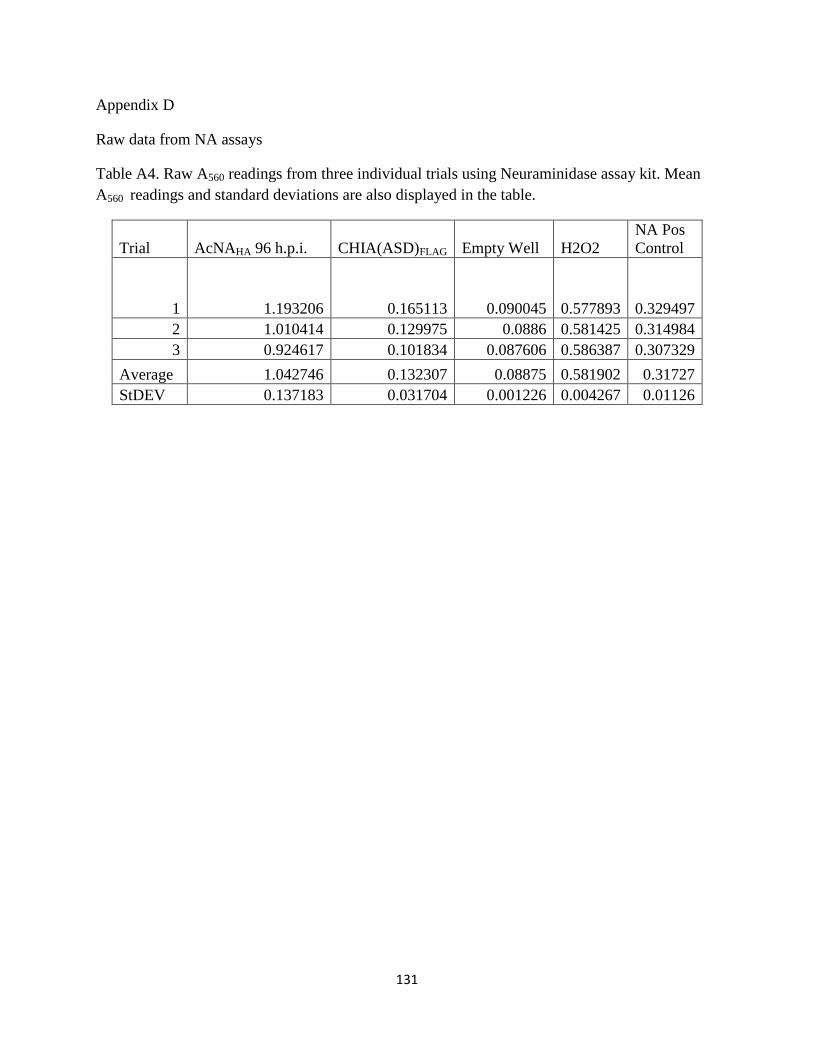
131
Appendix D
Raw data from NA assays
Table A4. Raw A560 readings from three individual trials using Neuraminidase assay kit. Mean
A560 readings and standard deviations are also displayed in the table.
Trial AcNAHA 96 h.p.i. CHIA(ASD)FLAG Empty Well H2O2
NA Pos
Control
1 1.193206 0.165113 0.090045 0.577893 0.329497
2 1.010414 0.129975 0.0886 0.581425 0.314984
3 0.924617 0.101834 0.087606 0.586387 0.307329
Average 1.042746 0.132307 0.08875 0.581902 0.31727
StDEV 0.137183 0.031704 0.001226 0.004267 0.01126