Comparing Entreprenurship Attitudes: Theory & Evidence ...cicia.uprrp.edu/PII/Paul-2013 UNDER...
35
Comparing Entreprenurship Attitudes: Theory & Evidence from a Cross-Country Study Justin Paul, University of Puerto Rico Abstract In this paper, we attempt to compare entrepreneurial attributes of MBA students, the next generation business people, from three distinct and strategically significant economies located in different regions in the world- two important Asian countries, India from South Asia and Japan from East Asia ( India, being an emerging country and Japan, a developed country) and the United States of America. The main goal is to examine the linkage between entrepreneurial activity, business acumen and country culture that could be imbibed through the norms and notions in a society or innate personality factors in a country context. We put forward a theoretical framework to denote the linkage between entrepreneurial attitude, proactive personality and culture in this study. For the proactive personality measurement, Bateman and Crant's (1993) questionnaire, consisting of seventeen traits is used. The findings indicate that although, India has established itself in Information technology and information enabled services primarily through entrepreneurship, the country still has to go a long way as compared to developed countries such as Japan and USA where entrepreneurship is widespread. The results seek to contribute to the development of theoretical and knowledge bases, that will be of interest to research and policy communities. Keywords: Culture, Society, Entrepreneurship, Proactive personality, India , Japan, USA
Transcript of Comparing Entreprenurship Attitudes: Theory & Evidence ...cicia.uprrp.edu/PII/Paul-2013 UNDER...

Comparing Entreprenurship Attitudes: Theory & Evidence
from a Cross-Country Study
Justin Paul, University of Puerto Rico
Abstract
In this paper, we attempt to compare entrepreneurial attributes of MBA students, the next generation
business people, from three distinct and strategically significant economies located in different regions in
the world- two important Asian countries, India from South Asia and Japan from East Asia ( India,
being an emerging country and Japan, a developed country) and the United States of America. The main
goal is to examine the linkage between entrepreneurial activity, business acumen and country culture
that could be imbibed through the norms and notions in a society or innate personality factors in a
country context. We put forward a theoretical framework to denote the linkage between entrepreneurial
attitude, proactive personality and culture in this study. For the proactive personality measurement,
Bateman and Crant's (1993) questionnaire, consisting of seventeen traits is used. The findings indicate
that although, India has established itself in Information technology and information enabled services
primarily through entrepreneurship, the country still has to go a long way as compared to developed
countries such as Japan and USA where entrepreneurship is widespread. The results seek to contribute to
the development of theoretical and knowledge bases, that will be of interest to research and policy
communities.
Keywords: Culture, Society, Entrepreneurship, Proactive personality, India , Japan, USA

Introduction
The youngsters in developing countries may have stronger entrepreneurial intentions, according to the
theory of planned behavior. The entrepreneur is an economic person, who tries to maximize his profits
by innovation. Innovations involve problem solving and the entrepreneur gets satisfaction in solving
problems (Higgins, 1964). It has been revealed from research that people who choose entrepreneurial
careers look for greater returns and rewards than regular jobs. Entrepreneurship has emerged as an
increasingly prominent characteristic of developed countries. The definition of an entrepreneur has
evolved over the decades, from someone who bears risk by buying at a low price and selling at a higher
price; to someone who creates new enterprises. An entrepreneur is driven by motivation. According to
McClelland (1961) and Say (1963), an entrepreneur is one who brings together the factors of production,
provisions of continuing management as well as risk bearing. Schumpeter (1950) envisioned that an
entrepreneur is the agent who provides an economic leadership that changes the initial conditions of the
economy and causes this discontinuous dynamic change. Entrepreneur is considered as an innovator
(Tamizharasi & Panchanatham, 2010).
Through innovation, hard work, and willingness to accept financial and opportunity cost and risk, the
entrepreneur tries to leverage previously undiscovered opportunities for arbitrage and profit (Kirzner,
1997). This quest for profit, and the possibility of personal and financial failure, aid in ensuring that an
economy’s resources are used efficiently. It is worth noting that successful entrepreneurs create job
opportunities for others, which in turn, contributes to the governments in the form of tax revenue.
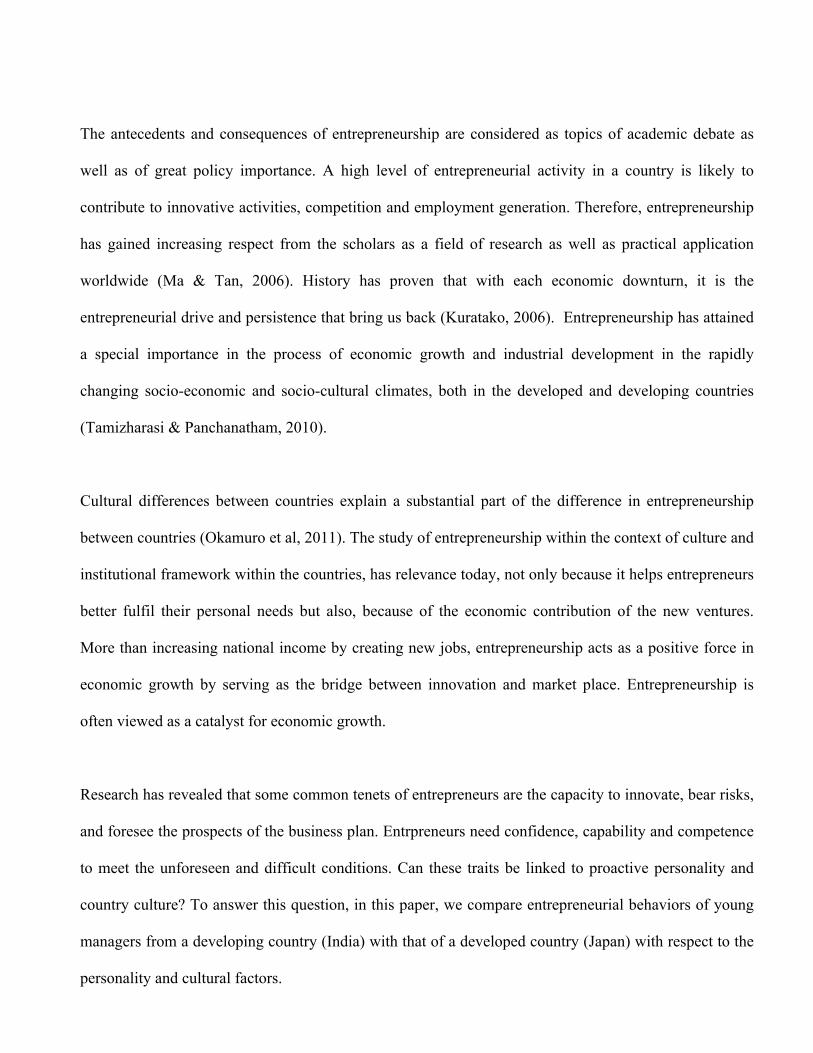
The antecedents and consequences of entrepreneurship are considered as topics of academic debate as
well as of great policy importance. A high level of entrepreneurial activity in a country is likely to
contribute to innovative activities, competition and employment generation. Therefore, entrepreneurship
has gained increasing respect from the scholars as a field of research as well as practical application
worldwide (Ma & Tan, 2006). History has proven that with each economic downturn, it is the
entrepreneurial drive and persistence that bring us back (Kuratako, 2006). Entrepreneurship has attained
a special importance in the process of economic growth and industrial development in the rapidly
changing socio-economic and socio-cultural climates, both in the developed and developing countries
(Tamizharasi & Panchanatham, 2010).
Cultural differences between countries explain a substantial part of the difference in entrepreneurship
between countries (Okamuro et al, 2011). The study of entrepreneurship within the context of culture and
institutional framework within the countries, has relevance today, not only because it helps entrepreneurs
better fulfil their personal needs but also, because of the economic contribution of the new ventures.
More than increasing national income by creating new jobs, entrepreneurship acts as a positive force in
economic growth by serving as the bridge between innovation and market place. Entrepreneurship is
often viewed as a catalyst for economic growth.
Research has revealed that some common tenets of entrepreneurs are the capacity to innovate, bear risks,
and foresee the prospects of the business plan. Entrpreneurs need confidence, capability and competence
to meet the unforeseen and difficult conditions. Can these traits be linked to proactive personality and
country culture? To answer this question, in this paper, we compare entrepreneurial behaviors of young
managers from a developing country (India) with that of a developed country (Japan) with respect to the
personality and cultural factors.

4. Entrepreneurial Intentions
Attitude could change and evolve over a period of time. They are not same across individuals. Attitudes
are not permanent features. Attitude is defined as a mental and neural state of exerting readiness, exerting
a directive or dynamic influence upon the individuals with regard to all objectives and situations
(Allport, 1935). Stimpson, Robinson and Hunt (1991) have shown that entrepreneurial orientation
consists of four broad dimensions such as achievement, self esteem, personal control and innovation
(Tamizharasi & Panchanatham, 2010).
An entrepreneur’s intention and behavior can be interpreted as the desire to start one’s own business.
Entrepreneur risks time and money in search of opportunities to transcend horizons. Creativity and
innovative mind are the basic preconditions. They are pathfinders who change their organization’s
mission or find and solve problems (Durand & Shea 1974).
Kumar (2013) reveals how Indian knowledge-intensive service firms leverage their entrepreneurial
orientations in the pursuit of diverse international market opportunities, and sustain their entrepreneurial
orientation through continuous efforts to learn from experience and the environment. His study provides
empirical insights into early internationalisation of Indian KISFs, thus addressing a lacuna in this field.
Harris, and Gibson (2008) examined the entrepreneurial attitudes of undergraduate students enrolled in
multiple universities in USA. Their result indicated that majority of students possessed entrepreneurial
attitudes. Furthermore, both student characteristics and entrepreneurial experience were found to be

associated with certain entrepreneurial attitudes. Lajovleva, Kolvereid and Stephan (2011) used the
theory of Planned Behaviour propounded by Ajzen (1991) to predict entrepreneurial intentions among
students in developing and developed countries. The findings indicate that respondents from developing
countries have stronger entrepreneurial intentions than those from developed countries. Moreover, the
respondents from developing countries also score higher on the theory’s antecedents of entrepreneurial
intentions – attitudes, subjective norms and perceived behavioural control – than respondents from
developed countries. Their findings support the Theory of Planned Behaviour in developing and
developed countries.
Following previous studies, the rest of the section can be classified into two sub-titles. i. Pro-active
Personality ii. Country Context and Culture
4.1 Proactive Personality
Bateman and Crant (1993) developed the proactive personality index, defining it as a relatively stable
measure to effect environmental change that differentiates people based on the extent to which they take
action to influence their environments (Prieto, 2011).
As work becomes more dynamic and decentralized, proactive behaviour and initiative become even more
critical determinants of organizational success. For example, companies will increasingly rely upon
employees' personal initiatives to identify and solve problems if new forms of management are
implemented that minimize the surveillance function (Frese, Fay, Hilburger, Leng, & Tag,, 1997).
Proactive individuals may be more successful in entrepreneurial leadership and may contribute more to
the organization. In recent times, organizations are keen on hiring employees who have entrepreneur

traits because of their belief that such people can bring changes by finding innovative solutions and new
practices (Claar, Tenhaken and Frey, 2009).
Crant (1995) demonstrated that proactive personality accounted for incremental variance in the job
performance of real estate agents after controlling both extraversion and conscientiousness (Prieto,
2011). The proactive personality scale measures a personal disposition toward proactive behavior, an
idea that intuitively appears to be related to entrepreneurship. Proactive persons tend to identify
opportunities and take initiative. They keep trying to bring change (Crant, 1996). Proactive personality
appears to have the potential for providing further insight into the personality trait-entrepreneurship
relationship.
Crant (1996) reported the relationship between proactive personality and entrepreneurial intentions. His
results show that proactive personality is positively associated with entrepreneurial intentions. This may
also be the case for entrepreneurial leadership; because people with a proactive personality may be more
inclined to mobilizing the resources and gaining the commitment for value creation. More proactive
people may have a greater desire to become entrepreneurial leaders in order to help create value for their
firms.
Proactive behaviour can be defined as taking initiative in improving current circumstances or creating
new ones. The staff members in an organization can engage in proactive activities as part of their in-role
behaviour in which they fulfil basic job requirements (Crant, 2000). For example, sales agents might
proactively seek feedback on their techniques for closing a sale with an ultimate goal of improving job
performance. Extra-role behaviours can also be proactive, such as efforts to redefine one's role in the

organization. For example, employees might engage in specialized management activities by identifying
and acting on opportunities to change the scope of their jobs or move to more desirable divisions of the
business. Following Crant (1996, 2000), we posit,
Hypothesis 1 - Proactive Personality is positively associated with Entrepreneurial Behavior.
Country Context and Culture
According to GEM (2009), countries are grouped based on three stages of economic development as
defined by the World Economic Forum’s Global Competitiveness Report: factor-driven, efficiency-
driven and innovation-driven. This classification in phases of economic development is based on the
level of GDP per capita and the extent to which countries are factor-driven.. As countries develop
economically, they tend to shift from one phase to the next. India is still a factor-driven economy
whereas Japan falls in the category of innovation driven economy. The economic reforms in 1991 and
the Information Technology boom during the second half of the 1990s have been significant factors
leading to a wave of entrepreneurship in the Indian sub-continent (Paul, 2010). On the other hand,
'entrepreneurship' was nurtured for a long time in countries such as Japan with the support of seed capital
and government in different ways. The institutional framework in Japan is more favourable to
entrepreneurship, compared to some of the European countries such as the Netherlands (Okamuro et al.,
2011).
India, though a developing country with 1.2 billion people, has emerged as the second fastest growing
economy in the world (Paul and Gupta, 2013). With GDP growing at an average of 8 per cent during

the last 15 years, Indian economy has recorded remarkable growth in exports, FDI etc., compared to
developed countries. According to the Global Entrepreneurship Monitor (GEM) 2006, one in every ten
Indians is engaged in some entrepreneurial activity or the other. India is ninth in the Global
Entrepreneurship Monitor (GEM) survey of entrepreneurial countries. It is the highest among 28
countries in Necessity-based entrepreneurship, while 5th from the lowest in Opportunity-based
entrepreneurship. On the other hand, Japan, France and USA are ranked relatively high in opportunity-
based entrepreneurship.
A lot of entrepreneurship activity is centred on the IT (Information Technology) industry in India; but,
there are a few outstanding examples in other fields. This new breed of entrepreneurs seems to make
their own rules and revolutionized the way business was done. They used a winning combination of
customer insight, industry knowledge, and out-of-the-box thinking to create winning innovations. To a
large extent, the society appears to be risk averse in India. People in India, compared to Japan, usually
seek secure and long-term employment, such as government jobs. Social attitudes, lack of capital,
inadequate physical infrastructure and lack of government support are major factors of hindrance. Japan
is the third largest economy in the world, the second largest economy in Asia, whereas India is ranked
as Asia’s third largest economy.
Entrepreneurial waves date back to 1950s and 1960s in Japan when society and government undertook
efforts for growth with slogans such as “Sell to the strangers,” “Double income” etc. On the other hand,
India, with its abundant supply of talent in IT and management, has become the hub of outsourcing of
services from the developed countries (Kedia and Lahiri, 2007). Besides, the Indian entrepreneurs have

gone global in the recent years whereas a lot of Japanese firms had gone global and grown global in
1970s and 1980s. The recent spate of global acquisitions by Indian firms has forced the business
community the world over to sit up and take notice of multinational firms from that sub-continent
(Paul, 2013). The policy changes enabled a scalable and sustainable model for creating a new breed of
entrepreneurs in the years to come.
In a nutshell, it is worth noting that although the concept of entrepreneurial competencies is used widely
by government agencies and others in their drive for economic development and business success, the
core concept of entrepreneurial competencies, its measurement and its relationship to entrepreneurial
performance and business success are in need of further rigorous research and development in practice
(Mitchelmore and Rowley, 2010).
Following the previous studies, particularly, Okamuro et al. (2011), we posit
Hypothesis 2 - Country Culture, which evolves over a period of time, based institutional framework
and business environment, contributes to entrepreneurial behavior.

Three Pillars of Entrepreneurship
Today’s knowledge based economy is a fertile ground for entrepreneurs. Therefore, we feel that it is
important to create the following 3 pillars which in turn would help grooming successful entrepreneurs.
This theoretical proposition can be depicted as Figure 1.
Pillar 1. Right Business Environment for Success:
The role of government agencies and their polices leads to the right business environment where
entreprneurship can be nurtured in many ways. Business environment in which the firms do business
varies from country to country.
Pillar 2. Access to ‘Smart Capital’:
Access to seed capital is one of the key areas of potential investment. For a long time, Asian
entrepreneurs, particularly Indian entrepreneurs, compared to US entrepreneurs, have had little access to
venture capital. It is true that in the last few years, several Venture Funds have entered the Indian
Market. Venture capital funds in the form of seed capital is known as smart capital.
Pillar 3. Networking and Exchange:
Entrepreneurs learn from experience- their own and that of others. The rapid pace of globalization and
fast growth of Asian economies present tremendous opportunities and challenges. Through planning and
focus, entrepreneurs can aspire to create a pool of entrepreneurs who might be the region’s –and the
world’s-leaders of tomorrow.

Figure 1- Three Pillars of Entrepreneurship
Theoretical framework developed by the authors
In nutshell, it is worth noting that although the concept of entrepreneurial competencies is used widely
by government agencies and others in their drive for economic development and business success, the
core concept of entrepreneurial competencies, its measurement and its relationship to entrepreneurial
performance and business success is in need for further rigorous research and development in practice
(Mitchelmore, Siwan and Rowley, Jennifer , 2010).
Research Objectives
Network & Exchange
Business Environment
Smart Capital
Entrepreneurship

In this study, we compare entrepreneurial attributes of MBA students in different countries such as India,
Japan and USA. The main hypothesis is that proactive personality traits are greatly influenced by one‘s
culture and not innate personality factors. If this is true, MBA students in a emerging economy such as
India would not score as high on the proactive personality index as would MBA students of the
developed countries like Japan and USA.
Methodology
An instrument containing 17 questions that measure proactive personality (Appendix A) was
administered to MBA students in India, Japan and USA. This self-report measure of proactive behavior
was developed by Bateman and Crant to measure a person‘s disposition toward proactive behavior as a
general construct that predicts behaviors intended to effect change (Schumpeter 1950).
An individual‘s total score range is between 17 and 119 on this instrument. The higher one‘s score, the
stronger the proactive personality. Previous work by Bateman and Crant has determined that scores
above 85 indicate fairly high proactivity. We used SPSS to perform Independent Sample T Test on both
the groups to find out if there is any statistically significant difference on each item of Bateman and
Crant personality index.
Analysis
The overall average score on the Bateman and Crant instrument is 84.69 in the case of the MBA students
in India. According to Bateman and Crant, this score is close to fairly high proactivity score 85. The
MBA students in Japan scores 90.08 on Bateman and Crant’s personality index that is much more than
the Indian MBA students. The overall score on the Bateman and Crant instrument is 94.49 in the case of
the MBA students from the United States. The MBA students in the United States have an even higher

proactivity score than the MBA students from Japan and the MBA students from India. The empirical
findings in Table 1 show scores of each group.
Table 1: Empirical Findings –Scores
Bateman and Crant Instrument
India
Average
Score (N-83)
Japan
Average Score
United States of America
Average Score
*1 I am constantly on the lookout for
new ways to improve my life. 5.325301 6.27907 6.33
*2
I feel driven to make a difference
in my community and maybe the
world.
4.626506 5.581395 5.53
3 I tend to let others take the
initiative to start new projects 4.385542 4.465116 4.22
4
Wherever I have been, I have been
a powerful force for constructive
change.
4.614458 5.023254 5.22

*5 I enjoy facing and overcoming
obstacles to my ideas. 5.84337 5.255814 5.69
*6
Nothing is more exciting than
seeing my ideas turn into reality.
5.060241 5.534884 6.36
*7
If I see something I don't like, I fix
it.
4.554217 4.930233 6.02
*8
No matter what the odds, if I
believe in something, I will make
it happen.
5.301966 5.325581 5.59
*9
I love being a champion for my
ideas, even against others' I love I
opposition.
5.169459 5.534884 5.56
10 I excel at identifying opportunities. 4.915663 5.046512 5.17
*11 I am always looking for better
ways to do things. 5.277108 5.674419 6.17
12
If I believe in an idea, no obstacle
will prevent me from making it
happen.
5.01494 5.204362 5.28

13 I love to challenge the status quo. 4.640964 4.813953 5.41
*14 When I have a problem, I tackle it
head-on. 5.001241 5.325581 5.62
15 I am great at turning problems into
opportunities. 4.902439 4.860465 5.23
16 I can spot a good opportunity long
before others can. 4.578313 5.023256 5.11
*17 If I see someone in trouble, I help
out in any way I can. 5.481928 6.209302 5.98
Sum 84.692415 90.088081 94.49
Individual questions with particularly high ratings (mean scores of 5.5 or higher on a 7-point Likert-type
scale) of Indian students include:
• I enjoy facing and overcoming obstacles to my ideas.(5.84)
Individual questions with particularly high ratings (mean scores of 5.5 or higher on a 7-point Likert-type
scale) of Japanese students include:
• I am constantly on the lookout for new ways to improve my life. (6.27)
• I feel driven to make a difference in my community and maybe the world. (5.58)
• Nothing is more exciting than seeing my ideas turn into reality. (5.53)
• I love being a champion for my ideas, even against others' opposition. (5.53)
• I am always looking for better ways to do things. (5.67)

• If I see someone in trouble, I help out in any way I can. (6.20)
Individual questions with particularly high ratings (mean scores of 5.5 or higher on a 7-point Likert-type
scale) of United States students include:
• I am constantly on the lookout for new ways to improve my life. (6.33)
• I feel driven to make a difference in my community and maybe the world. (5.53)
• I enjoy facing and overcoming obstacles to my ideas. (5.69)
• Nothing is more exciting than seeing my ideas turn into reality. (6.36)
• If I see something I don't like, I fix it. (6.02)
• No matter what the odds, if I believe in something, I will make it happen. (5.59)
• I love being a champion for my ideas, even against others' opposition. (5.56)
• I am always looking for better ways to do things. (6.17)
• When I have a problem, I tackle it head-on. (5.62)
• If I see someone in trouble, I help out in any way I can. (5.98)
We performed the T Test at 95% confidence interval to see whether there are any statistically significant
differences between the scores on each item between the three groups from India, Japan and USA. Table
2- shows the group statistics, mean, standard deviation and standard error of the two groups. Table 3
shows Independent Sample T Test.
Table 2: Group Statistics T-Test
Group Statistics

Bateman and Crant Instrument
Students N Mean
Std.
Deviation
Std.
Error Mean
I am constantly on the lookout for new
ways to improve my life.
India 83 5.325301 1.2698035 .1393790
Japan 64 6.279070 .7343796 .1119918
United
States
64 6.33 .118 .944
I feel driven to make a difference in my
community and maybe the world.
India 83 4.626506 1.3408301 .1471752
Japan 64 5.581395 .8791922 .1340756
United
States
64 5.53 .174 1.391
I tend to let others take the
initiative to start new projects
India 83 4.385542 3.8661487 .4243649
Japan 64 4.465116 1.5329529 .2337731
United States
64 4.22 .199 1.588
Wherever I have been, I have been a
powerful force for constructive change.
India 83 4.614458 1.3419255 .1472955
Japan 64 5.023256 1.0575887 .1612808
United
States
64 5.22 .147 1.175
I enjoy facing and overcoming obstacles
to my ideas.
India 83 5.084337 1.3986476 .1535215
Japan 64 5.255814 1.2168074 .1855614
United
States
64 5.69 .130 1.037

Nothing is more exciting than
seeing my ideas turn into reality.
India 83 5.060241 1.5409009 .1691358
Japan 64 5.534884 1.1411948 .1740306
United
States
64 6.36 .123 .982
If I see something I don't like, I fix it. India 83 4.554217 2.0674776 .2269352
Japan 64 4.930233 1.3869348 .2115056
United
States
64 6.02 .108 .864
No matter what the odds, if I believe in
something, I will make it happen.
India 83 5.301966 1.3294511 .1459262
Japan 64 5.325581 1.2095046 .1844477
United
States
64 5.59 .154 1.231
I love being a champion for my ideas,
even against others' opposition.
India 83 5.169459 1.3574559 .1490001
Japan 64 5.534884 1.0082714 .1537600
United
States
64 5.56 .163 1.308
I excel at identifying opportunities. India 83 4.915663 1.2897799 .1415717
Japan 64 5.046512 1.1943017 .1821293
United
States
64 5.17 .145 1.162

I am always looking for better ways to do
things.
India 83 5.277108 1.2328161 .1353191
Japan 64 5.674419 1.0628114 .1620772
United
States
64 6.17 .113 .901
If I believe in an idea, no obstacle will
prevent me from making it happen.
India 83 5.014940 1.3021515 .1429297
Japan 64 5.209302 1.1863939 .1809234
United
States
64 5.28 .157 1.253
I love to challenge the status quo. India 83 4.640964 1.3404619 .1471348
Japan 64 4.813953 1.2199886 .1860465
United
States
64 5.41 .166 1.330
When I have a problem, I tackle it head-
on.
India 83 5.000000 1.3525045 .1484567
Japan 64 5.325581 1.1489318 .1752105
United
States
64 5.62 .135 1.076
I am great at turning problems into
opportunities.
India 82 4.902439 1.2333809 .1362041
Japan 64 4.860465 1.2263262 .1870130
United
States
64 5.23 .162 1.294

I can spot a good opportunity long before
others can.
India 83 4.578313 1.2407755 .1361928
Japan 64 5.023256 1.0115611 .1542616
United
States
64 5.11 .156 1.249
If I see someone in trouble, I help out in
any way I can.
India 83 5.481928 1.2529131 .1375251
Japan 64 6.209302 .9400643 .1433585
United
States
64 5.98 .125 1.000
The table 2 describes the means and standard deviations of different items for the measurement of
entrepreneurial attitude of each group: MBA students in India, Japan and USA. The mean represents the
average score of each item with the overall scores for the groups on a seven-point scale. To arrive at any
conclusions that one group of students is significantly have more entrepreneurial attitude than another,
we need to examine the statistical significance of the result (t-test information).
Table 3: Independent Sample T Test
For ease of accommodating large data on single page, instead of writing the complete item of Bateman
and Crant Scale, we have used alphabets to represent the 17 items of Bateman and Crant personality
index. The 17 items correspond to A to Q alphabet respectively. For example alphabet A correspond to
item 1 i.e. “I am constantly on the lookout for new ways to improve my life” and alphabet B corresponds
to “I feel driven to make a difference in my community and maybe the world” and so on.

An independent samples t-test was conducted to examine whether there was a significant difference in
items of entrepreneurial attitude between India, Japan and USA. The table 3 describes independent
samples t-test information to ascertain whether there is a significant difference between the two groups in
their entrepreneurial attitude. Before examining the t-test information, we must decide whether we can

assume equal variances or not. Below the section of t-test for equality of means, we need to focus on the
sig (2-tailed) column – the p-value.
The test revealed a statistically significant difference in the following items:
Item A: I am constantly on the lookout for new ways to improve my life.
The p-value (sig.) for item A for the Levene’s test is .001, it is below .05, hence we cannot assume equal
variances, and the t value is 5.334. The p-value is .000 for the t-test for equality of means, here we are
checking on the sig (2-tailed) column – this is the p-value. This p-value is related to independent
samples t-test and shows that there is a significant difference between the two nationality groups with
respect to item A. For instance, the table 1 shows the average score or means of items A as 5.32 for
Indian students and 6.27 for Japanese students. Japanese students score significantly higher than the
Indian students.
Item B: I feel driven to make a difference in my community and maybe the world.
The p-value (sig.) for item B for the Levene’s test is .004, it is below .05, hence we cannot assume equal
variances, and the t value is 4.79. The p-value is .000 for the t-test for equality of means, here we are
checking on the sig (2-tailed) column – this is the p-value. This p-value is related to independent
samples t-test and shows that there is a significant difference between the two nationality groups with
respect to item B. The table 1 shows the average score or means of items B as 4.62 for Indian students
and 5.58 for Japanese and 5.53 for American students respectively. I.e., Japanese students score
significantly higher than the Indian students.

The test revealed significant difference in variances but mean is not significantly different in the
following items:
Item D: Wherever I have been, I have been a powerful force for constructive change.
The p-value(sig.) for item D for the Levene’s test is .043, it is below .05, hence we cannot assume equal
variances, and the t value is 1.87. The p-value is .064 for the t-test for equality of means, here we are
checking on the sig (2-tailed) column – this is the p-value. This p-value is related to independent
samples t-test and shows that mean is not significantly different between the two nationality groups with
respect to item D. The table 1 shows the average score or means of items D as 4.61 for Indian students,
5.02 for Japanese students and 5.22 for American students. Japanese students score significantly higher
than the Indian students, though their score is less than the students in USA.
Item F: Nothing is more exciting than seeing my ideas turn into reality.
The p-value(sig.) for item F for the Levene’s test is .036, it is below .05, hence we cannot assume equal
variances, and the t value is 1.95. The p-value is .053 for the t-test for equality of means, here we are
checking on the sig (2-tailed) column – this is the p-value. This p-value is related to independent
samples t-test and shows that there is no significant difference in the mean of the two nationality groups
with respect to item F. The table 1 shows the average score or means of items F as 5.06 for Indian
students, 5.53 for Japanese students and 6.36 for American students. USA students score significantly
higher than students from India and Japan in this context.
On the basis of our study, we postulate a with a theoretical framework that entrepreneurial attitude is a
function of proactive personality and culture, which can be depicted as shown in Figure 2.

Figure 2
CONCLUSION
It is interesting that Indian MBA students and Japanese MBA students, though showed overall proactive
personality 84.69 and 90.08 on Bateman and Crant instrument, yet had such strong differences on
individual items. MBA students in India have not scored as high on the proactive personality index as

MBA students of the developed country Japan. Indian students have scored higher than Japanese
students on:
Item O: “I am great at turning problems into opportunities”
Item E: “I enjoy facing and overcoming obstacles to my ideas”
Indians students scored almost same on:
Item H: “No matter what the odds, if I believe in something, I will make it happen”,
One possible explanation for the difference is that, on average, Indian students understand the degree of
difficulty for the entrepreneur and degree of bureaucratic hassles in India yet they believe that if one tries
than they can groom themselves as successful entrepreneurs.
The hypothesis in this study is that proactive personality traits and entrepreneurial attitude are greatly
influenced by one‘s culture and personality factors found to be true as all the three the group are above
the threshold of 85 score on personality index. However, since the scores are different so influence of
culture cannot be ignored. Last, but not least, Regardless of the differences, Indian, American and
Japanese MBA students exhibit overall proactive, entrepreneurial attitudes, lending evidence to the
conclusion that proactive personality attributes may be based more on inherent personality factors rather
than strictly cultural learning. However, how those attributes are then demonstrated or expressed may be
driven by cultural realities. Thus we conclude with a mathematical equation. Ie,
Entrepreneurial attitude= f (pp, c) where
pp stand, for proactive personality and c stands for culture.

References
Ajzen, I & Madden, T.J. 1986. “Prediction of Goal oriented Behavior: Attitude”, intentions and perceiving behavioral control. Journal of Experimental Social Psychology, 22, pp 453-474.
Allport G.W., 1935. Attitude In C. Murchison (Ed.)”, Hand book of MA; Clark University. pp 798-884.
Brockner, J. 1988, “Self esteem at Work” Lexington Books Vol. pp. 22-34.
Crant, J. M. 1995. The proactive personality scale and objective among real estate agents. Journal of Applied Psychology, 80, 532-537.
Crant, J. M. 1996. The proactive personality scale as a predictor of entrepreneurial intentions. Journal of
Small Business Management, 34, 42-49.
Crant, J. M. 2000. The proactive personality scale in organizations. Journal of Management, 80, 435-462.
Crant, J. M., & Bateman, T. S. 2000. Charismatic leadership viewed from above: The impact of proactive personality. Journal of Organizational Behavior, 21, 63-75.
Desa, Bharat, Entrepreneurship and India http://www.siliconIndia.com/guestcontributor/guestarticle/13/Entrepreneurship_and_India.html Accessed on 1st June 2011
Durand & Shea. 1974. “Entrepreneurial Activity as a formation of Achievement” Motivation reinforcement control, Journal of Psychology, vol. 88(a). Gupta Vishal, & Bave N.M. 2007. The Influence of Proactive Personality and Stereotype Threat on
Women's Entrepreneurial Intentions, Journal of Leadership & Organizational Studies (2007) Volume: 13, Issue: 4, Pages: 73-85
Harris, Michael and Gibson, Shanon. 2008. Examining the entrepreneurial attitudes of US business students, Education + Training, vol. 50, no. 7, pp. 568-581. Higgins.1964. “The Economic development Harper and Row, New York.
Kuratako, D, 2006. A tribute to 50 years of excellence in entrepreneurship and small business. Journal of small Business Management, 44(3): 483-92.

Lajovleva, Kolvereid and Stephan 2011. Entrepreneurial Intentions in Developing and Developed Countries, Education + Training, Vol. 53, No. 5, pp. 353-370.
Ma, H., and T. Tan. 2006. Key components and implications of entrepreneurship: A 4-P frame work. Journal of Business Venturing 21 (5): 704-25. McClelland et al. 1953. “The achievement motive” Appleton-century-croft, New York.
McClelland, D.C. 1961. “The achieving society” D.VanNorstrant.Co., New York, pp 210-215.
Michael Frese, Doris Fay, Tanja Hilburger, Karena Leng, Almut Tag 1997. “The concept of personal initiative: Operationalization, reliability and validity in two German samples” Journal of Occupational and Organizational Psychology Volume 70, Issue 2, pages
139–161, June
Mitchelmore, Siwan and Rowley, Jennifer. 2010. Entrepreneurial Competencies: A Literature Review and Development Agenda, International Journal of Entrepreneurial Behavior and Research, Vol. 16, No. 2, pp. 92-111.
SAY J.B, 1963. “Treatise on political economy or the production, distribution and consumption of Wealth”. Translated from fresh by C.R. Prenerp, Harvard University, Boston.
Sharma, Ekta. 2010. Entrepreneurial drive among Indian women, Abhigyan Publisher: Foundation for Organisational Research & Education Issue: Oct-Dec, 2010 Source Volume: 28 Source Issue: 3

Schumpeter J. 1950. “The theory of Economic Development”, Harvard University Press, Cambridge.
Stimpson D, V. Robinson, P.B, J.C and Hunt H.K. 1991. “An attitude Approach to the Prediction of Entrepreneurship”. Entrepreneurship Theory and Practice, Summer, pp 13- 31. consistency in social behavior. The Ontario Symposium, Vol.2. pp 131-146. Hillsdale, 1982.
Tamizharasi G and Panchanatham N. 2010, Entrepreneurial Attitudes among Entrepreneurs in Small and
Medium Enterprises, International Journal of Innovation, Management and Technology, Vol. 1, No. 4, October 2010 ISSN: 2010-0248
Victor V. Claar, Vicki R. TenHaken, Robery Frey, 2009, Entrepreneurial Attitudes of MBA Students In
The United States Relative To The CIS: The Case Of Armenia, International Business & Economics Research Journal – 2009 Volume 8, Number 2 67
Venkatapathy, R. (1992). “Entrepreneurial Attitude Orientation among first and Second Generation Entrepreneurs”. Paper presented to the National workshop on Management Research Development held under the auspices of the Association of Indian Management Schools, Indira Gandhi Institute for Development Research.
Report
An eclectic theory of entrepreneurship: policies, institutions and culture Research Report 0012/E
http://www.entrepreneurship-sme.eu/pdf-ez/H200012.pdf

Table 3
Independent Samples Test
Levene's Test
for
Equality of
Variances
T-test for Equality
of Means
95% Confidence
Interval of the
Difference
F Sig. t df Sig.
(2-tailed)
Mean
Difference
Std. Error
Difference
Lower Upper
A Equal
variances
assumed
12.415 .001 -4.542 124 .000 -.9537686 .2099820 -1.3693817 -.5381554
Equal
variances
not
assumed
-5.334 122.429 .000 -.9537686 .1787979 -1.3077044 -.5998327
B Equal
variances
assumed
8.385 .004 -4.219 124 .000 -.9548893 .2263085 -1.4028172 -.5069615

Equal
variances
not
assumed
-4.796 117.108 .000 -.9548893 .1990899 -1.3491727 -.5606059
C Equal
variances
assumed
.792 .375 -.130 124 .897 -.0795741 .6140507 -1.2949525 1.1358042
Equal
variances
not
assumed
-.164 118.088 .870 -.0795741 .4844951 -1.0389989 .8798506
D Equal
variances
assumed
4.169 .043 -1.737 124 .085 -.4087980 .2354055 -.8747313 .0571354
Equal
variances
not
assumed
-1.872 104.165 .064 -.4087980 .2184203 -.8419256 .0243296
E Equal
variances
assumed
.608 .437 -.681 124 .497 -.1714766 .2517442 -.6697490 .3267957

Equal
variances
not
assumed
-.712 96.111 .478 -.1714766 .2408358 -.6495249 .3065717
F Equal
variances
assumed
4.485 .036 -1.781 124 .077 -.4746428 .2664688 -1.0020591 .0527736
Equal
variances
not
assumed
-1.956 109.002 .053 -.4746428 .2426800 -.9556265 .0063410
G Equal
variances
assumed
1.316 .254 -1.073 124 .285 -.3760157 .3504203 -1.0695956 .3175642
Equal
variances
not
assumed
-1.212 115.775 .228 -.3760157 .3102163 -.9904508 .2384194
H Equal
variances
assumed
.364 .547 -.097 124 .923 -.0236150 .2423966 -.5033858 .4561557

Equal
variances
not
assumed
-.100 92.475 .920 -.0236150 .2351923 -.4906953 .4434652
I Equal
variances
assumed
3.622 .059 -1.556 124 .122 -.3654252 .2348961 -.8303503 .0995000
Equal
variances
not
assumed
-1.707 108.783 .091 -.3654252 .2141102 -.7897941 .0589437
J Equal
variances
assumed
.345 .558 -.553 124 .581 -.1308490 .2364175 -.5987855 .3370875
Equal
variances
not
assumed
-.567 91.060 .572 -.1308490 .2306808 -.5890640 .3273661
K Equal
variances
assumed
.265 .608 -1.795 124 .075 -.3973102 .2213358 -.8353957 .0407754

Equal
variances
not
assumed
-1.882 96.856 .063 -.3973102 .2111405 -.8163734 .0217531
L Equal
variances
assumed
.003 .954 -.818 124 .415 -.1943626 .2375221 -.6644854 .2757602
Equal
variances
not
assumed
-.843 92.358 .401 -.1943626 .2305692 -.6522693 .2635441
M Equal
variances
assumed
.692 .407 -.708 124 .480 -.1729896 .2444320 -.6567890 .3108098
Equal
variances
not
assumed
-.729 92.445 .468 -.1729896 .2371960 -.6440512 .2980720
N Equal
variances
assumed
.553 .458 -1.346 124 .181 -.3255814 .2418497 -.8042698 .1531070

Equal
variances
not
assumed
-1.418 98.065 .159 -.3255814 .2296477 -.7813061 .1301433
O Equal
variances
assumed
.012 .912 .181 123 .857 .0419739 .2317734 -.4168074 .5007552
Equal
variances
not
assumed
.181 85.850 .856 .0419739 .2313556 -.4179574 .5019052
P Equal
variances
assumed
1.846 .177 -2.027 124 .045 -.4449426 .2194947 -.8793841 -.0105010
Equal
variances
not
assumed
-2.162 101.429 .033 -.4449426 .2057793 -.8531325 -.0367527
Q Equal
variances
assumed
2.600 .109 -3.347 124 .001 -.7273746 .2172925 -1.1574573 -.2972919

Equal
variances
not
assumed
-3.661 108.017 .000 -.7273746 .1986575 -1.1211475 -.3336017