Comparing Endocranial Form and Shape Differences in … · 1981; Holloway et al. 2004), but also...
14
Comparing Endocranial Form and Shape Differences in Modern Humans and Neandertals: a Geometric Approach ABSTRACT Paleoneurology is based on the analysis of the traces left by the brain cortical structures on the endocranial surface of fossil specimens. Although such information is indirect and fragmentary, it may provide useful insights on hu- man brain evolution. Computed tomography and shape analysis deeply improve the toolkit available for paleo- neurological studies. Shape analysis and multivariate approaches suggest that modern humans have undergone a specific evolution of the parietal areas. In this paper the endocranial lateral profiles of two complete specimens (one modern human and one Neandertal) are compared using both form and shape information by means of geometric comparison and coordinate-based maps, integrating superimpositions and Euclidean distance matrix analysis. Using both superimposed (shape) and non-transformed (form) data, the modern endocast is character- ized by a midsagial enlargement of the parietal and occipito-cerebellar areas, associated with antero-posterior shortening of the fronto-temporal profile. Differences can be quantified and synthesized using simple geometric tools. Modern brain morphology may be the result of both neural changes and structural constraints, in which modularity and integration make the endocranial geometry sensitive to the cranial base dynamics, facial changes, tissue strains, and metabolic/physiological adjustments. Although paleoanthropology often deals with fragments or single specimens, the use of geometrical modelling is a useful and simple tool to standardize, quantify, and describe morphological differences. INTRoDuCTIoN T he morphogenesis of the neurocranium is the result of a genetic program and the structural interaction between bone and soft tissues. The vault changes in size mostly in response to brain pressure and growth, while changing in shape under the constraints of connective tensors like the falx cerebri and the tentorium cerebelli (Moss and Young 1960). In contrast, the inferior surfaces of the endocranium display a more complex developmental basis, interact- ing with the cranial base dynamics and morphogenesis of the face (Lieberman et al. 2000; McCarthy 2001; Ross et al. 2004). The brain’s cortical structures contact the endocra- nial wall through the layers of the dura mater, leaving their imprints on the bone surface. This relationship provides the basic framework of paleoneurology, aimed at charac- terizing brain morphology in fossil species (Bruner 2003; Falk 1987; Holloway 1978). Of course, the absence of evidence is not always evi- dence of absence. Namely, the presence of a trace on the endocranial surface reveals the past existence of a struc- ture, but the absence of imprints cannot prove the absence of the structure itself. Traces of tissue are preserved de- pending upon the pressure on the endocranial table and the thickness of the dura layers (see Kimbel 1984; Peña- Melian 2000). Small structures can leave large traces, and conversely large structures can leave no imprints at all, depending upon species-specific, as well as individual and local, anatomical conditions. Furthermore, the relationship between cortical morphology and neural districts is diffi- cult to assess, as described for important functional areas PaleoAnthropology 2008: 93−106. © 2008 PaleoAnthropology Society. All rights reserved. ISSN 1545-0031 EMIlIAnO BrunEr Centro Nacional de Investigación sobre la Evolución Humana (CENIEH), Avenida de La Paz 28, 09004 Burgos, SPAIN; [email protected] such as Broca’s cap (Amunts et al. 1999). Nevertheless, fos- sil endocranial casts serve as the basis for paleoneurology, providing the only direct information for investigating variation in the brain morphology of extinct humans. Thus, endocasts must inevitably be a significant part of any study of brain evolution. The applications of shape analysis (Richtsmeier et al. 1992; Rohlf and Marcus 1993; Slice 2004; Zelditch et al. 2004) and computed tomography (Zollikofer et al. 1998; Zollikofer and Ponce de León 2005) to the study of endo- casts deeply improved and enlarged the available paleo- neurological data. Using the tools of digital morphology, the brain in modern Homo sapiens has been hypothesized to show discrete differences in its organisation and structure when compared with non-modern human groups (Bruner et al. 2003). In particular, the parietal areas in modern hu- mans display a definite enlargement, through widening of the superior surfaces and lengthening of the upper profile. The changes in the parietal areas can be related to both neu- rofunctional and structural processes. In terms of cognition, the upper parietal cortex is associated with visuo-spatial in- tegration. In terms of structure, it has been hypothesized that human encephalisation may be characterized by al- lometric constraints at the parieto-occipital boundaries (Bruner 2004a). Similar differences between modern and non-modern neurocranial shapes also have been described, taking into account the ectocranial midsagial profile (Bruner et al. 2004). Although the endocranial morphol- ogy of the earliest modern human groups is not completely known, the separation between modern and non-modern
Transcript of Comparing Endocranial Form and Shape Differences in … · 1981; Holloway et al. 2004), but also...

Comparing Endocranial Form and Shape Differencesin Modern Humans and Neandertals: a Geometric Approach
ABSTRACTPaleoneurology is based on the analysis of the traces left by the brain cortical structures on the endocranial surface of fossil specimens. Although such information is indirect and fragmentary, it may provide useful insights on hu-man brain evolution. Computed tomography and shape analysis deeply improve the toolkit available for paleo-neurological studies. Shape analysis and multivariate approaches suggest that modern humans have undergone a specific evolution of the parietal areas. In this paper the endocranial lateral profiles of two complete specimens (one modern human and one Neandertal) are compared using both form and shape information by means of geometric comparison and coordinate-based maps, integrating superimpositions and Euclidean distance matrix analysis. Using both superimposed (shape) and non-transformed (form) data, the modern endocast is character-ized by a midsagittal enlargement of the parietal and occipito-cerebellar areas, associated with antero-posterior shortening of the fronto-temporal profile. Differences can be quantified and synthesized using simple geometric tools. Modern brain morphology may be the result of both neural changes and structural constraints, in which modularity and integration make the endocranial geometry sensitive to the cranial base dynamics, facial changes, tissue strains, and metabolic/physiological adjustments. Although paleoanthropology often deals with fragments or single specimens, the use of geometrical modelling is a useful and simple tool to standardize, quantify, and describe morphological differences.
INTRoDuCTIoN
The morphogenesis of the neurocranium is the result of a genetic program and the structural interaction between
bone and soft tissues. The vault changes in size mostly in response to brain pressure and growth, while changing in shape under the constraints of connective tensors like the falx cerebri and the tentorium cerebelli (Moss and Young 1960). In contrast, the inferior surfaces of the endocranium display a more complex developmental basis, interact-ing with the cranial base dynamics and morphogenesis of the face (Lieberman et al. 2000; McCarthy 2001; Ross et al. 2004). The brain’s cortical structures contact the endocra-nial wall through the layers of the dura mater, leaving their imprints on the bone surface. This relationship provides the basic framework of paleoneurology, aimed at charac-terizing brain morphology in fossil species (Bruner 2003; Falk 1987; Holloway 1978).
Of course, the absence of evidence is not always evi-dence of absence. Namely, the presence of a trace on the endocranial surface reveals the past existence of a struc-ture, but the absence of imprints cannot prove the absence of the structure itself. Traces of tissue are preserved de-pending upon the pressure on the endocranial table and the thickness of the dura layers (see Kimbel 1984; Peña-Melian 2000). Small structures can leave large traces, and conversely large structures can leave no imprints at all, depending upon species-specific, as well as individual and local, anatomical conditions. Furthermore, the relationship between cortical morphology and neural districts is diffi-cult to assess, as described for important functional areas
PaleoAnthropology 2008: 93−106. © 2008 PaleoAnthropology Society. All rights reserved. ISSN 1545-0031
EMIlIAnO BrunErCentro Nacional de Investigación sobre la Evolución Humana (CENIEH), Avenida de La Paz 28, 09004 Burgos, SPAIN;[email protected]
such as Broca’s cap (Amunts et al. 1999). Nevertheless, fos-sil endocranial casts serve as the basis for paleoneurology, providing the only direct information for investigating variation in the brain morphology of extinct humans. Thus, endocasts must inevitably be a significant part of any study of brain evolution.
The applications of shape analysis (Richtsmeier et al. 1992; Rohlf and Marcus 1993; Slice 2004; Zelditch et al. 2004) and computed tomography (Zollikofer et al. 1998; Zollikofer and Ponce de León 2005) to the study of endo-casts deeply improved and enlarged the available paleo-neurological data. Using the tools of digital morphology, the brain in modern Homo sapiens has been hypothesized to show discrete differences in its organisation and structure when compared with non-modern human groups (Bruner et al. 2003). In particular, the parietal areas in modern hu-mans display a definite enlargement, through widening of the superior surfaces and lengthening of the upper profile. The changes in the parietal areas can be related to both neu-rofunctional and structural processes. In terms of cognition, the upper parietal cortex is associated with visuo-spatial in-tegration. In terms of structure, it has been hypothesized that human encephalisation may be characterized by al-lometric constraints at the parieto-occipital boundaries (Bruner 2004a). Similar differences between modern and non-modern neurocranial shapes also have been described, taking into account the ectocranial midsagittal profile (Bruner et al. 2004). Although the endocranial morphol-ogy of the earliest modern human groups is not completely known, the separation between modern and non-modern
94 • PaleoAnthropology 2008
variations seems discrete, suggesting a certain degree of discontinuity within the anatomical organization.
Particular attention must be paid to the comparison be-tween neandertals and modern humans. These two human morphs have been hypothesized to represent two distinct evolutionary pathways evolving more or less independent-ly, regardless of any hypothetical interbreeding potentiali-ties (e.g., Tattersall and Schwartz 2006). They share similar cranial capacity and overall brain dimensions (Holloway 1981; Holloway et al. 2004), but also differ in some cerebral traits (Bruner et al. 2003; Grimaud-Hervé 1997); as well as neurocranial architecture (Ponce de Leon and Zollikofer 2001). Therefore, this comparison is useful to investigate two different human brain models scaled at the same ce-rebral mass.
This consideration is relevant because a large percent-age of endocranial variation within the human genus is allometric, namely associated with size-dependent rela-tionships of structural and functional networks. The en-cephalisation process has been hypothesized to be largely associated with an allometric component involving widen-ing of the frontal lobes, vertical stretching of the endocrani-al structure, and compression of the upper parietal surface (Bruner 2004a). Because Neandertals and modern humans share the same cranial capacity, specific departures from the Homo allometric trajectory may be identified, which can be interpreted as adaptations (the criterion of subtrac-tion, sensu Gould 1966). Such discrete differences between Neandertals and modern humans have been described us-ing geometric superimposition approaches. These iterative procedures standardize different geometric configurations to make the objects comparable in terms of fixed morpho-logical axes or multivariate statistics (Bookstein et al. 1991; Zelditch et al. 2004). Here I rely upon an absolute geomet-ric comparison of the endocranial profiles, independent of any kind of normalization, in order to display the actual differences between the modern and neandertal morpho-types. This is a particularly useful approach for verifying and describing the differences at the parietal profile, as it integrates and compares the information available using superimposition techniques and relative geometric com-parisons.
MATERIAlS AND METHoDS
SAMPlE AND CoNFIGuRATIoNGenerally, a geometrical “form” may be thought of as the result of size and shape components, where the size is re-lated to the actual dimensions of the object, and the shape is related to its spatial properties, regardless of position, orientation, or scale (see Richstmeier et al. 2002). That is, form and shape can be considered as different morphologi-cal concepts, providing different but complementary infor-mation. This is particularly useful when the importance of allometry and heterochrony are taken into account within evolutionary scenarios (e.g., Gould 1966; Klingenberg 1998; Shea 1992). This operational separation between variation
in dimensions and variation in spatial relationships is cru-cial to studying encephalisation, a process related to rela-tive increases in cranial capacity.
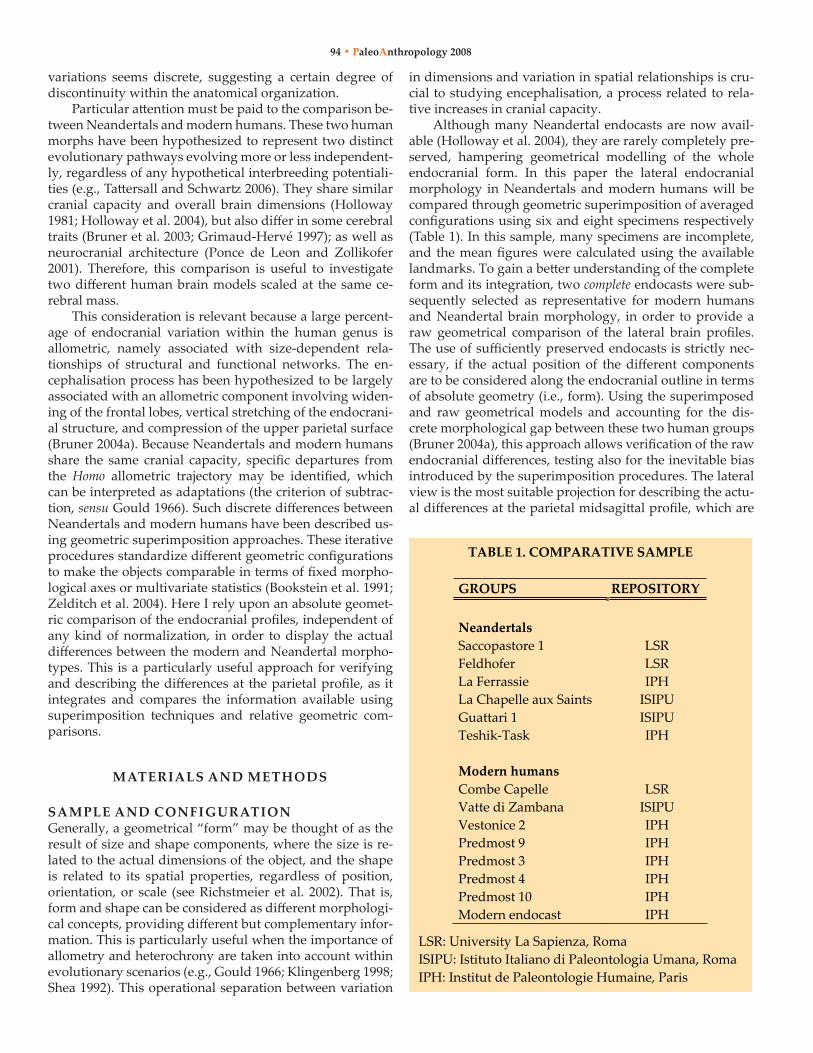
Although many neandertal endocasts are now avail-able (Holloway et al. 2004), they are rarely completely pre-served, hampering geometrical modelling of the whole endocranial form. In this paper the lateral endocranial morphology in neandertals and modern humans will be compared through geometric superimposition of averaged configurations using six and eight specimens respectively (Table 1). In this sample, many specimens are incomplete, and the mean figures were calculated using the available landmarks. To gain a better understanding of the complete form and its integration, two complete endocasts were sub-sequently selected as representative for modern humans and Neandertal brain morphology, in order to provide a raw geometrical comparison of the lateral brain profiles. The use of sufficiently preserved endocasts is strictly nec-essary, if the actual position of the different components are to be considered along the endocranial outline in terms of absolute geometry (i.e., form). Using the superimposed and raw geometrical models and accounting for the dis-crete morphological gap between these two human groups (Bruner 2004a), this approach allows verification of the raw endocranial differences, testing also for the inevitable bias introduced by the superimposition procedures. The lateral view is the most suitable projection for describing the actu-al differences at the parietal midsagittal profile, which are
TABLE 1. COMPARATIVE SAMPLE
GROUPS REPOSITORY
NeandertalsSaccopastore 1 LSRFeldhofer LSRLa Ferrassie IPHLa Chapelle aux Saints ISIPUGuattari 1 ISIPUTeshik Task IPH
Modern humansCombe Capelle LSRVatte di Zambana ISIPUVestonice 2 IPHPredmost 9 IPHPredmost 3 IPHPredmost 4 IPHPredmost 10 IPHModern endocast IPH
LSR: University La Sapienza, RomaISIPU: Istituto Italiano di Paleontologia Umana, RomaIPH: Institut de Paleontologie Humaine, Paris
Endocranial Form and Shape Variation • 95
hypothesized to have undergone interesting changes in the evolution of modern humans.
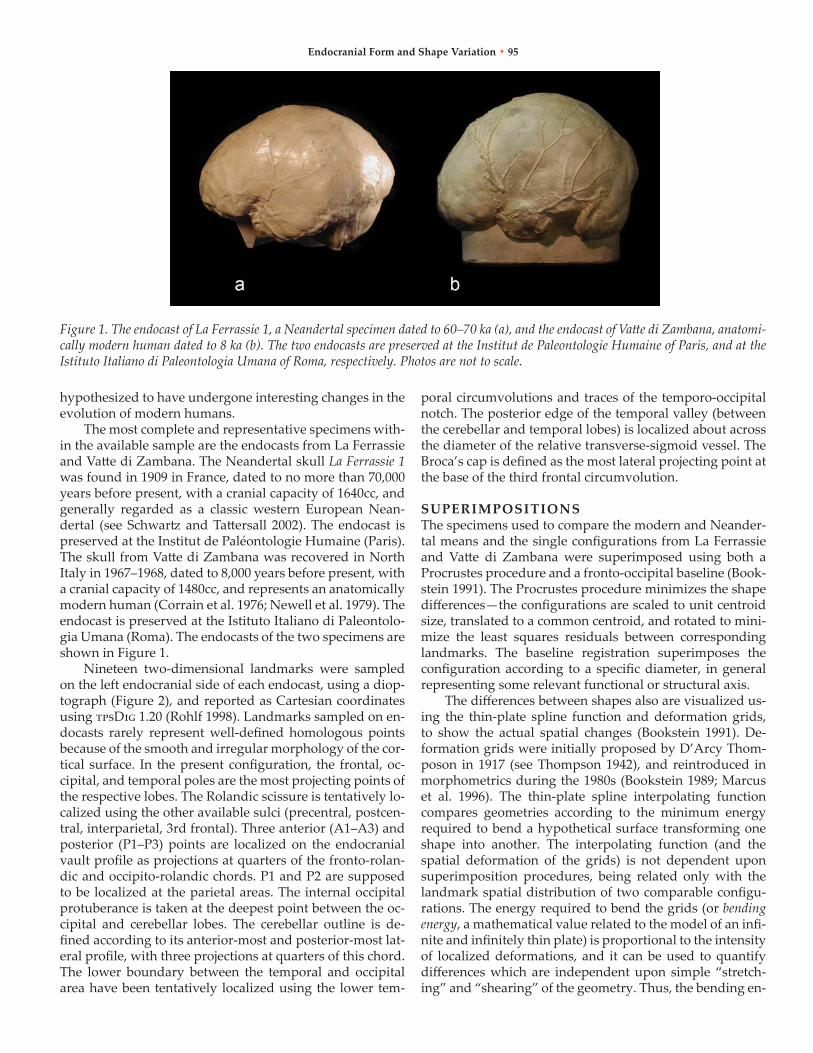
The most complete and representative specimens with-in the available sample are the endocasts from La Ferrassie and Vatte di Zambana. The neandertal skull La Ferrassie 1 was found in 1909 in France, dated to no more than 70,000 years before present, with a cranial capacity of 1640cc, and generally regarded as a classic western European nean-dertal (see Schwartz and Tattersall 2002). The endocast is preserved at the Institut de Paléontologie Humaine (Paris). The skull from Vatte di Zambana was recovered in north Italy in 1967–1968, dated to 8,000 years before present, with a cranial capacity of 1480cc, and represents an anatomically modern human (Corrain et al. 1976; newell et al. 1979). The endocast is preserved at the Istituto Italiano di Paleontolo-gia umana (roma). The endocasts of the two specimens are shown in Figure 1.
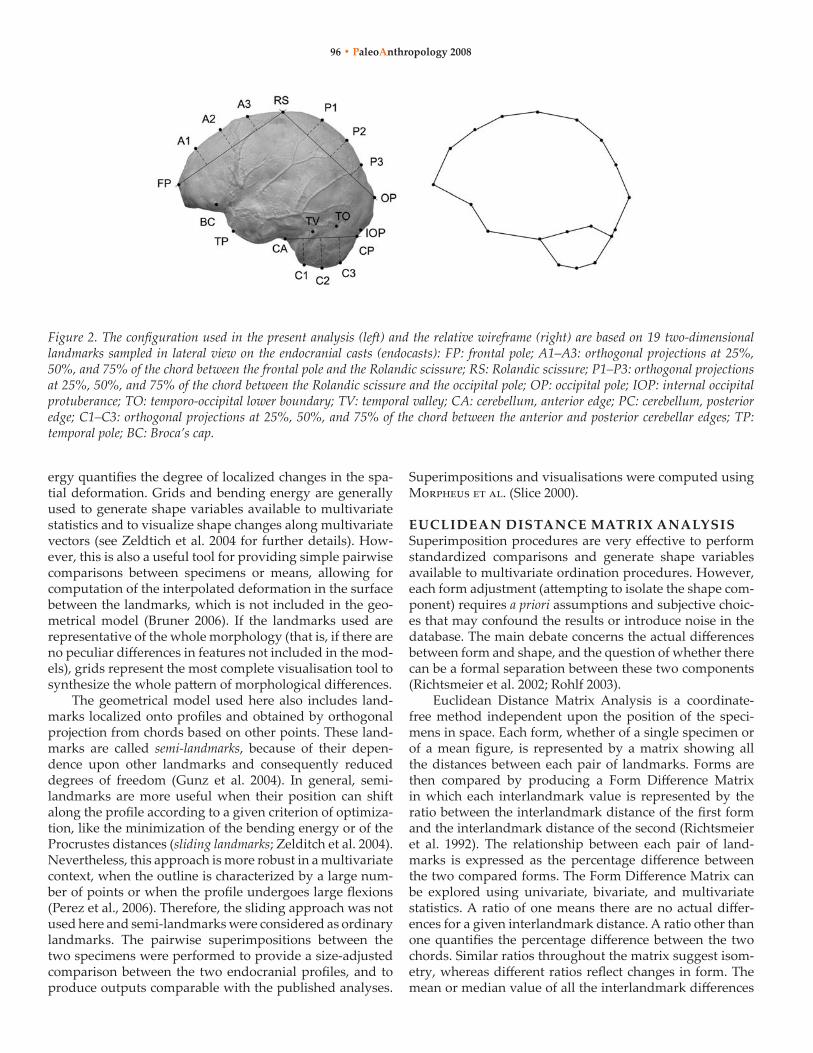
nineteen two-dimensional landmarks were sampled on the left endocranial side of each endocast, using a diop-tograph (Figure 2), and reported as Cartesian coordinates using tpsDig 1.20 (Rohlf 1998). Landmarks sampled on en-docasts rarely represent well-defined homologous points because of the smooth and irregular morphology of the cor-tical surface. In the present configuration, the frontal, oc-cipital, and temporal poles are the most projecting points of the respective lobes. The Rolandic scissure is tentatively lo-calized using the other available sulci (precentral, postcen-tral, interparietal, 3rd frontal). Three anterior (A1–A3) and posterior (P1–P3) points are localized on the endocranial vault profile as projections at quarters of the fronto-rolan-dic and occipito-rolandic chords. P1 and P2 are supposed to be localized at the parietal areas. The internal occipital protuberance is taken at the deepest point between the oc-cipital and cerebellar lobes. The cerebellar outline is de-fined according to its anterior-most and posterior-most lat-eral profile, with three projections at quarters of this chord. The lower boundary between the temporal and occipital area have been tentatively localized using the lower tem-
poral circumvolutions and traces of the temporo-occipital notch. The posterior edge of the temporal valley (between the cerebellar and temporal lobes) is localized about across the diameter of the relative transverse-sigmoid vessel. The Broca’s cap is defined as the most lateral projecting point at the base of the third frontal circumvolution.
SuPERIMPoSITIoNSThe specimens used to compare the modern and Neander-tal means and the single configurations from la Ferrassie and Vatte di Zambana were superimposed using both a Procrustes procedure and a fronto-occipital baseline (Book-stein 1991). The Procrustes procedure minimizes the shape differences—the configurations are scaled to unit centroid size, translated to a common centroid, and rotated to mini-mize the least squares residuals between corresponding landmarks. The baseline registration superimposes the configuration according to a specific diameter, in general representing some relevant functional or structural axis.
The differences between shapes also are visualized us-ing the thin-plate spline function and deformation grids, to show the actual spatial changes (Bookstein 1991). De-formation grids were initially proposed by D’Arcy Thom-poson in 1917 (see Thompson 1942), and reintroduced in morphometrics during the 1980s (Bookstein 1989; Marcus et al. 1996). The thin-plate spline interpolating function compares geometries according to the minimum energy required to bend a hypothetical surface transforming one shape into another. The interpolating function (and the spatial deformation of the grids) is not dependent upon superimposition procedures, being related only with the landmark spatial distribution of two comparable configu-rations. The energy required to bend the grids (or bending energy, a mathematical value related to the model of an infi-nite and infinitely thin plate) is proportional to the intensity of localized deformations, and it can be used to quantify differences which are independent upon simple “stretch-ing” and “shearing” of the geometry. Thus, the bending en-
Figure 1. The endocast of La Ferrassie 1, a Neandertal specimen dated to 60–70 ka (a), and the endocast of Vatte di Zambana, anatomi-cally modern human dated to 8 ka (b). The two endocasts are preserved at the Institut de Paleontologie Humaine of Paris, and at the Istituto Italiano di Paleontologia Umana of Roma, respectively. Photos are not to scale.
96 • PaleoAnthropology 2008
ergy quantifies the degree of localized changes in the spa-tial deformation. Grids and bending energy are generally used to generate shape variables available to multivariate statistics and to visualize shape changes along multivariate vectors (see Zeldtich et al. 2004 for further details). How-ever, this is also a useful tool for providing simple pairwise comparisons between specimens or means, allowing for computation of the interpolated deformation in the surface between the landmarks, which is not included in the geo-metrical model (Bruner 2006). If the landmarks used are representative of the whole morphology (that is, if there are no peculiar differences in features not included in the mod-els), grids represent the most complete visualisation tool to synthesize the whole pattern of morphological differences.
The geometrical model used here also includes land-marks localized onto profiles and obtained by orthogonal projection from chords based on other points. These land-marks are called semi-landmarks, because of their depen-dence upon other landmarks and consequently reduced degrees of freedom (Gunz et al. 2004). In general, semi-landmarks are more useful when their position can shift along the profile according to a given criterion of optimiza-tion, like the minimization of the bending energy or of the Procrustes distances (sliding landmarks; Zelditch et al. 2004). Nevertheless, this approach is more robust in a multivariate context, when the outline is characterized by a large num-ber of points or when the profile undergoes large flexions (Perez et al., 2006). Therefore, the sliding approach was not used here and semi-landmarks were considered as ordinary landmarks. The pairwise superimpositions between the two specimens were performed to provide a size-adjusted comparison between the two endocranial profiles, and to produce outputs comparable with the published analyses.
Superimpositions and visualisations were computed using Morpheus et al. (Slice 2000).
EuClIDEAN DISTANCE MATRIx ANAlySISSuperimposition procedures are very effective to perform standardized comparisons and generate shape variables available to multivariate ordination procedures. However, each form adjustment (attempting to isolate the shape com-ponent) requires a priori assumptions and subjective choic-es that may confound the results or introduce noise in the database. The main debate concerns the actual differences between form and shape, and the question of whether there can be a formal separation between these two components (Richtsmeier et al. 2002; Rohlf 2003).
Euclidean Distance Matrix Analysis is a coordinate-free method independent upon the position of the speci-mens in space. Each form, whether of a single specimen or of a mean figure, is represented by a matrix showing all the distances between each pair of landmarks. Forms are then compared by producing a Form Difference Matrix in which each interlandmark value is represented by the ratio between the interlandmark distance of the first form and the interlandmark distance of the second (Richtsmeier et al. 1992). The relationship between each pair of land-marks is expressed as the percentage difference between the two compared forms. The Form Difference Matrix can be explored using univariate, bivariate, and multivariate statistics. A ratio of one means there are no actual differ-ences for a given interlandmark distance. A ratio other than one quantifies the percentage difference between the two chords. Similar ratios throughout the matrix suggest isom-etry, whereas different ratios reflect changes in form. The mean or median value of all the interlandmark differences
Figure 2. The configuration used in the present analysis (left) and the relative wireframe (right) are based on 19 two-dimensional landmarks sampled in lateral view on the endocranial casts (endocasts): FP: frontal pole; A1–A3: orthogonal projections at 25%, 50%, and 75% of the chord between the frontal pole and the Rolandic scissure; RS: Rolandic scissure; P1–P3: orthogonal projections at 25%, 50%, and 75% of the chord between the Rolandic scissure and the occipital pole; OP: occipital pole; IOP: internal occipital protuberance; TO: temporo-occipital lower boundary; TV: temporal valley; CA: cerebellum, anterior edge; PC: cerebellum, posterior edge; C1–C3: orthogonal projections at 25%, 50%, and 75% of the chord between the anterior and posterior cerebellar edges; TP: temporal pole; BC: Broca’s cap.
Endocranial Form and Shape Variation • 97
represents the average difference in size between the two forms, and the distribution of all the values is a function of the variation in form. This distribution can be useful to localize the most relevant changes (Cole and Richtsmeier, 1998). The diameters primarily influencing the form dif-ferences can be reported directly on images, wireframes, and thin-plate spline deformation grids (e.g., Lieberman et al. 2002), and the average differences at each landmark can be mapped to provide a synthetic view of the spatial differences (Bruner et al. 2005a). In the latter approach, the variation at each landmark can be represented by the aver-age of all the ratios associated with all the distances from the landmarks to the other points, indicating whether the landmark is more or less “shifted away” from the rest of the configuration. This method is generally appropriate when landmarks are organized along a closed profile, as in the present case-study. Accordingly, the landmarks are shown as generally approaching or moving away from the rest of the outline, and this difference can be quantified in terms of percentage of change. These average values can be mapped on two dimensions using functions aimed at describing the changes from one point to another, interpolating the varia-tions along the surface.
using this approach, the differences between the Eu-clidean distance matrix from the endocranial configurations of la Ferrassie 1 and Vatte di Zambana were mapped using both a precise (function inverse to the power of two) and a non-precise (radial basis function through multiquadric interpolation; Carlson and Foley 1991) approach. Precise functions are forced to exactly pass through the value at each point, while non-precise functions are smoothed, and do not necessarily pass through each value. This second ap-proach produces surfaces representing a general trend of the interpolation, and is more appropriate when data are scarce, scattered, or heterogeneously distributed. EDMA was performed using WinEDMA (Cole 2002). Maps were computed using Surfer 7.0 (Golden Software, Inc).
RESulTS
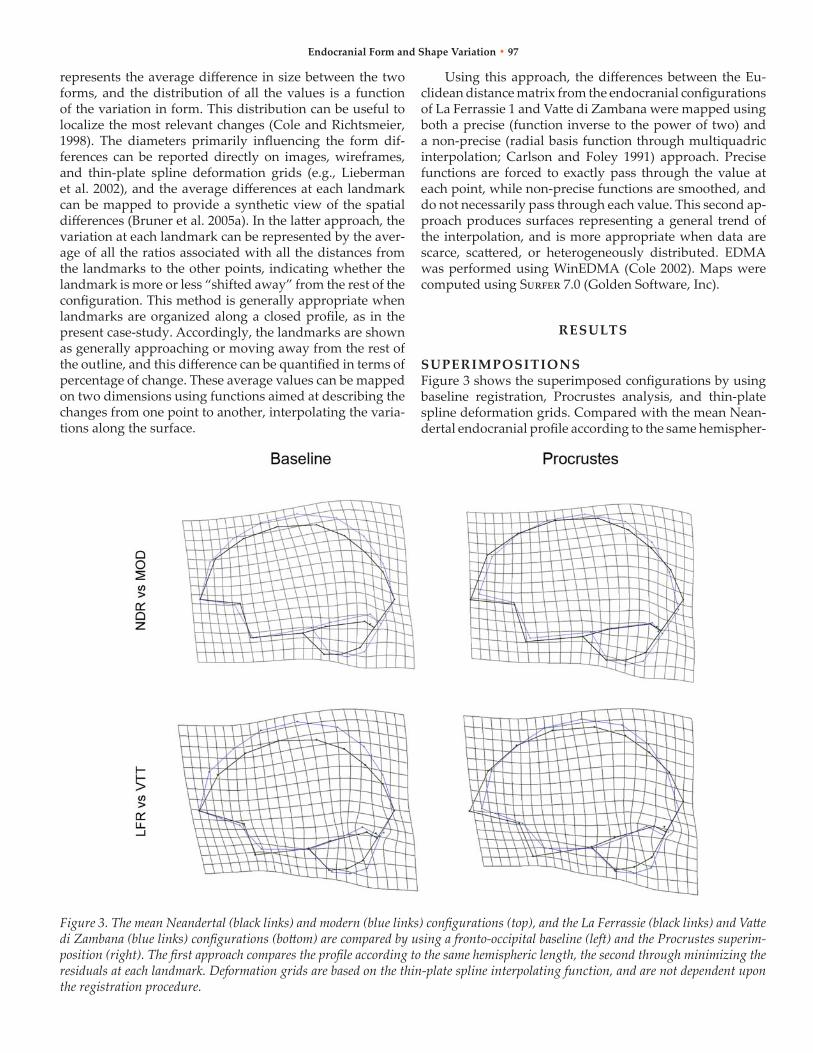
SuPERIMPoSITIoNSFigure 3 shows the superimposed configurations by using baseline registration, Procrustes analysis, and thin-plate spline deformation grids. Compared with the mean nean-dertal endocranial profile according to the same hemispher-
Figure 3. The mean Neandertal (black links) and modern (blue links) configurations (top), and the La Ferrassie (black links) and Vatte di Zambana (blue links) configurations (bottom) are compared by using a fronto-occipital baseline (left) and the Procrustes superim-position (right). The first approach compares the profile according to the same hemispheric length, the second through minimizing the residuals at each landmark. Deformation grids are based on the thin-plate spline interpolating function, and are not dependent upon the registration procedure.
98 • PaleoAnthropology 2008
ic length, the mean modern endocast displays the bulging of the upper outline, more evident at the parietal area. The cerebellum profile is more posterior, and enlarged back-ward. Minimizing the shape differences by using the Pro-crustes superimposition, the relative vault enlargement is definitely distributed at the parietal profile, while the fron-tal and temporal areas display a relative reduction and an-tero-posterior shortening. The occipital profile is flattened, and the posterior cerebellar surface is relatively enlarged. The thin-plate spline grids stress the dilation at the parietal and cerebellar areas and the compression at the temporal pole.
The comparison between Vatte di Zambana (anatomi-cally modern human) and La Ferrassie 1 (Neandertal) showed that the ratio between the centroid size of the mod-ern specimen and that of the Neandertal is 1.03, indicating that the former is 3% larger than the latter. relative to the fronto-occipital axis, the modern endocast shows a relevant vertical enlargement of the fronto-parietal outline, more marked at the parietal area. The temporal pole is shorter, and the cerebellar profile undergoes a vertical posterior stretching. Using the Procrustes superimposition, the en-docast of the modern specimen is relatively shorter, and the vertical brain enlargement is particularly loaded behind the Rolandic area. The deformation grids computed by the thin-plate spline interpolating function suggest bulging of the posterior volumes (parietal, occipital, and cerebellar ar-eas), flexion of the frontal surface, and compression at the temporal pole. The geometrical expansion is particularly evident at the upper parietal outline, and the anteriorward rotation of the cerebellar poles stresses the convolution (globularisation) of the whole endocranial structure.
Considering the pairwise comparison between means and the comparison between the two representative indi-viduals, only minor differences can be detected. In particu-lar, the pattern observed between the two different groups
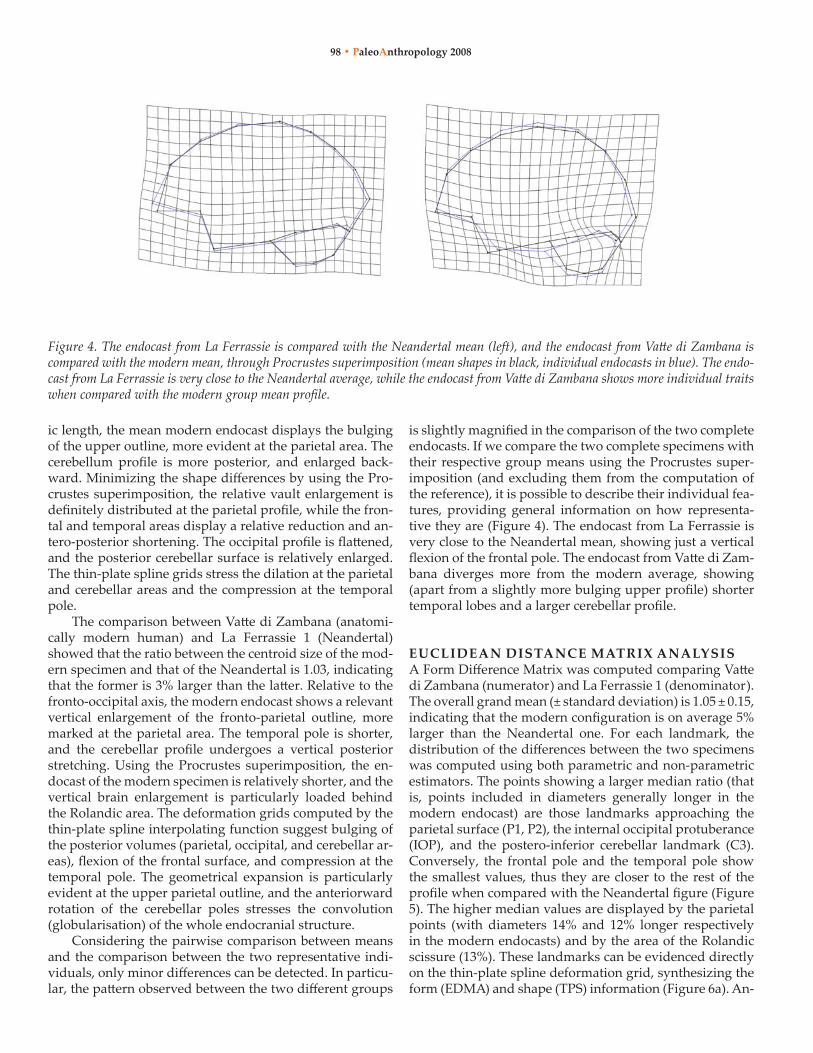
is slightly magnified in the comparison of the two complete endocasts. If we compare the two complete specimens with their respective group means using the Procrustes super-imposition (and excluding them from the computation of the reference), it is possible to describe their individual fea-tures, providing general information on how representa-tive they are (Figure 4). The endocast from La Ferrassie is very close to the neandertal mean, showing just a vertical flexion of the frontal pole. The endocast from Vatte di Zam-bana diverges more from the modern average, showing (apart from a slightly more bulging upper profile) shorter temporal lobes and a larger cerebellar profile.
EuClIDEAN DISTANCE MATRIx ANAlySISA Form Difference Matrix was computed comparing Vatte di Zambana (numerator) and La Ferrassie 1 (denominator). The overall grand mean (± standard deviation) is 1.05 ± 0.15, indicating that the modern configuration is on average 5% larger than the Neandertal one. For each landmark, the distribution of the differences between the two specimens was computed using both parametric and non-parametric estimators. The points showing a larger median ratio (that is, points included in diameters generally longer in the modern endocast) are those landmarks approaching the parietal surface (P1, P2), the internal occipital protuberance (IOP), and the postero-inferior cerebellar landmark (C3). Conversely, the frontal pole and the temporal pole show the smallest values, thus they are closer to the rest of the profile when compared with the neandertal figure (Figure 5). The higher median values are displayed by the parietal points (with diameters 14% and 12% longer respectively in the modern endocasts) and by the area of the Rolandic scissure (13%). These landmarks can be evidenced directly on the thin-plate spline deformation grid, synthesizing the form (EDMA) and shape (TPS) information (Figure 6a). An-
Figure 4. The endocast from La Ferrassie is compared with the Neandertal mean (left), and the endocast from Vatte di Zambana is compared with the modern mean, through Procrustes superimposition (mean shapes in black, individual endocasts in blue). The endo-cast from La Ferrassie is very close to the Neandertal average, while the endocast from Vatte di Zambana shows more individual traits when compared with the modern group mean profile.

Endocranial Form and Shape Variation • 99
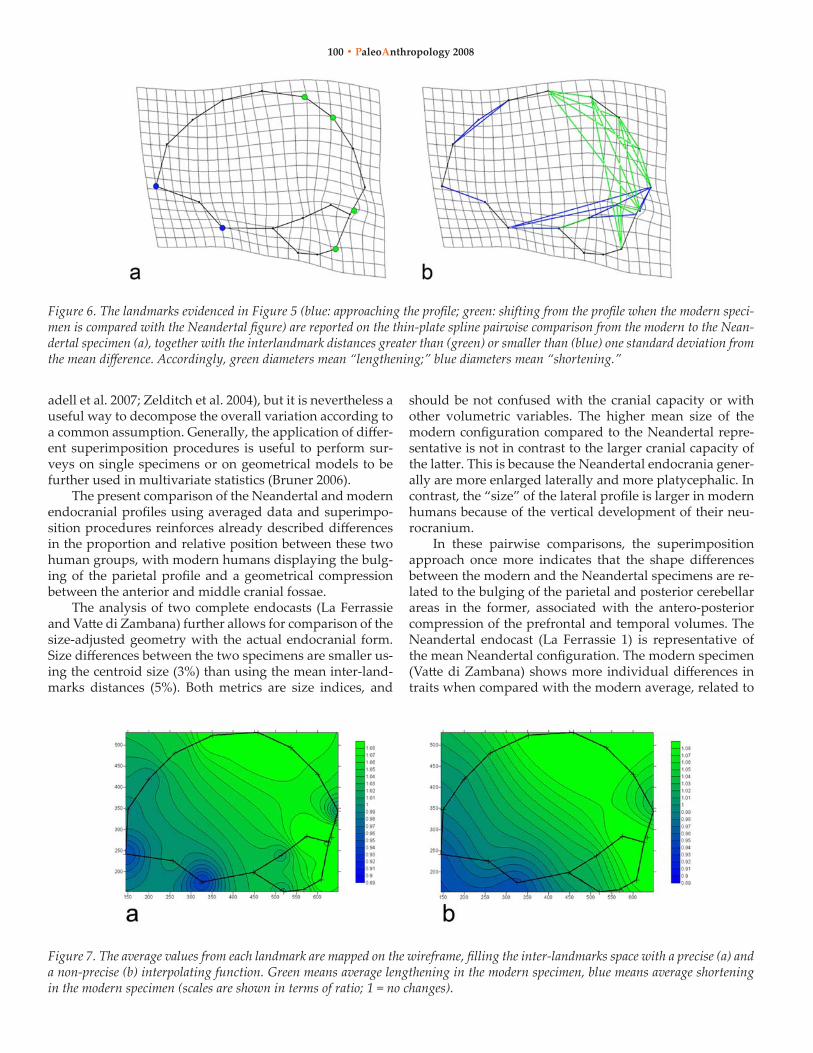
other visualisation approach can associate the deformation grid with those diameters displaying larger/smaller values in the inter-landmark distances comparison (Figure 6b). In the modern endocasts the main actual differences are associated with antero-posterior shortening of the lower hemispheric diameters (temporo-occipital) and the upper frontal surfaces, and vertical lengthening of the posterior volumes (parieto-cerebellar).
Finally, the mean values at each landmark can be mapped by using both precise (Figure 7a) and non-precise (Figure 7b) approaches, as described above. These func-tions take into account the mean values at each point using a chromatic scale to mark areas of average longer/shorter diameters, then using these values to interpolate the dif-ferences along the surface of the geometrical model. This approach is able to synthesize the information of the Form Difference Map, showing the enlargement of the parietal and cerebellar outline (by an average of 8% in the modern specimen), and the antero-posterior gradient of compres-sion at the frontal and temporal poles (by an average of 11% in the modern specimen).
DISCuSSIoN
THE CoMPARISoN oF THE ENDoCRANIAllATERAl PRoFIlEHuman paleoneurology is based largely on fragmented information, due to the paucity of the fossil record and
scarce statistical power, the deformation of fossil remains because of their taphonomic history, and the difficulties in reconstructing accurate endocranial casts. Furthermore, as Weidenreich pointed out at the beginning of the first paleo-neurological inferences (1948), this morphological informa-tion may be scarcely useful to support cognitive and neural hypotheses. However, the anatomy of the endocranium in extinct species is the only direct evidence of brain evolu-tion, and indirect evidence of physiological processes like those involved in the vascular system and metabolism. Taking into account the endocranial differences already described between modern humans and neandertals using geometric morphometrics and superimpositions (Bruner 2004a; Bruner et al. 2003) this paper aims to compare two complete specimens by applying a coordinate-free method accounting for the overall form component.
Different registration procedures (baseline and Pro-crustes) standardize the geometry according to a given criterion, which must be properly evaluated in terms of biological meaning. The baseline procedure compares two forms relative to a functional or structural axis. In the pres-ent case-study, the fronto-occipital baseline represents the major hemispheric axis, accounting for the neurocranial length and antero-posterior brain development. In contrast, the Procrustes registration minimizes the residuals between the two shapes, distributing the differences through all the landmarks. This approach may produce misleading results if differences are actually localized only onto specific points (the so-called “Pinocchio effect;” see von Cramon-Taub-
Figure 5. Median, quartiles, and range (outliers excluded), for each landmark according to the actual increase/decrease of the ratio between modern and Neandertal configuration for all the interlandmark distances. A median value of one means no change in average (the point shows the same mean distance from all the others in the two specimens). A different median value means that the point is more (>1) or less (<1) far from all the other points in the modern specimen than in the Neandertal one. Increasing range means that the points are closer to some areas but farther from others in the modern configuration. The landmarks showing the interquartile distribu-tion higher (in green) and lower (in blue) than the value for isometry (ratio =1) are evidenced. These are the points that most of the others move away from or conversely approach the profile, respectively, when the modern form is compared with the Neandertal one.
100 • PaleoAnthropology 2008
adell et al. 2007; Zelditch et al. 2004), but it is nevertheless a useful way to decompose the overall variation according to a common assumption. Generally, the application of differ-ent superimposition procedures is useful to perform sur-veys on single specimens or on geometrical models to be further used in multivariate statistics (Bruner 2006).
The present comparison of the Neandertal and modern endocranial profiles using averaged data and superimpo-sition procedures reinforces already described differences in the proportion and relative position between these two human groups, with modern humans displaying the bulg-ing of the parietal profile and a geometrical compression between the anterior and middle cranial fossae.
The analysis of two complete endocasts (la Ferrassie and Vatte di Zambana) further allows for comparison of the size-adjusted geometry with the actual endocranial form. Size differences between the two specimens are smaller us-ing the centroid size (3%) than using the mean inter-land-marks distances (5%). Both metrics are size indices, and
should be not confused with the cranial capacity or with other volumetric variables. The higher mean size of the modern configuration compared to the neandertal repre-sentative is not in contrast to the larger cranial capacity of the latter. This is because the neandertal endocrania gener-ally are more enlarged laterally and more platycephalic. In contrast, the “size” of the lateral profile is larger in modern humans because of the vertical development of their neu-rocranium.
In these pairwise comparisons, the superimposition approach once more indicates that the shape differences between the modern and the neandertal specimens are re-lated to the bulging of the parietal and posterior cerebellar areas in the former, associated with the antero-posterior compression of the prefrontal and temporal volumes. The Neandertal endocast (La Ferrassie 1) is representative of the mean neandertal configuration. The modern specimen (Vatte di Zambana) shows more individual differences in traits when compared with the modern average, related to
Figure 6. The landmarks evidenced in Figure 5 (blue: approaching the profile; green: shifting from the profile when the modern speci-men is compared with the Neandertal figure) are reported on the thin-plate spline pairwise comparison from the modern to the Nean-dertal specimen (a), together with the interlandmark distances greater than (green) or smaller than (blue) one standard deviation from the mean difference. Accordingly, green diameters mean “lengthening;” blue diameters mean “shortening.”
Figure 7. The average values from each landmark are mapped on the wireframe, filling the inter-landmarks space with a precise (a) and a non-precise (b) interpolating function. Green means average lengthening in the modern specimen, blue means average shortening in the modern specimen (scales are shown in terms of ratio; 1 = no changes).

Endocranial Form and Shape Variation • 101
shorter temporals and larger cerebellar profiles. nonethe-less, these individual features are similar to those described in the comparison between the two different groups, just slightly magnified. That is, for these characters, this speci-men can be defined as “hyper-modern.” The upper profile, although more bulging than the average modern shape, is still very similar to the mean reference. This consider-ation suggests that the comparison between the individual endocasts is sufficiently representative of the comparison between group means, although the pattern expressed in the temporo-cerebellar areas may be exaggerated. These two endocasts have been selected because they are well-preserved. It is also important to note that the differences evidenced by the superimposition procedures are the same as those already described using three- and two-dimen-sional multivariate approaches on larger samples using less complete configurations (Bruner 2004a; Bruner et al. 2003). Thus, all the major differences described in the neandertal versus modern human shape comparison, including bulg-ing of the parietal outline, increase of the cerebellar height, and antero-posterior shortening of the anterior poles, can be confirmed using these two complete specimens.
As mentioned before, the superimposition procedures show relative changes, and the expansion of a given area may be the result of its enlargement, or conversely, the re-duction of the surrounding structures. In this study, nev-ertheless, the parietal changes, the shortening of the pre-frontal and temporal areas, and the general convolution of the endocranial volume were all shown in the Euclidean Distance Matrix Analysis. This latter approach is based on the direct comparison of the raw diameters, reflecting the actual form differences between configurations. So, what has been described in terms of shape differences can also be seen in form variation. The parietal outline enlarges not only relatively to the overall brain shape, but also in terms of absolute metrics. Accordingly, the parietal bulging is not a relative consequence of variation exerted on other endo-cranial regions, but is a true anatomical change in the un-derlying cortical structures. At the same time, the prefrontal and temporal compressions are related to antero-poste-rior shortening of the endocranial base. The concordance between the size and form approaches prevents bias that could be associated with the assumptions following from the shape composition from one side, or the more limited resolution of the interlandmark analysis from the other. Together, they concur to synthesize the global changes be-tween the two geometric models, and thereby reciprocally support the final interpretation.
STRuCTuRE AND FuNCTIoN IN HuMAN BRAIN EVoluTIoNThe neurocranium and the brain represent a functional morphogenetic and evolutionary unit, and the endocranial bones match the shape and the traits of the cortical struc-tures (Bruner 2007; Richtsmeier et al. 2006). The geometrical information synthesized in the present paper can be useful in developing a hypothetical basic framework to delineate
major trends in the evolution of the modern brain morphol-ogy (Figure 8).
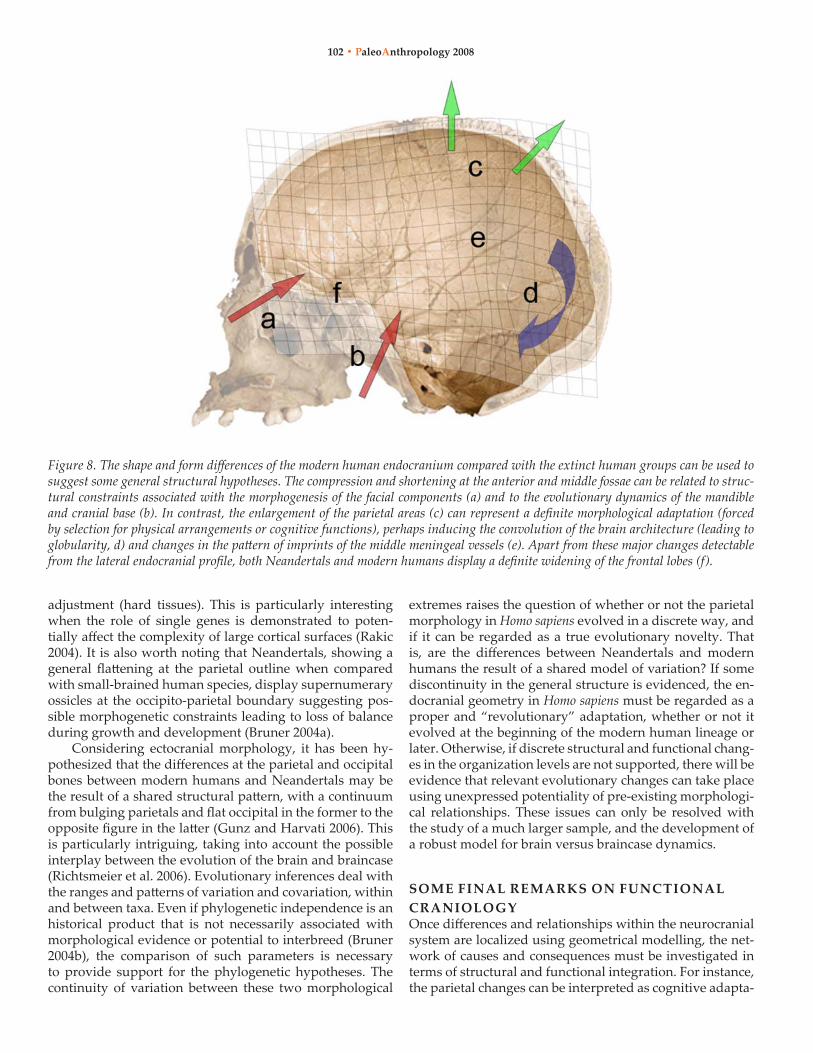
The anterior cranial fossa can be used as a proxy to un-derstand the morphology of the prefrontal cortical areas, and the middle cranial fossa includes parts of the temporal lobes. When compared with neandertals, modern humans display a “geometrical compression” at the anterior and middle cranial fossae, undergoing both a relative and ab-solute shortening. The structures included between these endocranial volumes (cranial base and upper face) must undergo a similar pattern, and it is plausible that the bio-mechanical and functional constraints of these areas are re-sponsible for the final fronto-temporal brain morphology, more than actual neural rearrangements. Concerning the prefrontal areas, their midsagittal profile has not changed remarkably in the last 500,000 years, when compared with the large variation of the ectocranial counterpart (frontal squama, browridge; Bookstein et al. 1999). undoubtedly many phylogenetic differences involve their spatial rela-tionship with underlying facial structures, more than the evolution of the prefrontal neural functions (Bruner and Manzi 2005; Bruner 2007). These differences may have been related also to the large variation of the frontal sinuses de-scribed in the extinct human taxa (Prossinger et al. 2003; Seidler et al. 1997), whose role still is largely debated and ignored. Primarily due to the structural continuity with relevant functional regions like the browridge, the orbits, and the ethmoid complex, the cranial functional matrix may have strongly constrained the vertical development of the prefrontal areas that underwent mostly a latero-lateral enlargement during human evolution (Bruner 2004a). Re-garding the middle fossa, it has been largely shown that their morphology definitely is influenced by the mandibu-lar system (Bastir et al. 2004; Bastir and Rosas 2005). This relationship strongly limits the anatomical evolutionary plasticity of the temporal lobes.
Taking into account the larger independence of cranial base morphogenesis from brain growth and development (Enlow 1990), and the multifactorial network involved in its structural and functional dynamics (Lieberman et al. 2000; McCarthy 2001; Strait 2001), the antero-posterior morpho-logical flattening of the prefrontal and temporal areas de-scribed in this comparison should be related to physical re-arrangements of the skull architecture (hard tissues) more than to actual and direct changes of the neural cortical sur-faces (soft tissues). That is, it is likely that the brain’s cor-tical changes in these areas reflect passive morphological adjustments to the structural and functional network of the surrounding elements (including also constraints exerted by the non-cortical brain structures; Strait 1999).
In contrast, the development of the parietal areas may be regarded as an evolutionary, species-specific change of anatomically modern humans, in which the parietal cortical pressure induces neurocranial changes (Moss and Young 1960) as shown endocranially (Bruner 2004a) or on the ec-tocranial outline (Bruner et al. 2004). That is, changes at the upper endocranial volumes are more probably the result of cortical evolution (soft tissue) and consequent neurocranial
102 • PaleoAnthropology 2008
adjustment (hard tissues). This is particularly interesting when the role of single genes is demonstrated to poten-tially affect the complexity of large cortical surfaces (rakic 2004). It is also worth noting that neandertals, showing a general flattening at the parietal outline when compared with small-brained human species, display supernumerary ossicles at the occipito-parietal boundary suggesting pos-sible morphogenetic constraints leading to loss of balance during growth and development (Bruner 2004a).
Considering ectocranial morphology, it has been hy-pothesized that the differences at the parietal and occipital bones between modern humans and neandertals may be the result of a shared structural pattern, with a continuum from bulging parietals and flat occipital in the former to the opposite figure in the latter (Gunz and Harvati 2006). This is particularly intriguing, taking into account the possible interplay between the evolution of the brain and braincase (richtsmeier et al. 2006). Evolutionary inferences deal with the ranges and patterns of variation and covariation, within and between taxa. Even if phylogenetic independence is an historical product that is not necessarily associated with morphological evidence or potential to interbreed (Bruner 2004b), the comparison of such parameters is necessary to provide support for the phylogenetic hypotheses. The continuity of variation between these two morphological
extremes raises the question of whether or not the parietal morphology in Homo sapiens evolved in a discrete way, and if it can be regarded as a true evolutionary novelty. That is, are the differences between neandertals and modern humans the result of a shared model of variation? If some discontinuity in the general structure is evidenced, the en-docranial geometry in Homo sapiens must be regarded as a proper and “revolutionary” adaptation, whether or not it evolved at the beginning of the modern human lineage or later. Otherwise, if discrete structural and functional chang-es in the organization levels are not supported, there will be evidence that relevant evolutionary changes can take place using unexpressed potentiality of pre-existing morphologi-cal relationships. These issues can only be resolved with the study of a much larger sample, and the development of a robust model for brain versus braincase dynamics.
SoME FINAl REMARkS oN FuNCTIoNAlCRANIoloGyOnce differences and relationships within the neurocranial system are localized using geometrical modelling, the net-work of causes and consequences must be investigated in terms of structural and functional integration. For instance, the parietal changes can be interpreted as cognitive adapta-
Figure 8. The shape and form differences of the modern human endocranium compared with the extinct human groups can be used to suggest some general structural hypotheses. The compression and shortening at the anterior and middle fossae can be related to struc-tural constraints associated with the morphogenesis of the facial components (a) and to the evolutionary dynamics of the mandible and cranial base (b). In contrast, the enlargement of the parietal areas (c) can represent a definite morphological adaptation (forced by selection for physical arrangements or cognitive functions), perhaps inducing the convolution of the brain architecture (leading to globularity, d) and changes in the pattern of imprints of the middle meningeal vessels (e). Apart from these major changes detectable from the lateral endocranial profile, both Neandertals and modern humans display a definite widening of the frontal lobes (f).

Endocranial Form and Shape Variation • 103
tions inducing architectural changes, or conversely as struc-tural neural rearrangements providing new cognitive func-tions. To understand the intimate connection between the structural and functional roles of neurons, it is necessary to consider that the physical organization of the cerebral units also can be interpreted in terms of internal tissue and cytoarchitectonic forces (Hilgetag and Barbas 2005; Toro and Burnod 2005; Van Essen 1997), or as the vector reso-lution of cortical versus non-cortical morphogenesis (Strait 1999). In such a structural network, inferences about cogni-tive changes must be absolutely integrated in a way that acknowledges the influence of these variations on the or-ganization of the brain itself. That is, the hypotheses about endocranial evolution and morphogenesis must necessar-ily take into account the modularity and the connectivity within the neural system (Klingenberg 2002; richtsmeier et al. 2006; Sporns et al. 2004).
Apart from the endocranial neural components, other structural and functional information also may be res-cued from the vascular system, in the form of traces left on the endocranial surface. The meningeal vessels display a marked morphogenetic plasticity, influenced by the neuro-cranial variables (O’Laughlin 1996). At the same time, ves-sels and nerves largely share a physiological and molecular environment (Eichmann et al. 2005). Except for the differ-ences described in the neurocranial geometry, modern hu-mans also display a unique pattern of middle meningeal vessels (Bruner et al. 2005b). These vascular traces are more reticulated, mostly at the parietal surface. This can be re-lated to an increased complexity of the vascular network, or to an increase in the traces left by the soft tissues because of changes in the physical environment (i.e., pressures on the endocranial table exerted by the meningeal layers). In either case, some structural/functional changes at the pari-etal areas can be detected in the modern endocast also by using the meningeal imprints as “fossilized physiological processes,” and further information on the neurocranial dynamics and evolution will be available by improving our knowledge on this topic.
Future efforts could be devoted profitably to a better representation of endocranial morphology. Convention-al homologous landmarks are not easily localized on the smooth geometrical surface of the endocast, this process requires personal experience and a certain amount of ex-trapolation. results must be confirmed by independent studies but, most of all, a large improvement will undoubt-edly result from the application of surface analysis on spe-cific anatomical areas (Gunz et al. 2004). Apart from the paleoneurological implications discussed, this paper also aims to show some simple tools of geometrical modelling in paleoanthropology. Techniques such as geometric mor-phometrics and EDMA are generally used to analyze pat-terns of covariance within morphological systems, generat-ing multivariate spaces available to statistics, ordination of data, and inferential analyses. Of course, this is the princi-pal target of these computational approaches, representing the most important advance in morphometrics. But simpler approaches such as the application of different superimpo-
sition procedures, and the direct comparison of means or specimens, should not always be regarded as simply pre-liminary to the successive multivariate steps. Superimposi-tions and pairwise comparisons also can be quick and easy tools to explore the geometrical properties of morphologi-cal systems, which of course need to be further considered within the more general framework of the covariance pat-terns. If this can be generally true for any morphological survey, it is probably more important in paleoanthropol-ogy, where the paucity and fragmentary nature of the fos-sil specimens often hamper robust statistical approaches. Although the information on single fossils is limited when a more general framework (i.e., multivariate statistics) is not available, such information should not be discarded. In this framework, geometrical models, superimposition procedures, and mapping of functions are tools available to describe the morphological properties of fossil remains in a more objective and analytical way than mere visual in-spection and description of differences.
SuMMARyThe shape comparison of the endocast from extinct and modern humans suggested that the latter evolved a peculiar morphology of the parietal outline, associated with a pro-cess of cerebral convolution leading to their neurocranial globularity. Because shape is just a conceptual component of the overall form, in this paper two complete endocranial casts from one modern and one Neandertal specimen are compared without size-adjustments or registration proce-dures. The two specimens are sufficiently representative of their respective group morphology, with the modern one being even more “modernized” than the group average fig-ure for some basicranial traits. The Euclidean distance ma-trix analysis confirms a definite enlargement of the parietal lateral outline in the modern endocast, and a certain flat-tening and reduction of the frontal and temporal districts. While the former process can be hypothesized to be a direct evolutionary change, the latter can be better interpreted as the result of structural constraints associated with the splanchnocranial and basicranial dynamics. Paleoneurol-ogy deals with very scarce information, biased by the small number of complete or well preserved fossil endocasts, the currently very limited knowledge of the endocranial mor-phogenetic relationship, and the imperfect relationship be-tween morphological variation and neural/cognitive func-tions. Nonetheless, the application of simple geometrical approaches and visualization tools allows one to go a bit further with respect to vague and subjective descriptions.
ACkNowlEDGEMENTSI am grateful to Milford Wolpoff for his constant, critical, and pressing support during the preparation of this paper. The endocasts were sampled thanks to the collaboration of Giorgio Manzi (Istituto Italiano di Paleontologia umana, roma) and Dominique Grimaud-Hervé (Institut de Paléon-tologie Humaine, Paris). I thank Dennis Slice and Paul
104 • PaleoAnthropology 2008
O’Higgins for the many cues on the superimposition pro-cedures. Kristen Munnelly and Caroline VanSickle kindly revised the text of the paper. This work is supported by the Istituto Italiano di Antropologia (www.isita-org.com).
REFERENCES Amunts, K., Schleicher, A., Burgel, U., Mohlberg, H.,
Uylings, H.B.M., and Zilles, K. 1999. Broca’s region revisited: cytoarchitecture and intersubject variability. Journal of Comparative Neurology 412, 319–341.
Bookstein, F.l. 1989. Principal warps: thin-plate spline and the decomposition of deformations. I.E.E.E. Transaction on Pattern Analysis and Machine Intelligence 11, 567–585.
Bookstein, F.L. 1991. Morphometric tools for landmark data. Cambridge University Press, Cambridge
Bookstein, F., Schafer, K., Prossinger, H., Seidler, H., Fie-der, M., Stringer, C., Weber, G.W., Arsuaga, J.l., Slice, D.E., rohlf, F.J., recheis, W., Mariam, A.J., and Marcus, l.F. 1999. Comparing frontal cranial profiles in archaic and modern Homo by morphometric analysis. Anatomi-cal Record The New Anatomist 257, 217–224.
Bastir, M. and Rosas, A. 2005. Hierarchical nature of mor-phological integration and modularity in the human posterior face. American Journal of Physical Anthropology 128, 26–34.
Bastir, M. and rosas, A. 2006. Correlated variation between the lateral basicranium and the face: a geometric mor-phometric study in different human groups. Arc. Oral Biol. 51, 814–824.
Bastir, M., Rosas, A., and Kuroe, K. 2004. Petrosal orienta-tion and mandibular ramus breadth: evidence for an integrated petroso-mandibular developmental unit. American Journal of Physical Anthropology 123, 340–350.
Bruner, E. 2003. Fossil traces of the human thought: paleo-neurology and the evolution of the genus Homo. Riv. Antropol. 81, 29–56.
Bruner, E. 2004a. Geometric morphometrics and paleoneu-rology: brain shape evolution in the genus Homo. Jour-nal of Human Evolution 47, 279–303.
Bruner, E. 2004b. Evolution, actuality and species concept: a need for a paleontological tool. Human Evolution 19, 93–112.
Bruner, E. 2006. From Verheyen to Bookstein: history of colobids and superimpositions. Journal of Anthropologi-cal Sciences 84, 147–160.
Bruner, E. 2007. Cranial shape and size variation in hu-man evolution: structural and functional perspectives. Child’s Nervous Systen 23, 1357–1365.
Bruner, E. and Manzi, G. 2005. CT-based description and phyletic evaluation of the archaic human calvarium from Ceprano, Italy. Anatomical Record 285A, 643–658.
Bruner, E., Manzi, G., and Arsuaga, J.l. 2003. Encephali-Encephali-zation and allometric trajectories in the genus Homo: evidence from the Neandertal and modern lineages. Proceedings of the National Academy of Sciences USA 100, 15335–15340.
Bruner, E., Saracino, B., Passarello, P., Ricci, F., Tafuri, M., and Manzi, G. 2004. Midsagittal cranial shape variationMidsagittal cranial shape variation in the genus Homo by geometric morphometrics. Col-legium Antropologicum 28, 99–112.
Bruner, E., Costantini, D., Fanfani, A, and dell’Omo., G. 2005a. Morphological variation and sexual dimorphism of the cephalic scales in Lacerta bilineata. Acta Zoologica 86, 245–254.
Bruner, E., Mantini, S., Perna, A., Maffei, C., and Manzi, G. 2005b. Fractal dimension of the middle meningeal vessels: variation and evolution in Homo erectus, Nean-derthals, and modern humans. European Journal of Mor-phology 42, 217–224.
Carlson, R.E. and Foley, T.A. 1991. The parameter R2 in mul-tiquadric interpolation. Comp. Math. Applic. 21, 29–42.
Cole, T.M., III 2002. WinEDMA: Software for Euclidean Dis-tance Matrix Analysis, Version 1.0.1 beta, University of Missouri, Kansas City School of Medicine, Kansas City.
Cole, T. M., III and richtsmeier, J. T. 1998. A simple method for visualization of influential landmarks when using Euclidean Distance Matrix Analysis. American Journal of Physical Anthropology 107, 273–283.
Corrain, C., Graziati, G., and Leonardi, P. 1976. La sepoltura epipaleolitica nel riparo di Vatte di Zambana (Trento). Preistoria Alpina 12, 175–212.
Enlow, D.H. 1990. Facial Growth. WB Saunders Company, Philadelphia.
Falk, D. 1987. Hominid paleoneurology. Annual Review of Anthropology 16, 13–30.
Gould, S.J. 1966. Allometry and size in ontogeny and phy-logeny. Biological Review 41, 587–640.
Grimaud-Hervè, D. 1997. L’évolution de l’enchéphale chez Homo erectus et Homo sapiens. CNRS Editions, Paris.
Gunz, P. and Harvati, K. 2007. The Neanderthal “chignon:” variation, integration, and homology. Journal of Human Evolution 52, 262–274.
Gunz, P., Mitteroecker, P., and Bookstein, Fl. 2004. Semi-landmarks in three dimensions. In (D.E. Slice, ed.) Modern morphometrics in physical anthropology, pp 73–98. Kluwer Academic – Plenum Publishers: new York.
Eichmann, A., Le Noble, F., Autiero, M., and Carmeliet, P. 2005. Guidance of vascular and neural network forma-tion. Current Opinion in Neurobiology 15, 108–115
Hilgetag, C.C. and Barbas, H. 2005. Developmental me-chanics of the primate cerebral cortex. Anatomy and. Embryology 210, 411–417.
Holloway, r.l. 1978. The relevance of endocasts for study-ing primate brain evolution. In (C.r. noback, ed.), Sensory Systems of Primates, pp. 181–200. Plenum Press, new York.
Holloway, r.l. 1981. Volumetric and asymmetry determi-nations on recent hominid endocasts: Spy I and Spy II, Djebel Ihroud I, and the Salé Homo erectus specimen. With some notes on neandertal brain size. American Journal of Physical Anthropology 55, 385–393.
Holloway, r.l., Broadfield, D.C., and Yuan, M.S. 2004. Brain endocasts: The paleoneurological evidence. The

Endocranial Form and Shape Variation • 105
Human fossil record (Vol III). Wiley-liss, Hoboken, new Jersey.
Kimbel, W.H. 1984. Variation in the pattern of cranial ve-nous sinuses and hominid phylogeny. American Journal of Physical Anthropology 63, 243–263.
Klingenberg, C.P. 1998. Heterochrony and allometry: the analysis of evolutionary change in ontogeny. Biologi-cal Reviews of the Cambridge Philosophical Society 73, 79–123.
Klingenberg, C.P. 2002. Morphometrics and the role of the phenotype in studies of the evolution of developmen-tal mechanisms. Gene 287, 3–10.
lieberman, D.E., ross, C.F., and ravosa, M.J. 2000. The pri-mate cranial base: ontogeny, function, and integration. Yearbook of Physical Anthropology 43, 117–169.
lieberman, D.E., McBratney, B.M., and Krovitz, G. 2002. The evolution and development of cranial form in Homo sapiens. Proceedings of the National Academy of Sci-ences USA 99, 1134–9.
Marcus, l.F., Corti, M., loy, A., naylor, G.J.P., and Slice, D.E. 1996. Advances in morphometrics. Plenum Press, new York.
McCarthy, R.C. 2001. Anthropoid cranial base architecture and scaling relationships. Journal of Human Evolution 40, 41–66.
Moss, M.l. and Young, r.W. 1960. A functional approach to craniology. American Journal of Physical Anthropology 18, 281–292.
newell, r.r., Constandse-Westermann, T.S., and Meikle-john, C. 1979. The skeletal remains of mesolithic man in western Europe: an evaluative catalogue. Journal of Human Evolution 8.
O’Laughlin, V. 1996. Comparative endocranial vascular changes due to craniosynostosis and artificial cranial deformation. American Journal of Physical Anthropology 101, 369–385.
Peña-Melian, A. 2000. Development of human brain. Hu-man Evolution 15, 99–112.
Perez, S.I., Bernal, V., and Gonzalez, P.n. 2006. Differences between sliding semi-landmark method in geometric morphometrics, with an application to human cra-niofacial and dental variation. Journal of Anatomy 208, 769–784.
Ponce de Leòn, M.S. and Zollikofer, C.P.E. 2001. Neander-thal cranial ontogeny and its implications for late hom-inid diversity. Nature 412, 534–538.
Prossinger, H., Seidler, H., Wicke, l., Weaver, D., recheis, W., Stringer, C., and Muller, G.B. 2003. Electronic re-moval of encrustation inside the Steinheim cranium reveals paranasal sinus features and deformations, and provides a revised endocranial volume estimate. Ana-tomical Record The New Anatomist 273B, 132–142.
Rakic, P. 2004. Genetic control of cortical convolutions. Sci-ence 303, 1983–1984.
richtsmeier, J.T., Cheverud, J.M., and lele, S. 1992. Advanc-es in anthropological morphometrics. Annual Review of Anthropology 21, 283–305.
richtsmeier, J.T., Deleon, V.B., and lele, S.r. 2002. The
promise of geometric morphometrics. Yearbook of Physi-cal Anthropology 45, 63–91.
richtsmeier, J.T., Aldridge, K., de leon, V.B., Panchal, J., Kane, A.A., Marsh, J.l., Yan, P., and Cole, T.M. 2006. Phenotypic integration of neurocranium and brain. Journal of Experimental Zoology. Part B. Molecular and Developmental Evolution 306B, 360–378.
rohlf, F.J. 1998. tpsDig 1.2. Ecology and Evolution, SUNY at Stony Brook, NY.
rohlf, F.J. 2003. Bias and error in estimates of mean shape in geometric morphometrics. Journal of Human Evolu-tion 44, 665–683.
rohlf, F.J. and Marcus, l.F. 1993. A revolution in morpho-metrics. Trends in Ecology and Evolution 8, 129–132.
ross, C., Henneberg, M., ravosa, M.J, and richard, S. 2004. Curvilinear geometric and phylogenetic modeling of basicranial flexion: is it adaptive is it constrained? Jour-nal of Human Evolution 46, 185–213.
Schwartz, J.H. and Tattersall, I. 2002. The Human Fossil Re-cord. Volume One. Wiley-liss, new York.
Seidler, H., Falk, D., Stringer, C., Wilfing, H., Muller, G.B., Zur nedden, D., Weber, G.W., reicheis, W., and Ar-suaga, J.l. 1997. A comparative study of stereolitho-graphically modelled skulls of Petralona and Broken Hill: implications for future studies of Middle Pleisto-cene hominid evolution. Journal of Human Evolution 33, 691–703.
Shea, B.T. 1992. Developmental perspective on size change and allometry in evolution. Evolutionary Anthropology 1, 125–134.
Slice, D.E. 2000. Morpheus et al. Ecology and Evolution, SUNY at Stony Brook, NY.
Slice, D.E. 2004. Modern morphometrics in physical anthropolo-gy. Kluwer Academic – Plenum Publishers, new York.
Sporns, O., Chialvo, D.r., Kaiser, M., and Hilgetag, C.C. 2004. Organization, development and function of com-plex brain networks. Trends in Cognitive Neurosciences 8, 418–425.
Strait, D.S. 1999. The scaling of basicranial flexion and length. Journal of Human Evolution 37, 701–719.
Strait, D.S. 2001. Integration, phylogeny, and the hominid cranial base. American Journal of Physical Anthropology 114, 273–297.
Tattersall, I. and Schwartz, J.H. 2006. The distinctiveness and systematic context of Homo neanderthalensis. In (K. Harvati, K. and T. Harrison, eds.) Neanderthals revisited: new approaches and perspectives, pp. 9–22. Springer, new York.
Toro, R. and Burnod, Y. 2005. A morphogenetic model for the development of cortical convolutions. Cerebral Cor-tex 15, 1900–1913.
Van Essen, D.C. 1997. A tension-based theory of morpho-genesis and compact wiring in the central nervous sys-tem. Nature 385, 313–318.
Von Cramon-Taubadell, N., Frazier, B.C., and Mirazon-Lahr, M. 2007. The problem of assessing landmark er-ror in geometric morphometrics: theory, methods, and modifications. American Journal of Physical Anthropology

106 • PaleoAnthropology 2008
134, 24–35.Weidenreich, F. 1948. The human brain in the light of its
phylogenetic development. Scientific Monthly 67, 103–109.
Zelditch, M.l., Swidersky, D.l., Sheets, H.D., and Fink, W.l. 2004. Geometric morphometrics for biologists. Else-vier, San Diego.
Zollikofer, C.P.E., and Ponce de León, M.S. 2005. Virtual reconstruction: a primer in computer-assisted paleontology and biomedicine. Wiley-liss, new York.
Zollikofer, C.P.E., Ponce de león, M.S., and Martin, r.D. 1998. Computer assisted paleoanthropology. Evolution-ary Anthropology 6, 41–54.