Comparing ECLOUD Simulation Results to 2.1 and 5.3 GeV
12
Comparing ECLOUD Simulation Results to 2.1 and 5.3 GeV Positron Shielded Pickup Data Ryan P. Badman Department of Physics, Syracuse University, Syracuse, NY, 13210 (Dated: August 12, 2011) The CesrTA group researches the mitigation of the electron cloud in the Cornell synchrotron beam pipe by taking measurements of the cloud density and cloud effects on the beam. Various simulation programs are then used to try to study the physics behind cloud formation and beam quality at different cloud densities. The results presented here are from the ECLOUD program and concentrate on matching data from witness bunch scans that studied the relative cloud density at different bunch spacings to measure cloud decay over time. After many simulations runs, parameters were found for both 2.1 and 5.3 GeV at 5 mA per bunch that successfully caused agreement between simulation and data and the values for these parameters will be given below. Upper and lower bounds were also found for the SEMAX parameter in the secondary energy distribution, and the secondary energy distribution was optimized to cause better agreement between peak shapes in the simulation and data. I. INTRODUCTION Electron clouds are an important phenomenon to study in circular particle accelerators such as the LHC, the Cornell synchrotron, and the damping ring for the ILC. Low energy background electrons are normally present in high energy accelerators and are often not detrimental to beam performance, but certain operation conditions cause them to interact strongly with the beam, as was first observed in the 1980s in positron storage rings [1]. The generation and amplification of the electron cloud is caused by ionization of residual gas in the vacuum chamber and irradiation of the chamber wall by synchrotron radiation [1]. Multipacting is when electrons are accelerated by the electric field created by the beam to a high enough energy that they produce more than one secondary electron per collision with the vacuum chamber wall on average, leading to a large cloud buildup [2]. These clouds can have many detrimental effects on the beam performance, including beam degradation and tune shift. Electron clouds have also caused the degradation of BPM signals and feedback pick-ups, a problem that can be partially solved by higher frequency data processing or the use of solenoids [3]. Proton and positron beams are more vulnerable to cloud effects than electron beams because of Coulomb attraction due to opposite charge. The cloud can be mitigated by changing vacuum chamber surface roughness such as by adding a sawtooth pattern on the chamber wall, coating the chamber with materials such as titanium nitride as used in this study, or by applying a solenoidal field [4]. A 1 micron thick coating of TiN is enough to reduce multipacting in the vacuum chamber because of the material’s low secondary yield, and a solenoidal field of about 50 G keeps electrons near the wall to avoid interactions with the beam [2]. Primary electrons are produced on the wall from synchrotron radiation and then go through three different types of processes, producing secondary electrons known as either true secondaries, elastically reflected electrons, or rediffused electrons. When electrons col-
Transcript of Comparing ECLOUD Simulation Results to 2.1 and 5.3 GeV

Comparing ECLOUD Simulation Results to 2.1 and 5.3 GeV
Positron Shielded Pickup Data
Ryan P. BadmanDepartment of Physics, Syracuse University, Syracuse, NY, 13210
(Dated: August 12, 2011)
The CesrTA group researches the mitigation of the electron cloud in the Cornell
synchrotron beam pipe by taking measurements of the cloud density and cloud effects
on the beam. Various simulation programs are then used to try to study the physics
behind cloud formation and beam quality at different cloud densities. The results
presented here are from the ECLOUD program and concentrate on matching data
from witness bunch scans that studied the relative cloud density at different bunch
spacings to measure cloud decay over time. After many simulations runs, parameters
were found for both 2.1 and 5.3 GeV at 5 mA per bunch that successfully caused
agreement between simulation and data and the values for these parameters will be
given below. Upper and lower bounds were also found for the SEMAX parameter
in the secondary energy distribution, and the secondary energy distribution was
optimized to cause better agreement between peak shapes in the simulation and
data.
I. INTRODUCTION
Electron clouds are an important phenomenon to study in circular particle acceleratorssuch as the LHC, the Cornell synchrotron, and the damping ring for the ILC. Low energybackground electrons are normally present in high energy accelerators and are often notdetrimental to beam performance, but certain operation conditions cause them to interactstrongly with the beam, as was first observed in the 1980s in positron storage rings [1]. Thegeneration and amplification of the electron cloud is caused by ionization of residual gasin the vacuum chamber and irradiation of the chamber wall by synchrotron radiation [1].Multipacting is when electrons are accelerated by the electric field created by the beam to ahigh enough energy that they produce more than one secondary electron per collision withthe vacuum chamber wall on average, leading to a large cloud buildup [2]. These clouds canhave many detrimental effects on the beam performance, including beam degradation andtune shift. Electron clouds have also caused the degradation of BPM signals and feedbackpick-ups, a problem that can be partially solved by higher frequency data processing or theuse of solenoids [3]. Proton and positron beams are more vulnerable to cloud effects thanelectron beams because of Coulomb attraction due to opposite charge. The cloud can bemitigated by changing vacuum chamber surface roughness such as by adding a sawtoothpattern on the chamber wall, coating the chamber with materials such as titanium nitrideas used in this study, or by applying a solenoidal field [4]. A 1 micron thick coating ofTiN is enough to reduce multipacting in the vacuum chamber because of the material’s lowsecondary yield, and a solenoidal field of about 50 G keeps electrons near the wall to avoidinteractions with the beam [2].
Primary electrons are produced on the wall from synchrotron radiation and then gothrough three different types of processes, producing secondary electrons known as eithertrue secondaries, elastically reflected electrons, or rediffused electrons. When electrons col-

2
lide with the vacuum chamber wall, a certain fraction scatters back elastically (the elasticsecondaries), another fraction interact with atoms inside the wall material and are scatteredback out (the rediffused secondaries), and the remainder of the electrons interact throughcomplex processes with the chamber wall (the true secondary electrons) [5]. The followingfigure taken from [5] displays how each of the three secondary components contribute foran incident electron beam with 300 eV of energy. Fig. 1 shows that the the low energysecondary electrons are dominated by true secondaries, and higher energies are prevalentlyrediffused and elastic.
FIG. 1: This plot taken from Furman and Pivi’s paper graphs the measured secondary electron
energy spectrum for a stainless steel sample to show the contribution from each secondary energy
component. The true secondary yield for this plot was 1.17, the rediffused yield was 0.75 and the
elastic yield was 0.12. It is worth noting that the true secondary energies used in [5] go up to 50
eV, which is much higher than seen in the ECLOUD code.
II. MEASUREMENTS
The Cornell Electron Storage Ring Test Accelerator (CesrTA) group focuses on electroncloud build up studies and experimenting with mitigation techniques in custom vacuumchambers. This paper’s study focuses particularly on two 1.1 m sections located symmet-rically in the east and west regions of the storage ring. For summer 2011, the vacuumchamber in the west has been coated in titanium nitride which corresponds to the dataused in this study, while the east is coated in a carbon material. Cloud development in thecustom chambers is studied using retarding field analyzers (RFA) and two pairs of shieldedpickups which are shielded against the signal directly induced by the beam. The RFA isan integrating device that transmits electrons with energy greater than the retarding gridvoltage. The shielded pickups were installed in 2010 and have successfully given a widerange of time-resolved measurements of signals from cloud electrons. Each pickup port hasan 18 mm diameter pattern of 169 0.76 mm-diameter holes set up in concentric circles, andthe center of the pickup buttons are -14, 0, and 14 mm from the horizontal center of thechamber [4]. Fig. 2 depicts one of the custom vacuum chambers and two pairs of shieldedbuttons arranged parallel and perpendicular to the beam direction. Fig. 3 is a cross sectionof this vacuum chamber, displaying how the shielded pickup buttons cover the beam pipe

3
ceiling and the attached electrons and instruments that take measurements. Fig. 4 is azoomed-in image of one these shielded pickups with a rough sketch of electron collection.Fig. 4 also displays a zoomed-in image of the hole pattern in the vacuum chamber wall thatblocks out the beam signal.
FIG. 2: Custom vacuum chamber with shielded pickups and RFA port [4].
FIG. 3: Vacuum chamber cross section showing three of four shielded pickups and the attached
electronics.
Our group concentrates on three types of data sets to study different aspects of the cloud.In current scans, higher beam currents giver larger momentum kicks to cloud electrons. Apositron beam pulls floor electrons up into the shielded pickups, while an electron beampushes electrons above the beam line. Since the button signal arrival time depends on bothbeam kick strength and intrinsic photoelectron energy, different beam kick strengths areused to distinguish the two contributions to the cloud kinetic energy. In solenoid scans,varying the solenoidal field through the beam pipe and observing which buttons receive asignal is used to determine the energy of electrons, because higher energy electrons producedon the wall will reach a shielded pickup that is farther away from the original productionpoint on the beam pipe wall. Witness bunch scans use one leading bunch, and then onewitness bunch at various delay times to study cloud decay over a period of time. The decaytime of the cloud was found to be on the order of 100 ns, but it varied with the elastic yieldvalue.

4
FIG. 4: A close-up of one of the shielded pick-up buttons.
The collecting electrode in the shielded pickup attracts and removes electrons from thecloud. It has been calculated that the total number of electrons that are trapped in theshielded pickup button is negligible compared to the total number of cloud electrons in avacuum chamber region. Thus the shielded pickups are not causing the cloud to be reducedsignificantly enough to affect the measurements being taken.
This study focused on electron and positron beams of 2.1 and 5.3 GeV beam energy, abunch spacing of 14 ns, and a bias voltage of +50 V to prevent contributions to the signalfrom low energy secondaries escaping the shielded pickup, thus allowing the detector to besensitive to these low kinetic energy cloud electrons [4]. The data used to compare to thesimulation were from the June 2011 runs which I was personally able to take in the controlroom with James Crittenden and John Sikora on June 11 and 18, 2011. The data wascomprised of witness bunch scans, two bunch current scans of 1, 2, 3, 5, 8 and 10 mA perbunch, and one bunch solenoid scans from -40 to 40 G at 1, 2, 4, and 8 mA per bunch.A 1 mA bunch current is equivalent to a bunch population of 1.6E10 electrons. I ran thesolenoid simulation for both positron and electron bunches, and the electron beam simulationfor current and witness bunch scans, but these were not finished being investigated by theend of my work period and thus are not included in this paper.
III. THE ECLOUD CODE
The program ECLOUD was used in this study to simulate electron cloud build up overthe course of a bunch train, and can be set to either positron or electron bunches. As anoverview, ECLOUD generates photoelectrons, performs the time sliced kinematics of theseelectrons, and then creates a detailed model of the secondary electron distribution for thewall.
ECLOUD was written in 1997 and differed from the previously used POSINST code insome details, such as not conserving macroparticle charge. ECLOUD’s initial successes in-clude predicting the electron cloud buildup that would be measured at the LHC storagerings and at PEP-II and KEKB. The cloud in these facilities caused tune shift in the lead-ing bunches of particle trains, emittance growth, bunch instabilities, a reduction of specificluminosity, and degradation of various beam diagnostic signals [2]. ECLOUD was initially
5
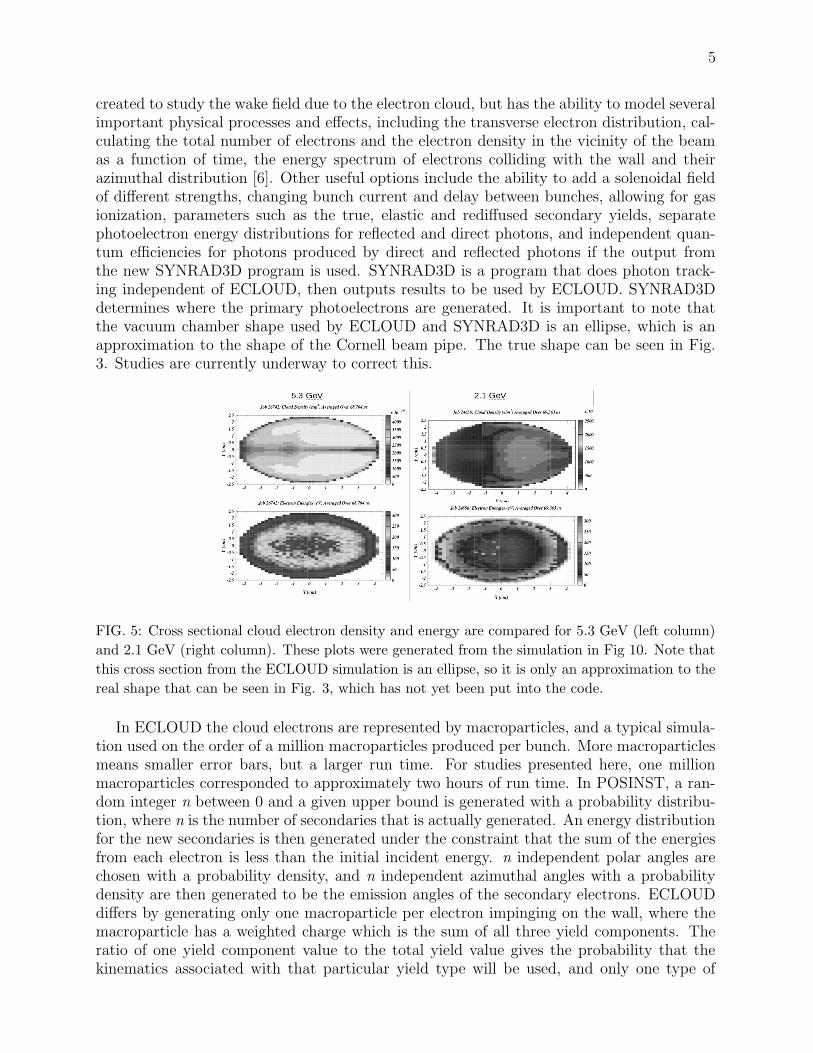
created to study the wake field due to the electron cloud, but has the ability to model severalimportant physical processes and effects, including the transverse electron distribution, cal-culating the total number of electrons and the electron density in the vicinity of the beamas a function of time, the energy spectrum of electrons colliding with the wall and theirazimuthal distribution [6]. Other useful options include the ability to add a solenoidal fieldof different strengths, changing bunch current and delay between bunches, allowing for gasionization, parameters such as the true, elastic and rediffused secondary yields, separatephotoelectron energy distributions for reflected and direct photons, and independent quan-tum efficiencies for photons produced by direct and reflected photons if the output fromthe new SYNRAD3D program is used. SYNRAD3D is a program that does photon track-ing independent of ECLOUD, then outputs results to be used by ECLOUD. SYNRAD3Ddetermines where the primary photoelectrons are generated. It is important to note thatthe vacuum chamber shape used by ECLOUD and SYNRAD3D is an ellipse, which is anapproximation to the shape of the Cornell beam pipe. The true shape can be seen in Fig.3. Studies are currently underway to correct this.
FIG. 5: Cross sectional cloud electron density and energy are compared for 5.3 GeV (left column)
and 2.1 GeV (right column). These plots were generated from the simulation in Fig 10. Note that
this cross section from the ECLOUD simulation is an ellipse, so it is only an approximation to the
real shape that can be seen in Fig. 3, which has not yet been put into the code.
In ECLOUD the cloud electrons are represented by macroparticles, and a typical simula-tion used on the order of a million macroparticles produced per bunch. More macroparticlesmeans smaller error bars, but a larger run time. For studies presented here, one millionmacroparticles corresponded to approximately two hours of run time. In POSINST, a ran-dom integer n between 0 and a given upper bound is generated with a probability distribu-tion, where n is the number of secondaries that is actually generated. An energy distributionfor the new secondaries is then generated under the constraint that the sum of the energiesfrom each electron is less than the initial incident energy. n independent polar angles arechosen with a probability density, and n independent azimuthal angles with a probabilitydensity are then generated to be the emission angles of the secondary electrons. ECLOUDdiffers by generating only one macroparticle per electron impinging on the wall, where themacroparticle has a weighted charge which is the sum of all three yield components. Theratio of one yield component value to the total yield value gives the probability that thekinematics associated with that particular yield type will be used, and only one type of

6
FIG. 6: Contour plot of cloud electron energy inside the beam pipe cross section and x,y projections.
kinematics is used per macroparticle. This means that the kinematics are only correct whenaveraged over a large sample, as individual macroparticles may be too heavily dependent onone specific component’s kinematics too agree with the physical process actually occurring.POSINST generates the correct kinematics for each wall collision, since a distribution ofsecondaries is produced when an electron collides with the wall [7].
In ECLOUD, when a bunch passes, new photoelectrons are generated and electrons stillexisting from past bunch passages receive a momentum kick from the beam field, whichcauses macroparticles to be pushed into one of four shielded pickups on the beamline ceilingand gives a signal proportional to the number of electrons collected. An electron thatimpinges on the beam pipe wall is replaced by a secondary electron, with a new macroparticlecharge that depends on the secondary emission yield at the energy of the incoming electron[6].
After the passage of a bunch, the electron cloud should be dominated by low energy elec-trons interacting with the wall primarily through the elastic process. High energy electronsof more than 100 eV predominantly go through the true secondary yield process so thatthe produced secondaries have only on the order of 1 eV. These high energy electrons arepresent as a result of synchrotron radiation, beam kicks, or the rediffused secondaries [4].
The ECLOUD code also takes into account the physical dimensions of the Cornell syn-chrotron and beam. The beamline circumference is 768 m. The vertical beam size for 2.1GeV was 0.044 mm and the horizontal beam size was 0.81 mm. The vertical beam size for5.3 GeV was 0.29 mm and the horizontal beam size was 1.1 mm. The horizontal aperturelimitation was 0.045 m and the vertical aperture limitation was 0.025 m. The RMS bunch

7
FIG. 7: Contour plot of cloud electron density inside the beam pipe cross section and x,y projec-
tions.
length was 1.87 cm.Fig. 5-7 are examples of the sophisticated diagnostic plots that ECLOUD can produce
by tracking the kinematics of the macroparticles. Fig. 5 is an image of the cross section ofthe vacuum chamber and plots the energy distribution and density of cloud electrons acrossthe beam pipe cross section at 2.1 and 5.3 GeV. Notice that the cloud is densest at the rightside of the beam pipe where the synchrotron radiation impinges at the highest intensity,and that the highest energy electrons are found close to the beam in the center of the pipebecause of Coulomb attraction. Fig. 6 and Fig. 7 are contour plots and x-y projections ofFig. 5.
IV. RESULTS
A. Secondary Energy Distributions and SEMAX
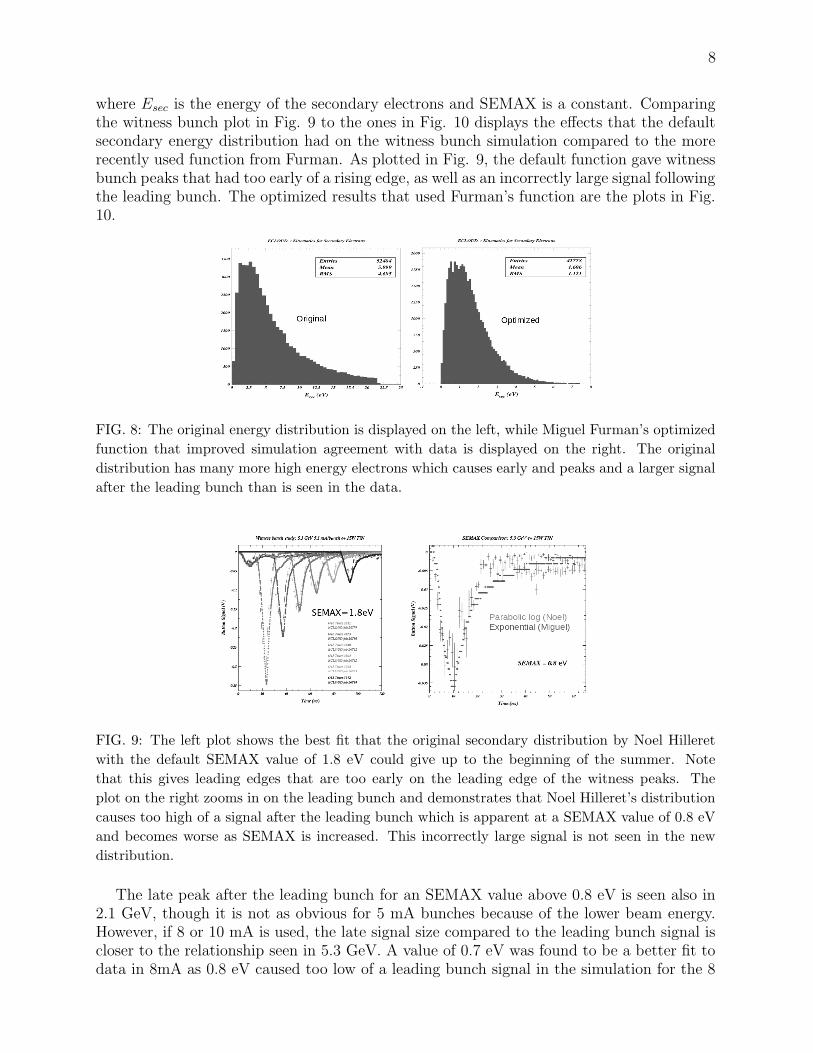
The original ECLOUD default for secondary energy distribution was chosen by NoelHilleret from Phil. J. Res. 50 (1996), 375. The function, as seen in the left plot in Fig. 8,was:
f(Esec) = exp(− ln( Esec
SEMAX)2
2)
A modification suggested by Miguel Furman that is plotted on the right in Fig. 8 is :
f(Esec) = Esec exp(−Esec
SEMAX)
8
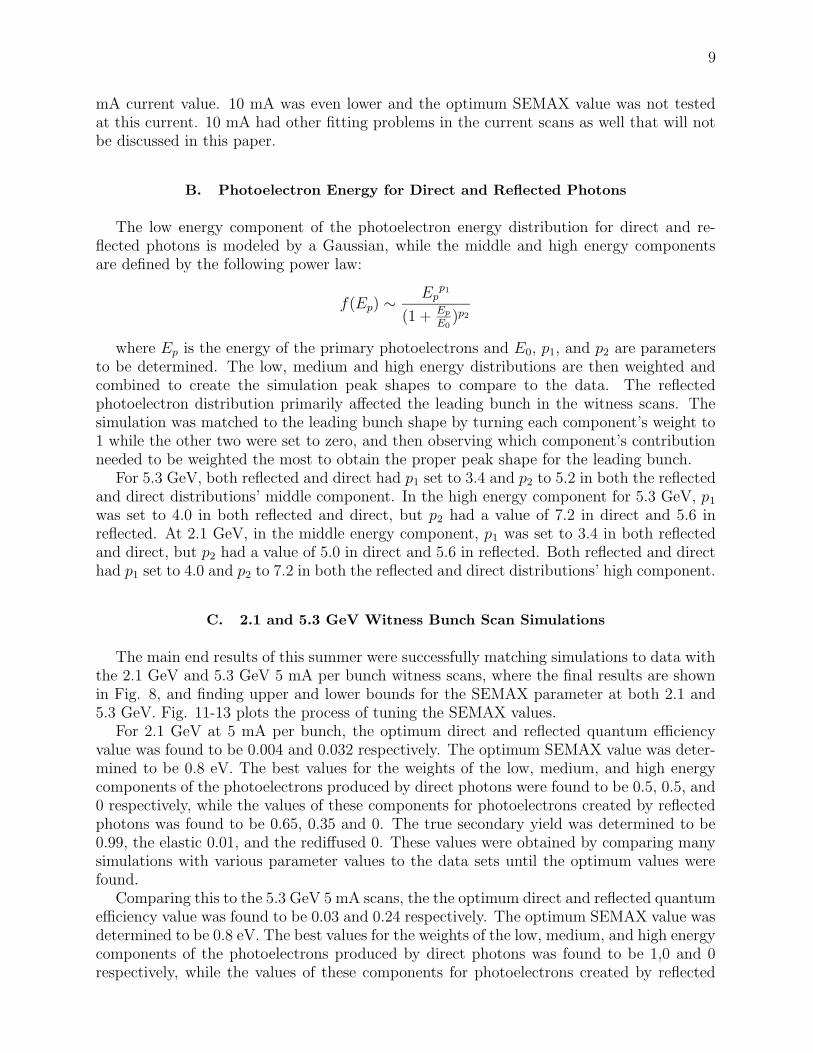
where Esec is the energy of the secondary electrons and SEMAX is a constant. Comparingthe witness bunch plot in Fig. 9 to the ones in Fig. 10 displays the effects that the defaultsecondary energy distribution had on the witness bunch simulation compared to the morerecently used function from Furman. As plotted in Fig. 9, the default function gave witnessbunch peaks that had too early of a rising edge, as well as an incorrectly large signal followingthe leading bunch. The optimized results that used Furman’s function are the plots in Fig.10.
FIG. 8: The original energy distribution is displayed on the left, while Miguel Furman’s optimized
function that improved simulation agreement with data is displayed on the right. The original
distribution has many more high energy electrons which causes early and peaks and a larger signal
after the leading bunch than is seen in the data.
FIG. 9: The left plot shows the best fit that the original secondary distribution by Noel Hilleret
with the default SEMAX value of 1.8 eV could give up to the beginning of the summer. Note
that this gives leading edges that are too early on the leading edge of the witness peaks. The
plot on the right zooms in on the leading bunch and demonstrates that Noel Hilleret’s distribution
causes too high of a signal after the leading bunch which is apparent at a SEMAX value of 0.8 eV
and becomes worse as SEMAX is increased. This incorrectly large signal is not seen in the new
distribution.
The late peak after the leading bunch for an SEMAX value above 0.8 eV is seen also in2.1 GeV, though it is not as obvious for 5 mA bunches because of the lower beam energy.However, if 8 or 10 mA is used, the late signal size compared to the leading bunch signal iscloser to the relationship seen in 5.3 GeV. A value of 0.7 eV was found to be a better fit todata in 8mA as 0.8 eV caused too low of a leading bunch signal in the simulation for the 8
9
mA current value. 10 mA was even lower and the optimum SEMAX value was not testedat this current. 10 mA had other fitting problems in the current scans as well that will notbe discussed in this paper.
B. Photoelectron Energy for Direct and Reflected Photons
The low energy component of the photoelectron energy distribution for direct and re-flected photons is modeled by a Gaussian, while the middle and high energy componentsare defined by the following power law:
f(Ep) ∼Ep
p1
(1 + Ep
E0
)p2
where Ep is the energy of the primary photoelectrons and E0, p1, and p2 are parametersto be determined. The low, medium and high energy distributions are then weighted andcombined to create the simulation peak shapes to compare to the data. The reflectedphotoelectron distribution primarily affected the leading bunch in the witness scans. Thesimulation was matched to the leading bunch shape by turning each component’s weight to1 while the other two were set to zero, and then observing which component’s contributionneeded to be weighted the most to obtain the proper peak shape for the leading bunch.
For 5.3 GeV, both reflected and direct had p1 set to 3.4 and p2 to 5.2 in both the reflectedand direct distributions’ middle component. In the high energy component for 5.3 GeV, p1
was set to 4.0 in both reflected and direct, but p2 had a value of 7.2 in direct and 5.6 inreflected. At 2.1 GeV, in the middle energy component, p1 was set to 3.4 in both reflectedand direct, but p2 had a value of 5.0 in direct and 5.6 in reflected. Both reflected and directhad p1 set to 4.0 and p2 to 7.2 in both the reflected and direct distributions’ high component.
C. 2.1 and 5.3 GeV Witness Bunch Scan Simulations
The main end results of this summer were successfully matching simulations to data withthe 2.1 GeV and 5.3 GeV 5 mA per bunch witness scans, where the final results are shownin Fig. 8, and finding upper and lower bounds for the SEMAX parameter at both 2.1 and5.3 GeV. Fig. 11-13 plots the process of tuning the SEMAX values.
For 2.1 GeV at 5 mA per bunch, the optimum direct and reflected quantum efficiencyvalue was found to be 0.004 and 0.032 respectively. The optimum SEMAX value was deter-mined to be 0.8 eV. The best values for the weights of the low, medium, and high energycomponents of the photoelectrons produced by direct photons were found to be 0.5, 0.5, and0 respectively, while the values of these components for photoelectrons created by reflectedphotons was found to be 0.65, 0.35 and 0. The true secondary yield was determined to be0.99, the elastic 0.01, and the rediffused 0. These values were obtained by comparing manysimulations with various parameter values to the data sets until the optimum values werefound.
Comparing this to the 5.3 GeV 5 mA scans, the the optimum direct and reflected quantumefficiency value was found to be 0.03 and 0.24 respectively. The optimum SEMAX value wasdetermined to be 0.8 eV. The best values for the weights of the low, medium, and high energycomponents of the photoelectrons produced by direct photons was found to be 1,0 and 0respectively, while the values of these components for photoelectrons created by reflected

10
FIG. 10: Successful fitting of 5.3 and 2.1 GeV June 2011 data to simulation of witness bunches.
photons was found to be 0.18, 0.2, and 0.62. The true secondary yield was determined tobe 0.55, the elastic 0.01 (much lower than the 0.55 used in [4]), and the rediffused 0.
FIG. 11: As SEMAX is increased above 0.8 eV, a late simulation peak appears that is not present
at the data.
For both beam energies the angle cut for emitted photons was 35 ◦, the wake field option

11
FIG. 12: For SEMAX values less than 0.8 eV, the 14-ns witness bunch signal becomes too small
and late.
FIG. 13: Photoelectrons from the top of the beam pipe and from direct photons produce secondaries
that cause the late signals seen at higher SEMAX values.
was turned off and the energy at which maximum secondary emission yield occurs was 300eV. The number of times the space charge field is calculated during and between bunchpassages is eleven. There were 100 intermediate steps between bunch passage and 400intermediate steps per inter bunch drift.
Also in both the splat function was turned on to set an energy cutoff for high energyelectrons that can be accepted by the shielded pickup signal simulation. The splat functionrepresents the physical effect where the shielded pickup signal is a function of incomingenergies. At higher energies, the pickup becomes less efficient. The final form of this settingwas obtained from tuning modeled pulse shapes.
12
V. CONCLUSIONS
Both 5.3 GeV and 2.1 GeV have made great progress in describing the shielded pickupwitness bunch data. The optimum SEMAX value for agreement between simulation anddata was determined to be 0.8 eV at 5 mA per bunch at both beam energies because abovethis value a late, broad peak not seen in the data appears and below this value the 14-nswitness bunch signal shape does not match the data. The sensitivity to this parameter is0.2 eV, which is a surprisingly large dependence. Miguel’s exponential distribution gives abetter match than the Phil. J .Res. parabolic log function.
A. Future Work
Future work will require integrating the real vacuum chamber pipe shape into the simu-lations and retuning the parameters if needed to agree with the data once this is done. Thesimulation also needs to be corrected to better agree with data from solenoid and electronscans.
VI. ACKNOWLEDGMENTS
I would like to express gratitude to my mentor Dr. James Crittenden for proposing thisREU project and offering advice in tackling the many problems this research presented.Also, thanks to Dr. John Sikora for advice on presentations and simulation improvements.Thanks also to those whose efforts made the REU program possible including Lora Hine,Monica Wesley, Dr. Ivan Bazarov and others.
VII. BIBLIOGRAPHY
[1] K.C. Harkay, R.A. Rosenberg. Properties of the electron cloud in a high-energy positron
and electron storage ring. Phys. Rev. ST Accel. Beams 6, 034402, 2003.[2] K. Ohmi, F. Zimmerman, G. Rumolo. Electron Cloud Build Up in Machines with Short
Bunches. ICFA Newsletter no. 32, May/June 2004.[3] F. Zimmermann, E.Benedetto. Electron-Cloud Effects in the LHC. ICFA Newsletter no.32, May/June 2004.[4] S. Calatroni, J.A. Crittenden, Y. Li, X. Liu, N. Omcikus, M.A. Palmer, G. Rumolo, J.P.Sikora. Electron Cloud Modeling Results for Time-Resolved Shielded Pickup Measurements
at CesrTA. Proceedings of ECLOUD 2010: 49th ICFA Advanced Beam Dynamics Workshopon Electron Cloud Physics, Ithaca NY.[5] M. A. Furman, M.T.F. Pivi. Probabilistic model for the simulation of secondary electron
emission. Phys. Rev. ST Accel. Beams 5, 124404, 2002.[6] G. Rumolo, F. Zimmerman. Electron-Cloud Simulations. http://conference.kek.jp/two-stream, 11-14, September 2001 KEK.[7] Private conversation with James Crittenden. July 29, 2011.