Animal-human interaction comparing live human observation and digital image evaluation
The authors are solely responsible for the content of this technical presentation. The technical presentation does not necessarily reflect the official position of the American Society of Agricultural and Biological Engineers (ASABE), and its printing and distribution does not constitute an endorsement of views which may be expressed. Technical presentations are not subject to the formal peer review process by ASABE editorial committees; therefore, they are not to be presented as refereed publications. Citation of this work should state that it is from an ASABE meeting paper. EXAMPLE: Author's Last Name, Initials. 2010. Title of Presentation. ASABE Paper No. 10----. St. Joseph, Mich.: ASABE. For information about securing permission to reprint or reproduce a technical presentation, please contact ASABE at [email protected] or 269-429-0300 (2950 Niles Road, St. Joseph, MI 49085-9659 USA).
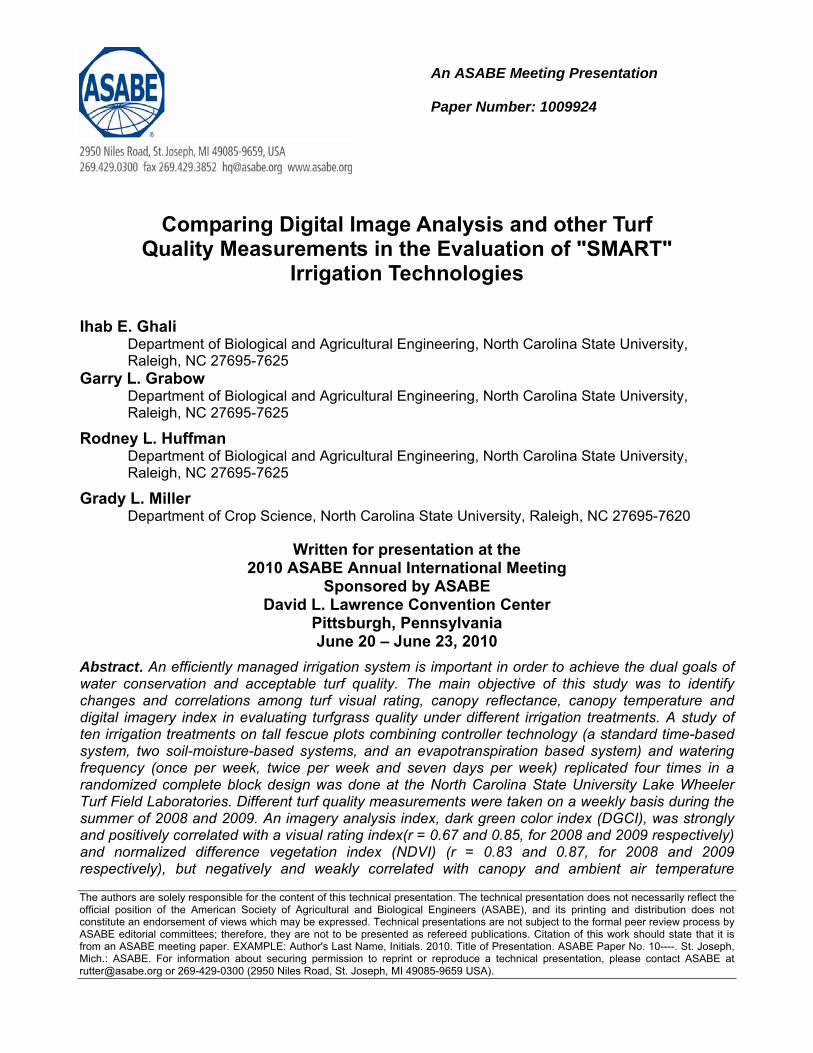
An ASABE Meeting Presentation Paper Number: 1009924
Comparing Digital Image Analysis and other Turf Quality Measurements in the Evaluation of "SMART"
Irrigation Technologies
Ihab E. Ghali Department of Biological and Agricultural Engineering, North Carolina State University, Raleigh, NC 27695-7625
Garry L. Grabow Department of Biological and Agricultural Engineering, North Carolina State University, Raleigh, NC 27695-7625
Rodney L. Huffman Department of Biological and Agricultural Engineering, North Carolina State University, Raleigh, NC 27695-7625
Grady L. Miller Department of Crop Science, North Carolina State University, Raleigh, NC 27695-7620
Written for presentation at the 2010 ASABE Annual International Meeting
Sponsored by ASABE David L. Lawrence Convention Center
Pittsburgh, Pennsylvania June 20 – June 23, 2010
Abstract. An efficiently managed irrigation system is important in order to achieve the dual goals of water conservation and acceptable turf quality. The main objective of this study was to identify changes and correlations among turf visual rating, canopy reflectance, canopy temperature and digital imagery index in evaluating turfgrass quality under different irrigation treatments. A study of ten irrigation treatments on tall fescue plots combining controller technology (a standard time-based system, two soil-moisture-based systems, and an evapotranspiration based system) and watering frequency (once per week, twice per week and seven days per week) replicated four times in a randomized complete block design was done at the North Carolina State University Lake Wheeler Turf Field Laboratories. Different turf quality measurements were taken on a weekly basis during the summer of 2008 and 2009. An imagery analysis index, dark green color index (DGCI), was strongly and positively correlated with a visual rating index(r = 0.67 and 0.85, for 2008 and 2009 respectively) and normalized difference vegetation index (NDVI) (r = 0.83 and 0.87, for 2008 and 2009 respectively), but negatively and weakly correlated with canopy and ambient air temperature
The authors are solely responsible for the content of this technical presentation. The technical presentation does not necessarily reflect the official position of the American Society of Agricultural and Biological Engineers (ASABE), and its printing and distribution does not constitute an endorsement of views which may be expressed. Technical presentations are not subject to the formal peer review process by ASABE editorial committees; therefore, they are not to be presented as refereed publications. Citation of this work should state that it is from an ASABE meeting paper. EXAMPLE: Author's Last Name, Initials. 2010. Title of Presentation. ASABE Paper No. 10----. St. Joseph, Mich.: ASABE. For information about securing permission to reprint or reproduce a technical presentation, please contact ASABE at [email protected] or 269-429-0300 (2950 Niles Road, St. Joseph, MI 49085-9659 USA).
differentials (∆T) (r = -0.06 and -0.24, for 2008 and 2009 respectively). Because of their objective measurements, digital imagery analysis and canopy spectral reflectance techniques can be used effectively to evaluate the variability in turf quality under different irrigation treatments (technology x frequency), thus improving irrigation management finding the treatment has low water-use with acceptable turf quality.
Keywords: Tall fescue, Turf quality, Digital image analysis, Canopy spectral reflectance, Visual rating, Canopy-air temperature differentials, Dark green color index.

2
Introduction
Traditional methods of determining turf quality have often been based on a visual rating system developed by the National Turfgrass Evaluation Program (NTEP) with a scale ranging from 1 to 9, with 1 representing the lowest quality and 9 representing the highest quality turf. A rating of 5 or above is considered minimally acceptable (Horst et al., 1984; Morris, 2002). This scale is mainly a function of color, density, and uniformity (Horst et al., 1984). Differences in assessments by humans occur because individuals differ in their capability to perceive various wavelengths of visible light, which can lead to differences in visual estimates of turf quality (Mirik et al., 2006). This rating system is biased due to subjectivities of the raters and has inaccurate estimation of turf quality (Keskin et al., 2003).
Spectral reflectance analysis has been introduced as an alternative to visual ratings for assessment of turf quality as a quick, reliable, and non-destructive tool. The vegetative physiological changes, such as; leaf water content and chlorophyll concentration, are affected by water deficiency in turfgrass (DaCosta et. Al., 2004; Jiang and Huang, 2000). Canopy spectral reflectance measurements have been used to estimate plant quality under different irrigation and/or fertilization applications (Fernandez et al., 1994; Fenstermaker-Shaulis et al., 1997; Rollin and Milton, 1998; Osborne et al., 2002b; Baghzouz et al., 2007). Reflectance at both visible (VIS) and near-infrared (NIR) ranges was used to develop the normalized difference vegetation index (NDVI) (Rouse et al., 1973), where NDVI is defined as (NIR – Red) / (NIR + Red). NDVI is commonly use to evaluate turfgrass canopy characteristics (Sönmez et al., 2008; Xiong et al., 2007; Jiang et al., 2003; Trenholm et al., 1999). NDVI has also shown to effectively express changes in leaf water content and soil moisture in perennial ryegrass under water deficit conditions (Dettman-Kruse et al., 2008).
Turf canopy temperature is another tool used to measure responses of turfgrass to water deficiency (Jiang et al., 2009). Turfgrass canopy temperature changes according to the moisture level in the grass with leaf canopy temperature exceeding ambient air temperature under turfgrass drought stress as a result of transpiration reduction (Jiang et al., 2009). Clark and Hiller (1973) found canopy temperature of a well-watered crop were lower (2-3ºC) than stressed plant when water deficit occurred. The difference between plant canopy temperature and ambient air temperature (∆T) was studied as a tool to manage irrigation scheduling in Kentucky bluegrass by Throssell et al., (1987) as it reflects the water potential in turf leaves. Canopy and ambient temperature differentials (∆T) was found to be significantly correlated with NDVI (r = -0.54) when studying the quality of tall fescue [Festuca arundinacea Schreb] under water deficit conditions (Fenstermaker-Shaulis et al., 1997).
Digital image Analysis (DIA) provides an alternative method to measure the reflectance from vegetated surfaces. DIA technique has been used to quantify canopy coverage in wheat (Lukina et al., 1999), soybeans (Purcell, 2000), and turfgrass (Richard et al., 2001). Karcher and Richardson (2003) found that DIA showed strong agreement with visual ratings in evaluating turf color. An index known as the dark green color index (DGCI) was developed by Karcher and Richardson (2003) by using hue, saturation, and brightness (HSB) levels. They found a significant agreement between DGCI and visual rating. DIA provides an objective, unbiased, nondestructive, and consistent measurements. This technique is capable of providing rapid, accurate, and precise results as recent digital image collection equipment and image analysis software have the capability to acquire and process hundreds of images per hour and images can be stored for further analysis at the researcher’s convenience (Díaz-Lago et al., 2003). Digital imagery process is a cost-effective technique as it requires only a digital camera, computer, and an image analysis program. A low-cost digital camera, with white balance
3
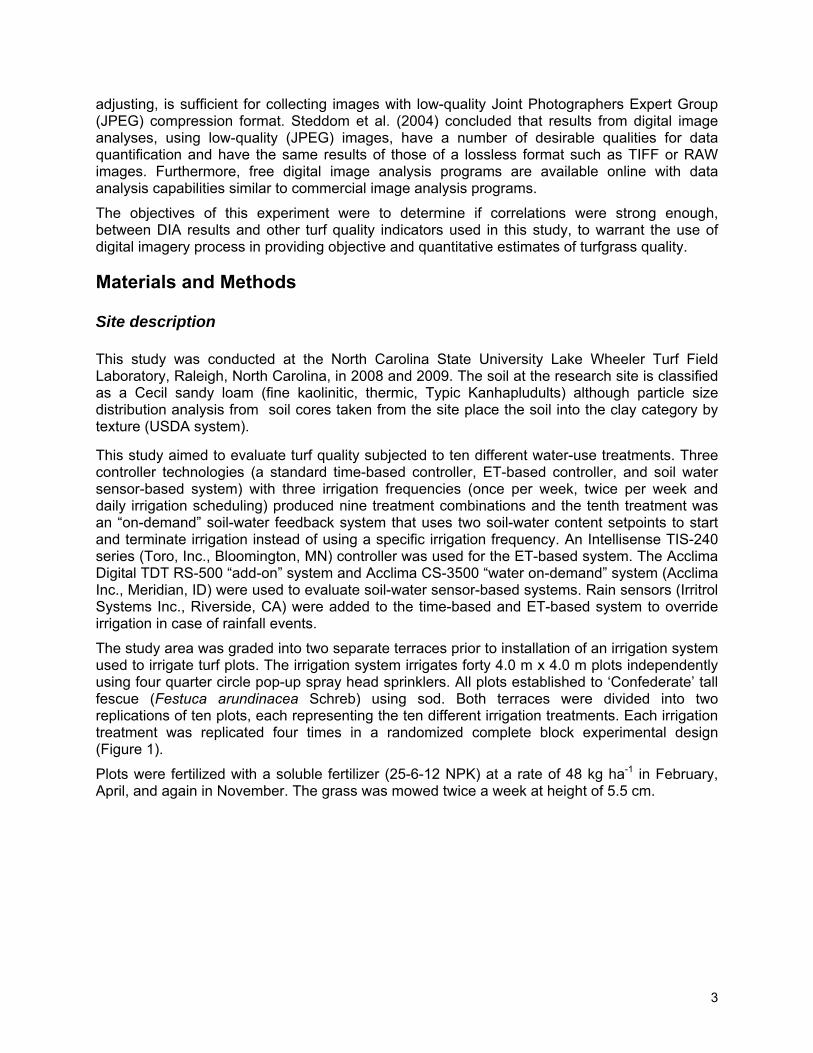
adjusting, is sufficient for collecting images with low-quality Joint Photographers Expert Group (JPEG) compression format. Steddom et al. (2004) concluded that results from digital image analyses, using low-quality (JPEG) images, have a number of desirable qualities for data quantification and have the same results of those of a lossless format such as TIFF or RAW images. Furthermore, free digital image analysis programs are available online with data analysis capabilities similar to commercial image analysis programs.
The objectives of this experiment were to determine if correlations were strong enough, between DIA results and other turf quality indicators used in this study, to warrant the use of digital imagery process in providing objective and quantitative estimates of turfgrass quality.
Materials and Methods
Site description
This study was conducted at the North Carolina State University Lake Wheeler Turf Field Laboratory, Raleigh, North Carolina, in 2008 and 2009. The soil at the research site is classified as a Cecil sandy loam (fine kaolinitic, thermic, Typic Kanhapludults) although particle size distribution analysis from soil cores taken from the site place the soil into the clay category by texture (USDA system).
This study aimed to evaluate turf quality subjected to ten different water-use treatments. Three controller technologies (a standard time-based controller, ET-based controller, and soil water sensor-based system) with three irrigation frequencies (once per week, twice per week and daily irrigation scheduling) produced nine treatment combinations and the tenth treatment was an “on-demand” soil-water feedback system that uses two soil-water content setpoints to start and terminate irrigation instead of using a specific irrigation frequency. An Intellisense TIS-240 series (Toro, Inc., Bloomington, MN) controller was used for the ET-based system. The Acclima Digital TDT RS-500 “add-on” system and Acclima CS-3500 “water on-demand” system (Acclima Inc., Meridian, ID) were used to evaluate soil-water sensor-based systems. Rain sensors (Irritrol Systems Inc., Riverside, CA) were added to the time-based and ET-based system to override irrigation in case of rainfall events.
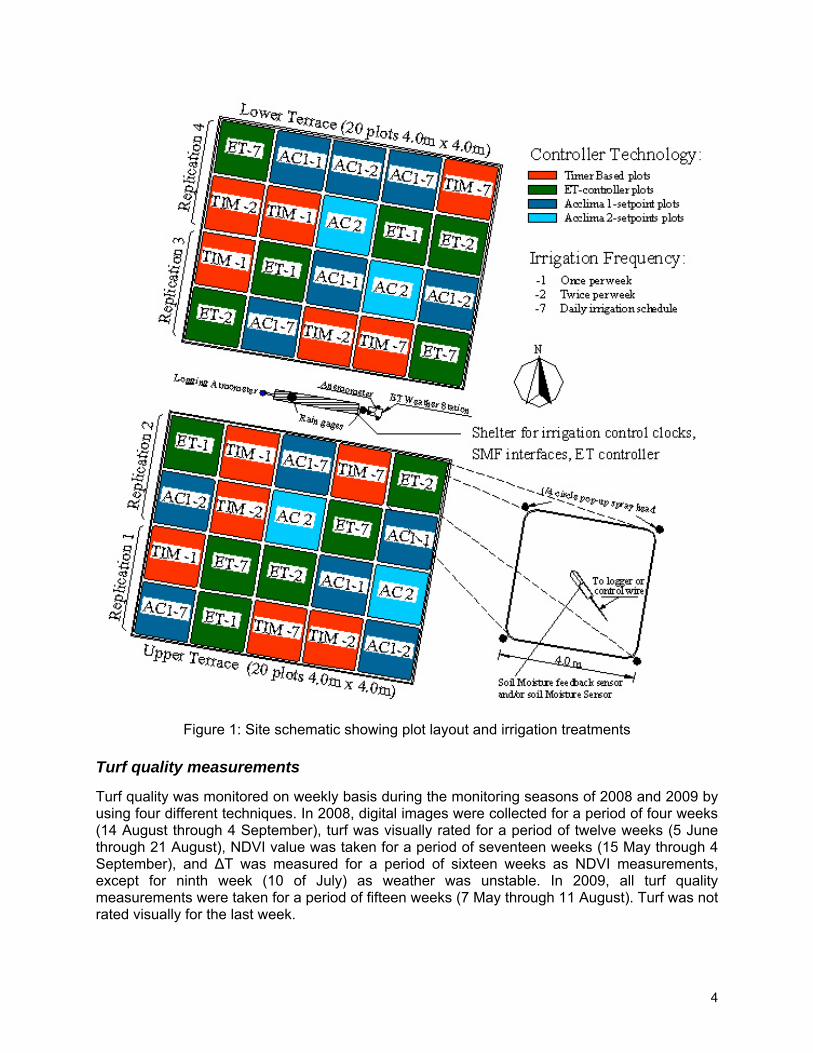
The study area was graded into two separate terraces prior to installation of an irrigation system used to irrigate turf plots. The irrigation system irrigates forty 4.0 m x 4.0 m plots independently using four quarter circle pop-up spray head sprinklers. All plots established to ‘Confederate’ tall fescue (Festuca arundinacea Schreb) using sod. Both terraces were divided into two replications of ten plots, each representing the ten different irrigation treatments. Each irrigation treatment was replicated four times in a randomized complete block experimental design (Figure 1).
Plots were fertilized with a soluble fertilizer (25-6-12 NPK) at a rate of 48 kg ha-1 in February, April, and again in November. The grass was mowed twice a week at height of 5.5 cm.
4
Figure 1: Site schematic showing plot layout and irrigation treatments
Turf quality measurements
Turf quality was monitored on weekly basis during the monitoring seasons of 2008 and 2009 by using four different techniques. In 2008, digital images were collected for a period of four weeks (14 August through 4 September), turf was visually rated for a period of twelve weeks (5 June through 21 August), NDVI value was taken for a period of seventeen weeks (15 May through 4 September), and ∆T was measured for a period of sixteen weeks as NDVI measurements, except for ninth week (10 of July) as weather was unstable. In 2009, all turf quality measurements were taken for a period of fifteen weeks (7 May through 11 August). Turf was not rated visually for the last week.
5
1. Visual Rating: Turf quality was visually assessed by an experienced turf elevator for all plots and rated on a scale of 1 to 9 representing poor to excellent quality respectively (Morris and Shearman, 1997). 2. Spectral Reflectance: Canopy spectral reflectance was taken with the aid of a Field Scout TCM 500 Turf Color Meter (Spectrum Technologies Inc., Plainfield, IL) to assess the turf quality by a “normalized difference vegetation index” (NDVI). NDVI is an index obtained by measuring the spectral radiation reflected by plants at different light wavelengths in both the visible and near-infrared ranges (Trenholm et. al.,1999, Keskin et. al.,2003). The Field Scout meter has its own internal light source that emits visible and near infrared light (NIR) from a single light-emitting diode light source. Reflectance at these different wave lengths was used to develop the normalized difference vegetation index (NDVI) (Eq. 1).
NDVI = (NIR – Red) / (NIR + Red) (1)
Where:
NDVI = Normalized Difference Vegetation Index
NIR = Reflectance in the band of 850 ± 5 nm
Red = Reflectance in the band of 660 ± 5 nm
A T-handle extension was attached to the TCM500 meter to allow measurements while standing. One reading per plot was taken on a weekly basis during the sampling season of 2008 and five readings were taken per plot during the sampling season in 2009 to increase the sampled area because of the relatively small area sample by the Field Scout meter. Each sample presents about 0.03% of the whole area of the plot. The five values taken within one plot were averaged to represent the whole plot.
3. Canopy Temperature: Turf canopy and ambient air temperature were also measured on weekly basis by using a handheld infrared thermometer (Spectrum Technologies Inc., Plainfield, IL). Differential temperatures (∆T) were obtained by subtracting canopy temperature from ambient air temperature. Turf canopy temperature was measured by taking one reading per plot in full sun while avoiding shadows and windy conditions. Sampling was performed between 12:00 and 15:00 EST (Eastern Standard Time) holding the thermometer at 1.0 m above the turf at an angle of 45° from horizontal as proposed by Throssell et al. (1987).
4. Digital Image Analysis: Turf quality was evaluated by using digital image analysis process that included; (1) acquiring digital images by a digital camera in jpeg (joint photo graphic experts group, .jpg) format under consistent lighting, (2) extracting the red, green and blue (RGB) levels for all pixels in the acquired images using ImageJ software, (3) converting the RGB levels into Hue, Saturation and Brightness (HSB) parameters (Adobe Systems, 2002), and (4) creating a turf color index from the HSB values known as the dark green color index (Eq. 2) developed by Karcher and Richardson (2003).
DGCI = [(H - 60)/60 + (1 – S) + (1 – B)]/3 (2)
Where:
DGCI = dark green color index,
H, S, B = hue, saturation, and brightness levels
Turf images were taken with the aid of a Nikon COOLPIX 4300 digital camera (Nikon Inc., Melville, NY). The images were collected in JPEG format, with a color depth of 16.7 million colors, and an image size of 640 x 480 pixels (about 80 kilobytes per image). Camera settings
6
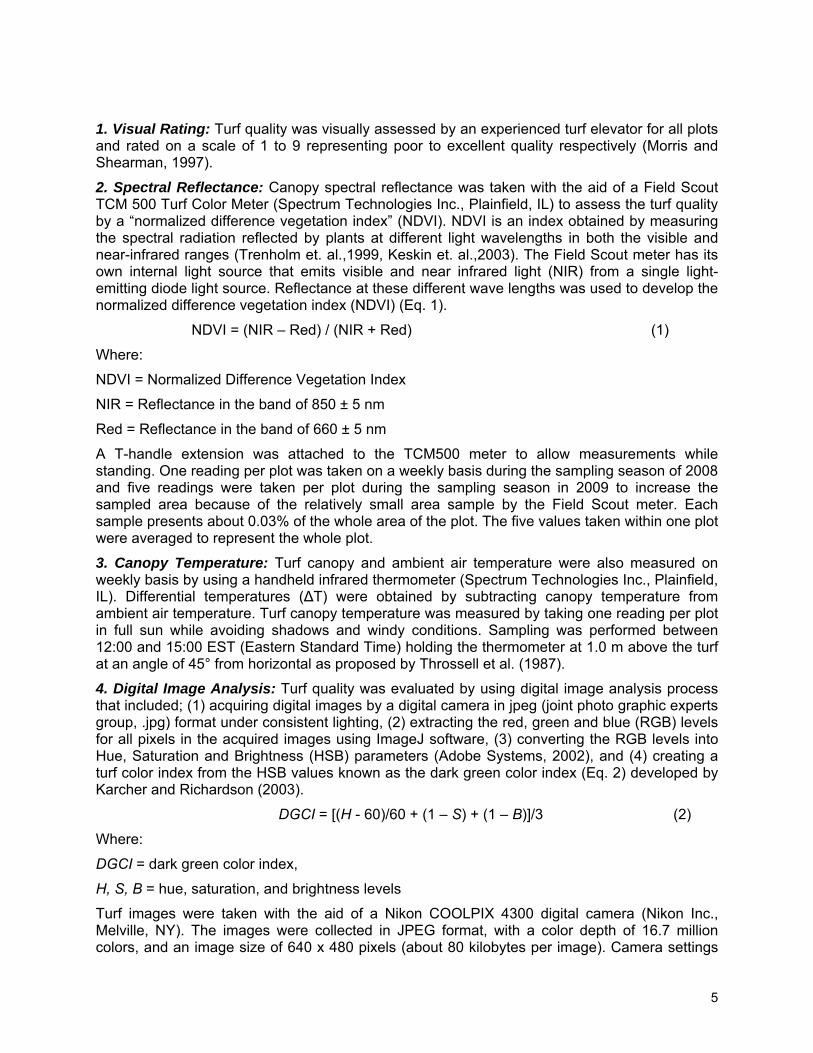
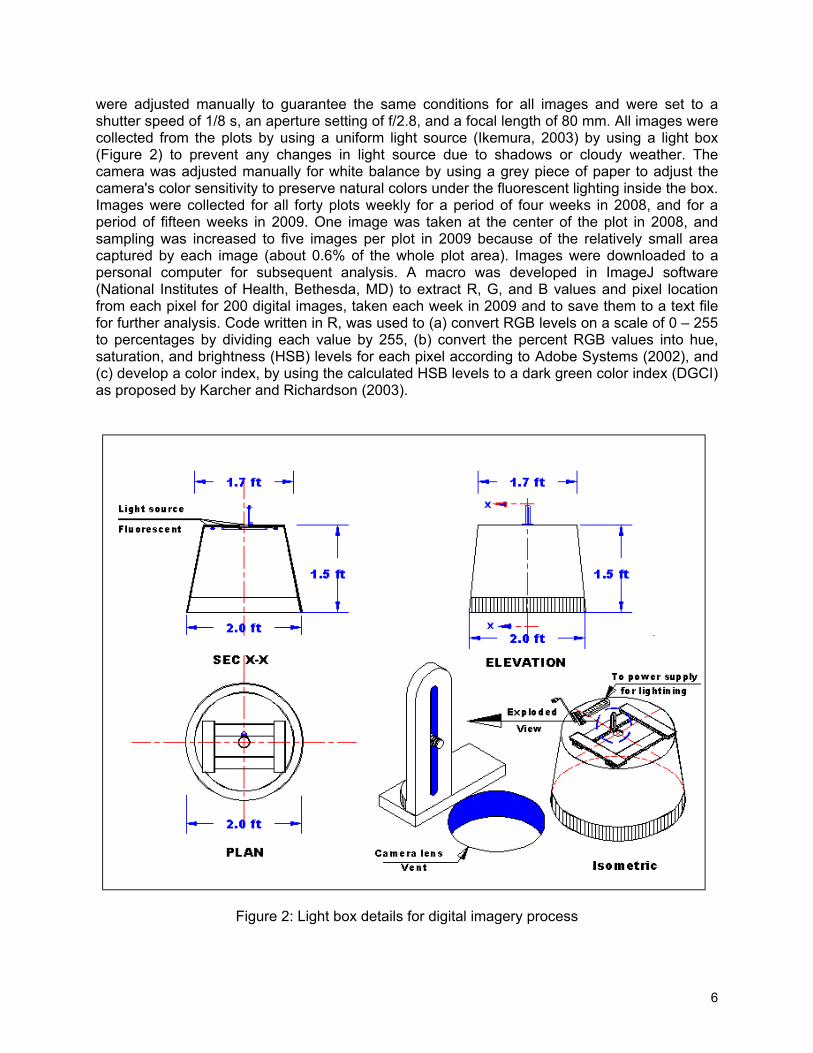
were adjusted manually to guarantee the same conditions for all images and were set to a shutter speed of 1/8 s, an aperture setting of f/2.8, and a focal length of 80 mm. All images were collected from the plots by using a uniform light source (Ikemura, 2003) by using a light box (Figure 2) to prevent any changes in light source due to shadows or cloudy weather. The camera was adjusted manually for white balance by using a grey piece of paper to adjust the camera's color sensitivity to preserve natural colors under the fluorescent lighting inside the box. Images were collected for all forty plots weekly for a period of four weeks in 2008, and for a period of fifteen weeks in 2009. One image was taken at the center of the plot in 2008, and sampling was increased to five images per plot in 2009 because of the relatively small area captured by each image (about 0.6% of the whole plot area). Images were downloaded to a personal computer for subsequent analysis. A macro was developed in ImageJ software (National Institutes of Health, Bethesda, MD) to extract R, G, and B values and pixel location from each pixel for 200 digital images, taken each week in 2009 and to save them to a text file for further analysis. Code written in R, was used to (a) convert RGB levels on a scale of 0 – 255 to percentages by dividing each value by 255, (b) convert the percent RGB values into hue, saturation, and brightness (HSB) levels for each pixel according to Adobe Systems (2002), and (c) develop a color index, by using the calculated HSB levels to a dark green color index (DGCI) as proposed by Karcher and Richardson (2003).
Figure 2: Light box details for digital imagery process

7
Statistical Evaluation Correlation coefficients and linear regression analysis were used to judge the performance of DGCI against other turf quality measurements. The Pearson’s correlation coefficients (r) were determined by constructing a correlation matrix between visual rating, NDVI, ∆T, and DGCI using the PROC CORR procedure of the Statistical Analysis System (9.1 edition; SAS Institute, Cary, NC) using all data set for years 2008, and 2009. Linear regression analyses were conducted for all turf quality data collected across all irrigation treatments and replications (i.e. forty data pairs per week for each combination) during 2008 and 2009 to determine the relationships between different turf quality indices and DGCI developed by the digital imagery analysis process.
Results and Discussions Correlation analyses showed statistically significant relationships among visual rating of turfgrass quality, dark green color index (DGCI), normalized difference vegetation index (NDVI), and canopy-air temperature differential (∆T) in both monitoring seasons of 2008 and 2009 (Table 1). Those correlations were stronger in 2009 compared to 2008, particularly for DGCI with NDVI and visual rating. Table 2 shows summary statistics by year for the quality ratings measures.
Table 1. Pearson correlation coefficients among normalized difference vegetative index, canopy and air temperature differential, dark green color index, and visual turf ratings across all 40 plots in both experiment years of 2008 and 2009 2008 2009
∆T DGCI VR ∆T DGCI VR Correlation -0.18 0.83 0.75 -0.29 0.87 0.8
P-Value < 0.0001 < 0.0001 < 0.0001 < 0.0001 < 0.0001 < 0.0001 NDVI n 640 160 480 600 600 560 -0.06 -0.26 -0.24 -0.25 0.48 < 0.0001 < 0.0001 < 0.0001 ∆T 160 440 600 560 0.67 0.85 < 0.0001 < 0.0001 DGCI 80 560
NDVI = normalized difference vegetative index, ∆T = canopy- air temperature differential, DGCI = dark green color index, and VR = visual turf ratings.
Table 2. Turf quality measurement summary statistics 2008 2009 Statistic NDVI ∆T DGCI VR NDVI ∆T DGCI VR N 680 640 160 480 600 600 600 560 Min. 0.442 4.000 0.312 3 0.472 4.500 0.208 2 Max. 0.780 33.500 0.451 8 0.782 43.600 0.469 9 Mean 0.710 17.880 0.396 6.706 0.712 22.027 0.396 6.836 STDEVa 0.037 6.103 0.032 0.854 0.032 6.420 0.036 1.118 CV (%)b 5.2 34.1 8.1 12.7 4.5 29.2 9.2 16.4
a. Standard Deviation b. Coefficient of Variation
NDVI = normalized difference vegetative index, ∆T = canopy- air temperature differential, DGCI = dark green color index, and VR = visual turf ratings.

8
Visual rating turf quality results were positively correlated with DGCI and NDVI but negatively correlated with ∆T. In 2008, visual rating of turf quality was correlated strongly with NDVI (r = 0.75, P < 0.0001), DGCI (r = 0.67, P < 0.0001); the weakest correlation was with ∆T (r= -0.26) although the correlation was still statistically significant (P < 0.0001). In 2009, visual rating was also significant with DGCI (r = 0.85, P < 0.0001), NDVI (r = 0.8, P < 0.0001) and ∆T (r = -0.25, P < 0.0001), whereas DGCI was strongly correlated with NDVI (r = 0.83 to 0.87, P < 0.0001) in both years respectively. Canopy and air temperature differential (∆T) was significantly correlated with visual rating but not as high as DGCI and NDVI. The ∆T wasn’t correlated significantly with DGCI in 2008 (r = -0.06, P = 0.48).
Correlation coefficients between DGCI and other turf quality indicators for all weeks in 2009 are plotted in Fig. 3, to show the degree of correlation on weekly basis. Strong correlations are shown between visual rating and DGCI for all weeks in 2009 (r ≥ 0.85, P < 0.0001). Good correlations were reported also between NDVI and DGCI results in the first four weeks in 2009 (r ranging from 0.72 to 0.89, P < 0.0001) where the relationship between them were stronger in the rest of the weeks (r ranging from 0.91 to 0.95, P < 0.0001).Also, it was observed that the relationship between DGCI and canopy-air temperature differential (∆T) was strongly correlated (r ≥ -0.70, P < 0.0001) most of the time (9 weeks out of 15 weeks) but still not as strong as the correlation between visual rating and NDVI (Figure 3). Other weeks showed poor correlation between DGCI and ∆T. There were a couple of positive correlation weeks (2 and 6) that resulted in overall poor correlation between the two variables (r = -0.24) as shown in table1.
N = 40 m easurm ents/w eek
************
******
******
************ ***
************
******
******
***
*********
***
******
***
****
*
*
***
***
*********
***************
V isual R ating TN D V I
0.00.10.20.30.4
0.90.80.70.60.5
1.0
0.10.20.30.40.50.60.70.80.91.01.0
0.90.80.70.60.50.40.30.20.1
1.0
0.50.60.70.80.9
0.40.30.20.10.0
Cor
rela
tion
Coe
ffic
ient
(r)
W eek15W eek14W eek13W eek12W eek11W eek10W eek9W eek8W eek7W eek6W eek5W eek4W eek3W eek2W eek1
Figure 3: Correlation coefficients between DGCI and other turf quality indicators during all
monitored weeks in 2009
*, **, *** Significance at 0.1, 0.01 and 0.001 level, respectively.
9
Greater variation was found among DGCI measurements (CV%= 8.1 and 9.2) than NDVI measurements (CV%= 5.2 and 4.5) for 2008 and 2009, respectively. These higher variations may relate to the relatively small area captured by the canopy spectral reflectance sample when compared to the digital imagery sample that is 20 times larger. However, both samples were taken from the same location. Also, DGCI tended to be overestimated for denser plots where darker green color pixels will exceed as a result of shadows that occur when the digital images are captured.
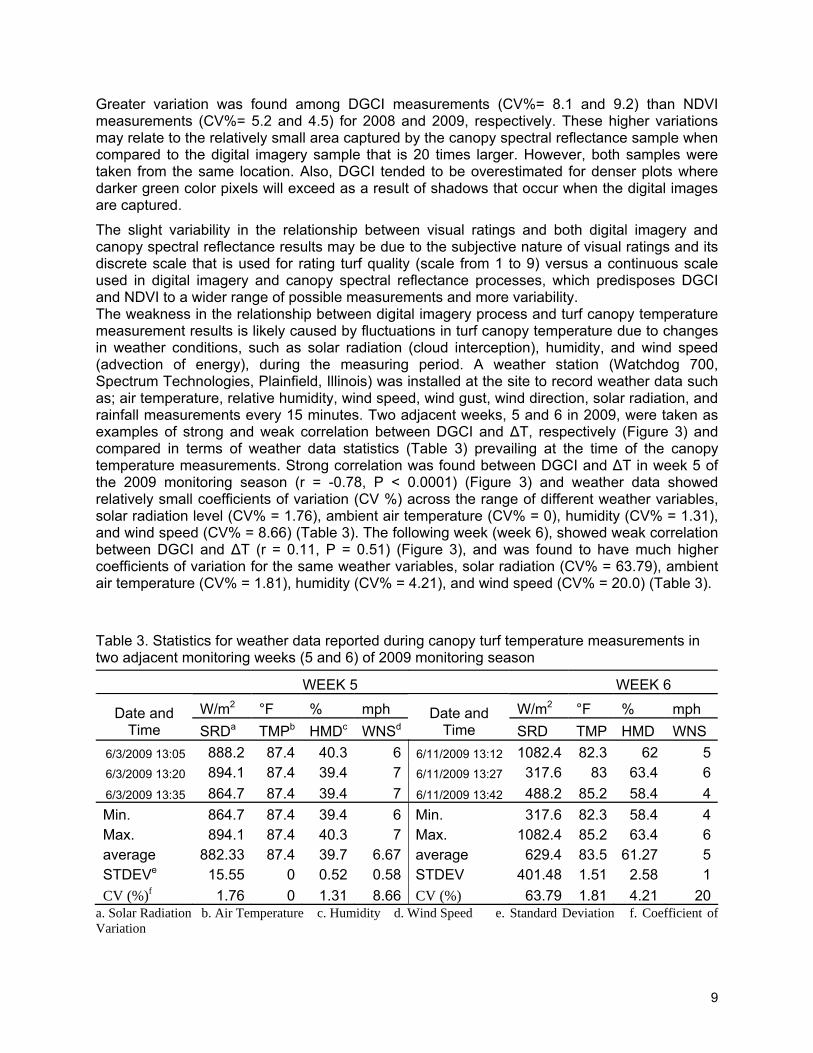
The slight variability in the relationship between visual ratings and both digital imagery and canopy spectral reflectance results may be due to the subjective nature of visual ratings and its discrete scale that is used for rating turf quality (scale from 1 to 9) versus a continuous scale used in digital imagery and canopy spectral reflectance processes, which predisposes DGCI and NDVI to a wider range of possible measurements and more variability. The weakness in the relationship between digital imagery process and turf canopy temperature measurement results is likely caused by fluctuations in turf canopy temperature due to changes in weather conditions, such as solar radiation (cloud interception), humidity, and wind speed (advection of energy), during the measuring period. A weather station (Watchdog 700, Spectrum Technologies, Plainfield, Illinois) was installed at the site to record weather data such as; air temperature, relative humidity, wind speed, wind gust, wind direction, solar radiation, and rainfall measurements every 15 minutes. Two adjacent weeks, 5 and 6 in 2009, were taken as examples of strong and weak correlation between DGCI and ∆T, respectively (Figure 3) and compared in terms of weather data statistics (Table 3) prevailing at the time of the canopy temperature measurements. Strong correlation was found between DGCI and ∆T in week 5 of the 2009 monitoring season (r = -0.78, P < 0.0001) (Figure 3) and weather data showed relatively small coefficients of variation (CV %) across the range of different weather variables, solar radiation level (CV% = 1.76), ambient air temperature (CV% = 0), humidity (CV% = 1.31), and wind speed (CV% = 8.66) (Table 3). The following week (week 6), showed weak correlation between DGCI and ∆T (r = 0.11, P = 0.51) (Figure 3), and was found to have much higher coefficients of variation for the same weather variables, solar radiation (CV% = 63.79), ambient air temperature (CV% = 1.81), humidity (CV% = 4.21), and wind speed (CV% = 20.0) (Table 3).
Table 3. Statistics for weather data reported during canopy turf temperature measurements in two adjacent monitoring weeks (5 and 6) of 2009 monitoring season
WEEK 5 WEEK 6 W/m2 °F % mph W/m2 °F % mph Date and
Time SRDa TMPb HMDc WNSdDate and
Time SRD TMP HMD WNS 6/3/2009 13:05 888.2 87.4 40.3 6 6/11/2009 13:12 1082.4 82.3 62 56/3/2009 13:20 894.1 87.4 39.4 7 6/11/2009 13:27 317.6 83 63.4 66/3/2009 13:35 864.7 87.4 39.4 7 6/11/2009 13:42 488.2 85.2 58.4 4Min. 864.7 87.4 39.4 6 Min. 317.6 82.3 58.4 4Max. 894.1 87.4 40.3 7 Max. 1082.4 85.2 63.4 6average 882.33 87.4 39.7 6.67 average 629.4 83.5 61.27 5STDEVe 15.55 0 0.52 0.58 STDEV 401.48 1.51 2.58 1CV (%)f 1.76 0 1.31 8.66 CV (%) 63.79 1.81 4.21 20
a. Solar Radiation b. Air Temperature c. Humidity d. Wind Speed e. Standard Deviation f. Coefficient of Variation

10
Fluctuation in solar radiation may be the greatest cause of inaccurate turf canopy temperature measurements, as grass canopy temperature showed a linear increase with solar radiation level (Feldhake et al., 1985). Feldhake and Edwards (1992) found that for a 1 kPa increase in vapor pressure deficit, canopy temperature decreased 2.1°C and each 100 W/m2 increase in net radiation causes increased canopy temperature 0.6°C. Fluctuation in wind speed did not have a real effect on turf canopy temperature since measurements were taken with wind speed less than 1mph and thermometer readings remained stable.
Linear regression analysis results are summarized in Table 4, Fig. 4, and Fig. 5. Digital imagery and spectral reflectance measurements; DGCI and NDVI, are reported on a continuous scale where visual rating measurements were reported on a discrete scale. The relationships of these two measurements were significant with visual rating results. These relationships were better in 2009 (r2 = 0.71 and 0.65, respectively) than 2008 (r2 = 0.45 and 0.56, respectively). The strongest relationship was between DGCI and NDDVI in both 2008 and 2009 (r2 = 0.70 and 0.75, respectively). Canopy and air temperature differential (∆T) had the weakest relationship with the other turf quality measurements although it had statistical significance for slope and parameter estimates most of the time.
Table 4. Linear regression results between different turf quality indicators.
Dependent Variable
Independent Variable
Data observation
number Slope Signif.
level Intercept Signif.
level Determination
Coefficient Yea
r
y x n β1 P β0 P r2 DGCI 80 17.22 ≤0.0001 -0.241 ≤0.0001 0.45 NDVI 480 17.14 ≤0.0001 -5.395 ≤0.0001 0.56 VR ∆T 440 -0.036 ≤0.0001 7.34 ≤0.0001 0.07
NDVI 160 0.658 ≤0.0001 -0.068 ≤0.0001 0.70 DGCI
∆T 160 -0.0003 0.48 0.401 ≤0.0001 0.003
2008
NDVI ∆T 640 -0.0011 ≤0.0001 0.73 ≤0.0001 0.03 DGCI 560 25.79 ≤0.0001 -3.389 ≤0.0001 0.71 NDVI 560 27.79 ≤0.0001 -13.05 ≤0.0001 0.65 VR ∆T 560 -0.0437 ≤0.0001 7.784 ≤0.0001 0.06
NDVI 600 0.987 ≤0.0001 -0.307 ≤0.0001 0.75 DGCI
∆T 600 -0.0014 ≤0.0001 0.426 ≤0.0001 0.06
2009
NDVI ∆T 600 -0.0014 ≤0.0001 0.743 ≤0.0001 0.08
VR = visual turf ratings, DGCI = dark green color index, NDVI = normalized difference vegetative index, and ∆T = canopy- air temperature differential.
Linear regression equation form: y = β1 x + β0

11
Figure 4: Relationship between different turf quality indicators during 2008 monitoring season.

12
Figure 5: Relationship between different turf quality indicators during 2009 monitoring season.

13
Conclusion The evaluation and comparison of the four turf quality evaluation techniques that were considered in this study enabled us to draw the following conclusions about the digital imagery process.
• Both DGCI and NDVI provide objective, quantitative turf quality evaluation and little to no prior experience is needed. On the other hand, visual rating technique needs substantial training and measurements may vary from day to day for the same evaluator and different values may be reported because of its subjectivity and inherent error in human evaluators.
• Visual ratings are reported on a discrete scale, but DGCI and NDVI were reported turf quality on a continuous scale which brings turf quality estimates to more realistic measurements.
• Variations between DGCI and NDVI may relate to the relative small area of canopy spectral reflectance sample are compared to the digital imagery sample area. Also, DGCI tended to be overestimated for denser plots where darker green color pixels will exceed as a result of shadows that occur when the digital images are captured.
• Turf canopy temperature should be taken under stable weather conditions to report its response accurately. Otherwise, a model should be used to adjust the turf canopy- air temperature deferential (∆T) according to the variation in weather variables to guarantee accurate measurements. Martin et al. (1994) concluded that; the effects of vapor pressure deficit of the air (VPD), net radiation load (Rn), and wind speed (WS) must be taken into account to predict accurately the canopy-air temperature differential, (Tc – Ta) of turfgrass.
• Results from this study illustrate that changes in DGCI described effectively the variability occurred in turf canopies of tall fescue at various irrigation treatments, thus providing another tool for improving irrigation management.

14
References Adobe Systems. 2002. Adobe Photoshop v. 7.0. Adobe Systems, San Jose, CA.
Baghzouz, M., D. A. Devitt, and R. L. Morris. 2007. Assessing canopy spectral reflectance of hybrid bermudagrass under various combinations of nitrogen and water treatments. Applied Eng. in Agric. 23(6): 763-774.
Clark, R. N., and E. A. Hiler. 1973. Plant measurements as indicators of crop water deficit. Crop Science. 13: 466-469.
DaCosta, M., Z. Wang, and B. Huang. 2004. Physiological adaptation of Kentucky bluegrass to localized soil drying. Crop Sci. 44: 1307–1314.
Dettman-Kruse, J.K., N.E. Christians, and M.H. Chaplin. 2008. Predicting soil water content through remote sensing of vegetative characteristics in a turfgrass system. Crop Sci. 48:763–770.
Díaz -Lago, J.E., Stuthman, D.D., Leonard, K.J., 2003. Evaluation of components of partial resistance to oat crown rust using digital image analysis. Plant Dis. 87: 667–674.
Feldhake, C.M., Butler, J.D. and Danielson, R.E., 1985. Turfgrass evapotranspiration: responses to shade preconditioning. Irrig. Sci., 6: 265-270.
Feldhake, C.M., and W.M. Edwards, 1992. Pasture canopy temperature under cloudy humid conditions, Agric. For. Meteorol. 60(1–2):133–144.
Fenstermaker-Shaulis, L. K., A. Leskys, and D. A. Devitt. 1997. Utilization of remotely sensed data to map and evaluate turfgrass stress associated with drought. J. Turfgrass Manag. 2(1): 65-81.
Fernandez, S., D. Vidal, E. Simon, and L. Sole-Sugrañes. 1994. Radiometric characteristics of Triticum aestivum cv. Astral under water and nitrogen stress. Int. J. Remote Sens. 15(9): 1867-1884.
Horst, G.L., M.C. Engelke, and W. Meyers. 1984. Assessment of visual evaluation techniques. J. Agron. J. 76:619-621.
Ikemura, Y. 2003. Using digital image analysis to measure the nitrogen concentration of turfgrasses. M.S. thesis. Univ. of Arkansas, Fayetteville.
Jiang, Y. and B. Huang. 2000. Effects of drought or heat stress alone and in combination on Kentucky bluegrass. Crop Sci. 40:1358–1362.
Jiang, Y., R.N. Carrow, and R.R. Duncan. 2003. Correlation analysis procedures for canopy spectral reflectance data of seashore paspalum under traffic stress. J. Amer. Soc. Hort. Sci. 128:343–348.
Jiang, Y., Liu, H., and Cline, V., 2009. Correlations of leaf relative water content, canopy temperature, and spectral reflectance in perennial ryegrass under water deficit conditions. J. Amer. Soc. Hort. Sci. 44: 459–462.
Karcher, D.E., and M.D. Richardson. 2003. Quantifying turfgrass color using digital image analysis. Crop Sci. 43: 943–951.
Keskin. M., Dodd. R.B., Han. Y.J. and Khalilian. 2003. Predicting visual quality ratings of turfgrass research plots using spectral reflectance. Paper Number: 031114, ASABE Meeting Presentation.
15
Lukina, E.V.,M.L. Stone, and W.R. Raun. 1999. Estimating vegetation coverage in wheat using digital images. J. Plant Nuter. 22: 341-350.
Martin DL, Wehner DJ, Throssell CS. 1994. Models for predicting the lower limit of the canopy-air temperature difference of two cool season grasses. Crop Sci. 34: 192–198.
Mirik, M., Michels, G.J.Jr., Kassymzhanova-Mirik, S., Elliott, N.C., Catana, V., Jones, D.B., Bowling, R., 2006. Using digital image analysis and spectral reflectance data to quantify damage by greenbug (Hemitera: Aphididae) in winter wheat. Computers and Electronics in Agriculture, 51(1-2): 86-98.
Morris, K.N. 2002. A Guide to NTEP Turfgrass Ratings. The National Turfgrass Evaluation Program (NTEP). http://www.ntep.org/reports/ratings.htm.
NCDA. 2001. North Carolina Turfgrass Survey. North Carolina Department of Agriculture and Consumer Services. Raleigh, North Carolina.
Osborne, S. L., J. S. Schepers, D. D. Francis, and M. R. Schlemmer. 2002b. Use of spectral radiance to estimate in-season biomass and grain yield in nitrogen-and water-stressed corn. Crop Sci. 42(1): 165-171
Rasband, W.S., ImageJ, U. S. National Institutes of Health, Bethesda, Maryland, USA, http://rsb.info.nih.gov/ij/, 1997-2005.
Richardson, M.D., D.E. Karcher, and L.C. Purcell. 2001. Quantifying turfgrass cover using digital image analysis. Crop Sci. 41 :1884–1888.
Rollin, E. M., and E. J. Milton. 1998. Processing of high spectral resolution reflectance data for the retrieval of canopy water content information. Remote Sens. Environ. 65(1): 86-92.
Rouse, J.W., Haas, R.H., Schell, J.A., Deering, D.W., 1973. Monitoring vegetation systems in the Great Plains with ERTS. In: Proceedings, Third ERTS Symposium, NASA Sp-351, vol. 1, Washington, DC, pp. 309–317.
SAS. 2006. SAS User's Guide: Statistics. Ver. 9.1. Cary, N.C.: SAS Institute, Inc.
Sönmez, N.K., Y. Emekli, M. Sari, and R. Bastug. 2008. Relationships between spectral reflectance and water stress conditions of bermudagrass (Cynodon dactylon L.). New Zealand J. Agr. Res. 51:223–263.
Steddom, K., McMullen, M., Schatz, B., Rush, C.M., 2004. Assessing foliar disease of wheat image analysis. In: The 2004 Summer Crops Field Day at Bushland, TX Sponsored by the Cooperative Research, Education & Extension Team (CREET), Bushland, TX, pp. 32–38.
Throssell, C. S., R. N. Carrow, and G. A. Milliken. 1987. Canopy temperature-based irrigation scheduling indices for Kentucky bluegrass turf. Crop Sci. 27:126-131.
Trenholm, L.E., R.N. Carrow, and R.R. Duncan. 1999. Relationship of multispectral radiometry data to qualitative data in turfgrass research. Crop Sci. 39:763–769.
USDA. 1970. Irrigation water requirements. Technical Release No.21. USDA Soil Conservative Service, Washington, DC.
Xiong, X., G.E. Bell, J.B. Solie, M.W. Smith, and B. Martin. 2007. Bermudagrass seasonal responses to nitrogen fertilization and irrigation detected using optical sensing. Crop Sci. 47: 1603–1610.