Comparative Study of the Antioxidant and Anti-Inflammatory ...
24
antioxidants Article Comparative Study of the Antioxidant and Anti-Inflammatory Effects of Leaf Extracts from Four Different Morus alba Genotypes in High Fat Diet-Induced Obesity in Mice Francisco Javier Leyva-Jiménez 1, † , Antonio Jesús Ruiz-Malagón 2,3, † , José Alberto Molina-Tijeras 2,3 , Patricia Diez-Echave 2,3 , Teresa Vezza 2,3 , Laura Hidalgo-García 2,3 , Jesús Lozano-Sánchez 1,4 , David Arráez-Román 1,5 , José Luis Cenis 6 , Antonio Abel Lozano-Pérez 6, * , Alba Rodríguez-Nogales 2,3,7, * , Antonio Segura-Carretero 1,5, ‡ and Julio Gálvez 2,3, ‡ 1 Research and Development Functional Food Centre, Health Science Technological Park, Avenida del Conocimiento 37, E-18016 Granada, Spain; [email protected] (F.J.L.-J.); [email protected] (J.L.-S.); [email protected] (D.A.-R.); [email protected] (A.S.-C.) 2 CIBER-EHD, Department of Pharmacology, Center for Biomedical Research (CIBM), University of Granada, 18071 Granada, Spain; [email protected] (A.J.R.-M.); [email protected] (J.A.M.-T.); [email protected] (P.D.-E.); [email protected] (T.V.); [email protected] (L.H.-G.); [email protected] (J.G.) 3 Instituto de Investigación Biosanitaria de Granada (Ibs. GRANADA), 18071 Granada, Spain 4 Department of Nutrition and Food Science, Center for Biomedical Research (CIBM), University of Granada, 18071 Granada, Spain 5 Department of Analytical Chemistry, University of Granada, 18071 Granada, Spain 6 Departamento de Biotecnología, Genómica y Mejora Vegetal, Instituto Murciano de Investigacióny Desarrollo Agrario y Alimentario, 30150 La Alberca (Murcia), Spain; [email protected] 7 Servicio de Digestivo, Hospital Universitario Virgen de las Nieves, 18012 Granada, Spain * Correspondence: [email protected] (A.A.L.-P.); [email protected] (A.R.-N.); Tel.: +34-958241519 (A.R.-N.) † Both authors contributed equally to the study. ‡ Both authors contributed equally to the supervision of the study. Received: 22 June 2020; Accepted: 7 August 2020; Published: 11 August 2020 Abstract: Increased levels of reactive oxygen species (ROS) and a low-grade chronic inflammation in multiple organs have been demonstrated in obesity. Morus alba leaves extracts (MAEs) have been used in traditional medicine as anti-inflammatory agents. In this work, the bioactive compounds of different genotypes of M. alba L. (Filipina, Valenciana Temprana, Kokuso, and Italia) were analyzed not only by reverse phase high performance liquid chromatography–electrospray ionization-time of flight-mass spectrometry (RP-HPLC-ESI-TOF-MS) and hydrophilic interaction chromatography–electrospray ionization-time of flight-mass spectrometry (HILIC-ESI-TOF-MS), but also screened for in vitro and in vivo antioxidant activity by means of DPPH· radical scavenging assay and Caenorhabditis elegans model. These MAEs were administered daily in a model of diet-induced obesity in mice. Filipina and Italia genotypes significantly reduced weight gain, the glycemic levels in high fat diet, as well as, levels of LDL-cholesterol and triglycerides. Filipina and Italia MAEs also reduced the expression of proinflammatory mediators such as Tnf-α, Il-1β, Il-6 and increased the levels of adiponectin and AMPK, which exert anti-inflammatory effects. Moreover, Italia genotype ameliorated the intestinal barrier function. In conclusion, Filipina and Italia methanolic extracts show the highest antioxidant and anti-inflammatory effect, due to the presence of compounds such as protocatechuic acid or quercetin-3-glucoside, and they could be developed as a complementary treatment for obesity and metabolic disorders. Antioxidants 2020, 9, 733; doi:10.3390/antiox9080733 www.mdpi.com/journal/antioxidants
Transcript of Comparative Study of the Antioxidant and Anti-Inflammatory ...

antioxidants
Article
Comparative Study of the Antioxidant andAnti-Inflammatory Effects of Leaf Extracts from FourDifferent Morus alba Genotypes in High FatDiet-Induced Obesity in Mice
Francisco Javier Leyva-Jiménez 1,†, Antonio Jesús Ruiz-Malagón 2,3,† ,José Alberto Molina-Tijeras 2,3 , Patricia Diez-Echave 2,3, Teresa Vezza 2,3,Laura Hidalgo-García 2,3, Jesús Lozano-Sánchez 1,4 , David Arráez-Román 1,5 ,José Luis Cenis 6, Antonio Abel Lozano-Pérez 6,* , Alba Rodríguez-Nogales 2,3,7,* ,Antonio Segura-Carretero 1,5,‡ and Julio Gálvez 2,3,‡
1 Research and Development Functional Food Centre, Health Science Technological Park, Avenida delConocimiento 37, E-18016 Granada, Spain; [email protected] (F.J.L.-J.); [email protected] (J.L.-S.);[email protected] (D.A.-R.); [email protected] (A.S.-C.)
2 CIBER-EHD, Department of Pharmacology, Center for Biomedical Research (CIBM), University of Granada,18071 Granada, Spain; [email protected] (A.J.R.-M.); [email protected] (J.A.M.-T.);[email protected] (P.D.-E.); [email protected] (T.V.); [email protected] (L.H.-G.);[email protected] (J.G.)
3 Instituto de Investigación Biosanitaria de Granada (Ibs. GRANADA), 18071 Granada, Spain4 Department of Nutrition and Food Science, Center for Biomedical Research (CIBM), University of Granada,
18071 Granada, Spain5 Department of Analytical Chemistry, University of Granada, 18071 Granada, Spain6 Departamento de Biotecnología, Genómica y Mejora Vegetal, Instituto Murciano de Investigación y
Desarrollo Agrario y Alimentario, 30150 La Alberca (Murcia), Spain; [email protected] Servicio de Digestivo, Hospital Universitario Virgen de las Nieves, 18012 Granada, Spain* Correspondence: [email protected] (A.A.L.-P.); [email protected] (A.R.-N.); Tel.: +34-958241519 (A.R.-N.)† Both authors contributed equally to the study.‡ Both authors contributed equally to the supervision of the study.
Received: 22 June 2020; Accepted: 7 August 2020; Published: 11 August 2020�����������������
Abstract: Increased levels of reactive oxygen species (ROS) and a low-grade chronic inflammation inmultiple organs have been demonstrated in obesity. Morus alba leaves extracts (MAEs) have been usedin traditional medicine as anti-inflammatory agents. In this work, the bioactive compounds of differentgenotypes of M. alba L. (Filipina, Valenciana Temprana, Kokuso, and Italia) were analyzed not only byreverse phase high performance liquid chromatography–electrospray ionization-time of flight-massspectrometry (RP-HPLC-ESI-TOF-MS) and hydrophilic interaction chromatography–electrosprayionization-time of flight-mass spectrometry (HILIC-ESI-TOF-MS), but also screened for in vitro andin vivo antioxidant activity by means of DPPH· radical scavenging assay and Caenorhabditis elegansmodel. These MAEs were administered daily in a model of diet-induced obesity in mice. Filipinaand Italia genotypes significantly reduced weight gain, the glycemic levels in high fat diet, as wellas, levels of LDL-cholesterol and triglycerides. Filipina and Italia MAEs also reduced the expressionof proinflammatory mediators such as Tnf-α, Il-1β, Il-6 and increased the levels of adiponectin andAMPK, which exert anti-inflammatory effects. Moreover, Italia genotype ameliorated the intestinalbarrier function. In conclusion, Filipina and Italia methanolic extracts show the highest antioxidantand anti-inflammatory effect, due to the presence of compounds such as protocatechuic acid orquercetin-3-glucoside, and they could be developed as a complementary treatment for obesity andmetabolic disorders.
Antioxidants 2020, 9, 733; doi:10.3390/antiox9080733 www.mdpi.com/journal/antioxidants
Antioxidants 2020, 9, 733 2 of 24
Keywords: Morus alba leaves; high fat diet; obesity; chemical characterization; anti-inflammatory;metabolic disorders
1. Introduction
According to recent epidemiologic reports, the prevalence of obesity is reaffirming an alarmingrate all over the world. Results show an increasing prevalence in both women and men, and also inchildren, estimating that 107 million children and 603 million adults were obese in 2015, consideringobesity as an epidemic [1]. Obesity is defined as excessive body fat accumulation caused by a positiveenergy balance, that could lead a cluster of conditions such as high blood pressure, insulin resistance ordyslipidemia, being closely related to metabolic syndrome, which causes organic disorders, increasingthe risk to suffer diabetes or liver and heart diseases [2]. In obese individuals, the presence of low-gradechronic inflammation in multiple organs has been demonstrated and its origin has been related tochanges in cells of metabolic tissues in response to excess nutrients and energy [3]. These disorderscan be ameliorated with an improved lifestyle, including exercise and healthy food habits, and mayinclude pharmacological approaches. When considering the latter, the irregular weight loss obtainedand the costs of pharmacotherapy, including the risks of serious adverse effects, make this strategy anunsuccessful alternative. Therefore, in the last decades, efforts have been focused on the discovery ofsafer and more effective treatments, like those involving bioactive compounds from natural sourcescapable of ameliorating obesity [4].
In this scenario, mulberry, Morus alba L., is a deciduous tree native from the foothills ofthe Himalayas in China and disseminated first to Korea and Japan and after to India, Persia, Europe,and South and North America [5] due to its great genetic variability and adaptability to differentenvironmental conditions [6]. Mulberry leaves have been traditionally used as infusions in TraditionalChinese Medicine to alleviate fever, strengthen joints, or treat constipation and have gained growinginterest worldwide due to their bioactive components [7,8]. Mulberry plantations spread along the “SilkRoad”, as the use of silkworms to produce silk for textile applications reached southern Europeancountries such as Italy, France, Spain, or Portugal. The importance of M. alba L. arises from the factthat their leaves are the only food source of the silkworm (Bombyx mori L.) As a consequence, theyare an essential part of sericulture activity, what is still very important in Asian countries, such asChina, India, and Pakistan, among others [6]. M. alba leaves present considerable nutritional value andhigh-quality proteins. They are often used in India as a dietary supplement by mixing with flour andas a ruminant food [9].
Recent studies have reported several bioactive properties of M. alba such as antibacterial,antioxidant, anti-obesogenic, or hypoglycemic activities [10–13]. The healthy properties of mulberryhave been related to the content of phytochemical in its leaves and fruits, such as flavonoids or phenolicacids [14].
The composition of mulberry leaves is strongly related to the harvest season, geographic location,and the studied variety of Morus [15]. Additionally, the extraction method applied in order to obtaina bioactive extract can also be crucial for the final chemical composition. In this sense, plant extractswith bioactive compounds have been traditionally obtained through conventional extractions such asmaceration or infusion [16], but innovative techniques such as pressurized liquid extraction (PLE) areclaimed as better in extraction yield and in terms of variety of obtained compounds [17]. Actually,the chemical characterization of the phytochemicals in M. alba leaf extract can be a complex tasksince it has a huge variety of structures including phenolic compounds and sugars. Generally, C18reversed-phase high-performance-liquid chromatography (RP-HPLC) has been applied to characterizethe phenolic fraction [5] coupled to different detectors in order to ensure an exhaustive characterizationsuch as diode-array detection (DAD) and mass spectrometry (MS).

Antioxidants 2020, 9, 733 3 of 24
In this study, the extracts containing bioactive compounds from four genotypes of M. alba (Italia,Kokuso, Filipina, and Valenciana Temprana) were retrieved from leaves using PLE and characterizedapplying RP-HPLC coupled to time-of-flight mass spectrometry, in order to determine the chemicalcomposition of all the extracts. The obtained extracts were screened for in vivo antioxidant activityin a C. elegans model and also tested in a diet-induced obesity mice model in order to comparethe modulation of obesity-related biochemical markers regulated by all genotypes. Furthermore,the comprehensive characterization enabled to establish a relation between chemical composition andbeneficial effects against experimentally-induced obesity.
2. Materials and Methods
2.1. Reagents
All reagents used in this research were analytical or HPLC grade and were used without furtherpurification. As far as the extraction procedure is concerned, water was purified by a Milli-Q systemfrom Millipore (Bedford, MA, USA) and ethanol was purchased from VWR chemicals (Radnor, PA,USA). The analytical procedure was performed using: (a) LC-MS grade acetonitrile and ammoniumformate, which were purchased from Fisher chemicals (Waltham, MA, USA); (b) formic acid waspurchased from Sigma-Aldrich (Steinheim, Germany). The calibration curves were performedusing commercial standards (quinic acid, protocatechuic acid, 3,5-methoxy-4-hydroxy cinnamic acid,chlorogenic acid, rutin, kaempferol-3-rutinoside, quercetin-3- glucoside, kaempferol-3-glucoside,and quercetin) purchased either from Fluka, Extrasynthese (GenayCedex, France), or Sigma-Aldrich(Steinheim, Germany). Both 2,2-diphenyl-1-picrylhydrazyl radical (DPPH·) and H2O2 were purchasedfrom Merck (Merck KGaA, Darmstadt, Germany).
2.2. Plant Materials and Extraction Procedure of Bioactive Compounds from M. alba
Four M. alba genotypes, as representative examples of those well acclimated to the Mediterraneanenvironmental conditions, were used in the experiment. All of those are part of the MulberryGermplasm Bank of the Sericulture Program at the Instituto Murciano de Investigación y DesarrolloAgrario y Alimentario (IMIDA), Murcia (Spain). The references of the genotypes in the collection where:BGMU 050 10009 (Italia); BGMU 050 20010 (Filipina); BGMU 050 10003 (Kokuso); and BGMU 050 10040(Valenciana Temprana) (IMIDA coordinates: Long. 37.9388011, Lat. -1.1333683, Alt. 54 m.). The selectedgenotypes produce leaves very suitable for feeding silkworms and are tolerant to the dry and warmconditions of the southeast of Spain [18]. The leaves were collected during the first week of May,washed with tap water, and dried over absorbent paper, frozen at −80 ◦C and lyophilized at −55 ◦Cfor 72 h in a Christ Alpha 1-2 LDPlus (Martin Christ, Osterode am Harz, Germany). Dry leaves weregrounded by using an ultra-centrifugal mill ZM200 (Restch GmbH, Haan, Germany). After milling,samples were shaded and kept at room temperature until extraction. The extraction of bioactivecompounds from mulberry was performed using a pressurized liquid extractor (ASE™ 350 system,Dionex, Sunnyvale, CA, USA) equipped with a solvent controller. The extractions were accomplishedusing a mixture ethanol/H2O 50:50 (v:v) as solvent, at 200 ◦C for 20 min in static cycle. The pressure waspre-set at 1500 psi. Briefly, 3.75 g of sample was mixed with 11.25 g of sea sand and loaded onto 33 mLstainless-steel extraction cells. Cellulose filters and two portions of sea sand (5 g) were placed at eachend of the cell to avoid clogging of metal frits. After extraction, the obtained extracts were immediatelycooled in ice to attain a temperature of 20–25 ◦C. The extracts were finally filtered through 0.45 µmfilters and the supernatants were dried under vacuum in a Savant™ SpeedVac Concentrator SC250EXP (Thermo Scientific, Sunnyvale, CA, USA) and frozen at −20 ◦C until the analysis was performed.
2.3. RP-HPLC-ESI-TOF-MS Analysis
Samples were prepared at 2500 mg/L by dissolving the appropriate amount of extract obtained byPLE in the same solvents used in extractions. M. alba extracts (MAEs) were analyzed using a RRLC 1200

Antioxidants 2020, 9, 733 4 of 24
series (Agilent Technologies, Palo Alto, CA, USA), equipped with a vacuum degasser, autosampler,a binary pump, and a DAD detector. The separation of the phenolic fraction was conducted by a ZorbaxEclipse Plus C18 whose sizes were 150 mm × 4.6 mm id, 1.8 µm (Agilent Technologies, Palo Alto, CA,USA) where the eluent A was water/acetonitrile 90:10 (v:v) and formic acid added at 0.1%, whereaseluent B was only acetonitrile. The flow was held at 0.5 mL/min during 45 min using the followingmultistep linear gradient: 0 min, 5% B; 15 min, 65% B; 36 min, 95% B; 40 min, 5% B; and finally,a conditioning cycle of 5 min with the initial conditions for the next analysis. Then, 10 µL of the samplewas injected and the separation of the compounds was carried out at 25 ◦C.
The HPLC system was coupled to a time-of-flight mass spectrometer (micrOTOF, BrukerDaltonikGmbH, Bremen, Germany) that comprised an electrospray interface (ESI) (model G1607 from AgilentTechnologies, Palo Alto, CA, USA) operating in negative ionization mode. To ensure a correctionization of the analytes, a “T” type splitter was used to reduce the flow towards mass spectrometer.The parameters of the source were optimized and set as follows: capillary voltage of +4 kV; dryinggas temperature, 210 ◦C; drying gas flow, 9 L/min; and nebulizing gas pressure, 2.3 bar. The values oftransfer parameters were capillary exit, −120 V; skimmer 1, −40 V; hexapole 1, −23 V; RF hexapole,80 Vpp; and skimmer 2, −20 V. The detection mass range was from 50 to 1000 m/z.
External mass spectrometer calibration was performed in quadratic high-precision calibration(HPC) regression mode passing a solution containing sodium acetate clusters (5 mM sodium hydroxidein H2O/2-propanol 1/1 (v/v), with 0.2% of acetic acid). With this method, an exact calibration curve wasachieved based on numerous cluster masses, each differing by 82 Da (C2H3NaO2). The calibrationsolution was injected at the beginning of the run using a Cole Palmer syringe pump (Vernon Hills, Illinois,USA) and all the spectra were calibrated prior to polar compounds characterization. The accuratemass data for the molecular ions were processed through Data Analysis 4.0 software (Bruker Daltonics,Bremen, Germany) which provided a list of possible elemental formulas by using the GenerateMolecular Formula TM editor. The latter uses a CHNO algorithm that provides standard functionalitiessuch as minimum/maximum elemental range, and ring-plus double-bond equivalents, as well asa sophisticated comparison of the theoretical with the measured isotope pattern (mSigma value) forincreasing the confidence in the suggested molecular formula. According to the literature, the widelyaccepted accuracy threshold for confirming elemental compositions was established at 5 ppm for mostof the compounds [19].
Quantitation of identified analytes was carried out by HPLC-ESI-TOF-MS. For that purpose,nine standards curves were performed to quantify the compounds present in leaves: quinicacid, protocatechuic acid, 3,5-dimethoxy-4-hydroxy cinnamic acid, chlorogenic acid, rutin,kaempferol-3-rutinoside, quercetin-3-glucoside, kaempferol-3-glucoside, and quercetin stock ofstandards were prepared at 1000 mg/L diluting with methanol to working concentrations.
2.4. DPPH·Scavenging Activity
The radical scavenging activity (RSA) was analyzed following the method described by Yen andDuh [20], with some modifications. Briefly, 50 µL of methanolic extract was added to Eppendorf tubescontaining 850 µL of methanol, and then 100 µL of 1 mM DPPH·(in methanol) were added. After30 min of reaction at 25 ◦C, protected from light, the scavenging activities of the samples and standards(ascorbic acid, 10–500 µM in methanol) were evaluated by measuring the absorbance at 515 nm, ina Synergy MX UV–Vis spectrometer (BioTek Instruments Inc; Winooski, VT, USA). For each sampleconcentration tested, the inhibition percentage (I%) of DPPH· in the steady state was determined usingthe equation:
I% =
(AbsBlank −AbsSample
)AbsBlank
× 100. (1)

Antioxidants 2020, 9, 733 5 of 24
where AbsBlank and AbsSample are the absorbance at 515 nm of the blank and the samples respectively.The results were expressed as micromols of ascorbic acid equivalents per gram of dry extract (µmolAAE/g DE).
2.5. Oxidative Stress Assays
To validate the potential antioxidant activity of MAEs, C. elegans wild type strain N2 (CaenorhabditisGenetics Center at the University of Minnesota, Minneapolis, MN, USA) was used as previouslyreported [21]. For this purpose, C. elegans wild type strain N2 was grown in nematode growth medium(NGM: Agar 17.5 g/L, sodium chloride 3.0 g/L, peptone 2.5 g/L, cholesterol 0.005 g/L) on agar plateswith (i) a lawn of E.coli OP50 (control media); (ii) a lawn of E.coli OP50 and Vitamin C (10 µg/mL)(positive control); and (iii) a lawn of E.coli OP50 and MAE dissolved in DMSO (100 µg/mL). Wormswere incubated at 20 ◦C for 5 days, and then transferred to a medium with 3 mM of H2O2. After 5 hof incubation, worm viability was scored. Experiments were performed in triplicate and repeatedthree times.
2.6. Effects of MAEs on High Fat Diet Fed Mice
2.6.1. Animals and Treatments
The study was carried out in accordance with the ‘Guide for the Care and Use of LaboratoryAnimals’ as promulgated by the National Institute of Health, and the protocols approved by the EthicCommittee of Laboratory Animals of the University of Granada (Spain) (Ref. No. 28/03/2016/030).Male 6-week-old C57BL/6J mice (Janvier, St Berthevin, France) were housed in Makrolon cages (5 miceper cage) with a 12-h light/dark cycle and temperature and humidity-controlled facility (22 ± 1 ◦C, 55± 10% relative humidity). Mice were randomly divided into several groups (n = 10): control, obese,and four groups of obese mice treated with four MAEs. Control mice received a normal chow diet(NCD, 13% calories from fat, 20% calories from protein, and 67% calories from carbohydrate) (Globaldiet 2014; Harlan Laboratories, Barcelona, Spain), whereas obese mice were fed a high fat diet (HFD) inwhich 60% of their caloric content was derived from fat (Purified diet 230 HF; Scientific Animal Food &Engineering, Augy, France). MAE was dissolved in water (vehicle) and administered daily in a dose of10 mg/kg by oral gavage. Control and obese groups were daily gavaged with the vehicle. The treatmentwas followed for 6 weeks, and animal body weight, food, and water intake were monitored regularlyevery 3 days. These data were used to calculate the energy efficiency, which is the ratio betweenthe final weight gain (g) and the total energy intake (kcal) during the period of the experiment (g/kcal).It was calculated using the formula: weight gain (g)/total energy intake (kcal).
2.6.2. Glucose Tolerance Test
One week before the sacrifice, mice fasted for 8 h underwent a glucose tolerance test. Glucosewas administered from a 50% solution in water in a dose of 2 g/kg of body weight by intraperitonealinjection. Blood was collected at 0, 15, 30, 60, and 120 min after treatment from the tail vein and usedto measure glucose levels with a handheld glucometer (Contour XT, Ascensia Diabetes Care, S.L.,Barcelona, Spain).
2.6.3. Plasma Determinations
Blood samples were collected at the end of the treatment in ice-cold tubes containing heparin.Plasma was obtained after centrifugation at 5000× g for 20 min at 4 ◦C. Plasma glucose, LDL (low-densitylipoprotein) cholesterol, HDL (high-density lipoprotein) cholesterol, total cholesterol, and triglyceridesconcentrations were analyzed by colorimetric methods using Spinreact kits (Spinreact, S.A., Girona,Spain).

Antioxidants 2020, 9, 733 6 of 24
2.6.4. Morphological Variables
After mice sacrifice, epididymal and abdominal fat was collected and weighed in order to calculatethe fat weight index by dividing the fat weight by the tibia length. All tissue samples were frozen andthen stored at −80 ◦C.
2.6.5. Analysis of Gene Expression by RT-qPCR
RNA was extracted from samples of liver, fat, and colon using NucleoZOL (Macherey-Nagel,Düren, Germany), following the manufacturer’s recommendations. Oligo(dT) primers (Promega,Southampton, UK) were used to carry out reverse transcription. Real time quantitative PCRamplification and detection was performed on optical-grade 48 well plates in EcoTM Real TimePCR System (Illumina, San Diego, CA, USA) with 20 ng of cDNA, the KAPA SYBR ® FAST qPCRMaster Mix (KAPA Biosystems, Wilmington, MA, USA), and specific primers whose annealingtemperature is showed in Table 1. Glyceraldehyde 3-phosphate dehydrogenase housekeeping gene(Gapdh) was used to normalize gene expression. The mRNA relative quantitation was calculated usingthe ∆∆Ct method.
Table 1. Primer sequences used in real-time PCR assays.
Gen Sequence 5′-3′ SequenceAccession Number
AnnealingTemperature (◦C)
Gapdh D: CCATCACCATCTTCCAGGAGR: CCTGCTTCACCACCTTCTTG AK002273.1 60
Il-1β D: TGATGAGAATGACCTCTTCTR: CTTCTTCAAAGATGAAGGAAA AK225002.1 60
Tnf-α D: AACTAGTGGTGCCAGCCGATR: CTTCACAGAGCAATGACTCC AK159989.1 60
Il-6 D: TAGTCCTTCCTACCCCAATTTCCR: TTGGTCCTTAGCCACTCCTTCC AK152189.1 60
Jnk-1 D: GATTTTGGACTGGCGAGGACTR: TAGCCCATGCCGAGAATGA BC053027.1 60
Jnk-2 D: TTGTGCTGCTTTTGATACAGTTCTTGGGR: CTGGAAAGAGCTCTTCAAATTTGAT AK031959.1 62
Mcp-1 D: AGCCAACTCTCACTGAAGR: TCTCCAGCCTACTCATTG AK150937.1 55
Leptin D: TTCACACACGCAGTCGGTATR: GCTGGTGAGGACCTGTTGAT KX255818.1 60
Leptin-r D: GCAGTCCTCAGTGGCACCTCR: CACCGTGGGGCTACTGGAGAG AK143989.1 60
Ampk D: GACTTCCTTCACAGCCTCATCR:CGCGCGACTATCAAAGACATACG AK160612.1 60
Ppar-α D: AGGCTGTAAGGGCTTCTTTCGR: GGCATTTGTTCCGGTTCTTC AK035676.1 62
Ppar-β D: TAGGACTGGTGATCTGTGAGR: TACAAGTGAGTGGGAGAGAG AK028464.1 60
Ppar-γ D: CAGTACAGCCCCGATGACTCR: GAAAGCTCGTCCACGTCAG AH013273.2 62
Glut-4 D: GAGAATACAGCTAGGACCAGTGR:TCTTATTGCAGCAGCGCCTGAG AK137607.1 62
Tlr-4 D: GCCTTTCAGGGAATTAAGCTCCR: AGATCAACCGATGGACGTGTAA JX878359.1 60
Adiponectin D: GATGGCAGAGATGGCACTCCR: CTTGCCAGTGCTGCCGTCAT AK003138.1 56
Lpl D: TTCCAGCCAGGATGCAACAR: GGTCCACGTCTCCGAGTCC AK150328.1 60
Muc-1 D: GCAGTCCTCAGTGGCACCTCR: CACCGTGGGCTACTGGAGAG BG005441.1 60

Antioxidants 2020, 9, 733 7 of 24
Table 1. Cont.
Gen Sequence 5′-3′ SequenceAccession Number
AnnealingTemperature (◦C)
Muc-2 D: GCAGTCCTCAGTGGCACCTCR: CACCGTGGGGCTACTGGAGAG AK008250.1 60
Muc-3 D: CGTGGTCAACTGCGAGAATGGR: CGGCTCTATCTCTACGCTCTCC AK136468.1 60
Occludin D: ACGGACCCTGACCACTATGAR: TCAGCAGCAGCCATGTACTC AK019880.1 56
Tff-3 D: CCTGGTTGCTGGGTCCTCTGR:GCCACGGTTGTTACACTGCTC D38410.1 60
Zo-1 D: GGGGCCTACACTGATCAAGAR: TGGAGATGAGGCTTCTGCTT AK144506.1 56
2.6.6. Histological Studies
Samples of liver and epididymal adipose tissue were fixed in 4% PFA, embedded in paraffin, and5 µm-thick sections were taken. Then these sections were stained with hematoxylin and eosin. Inaddition, liver sections were fixed in 30% sucrose, embedded in OCT compound (Tissue-Tek® O.C.T.Compound, Sakura® Finetek, United States), and frozen with isopentane at −40 ◦C. Then, 8 µm-thicksections were taken and stained with oil red and hematoxylin. An independent pathologist unawareof the experiment evaluated the inflammation and fat accumulation in the histological sections.
2.7. Statistics
All results are expressed as the mean ± SEM. Differences between means were assessed forstatistical significance using a one-way analysis of variance (ANOVA) and post hoc least significancetest. The chi-squared test was used to analyze differences between proportions. All these statisticalanalyses were carried out with the GraphPad 5.0 software package (GraphPad Software, Inc., La Jolla,CA, USA), the statistical significance was set at p ≤ 0.05.
3. Results and Discussion
3.1. Analytical Characterization of Phytochemicals in MAEs Yielded by PLE Conditions
With the purpose to determine the chemical profile of mulberry extracts and in order to establishcompositional differences, a complete RP-HPLC-ESI-TOF-MS analysis was accomplished. Figure 1includes the MAE chromatograms where the main compounds were numbered in accordance withtheir elution order. In this sense, a total of 56 compounds were detected in the MAE where the Filipinagenotype showed the most complex profile (46 compounds).
Minor number of phytochemicals were determined in Valenciana Temprana genotype (38compounds). The chemical characterization was based on the interpretation of the MS spectraand the data available on the literature. According to their chemical structure, phytochemicals wereclassified into six groups: organic acids, benzoic acids, cinnamic acids, flavonoids, fatty acids, andothers. Unfortunately, the mass data provided by TOF-MS and data suitable on bibliography didnot allow the characterization of ten compounds. Thus, Table 2 summarizes the tentative name ofcompounds accompanied by their number of peaks, retention time (RT), experimental m/z, deprotonatedmolecular formula, and also the presence in different MAE.

Antioxidants 2020, 9, 733 8 of 24
Antioxidants 2020, 9, x FOR PEER REVIEW 7 of 24
2.6.6. Histological Studies.
Samples of liver and epididymal adipose tissue were fixed in 4% PFA, embedded in paraffin, and 5 µm-thick sections were taken. Then these sections were stained with hematoxylin and eosin. In addition, liver sections were fixed in 30% sucrose, embedded in OCT compound (Tissue-Tek® O.C.T. Compound, Sakura® Finetek, United States), and frozen with isopentane at −40 °C. Then, 8 µm-thick sections were taken and stained with oil red and hematoxylin. An independent pathologist unaware of the experiment evaluated the inflammation and fat accumulation in the histological sections.
2.7. Statistics
All results are expressed as the mean ± SEM. Differences between means were assessed for statistical significance using a one-way analysis of variance (ANOVA) and post hoc least significance test. The chi-squared test was used to analyze differences between proportions. All these statistical analyses were carried out with the GraphPad 5.0 software package (GraphPad Software, Inc., La Jolla, CA, USA), the statistical significance was set at p ≤ 0.05.
3. Results and Discussion
3.1. Analytical Characterization of Phytochemicals in MAEs Yielded by PLE Conditions
With the purpose to determine the chemical profile of mulberry extracts and in order to establish compositional differences, a complete RP-HPLC-ESI-TOF-MS analysis was accomplished. Figure 1 includes the MAE chromatograms where the main compounds were numbered in accordance with their elution order. In this sense, a total of 56 compounds were detected in the MAE where the Filipina genotype showed the most complex profile (46 compounds).
Figure 1. Characterization of extracted compounds of Morus Alba leaves using reverse phase high performance liquid chromatography–electrospray ionization-time of flight-mass spectrometry (RP-HPLC-ESI-TOF-MS) .
R: TCAGCAGCAGCCATGTACTC
Tff-3 D: CCTGGTTGCTGGGTCCTCTG R:GCCACGGTTGTTACACTGCTC
D38410.1 60
Zo-1 D: GGGGCCTACACTGATCAAGA R: TGGAGATGAGGCTTCTGCTT AK144506.1 56
Figure 1. Characterization of extracted compounds of Morus Alba leaves using reverse phasehigh performance liquid chromatography–electrospray ionization-time of flight-mass spectrometry(RP-HPLC-ESI-TOF-MS).
Table 2. Phytochemical composition of the analyzed M. alba leaves.
Cmpd RT(min)
m/z Exp MolecularFormula
Tentative IdentificationPresence
I K F V
Organic Acids2 1.9 191.0572 C7H11O6 Quinic acid + + + +
Benzoic Acids3 5.1 315.0722 C13H15O9 Protocatechuic acid hexoside + + + +4 5.6 459.1122 C19H23O13 Parishin E +
26 10.5 469.1704 C22H29O11 Rengyoside D +28 10.8 135.0455 C8H7O2 Methyl salicyl aldehyde +36 14.5 221.1179 C13H17O3 Hexyl salicylate + + + +52 24.3 265.1448 C15H21O4 Gingerol + + + +
Cinnamic Acids5 5.8 353.0881 C16H17O9 Neochlorogenic acid + + + +7 6.6 353.0865 C16H17O9 Chlorogenic acid + + + +8 6.7 353.0876 C16H17O9 Cryptochlorogenic acid + + + +9 6.9 359.0758 C18H15O8 Rosemarinic acid + + + +
11 7.2 353.085 C16H17O9 Chlorogenic acid isomer + + + +22 9.3 515.1186 C25H23O12 Caffeoylquinic acid hexoside +31 12.1 207.0659 C11H11O4 Dimethoxy-cinnamic acid + + + +32 12.6 163.0391 C9H7O3 Coumaric acid + + +
Flavonoids6 6.2 625.1420 C27H29O17 Quercetin dihexoside + + + +
12 7.3 755.2031 C33H39O20 Kaempferol rutinoside hexoside +14 7.7 609.1469 C27H29O16 Rutin isomer 1 + +15 8.0 609.1467 C27H29O16 Rutin isomer 2 + + + +17 8.4 463.0879 C21H19O12 Quercetin-3-glucoside + + + +18 8.6 593.1510 C27H29O15 Kaempferol-3-o-rutinoside + + + +19 8.7 505.0990 C23H21O13 Quercetin-3-O-(6-acetylglucoside) isomer 1 + + +20 9.0 447.0908 C21H19O11 Kaempferol 3-o-glucoside + + + +

Antioxidants 2020, 9, 733 9 of 24
Table 2. Cont.
Cmpd RT(min)
m/z Exp MolecularFormula
Tentative IdentificationPresence
I K F V
21 9.2 505.0997 C23H21O13 Quercetin-3-O-(6-acetylglucoside) isomer 2 + + +
23 9.4 489.1040 C23H21O12Kaempferol-3-o-6”-o-acetyl-β-d
glucopyranoside isomer 1 + + +
24 9.7 505.0997 C23H21O13 Quercetin-3-O-(6-acetylglucoside) isomer 3 + + +
25 10.0 489.1040 C23H21O12Kaempferol-3-o-6”-o-acetyl-β-d
glucopyranoside isomer 2 + + +
30 11.5 301.0357 C15H9O7 Quercetin + + + +
Fatty Acids33 13.1 183.1398 C11H19O2 Undecenoic acid + + + +34 13.7 309.2057 C18H29O4 Linoleic acid hydroperoxide isomer 1 + + + +35 13.9 309.2057 C18H29O4 Linoleic acid hydroperoxide isomer 2 + + + +37 15.7 309.2074 C18H29O4 Linoleic acid hydroperoxide isomer 3 + + + +44 18.6 337.2356 C20H33O4 Dihydroxy eicosatrienoic acid +46 19.2 293.2161 C18H29O3 Hydroxy octadecatrienoic acid isomer 1 + + +47 19.5 293.2161 C18H29O3 Hydroxy octadecatrienoic acid isomer 2 + + +48 20.6 291.1949 C18H27O3 Hydroxyperoxy octadecatrienoic acid + + +49 20.9 561.3249 C28H49O11 Dioxo-penta-oxatritriacontanedioic acid +50 21.2 295.2252 C18H31O3 Hydroxy octadecadienoic acid + + +51 21.5 221.1530 C14H21O2 Myristic acid + + + +55 29.4 277.2155 C18H29O2 Linolenic acid + + + +56 33.0 279.2315 C18H31O2 Linoleic acid + + + +
Others1 1.9 341.1100 C12H21O11 Sugar + + + +
13 7.6 481.1332 C22H25O12 Fumaroprotocetraric acid isomer 1 + + + +16 8.3 481.1338 C22H25O12 Fumaroprotocetraric acid isomer 2 + +42 17.7 593.2674 C30H41O12 Aceroside VIII + + +54 27.1 555.2819 C28H43O11 Picrasinoside F +
Unknowns10 7.1 431.1905 C20H31O10 Unk 1 +27 10.5 459.2232 C22H35O10 Unk 2 +29 11.2 357.0613 C18H13O8 Unk 3 +38 16.0 721.3611 C34H57O16 Unk 4 + + + +39 16.4 721.3620 C34H57O16 Unk 5 + + + +
40 17.0 562.3133 C26H36N13O2
Unk 6 + + + +
41 17.4 552.2667 C24H42NO13 Unk 7 +43 18.5 559.3124 C28H47O11 Unk 8 + + + +45 18.9 559.3105 C28H47O11 Unk 9 + + + +53 26.5 481.2502 C25H37O9 Unk 10 +
I: Italia; K: Kokuso; F: Filipina; and V: Valenciana Temprana. (+) Presence in the Methanolic extract.
Regarding the organic acid group, only one compound (peak 2) was detected in all MAE. Thiscompound was characterized as quinic acid according to the displayed molecular formula (C7H12O6)and elution order which were similar to a previous work [22].
Furthermore, the analytical method performed allowed the detection of fourteen phenolic acids.From them, six benzoic acids were successfully characterized. Peak 3 yielded a m/z at 315.0722 andwas tentatively characterized as protocatechuic acid hexoside, being detected in all MAE. Indeed,protocatechuic acid and derivatives have previously been described in the literature [21]. In addition,peak 4 showed a deprotonated molecular formula C19H23O13 and m/z at 459.1122 allowing itscharacterization as parishin E. This compound was only detected in Filipina MAE. Compound 26gave a molecular formula C22H30O11. This phytochemical, which was only found in Italia MAE,was associated to rengyoside D since it was previously detected in plants from the same class [23].Besides, two salicylic acid derivatives were also identified. The first eluted derivative was methylsalicyl

Antioxidants 2020, 9, 733 10 of 24
aldehyde (peak 28). This compound was only found in Valenciana Temprana MAE, while the second one(peak 36), which provided a m/z at 221.1179 and was assigned to hexyl salicylate, was presented in allgenotypes. Finally, peak 52, which was detected in all MAEs, was tentatively identified as gingerol [24].
With regard to cinnamic acids, five caffeoylquinic acid derivatives were tentatively characterizedin MAE. Four of them (peaks 5, 7, 8 and 9), gave the same molecular formula C16H18O9 and wereassociated to chlorogenic acid isomers. The elution order enabled the characterization of each isomerby comparison with data compiled from literature [24]. These compounds are found in largeramounts in mulberry extracts [5,22]. Compound 22 with a m/z at 515.1186 was characterized ascaffeoylquinic acid hexoside [22]. Moreover, peak 31 was characterized as dimethoxy-cinnamic acidsince it gave a molecular formula C11H12O4. Its identification was proposed due to different cinnamicacid derivatives previously described in M. alba leaves [24]. At last, compound 32 was tentativelyattributed to p-coumaric acid [5].
In the case of flavonoids, thirteen compounds were detected and characterized, which weremainly kaempferol or quercetin derivatives. Thus, peak 6 was identified as quercetin diglucoside [22].Moreover, it was possible to verify that peak 17 was quercetin-3-glucoside by comparison withthe MS spectrum and retention time of the available commercial standard. With the same procedure,quercetin was associated to peak 30. Furthermore, three compounds (peaks 19, 21, and 24) gavethe same deprotonated molecular formula C23H21O13 and were found in a range of time between 8.7 to9.7 min, indicating that they are quercetin-3-O-(6-acetylglucoside) isomers, as previously reported [22].Conversely, five kaempferol derivatives were also detected; all of them were bonded to one or moresugar moieties. Thereby, peak 12 showed a retention time at 7.3 min and an m/z at 755.2031. Thisinformation allowed its tentative identification as kaempferol rutinoside hexoside. Another kaempferolderivative was associated to peak 18, specifically kaempferol-3-rutinoside. It was only found inValenciana Temprana MAE. In addition, peak 20 gave a retention time at 9.0 min and a molecularformula C21H20O11. This compound was associated to kaempferol-3-glucoside and it was verified withthe available standard. Finally, two compounds (23 and 25) were found in Italia, Kokuso, and FilipinaMAE and they were characterized as kaempferol-3-o-6-acetylglucopyranoside isomers according tothe information available in literature [5,22]. To conclude with this phenolic group, two rutin isomerswere related to peak 14 and 15. However, only the first isomer was only detected in Kokuso andFilipina MAE.
A total of thirteen fatty acid derivatives were found, many of them were isomers of hydroxylatedfatty acids. For instance, peaks 34, 35, and 36 gave the same molecular formula and they were eluted atsimilar retention time, so they were identified as linoleic acid hydroperoxide isomers. Moreover, twoisomers of hydroxy-octadecatrienoic acid were also detected (peak 46 and 47). All of these compoundswere previously found in M. nigra [24]. Additionally, a derivate form of hydroxy-octadecatrienoicacid was found at 20.6 min. The compound 48 presented a molecular formula of C18H28O3 and wastentatively identified as hydroxyperoxy-octadecatrienoic acid. Besides, compound 50 gave a similarformula (C18H31O3), which, together with data suitable in literature, was possible to characterize ashydroxy- octadecadienoic acid [24]. Dihydroxy-eicosatrienoic acid, another unsaturated fatty acidderivative, was characterized to peak 44 that was only found in Filipina MAE. Its assignation was basedon the presence of fatty acids in plants extracts of the same genus [24]. Peak 55 and 56 were found inall MAEs. They were characterized as linolenic acid and linoleic acid, respectively, since both of themhave previously been described in M. nigra [24]. Furthermore, three saturated fatty acids were alsofound, one of them was dioxo-penta-oxatritricontanedioic acid, which showed a molecular formula,C28H50O11. Peak 33, the first eluted fatty acid, was attributed to undecenoic acid [24]. Finally, myristicacid was detected and associated to compound 51 since it showed a molecular formula, C14H22O2.These compounds were found in all studied extracts.
On the other hand, compounds 1, 13, 16, 42, and 54 could not be possible to classify in chemicalsgroups mentioned before. As Table 2 shows, their occurrence is not uniform. Thus, peaks 1 and13, sugar and fumaroprotocetraric acid isomer 1, respectively, were present in all MAEs, whereas

Antioxidants 2020, 9, 733 11 of 24
fumaroprotocetraric acid isomer 2 (peak 16) was found in Italia and Filipina MAE. Moreover, acerosideVIII (peak 42) was tentatively identified for the first time in M. alba, which was found in plants fromthe same class [25]. Finally, peak 54 which showed a m/z at 555.2819 was only found in the ValencianaTemprana genotype and was also detected in botanicals from the same order [26].
3.2. Quantitation of Polar Compounds in MAEs
With the purpose of determining the amount of phenolic and other polar compoundspresented in the MAEs nine commercial standards (quinic acid, protocatechuic acid,3,5, methoxy-4-hydroxy cinnamic acid, chlorogenic acid, rutin, kaempferol-3-rutinoside,quercetin-3-glucoside, kaempferol-3-glucoside, and quercetin) were used to elaborate the calibrationcurves. Thus, calibration curves were drawn using eight points at different concentrations resulting inregression coefficients higher than 0.991. Compound concentrations were calculated by interpolation,the peak area of compound in the pertinent calibration curve. Quinic acid, chlorogenic acid, rutin,quercetin-3-glucoside, kaempferol-3-rutinoside, kaempferol-3-glucoside, and quercetin were quantifiedby comparison with the response of their respective standards.
The other compounds were tentatively calculated according to similar structures. In this sense,protocatechuic acid hexoside was quantified with protocatechuic acid calibration curve. In addition,chlorogenic acid curves were used to determine the amounts of rosmarinic acid and caffeoylquinicacid hexoside, whereas dimethoxy-cinnamic acid and p-coumaric acid were quantified with 3, 5,methoxy-4-hydroxy cinnamic acid curve. The amounts of the rest of the flavonoids in the extract werecalculated using quercetin-3-glucoside, kaempferol-3-rutinoside, or kaempferol-3-glucoside. It shouldbe mentioned that the quantitation of the analytes in M. alba could differ considering the response ofthe standards.
Therefore, the quantitation was only an estimation of their real concentration. Thus, Table 3summarizes the quantitative results obtained by HPLC-ESI-TOF-MS expressed in µg of compound/gof M. alba leaves and µg of compound/g of extract. In this sense, the total content for all phenolicswas calculated as the sum of the individual compound concentrations. It is necessary to remark thatthe analyte concentrations expressed by µg of analyte/g of extract gave practically the same distributionand ANOVA tests results than those expressed in µg of compound/g of M. alba leaves. Additionally, ananalysis of variance (ANOVA) was made in order to know the significant differences among MAE.
Concerning the total phenolic content, it ranged from 58474 ± 2021 to 19171 ± 877 µg of analyte/gof M. alba leaves, where Kokuso was the MAE with highest amounts, whereas Valenciana Temprana hadthe lowest value. In this scenario, phenolic acids were the most abundant compounds in all extracts.Overall, chlorogenic acid isomers, specifically cryptochlorogenic acid, were the most representativecompounds in all genotypes, with Kokuso as the one which reported the highest amounts of thesecompounds. These results are according with other previous studies [5].
On the other hand, protocatechuic acid glucoside was found in higher amounts in Italia MAE(4241 µg of analyte/g of M. alba leaves). The ANOVA test related to this compound revealed significantdifferences with regard to the rest of genotypes. Moreover, rosmarinic acid concentration displayedsignificant higher values in Filipina (2981 µg of analyte/g of M. alba leaves) compared with the rest ofgenotypes. Considering the rest of phenolic acids, dimethoxy cinnamic acid showed higher amounts inValenciana temprana and Filipina (1077 and 1018 µg of analyte/g of M. alba leaves, respectively) genotypesthan the others. On the other hand, p-coumaric acid revealed lower amounts in all genotypes, excludingValenciana temprana which was the only variety that contained caffeoylquinic acid hexoside.

Antioxidants 2020, 9, 733 12 of 24
Table 3. Quantification of compounds from different Morus alba genotypes. Values expressed as µg ofanalyte/g of M. alba leaves ± SD.
Compound Italia Filipina Kokuso ValencianaTemprana
Quinic acid 3711 ± 49 b 9341 ± 259 a 10,994 ± 236 a 1469 ± 55 c
Protocatechuic acid glucoside 4241 ± 380 a 1809 ± 126 b 1368 ± 138 b,c 905 ± 27 c
Neochlorogenic acid 4430 ± 154 c 5753 ± 43 b 10,091 ± 737 a 2260 ± 72 d
Chlorogenic acid 5807 ± 101 b 9089 ± 774 a 5394 ± 274 b 2345 ± 131 c
Cryptochlorogenic acid 10,537 ± 733 b 12,478 ± 82 a 16,514 ± 32 a 4602 ± 289 c
Rosmarinic acid 1611 ± 87 b 2981 ± 253 a 1625 ± 85 b 1343 ± 71 b
Chlorogenic acid isomer 1162 ± 27 a 1280 ± 19 a 1288 ± 120 a 99 ± 11 b
Caffeoylquinic acid hexoside ND ND ND 396 ± 13 a
Dimethoxy cinnamic acid 194 ± 8 c 1018 ± 33 a 639 ± 107 b 1077 ± 55 a
p-coumaric acid 85 ± 5 b 221 ± 5 a 95 ± 9 b NDQuercetin dihexoside NQ 94.9 ± 0.2 a NQ NQ
Rutin isomer 1 ND 66 ± 3 a ND 23.1 ± 0.4 b
Rutin isomer 2 2343 ± 54 c 2039 ± 46 d 2625 ± 15 b 2977 ± 69 a
Quercetin-3- glucoside 274 ± 55 d 3092 ± 214 a 1302 ± 70 b 702 ± 51 c
Kaempferol-3-rutinoside 574 ± 5 b 166 ± 8 d 275 ± 8 c 973 ± 33 a
Quercetin acetylglucoside isomer 1 604 ± 23 c 2872 ± 221 b 3353 ± 108 a NDKaempferol-3-glucoside 141 ± 6 c 675 ± 10 a 232.7 ± 0.8 b NQ
Quercetin acetylglucoside isomer 2 NQ 1122 ± 9 a 877 ± 22 b NDKaempferol acetylglucoside isomer 1 605 ± 27 c 1133 ± 24 b 1367 ± 33 a NDQuercetin acetylglucoside isomer 3 NQ NQ NQ ND
Kaempferol acetylglucoside isomer 2 95 ± 5 c 576 ± 11 a 435 ± 26 b NDQuercetin NQ NQ NQ NQ
Total phenolic content 36,414 ± 1719 b 55,806 ± 2140 a 58,474 ± 2021 a 19,171 ± 877 c
NQ: Compound detected but below LOQ; ND: Compound not detected. Concentrations with the same type (a–c)did not present significant differences.
In spite of flavonoids being the most varied chemical group, their quantities were lower thanthe rest of the groups due to some compounds that were not found in all genotypes. For instance,quercetin dihexoside was only found in Filipina (94.9 µg of analyte/g of M. alba leaves), whereasquercetin acetyl glucoside isomers were not found in Valenciana Temprana. In this sense, quercetin acetylglucoside isomer 1 was the major flavonoid found, showing significant differences in Kokuso (3353 µgof analyte/g of M. alba leaves) compared to Filipina and Italia (2872 and 694 µg of analyte/g of M. albaleaves, respectively). Concerning quercetin-3-glucoside, it was detected in higher amounts in Filipina(3092 µg of analyte/g of M. alba leaves). Moreover, rutin isomer 2 was the major flavonoid quantified inValenciana Temprana and Kokuso (2977 and 2625 µg of analyte/g of M. alba leaves, respectively). Theseflavonoids were determined in great amounts in other studies [5,27]. Lastly, the most concentratedkaempferol derivative was kaempferol acetylglucoside isomer 1, which ranged from 1367 to 605 µg ofanalyte/g of M. alba leaves.
Regarding quinic acid, not phenolic molecule, significant differences were found in Filipina andKokuso genotypes with regard to the others, reaching a concentration up to 10,994 µg of analyte/g of M.alba leaves.
3.3. Radical Scavenging Activity of the M. alba Extracts
Following the characterization of the MAE, the study of the in vitro antioxidant activity wascarried out by measuring the total radical scavenging activity against DPPH, a widely used assay forthe evaluation of antioxidant activity of biological samples. The results revealed that Filipina MAEshowed the highest antioxidant capacity (441 ± 46 µmol AAE/g MAE), followed by Kokuso 431 ±30 µmol AAE/g MAE) and Italia MAE (424 ± 39 µmol AAE/g MAE). Finally, a significantly lowerscavenging activity was observed in Valenciana Temprana extract with 290 ± 21 µmol AAE/g MAE

Antioxidants 2020, 9, 733 13 of 24
(ANOVA test, p < 0.05). The observed in vitro radical scavenging activity of the four MAEs correlateswell with the total phenolic content of the different extracts as presented in Table 3.
3.4. Antioxidant Activity of the M. alba Extracts on C. elegans
In a previous screening performed by our research group, a range of concentrations from 1to 400 µg/mL of the different MAEs were evaluated, with the concentration of 100 µg/mL beingselected as the optimal dose (data not shown). The effects of the MAE genotypes upon oxidativestress was determined in C. elegans by measuring worm viability after a 5-h-long exposure to 3 mMH2O2. The MAE-induced protective effects were compared to the effect exerted by the control E. coliOP50. The results showed a significant higher protective effect of Italia MAE similar to vitamin Cpositive control of worm survival (p < 0.05) and 23% higher than worm survival in the NGM control(p < 0.05) (Figure 2). Valenciana Temprana genotype showed a significant increase of protective effect(11% higher than worm survival in control condition), whereas Kokuso and Filipina genotypes did notshow protective effect when compared to the control condition (Figure 2).
Antioxidants 2020, 9, x FOR PEER REVIEW 12 of 24
In spite of flavonoids being the most varied chemical group, their quantities were lower than the rest of the groups due to some compounds that were not found in all genotypes. For instance, quercetin dihexoside was only found in Filipina (94.9 µg of analyte/g of M. alba leaves), whereas quercetin acetyl glucoside isomers were not found in Valenciana Temprana. In this sense, quercetin acetyl glucoside isomer 1 was the major flavonoid found, showing significant differences in Kokuso (3353 µg of analyte/g of M. alba leaves) compared to Filipina and Italia (2872 and 694 µg of analyte/g of M. alba leaves, respectively). Concerning quercetin-3-glucoside, it was detected in higher amounts in Filipina (3092 µg of analyte/g of M. alba leaves). Moreover, rutin isomer 2 was the major flavonoid quantified in Valenciana Temprana and Kokuso (2977 and 2625 µg of analyte/g of M. alba leaves, respectively). These flavonoids were determined in great amounts in other studies [5,27]. Lastly, the most concentrated kaempferol derivative was kaempferol acetylglucoside isomer 1, which ranged from 1367 to 605 µg of analyte/g of M. alba leaves.
Regarding quinic acid, not phenolic molecule, significant differences were found in Filipina and Kokuso genotypes with regard to the others, reaching a concentration up to 10,994 µg of analyte/g of M. alba leaves.
3.3. Radical Scavenging Activity of the M. alba Extracts
Following the characterization of the MAE, the study of the in vitro antioxidant activity was carried out by measuring the total radical scavenging activity against DPPH, a widely used assay for the evaluation of antioxidant activity of biological samples. The results revealed that Filipina MAE showed the highest antioxidant capacity (441 ± 46 µmol AAE/g MAE), followed by Kokuso 431 ± 30 µmol AAE/g MAE) and Italia MAE (424 ± 39 µmol AAE/g MAE). Finally, a significantly lower scavenging activity was observed in Valenciana Temprana extract with 290 ± 21 µmol AAE/g MAE (ANOVA test, p < 0.05). The observed in vitro radical scavenging activity of the four MAEs correlates well with the total phenolic content of the different extracts as presented in Table 3.
3.4. Antioxidant Activity of the M. alba Extracts on C. elegans
In a previous screening performed by our research group, a range of concentrations from 1 to 400 µg/mL of the different MAEs were evaluated, with the concentration of 100 µg/mL being selected as the optimal dose (data not shown). The effects of the MAE genotypes upon oxidative stress was determined in C. elegans by measuring worm viability after a 5-h-long exposure to 3 mM H2O2. The MAE-induced protective effects were compared to the effect exerted by the control E. coli OP50. The results showed a significant higher protective effect of Italia MAE similar to vitamin C positive control of worm survival (p < 0.05) and 23% higher than worm survival in the NGM control (p < 0.05) (Figure 2). Valenciana Temprana genotype showed a significant increase of protective effect (11% higher than worm survival in control condition), whereas Kokuso and Filipina genotypes did not show protective effect when compared to the control condition (Figure 2).
Figure 2. C. elegans survival (%) in the different conditions assayed (100 µg/mL) of the Morus alba leaves extracts( MAE) of different genotypes.
Figure 2. C. elegans survival (%) in the different conditions assayed (100 µg/mL) of the Morus alba leavesextracts( MAE) of different genotypes.
3.5. Effects of MAEs on Body Weight, Glucose Tolerance Test, Fat Accumulation, and Plasma BiochemicalProfile
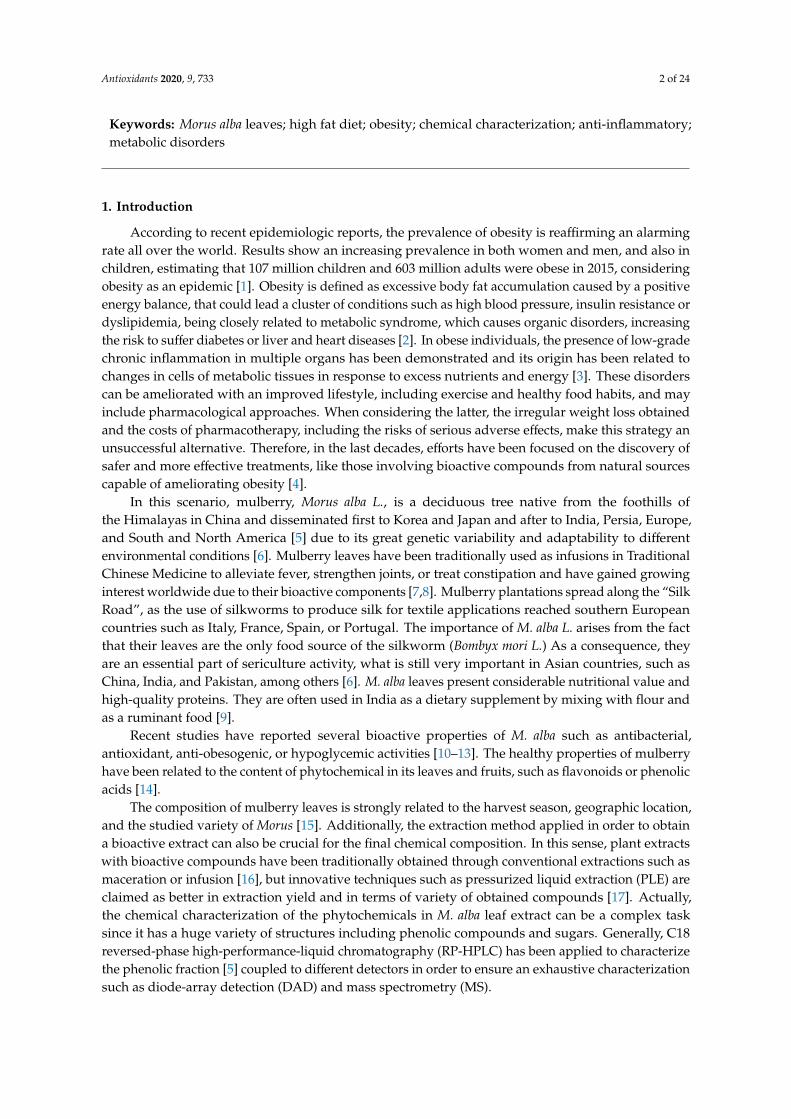
HFD consumption resulted in an increased body weight gain in the control obese group overthe 42-day period when compared to the control group that received a standard diet. When HFD-fedmice were administered Kokuso or Valenciana Temprana MAE, no significant modifications were obtainedin weight gain evolution in comparison with the corresponding control group, whereas Filipina andItalia produced a less pronounced weight gain, which was significantly different from control obesemice from days 37 and 25 onwards, respectively (Figure 3A).
Of note, no significant differences in energy intake were observed among groups receiving HFD(Figure 3A); however, only the treatment with Italia MAE significantly reduced the energy efficiency incomparison with untreated HFD-fed mice, obtaining similar values to those found in non-obese mice(Figure 3A).
These results would indicate that this extract did not reduce food intake but preventedthe deleterious impact that HFD intake had on weight gain evolution in obese mice, as well asthe obesity-associated metabolic disorders. Thus, the glucose tolerance test was performed one weekbefore the sacrifice of mice, and the results revealed that plasma glucose levels reached a peak at15 min after the administration of glucose in all experimental groups, and these values progressivelydecreased to the pre-prandial levels at the end of the assay.
As expected, the glycemia was higher in HFD-fed mice than in control diet-fed group; however,when HFD-fed mice were treated with Filipina or Italia MAE, the plasma glucose levels were lowerin comparison with obese control mice and the normal levels were obtained earlier, thus reducingsignificantly the area under the curve (AUC) (Figure 3B). The beneficial effects on glucose metabolismexerted by these two genotypes were also associated with an improvement in lipid profile, since they
Antioxidants 2020, 9, 733 14 of 24
were able to significantly reduce cholesterol-LDL levels in comparison with control HFD-fed mice;however, only Italia MAE significantly ameliorated the plasma triglycerides content (Figure 3C).
Antioxidants 2020, 9, x FOR PEER REVIEW 13 of 24
3.5. Effects of MAEs on Body Weight, Glucose Tolerance Test, Fat Accumulation, and Plasma Biochemical Profile
HFD consumption resulted in an increased body weight gain in the control obese group over the 42-day period when compared to the control group that received a standard diet. When HFD-fed mice were administered Kokuso or Valenciana Temprana MAE, no significant modifications were obtained in weight gain evolution in comparison with the corresponding control group, whereas Filipina and Italia produced a less pronounced weight gain, which was significantly different from control obese mice from days 37 and 25 onwards, respectively (Figure 3A).
Figure 3. Effects of different Morus alba genotypes (Filipina, Valenciana temprana, Kokuso, and Italia) administration on (A) morphological changes (body weight evolution, energy efficiency, and energy
Figure 3. Effects of different Morus alba genotypes (Filipina, Valenciana temprana, Kokuso, and Italia)administration on (A) morphological changes (body weight evolution, energy efficiency, and energyintake); (B) glucose tolerance test and area under the curve (AUC); and (C) cholesterol-LDL plasmalevels, triglycerides, and epididymal and abdominal fat. Data are expressed as means ± SEM (n = 10).Groups with different letters statistically differ (p < 0.05).
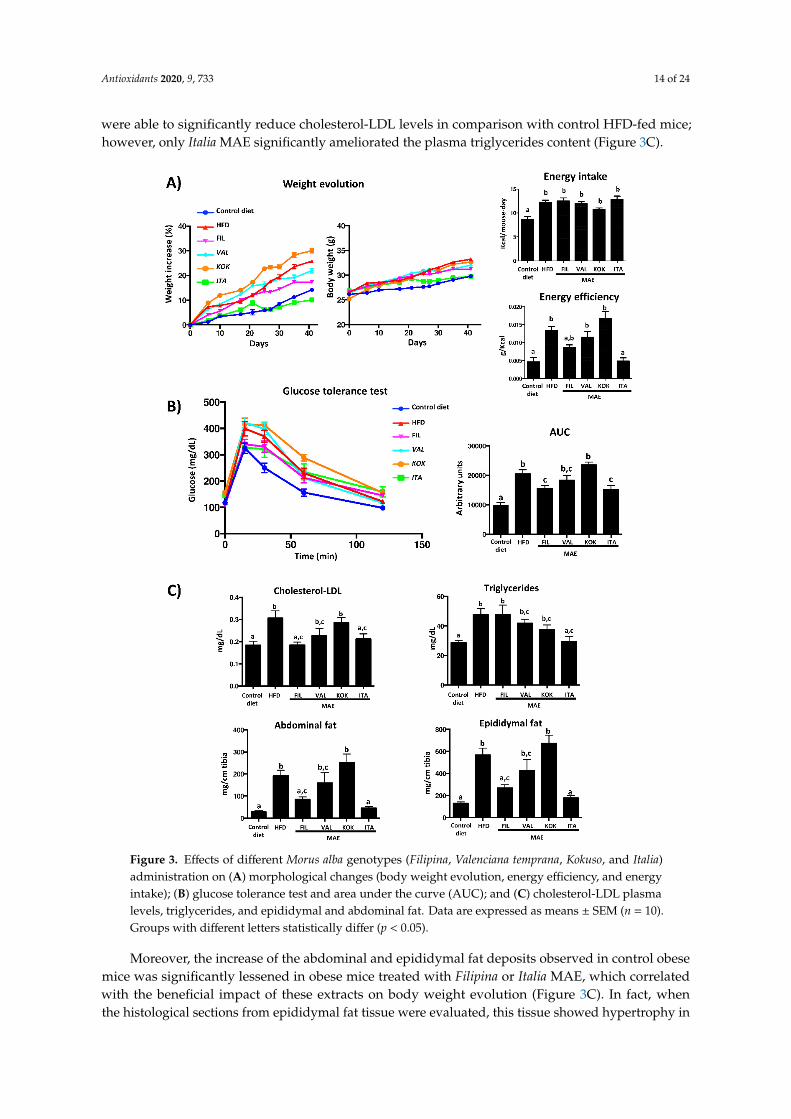
Moreover, the increase of the abdominal and epididymal fat deposits observed in control obesemice was significantly lessened in obese mice treated with Filipina or Italia MAE, which correlatedwith the beneficial impact of these extracts on body weight evolution (Figure 3C). In fact, whenthe histological sections from epididymal fat tissue were evaluated, this tissue showed hypertrophy in

Antioxidants 2020, 9, 733 15 of 24
untreated HFD-fed mice when compared with control diet-fed mice. However, the treatment withFilipina or Italia MAE reduced the size of the adipocytes when compared with control obese mice(Figure 4A).Antioxidants 2020, 9, x FOR PEER REVIEW 15 of 24
Figure 4. Effects of Morus alba genotypes (Filipina, Valenciana temprana, Kokuso, and Italia) administration on: (A) epididymal adipose tissue, analyzed by hematoxylin and eosin staining (scale bars = 40 µm) and on perimeter of epididymal adipocyte (Data are expressed as means ± SEM (n = 10) and groups with different letters statistically differ (p < 0.05)); (B) liver tissue stained with oil red and hematoxylin; and (C) liver tissue sections stained with hematoxylin and eosin (yellow arrows indicate the presence of lipid vacuoles in the cytoplasm of hepatocytes and black arrows indicate infiltrations of immune cells) in high fat diet (HFD)-fed mice.
Of note, the altered lipid metabolism was corroborated by the fat accumulation in liver, as evidenced in the histological analysis. When the liver sections were stained with oil red, which marks the lipids droplet accumulation, the red coloration was greater in samples from control obese mice than in those from non-obese mice (Figure 4B). Similarly, the increased fat deposition in liver was also observed when these sections were stained with hematoxylin and eosin, since the number of fat drops observed was higher in the cytoplasm of hepatocytes form HFD-fed mice (Figure 4C). Again,
Figure 4. Effects of Morus alba genotypes (Filipina, Valenciana temprana, Kokuso, and Italia) administrationon: (A) epididymal adipose tissue, analyzed by hematoxylin and eosin staining (scale bars = 40 µm)and on perimeter of epididymal adipocyte (Data are expressed as means ± SEM (n = 10) and groupswith different letters statistically differ (p < 0.05)); (B) liver tissue stained with oil red and hematoxylin;and (C) liver tissue sections stained with hematoxylin and eosin (yellow arrows indicate the presenceof lipid vacuoles in the cytoplasm of hepatocytes and black arrows indicate infiltrations of immunecells) in high fat diet (HFD)-fed mice.
Of note, the altered lipid metabolism was corroborated by the fat accumulation in liver, asevidenced in the histological analysis. When the liver sections were stained with oil red, which marksthe lipids droplet accumulation, the red coloration was greater in samples from control obese mice

Antioxidants 2020, 9, 733 16 of 24
than in those from non-obese mice (Figure 4B). Similarly, the increased fat deposition in liver wasalso observed when these sections were stained with hematoxylin and eosin, since the number of fatdrops observed was higher in the cytoplasm of hepatocytes form HFD-fed mice (Figure 4C). Again,the administration of Filipina or Italia MAE to obese mice ameliorated the development of hepaticsteatosis that occurred in the rest of groups of mice fed with HFD (Figure 4B,C).
3.6. Effects of MAEs on Systemic Inflammatory Response
Accumulating evidence indicates that obesity causes chronic low-grade inflammation, whichclearly contributes to systemic metabolic dysfunctions that characterize metabolic syndrome [28,29].This inflammatory status has been also observed in the present study, since mice fed HFD showedincreased mRNA levels of the proinflammatory cytokines in hepatic and adipose tissues, includingTnf-α, Il-1β, Il-6, and the chemokine monocyte chemotactic protein-1 (Mcp-1). The ability of MAEto reduce weight gain, thus reducing obesity in these HFD-fed mice, can be the main contributionto ameliorate the systemic inflammatory response observed in the present study, especially whenthe Italia genotype is considered. This beneficial impact on obesity-associated inflammation can explainthe improvement of glucose and lipid metabolism, since these pro-inflammatory cytokines have beencorrelated to an increment of lipolysis and fatty acid oxidation, thus amplifying the inflammatoryprocess and facilitating insulin resistance (Figure 5) [30].
Antioxidants 2020, 9, x FOR PEER REVIEW 16 of 24
the administration of Filipina or Italia MAE to obese mice ameliorated the development of hepatic steatosis that occurred in the rest of groups of mice fed with HFD (Figure 4B,C).
3.6. Effects of MAEs on Systemic Inflammatory Response
Accumulating evidence indicates that obesity causes chronic low-grade inflammation, which clearly contributes to systemic metabolic dysfunctions that characterize metabolic syndrome [28,29]. This inflammatory status has been also observed in the present study, since mice fed HFD showed increased mRNA levels of the proinflammatory cytokines in hepatic and adipose tissues, including Tnf-α, Il-1β, Il-6, and the chemokine monocyte chemotactic protein-1 (Mcp-1). The ability of MAE to reduce weight gain, thus reducing obesity in these HFD-fed mice, can be the main contribution to ameliorate the systemic inflammatory response observed in the present study, especially when the Italia genotype is considered. This beneficial impact on obesity-associated inflammation can explain the improvement of glucose and lipid metabolism, since these pro-inflammatory cytokines have been correlated to an increment of lipolysis and fatty acid oxidation, thus amplifying the inflammatory process and facilitating insulin resistance (Figure 5) [30].
Figure 5. Effects after administration of Morus alba extracts (genotypes Filipina, Valenciana temprana, Kokuso, and Italia) in high fat diet (HFD)-fed mice: (A) on gene expression of Il-1ß, Tnf-α, Il-6, and Mcp-1 in liver; (B) on gene expression of Il-1ß, Tnf-α, and Il-6 in fat, analyzed by real time qPCR. Data are expressed as means ± SEM (n = 10). Groups with different letters statistically differ (p < 0.05).
Figure 5. Effects after administration of Morus alba extracts (genotypes Filipina, Valenciana temprana,Kokuso, and Italia) in high fat diet (HFD)-fed mice: (A) on gene expression of Il-1ß, Tnf-α, Il-6, and Mcp-1

Antioxidants 2020, 9, 733 17 of 24
in liver; (B) on gene expression of Il-1ß, Tnf-α, and Il-6 in fat, analyzed by real time qPCR. Data areexpressed as means ± SEM (n = 10). Groups with different letters statistically differ (p < 0.05).
C-Jun NH2-terminal kinases (JNKs) are members of the mitogen-activated protein kinase (MAPK),and it has been reported the important role that JNKs play in the development of obesity-inducedinflammation, impaired glucose tolerance, and hepatic steatosis [31]. In fact, the intake of HFDincreased the expression of Jnk-1 and Jnk-2 in liver and Jnk-1 in fat; of note, only the administration ofItalia MAE significantly reduced their expression (Figure 6A).
Antioxidants 2020, 9, x FOR PEER REVIEW 17 of 24
C-Jun NH2-terminal kinases (JNKs) are members of the mitogen-activated protein kinase (MAPK), and it has been reported the important role that JNKs play in the development of obesity-induced inflammation, impaired glucose tolerance, and hepatic steatosis [31]. In fact, the intake of HFD increased the expression of Jnk-1 and Jnk-2 in liver and Jnk-1 in fat; of note, only the administration of Italia MAE significantly reduced their expression (Figure 6A).
Figure 6. Effects after administration of Morus alba extracts (genotypes Filipina, Valenciana temprana, Kokuso, and Italia) in high fat diet (HFD)-fed mice: (A) gene expression of Jnk-1 and Jnk-2; (B) gene expression of Ppar-α, Ppar-β, and Ppar-γ, analyzed by real time qPCR. Data are expressed as means ± SEM (n = 10). Groups with different letters statistically differ (p < 0.05).
Peroxisome proliferator-activated receptors (PPARs) are ligand-activated transcription factors involved in the regulation of different biological processes such as lipid and glucose metabolism, as well as inflammation [32]. Diet-induced obesity produced an alteration in the expression of Ppar α, β and γ in liver and fat, and the treatment with Italia MAE normalized their mRNA levels (Figure 6B). PPAR-γ has an important role in the control of adipogenesis and lipid metabolism, inflammation, and insulin function, and its altered expression has been previously associated with obesity and diabetes [33]. Thus, one of the beneficial effects of the MAE would be related to the reduction of Ppar-γ levels in the liver as a consequence of the lower steatosis due to the minor weight gain. Similarly, the upregulation of Ppar-α in fat produced by this extract could be responsible for the improvement of insulin sensitivity and the increase of the glucose uptake in this tissue [34]. Of note, different types
Figure 6. Effects after administration of Morus alba extracts (genotypes Filipina, Valenciana temprana,Kokuso, and Italia) in high fat diet (HFD)-fed mice: (A) gene expression of Jnk-1 and Jnk-2; (B) geneexpression of Ppar-α, Ppar-β, and Ppar-γ, analyzed by real time qPCR. Data are expressed as means ±SEM (n = 10). Groups with different letters statistically differ (p < 0.05).
Peroxisome proliferator-activated receptors (PPARs) are ligand-activated transcription factorsinvolved in the regulation of different biological processes such as lipid and glucose metabolism, aswell as inflammation [32]. Diet-induced obesity produced an alteration in the expression of Ppar α, βand γ in liver and fat, and the treatment with Italia MAE normalized their mRNA levels (Figure 6B).PPAR-γ has an important role in the control of adipogenesis and lipid metabolism, inflammation,and insulin function, and its altered expression has been previously associated with obesity anddiabetes [33]. Thus, one of the beneficial effects of the MAE would be related to the reduction of Ppar-γ
Antioxidants 2020, 9, 733 18 of 24
levels in the liver as a consequence of the lower steatosis due to the minor weight gain. Similarly,the upregulation of Ppar-α in fat produced by this extract could be responsible for the improvement ofinsulin sensitivity and the increase of the glucose uptake in this tissue [34]. Of note, different types ofadipose tissue have been reported, including white adipose tissue (WAT) and brown adipose tissue(BAT).
The increased accumulation of WAT in the body is associated with obesity-related inflammatoryresponse; on the contrary, the formation of BAT, due to its thermogenic capacity, has been reported toameliorate obesity [35]. More recently, a third type of adipose tissue has been also identified, beigeadipose tissue, which can be derived from WAT, and, similarly to BAT, it is able to produce heat fromglucose and fat due to the higher expressions of thermogenesis and lipolysis genes [36]. PPAR-γ isa transcriptional regulator of fat differentiation that has been proposed to participate in the browning ofWAT [37]. In the present study, the administration of Italia MAE significantly counteracted the reducedexpression of Ppar-γ, associated with obesity, which could be indicative of the browning of WAT intreated obese mice (Figure 6B), and the subsequent improvement of the metabolic response of adiposetissue in these mice.
Leptin and adiponectin are two adipokines involved in the balance regulation between energyintake and expenditure, and their expression, as well as the associated signaling in target organs, havebeen reported to be altered in obesity [38]. Leptin is considered as a proinflammatory adipokine,being involved in the activation of immune cells in hepatic and adipose tissues, and promotion ofinsulin resistance [39], and a situation of leptin resistance is a common feature in obesity, which ischaracterized by increased levels of Leptin, together with reduced expression of its receptor [40,41].
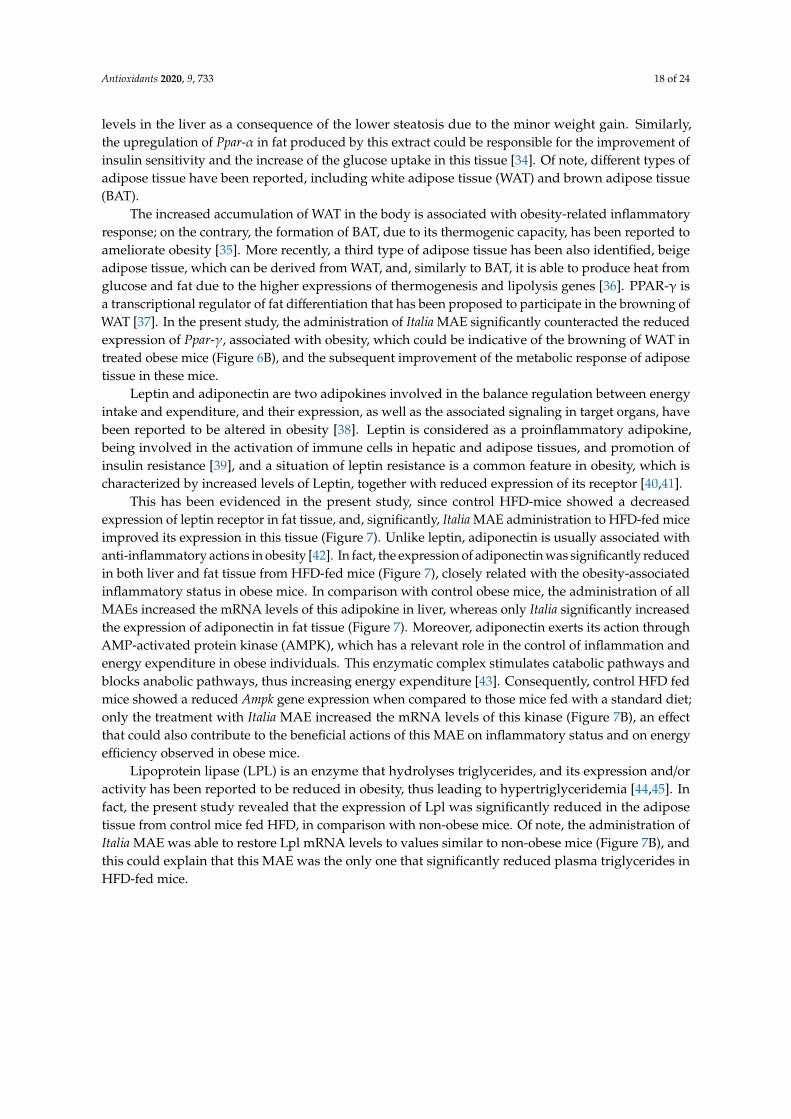
This has been evidenced in the present study, since control HFD-mice showed a decreasedexpression of leptin receptor in fat tissue, and, significantly, Italia MAE administration to HFD-fed miceimproved its expression in this tissue (Figure 7). Unlike leptin, adiponectin is usually associated withanti-inflammatory actions in obesity [42]. In fact, the expression of adiponectin was significantly reducedin both liver and fat tissue from HFD-fed mice (Figure 7), closely related with the obesity-associatedinflammatory status in obese mice. In comparison with control obese mice, the administration of allMAEs increased the mRNA levels of this adipokine in liver, whereas only Italia significantly increasedthe expression of adiponectin in fat tissue (Figure 7). Moreover, adiponectin exerts its action throughAMP-activated protein kinase (AMPK), which has a relevant role in the control of inflammation andenergy expenditure in obese individuals. This enzymatic complex stimulates catabolic pathways andblocks anabolic pathways, thus increasing energy expenditure [43]. Consequently, control HFD fedmice showed a reduced Ampk gene expression when compared to those mice fed with a standard diet;only the treatment with Italia MAE increased the mRNA levels of this kinase (Figure 7B), an effectthat could also contribute to the beneficial actions of this MAE on inflammatory status and on energyefficiency observed in obese mice.
Lipoprotein lipase (LPL) is an enzyme that hydrolyses triglycerides, and its expression and/oractivity has been reported to be reduced in obesity, thus leading to hypertriglyceridemia [44,45]. Infact, the present study revealed that the expression of Lpl was significantly reduced in the adiposetissue from control mice fed HFD, in comparison with non-obese mice. Of note, the administration ofItalia MAE was able to restore Lpl mRNA levels to values similar to non-obese mice (Figure 7B), andthis could explain that this MAE was the only one that significantly reduced plasma triglycerides inHFD-fed mice.

Antioxidants 2020, 9, 733 19 of 24Antioxidants 2020, 9, x FOR PEER REVIEW 19 of 24
Figure 7. Effects after administration of Morus alba extracts (genotypes Filipina, Valenciana temprana, Kokuso, and Italia) in high fat diet (HFD)-fed mice: (A) gene expression of Adinopectin, Glut-4, and Tlr-4 in liver; (B) gene expression of Adinopectin, Leptin-r, Ampk, Lpl, and Glut-4 in fat, analyzed by real time qPCR. Data are expressed as means ± SEM (n = 10). Groups with different letters statistically differ (p < 0.05).
Lipoprotein lipase (LPL) is an enzyme that hydrolyses triglycerides, and its expression and/or activity has been reported to be reduced in obesity, thus leading to hypertriglyceridemia [44,45]. In fact, the present study revealed that the expression of Lpl was significantly reduced in the adipose tissue from control mice fed HFD, in comparison with non-obese mice. Of note, the administration of Italia MAE was able to restore Lpl mRNA levels to values similar to non-obese mice (Figure 7B), and this could explain that this MAE was the only one that significantly reduced plasma triglycerides in HFD-fed mice.
In addition, it is well known that glucose uptake in different tissues requires the presence of the membrane transporters, like GLUT-4, of which expression and function can be impaired in metabolic conditions like insulin resistance and diabetes [46]. In fact, in the present study, Glut-4 gene expression is reduced in fat tissue and liver in obese mice, similarly to that previously reported in similar experimental models of obesity [47], thus decreasing the glucose uptake and resulting in hyperglycemia.
Except Filipina MAE, all the extracts have shown a beneficial impact on Glut-4 expression in fat tissue; however, only Italia MAE also significantly upregulated the expression of Glut-4 gene in liver (Figure 7). Once again, the better profile of this MAE could contribute to its highest efficacy to ameliorate the glycemic and lipid metabolic alterations observed, as well as to downregulate the associated systemic inflammatory response in obese mice. Closely related to this, it is interesting to
Figure 7. Effects after administration of Morus alba extracts (genotypes Filipina, Valenciana temprana,Kokuso, and Italia) in high fat diet (HFD)-fed mice: (A) gene expression of Adinopectin, Glut-4, and Tlr-4in liver; (B) gene expression of Adinopectin, Leptin-r, Ampk, Lpl, and Glut-4 in fat, analyzed by real timeqPCR. Data are expressed as means ± SEM (n = 10). Groups with different letters statistically differ(p < 0.05).
In addition, it is well known that glucose uptake in different tissues requires the presence ofthe membrane transporters, like GLUT-4, of which expression and function can be impaired inmetabolic conditions like insulin resistance and diabetes [46]. In fact, in the present study, Glut-4gene expression is reduced in fat tissue and liver in obese mice, similarly to that previously reportedin similar experimental models of obesity [47], thus decreasing the glucose uptake and resultingin hyperglycemia.
Except Filipina MAE, all the extracts have shown a beneficial impact on Glut-4 expression infat tissue; however, only Italia MAE also significantly upregulated the expression of Glut-4 gene inliver (Figure 7). Once again, the better profile of this MAE could contribute to its highest efficacyto ameliorate the glycemic and lipid metabolic alterations observed, as well as to downregulatethe associated systemic inflammatory response in obese mice. Closely related to this, it is interesting tonote that this situation has been associated to an increase in bacterial lipopolysaccharide in plasma thatcauses metabolic endotoxemia [48].
In fact, some studies have demonstrated the correlation between increased LPS plasma levelsand dysregulation of toll-like receptor 4 (TLR-4) signaling, specifically with an increase in Tlr-4 geneexpression [49]. This receptor recognizes LPS and triggers mechanisms that increase the expression ofpro-inflammatory cytokines [50]. As expected, the mRNA levels of Tlr-4 in liver significantly increased

Antioxidants 2020, 9, 733 20 of 24
in mice fed an HFD in comparison with the control lean mice, which were significantly reduced inobese mice administered with Italia MAE (Figure 7A), thus ameliorating the endotoxemia-associatedinflammatory status that takes place in obesity.
Finally, this obesity-associated metabolic endotoxemia may have its origin in an increase inintestinal permeability that takes place in obesity, which would facilitate the access of microbialcomponents from intestinal lumen to systemic circulation [51,52]. The altered epithelial barrier functioncan be observed in this study since the expression of proteins involved in intestinal integrity wasreduced in obese mice in comparison with mice fed a standard diet (Figure 8).
Antioxidants 2020, 9, x FOR PEER REVIEW 20 of 24
note that this situation has been associated to an increase in bacterial lipopolysaccharide in plasma that causes metabolic endotoxemia [48].
In fact, some studies have demonstrated the correlation between increased LPS plasma levels and dysregulation of toll-like receptor 4 (TLR-4) signaling, specifically with an increase in Tlr-4 gene expression [49]. This receptor recognizes LPS and triggers mechanisms that increase the expression of pro-inflammatory cytokines [50]. As expected, the mRNA levels of Tlr-4 in liver significantly increased in mice fed an HFD in comparison with the control lean mice, which were significantly reduced in obese mice administered with Italia MAE (Figure 7A), thus ameliorating the endotoxemia-associated inflammatory status that takes place in obesity.
Finally, this obesity-associated metabolic endotoxemia may have its origin in an increase in intestinal permeability that takes place in obesity, which would facilitate the access of microbial components from intestinal lumen to systemic circulation [51,52]. The altered epithelial barrier function can be observed in this study since the expression of proteins involved in intestinal integrity was reduced in obese mice in comparison with mice fed a standard diet (Figure 8).
Figure 8. Effects after administration of Morus alba extracts (genotypes Filipina, Valenciana temprana, Kokuso, and Italia) in high fat diet (HFD)-fed mice on gene expression of intestinal barrier integrity markers, Muc-2, Muc-3, and Tff-3, analyzed by real time qPCR. Data are expressed as means ± SEM (n = 10). Groups with different letters statistically differ (p < 0.05).
When the impact of the different MAEs was evaluated, Filipina showed the best profile in restoring the colonic expression of the markers related with the intestinal barrier function, as it significantly increases the expression of genes such as Muc-2, Muc-3, and Tff-3 (Figure 8). This improvement was also observed in obese mice receiving Italia MAE, although the significant differences in comparison with control HFD-fed mice were only obtained with the expression of Muc-3, whereas only a trend was obtained with the other marker of intestinal integrity. These effects on epithelial barrier function could be associated with the prevention of metabolic endotoxemia that takes place in obesity, thus reducing the inflammatory status and contributing to the beneficial effects observed in this experimental model of metabolic syndrome.
Considering all the results, the greater efficacy shown by Filipina and, especially, Italia MAE among the different genotypes evaluated must be due to the specific chemical composition of each extract. In fact, it has been previously proposed that phenolic compounds are able to enhance thermogenesis, thus regulating the altered energy expenditure observed in obesity; in consequence, further studies are required to evaluate the impact of these extracts on brown and white fat tissue activities [53,54]. Additionally, the presence of protocatechuic acid is significantly higher in Italia MAE. This compound has been reported to show anti-obesity, antidiabetic, antiatherosclerotic, and anti-inflammatory properties, being effects associated with its ability to increase the expression and membrane translocation of the glucose transporter Glut-4, thus facilitating adipocyte glucose uptake; moreover, protocatechuic acid was able to upregulate the levels of adiponectin, Ppar-γ and Ampk, which can also account for the thus ameliorating of the insulin resistance and obesity-associated disorders [55,56]. When Filipina MAE is considered, quercetin-3-glucoside is one of the main analytes detected, with reported beneficial effects against experimental obesity, given its ability to improve the altered lipid profile and to ameliorate the higher weight gain in obese mice, as well as to modulate
Figure 8. Effects after administration of Morus alba extracts (genotypes Filipina, Valenciana temprana,Kokuso, and Italia) in high fat diet (HFD)-fed mice on gene expression of intestinal barrier integritymarkers, Muc-2, Muc-3, and Tff-3, analyzed by real time qPCR. Data are expressed as means ± SEM (n= 10). Groups with different letters statistically differ (p < 0.05).
When the impact of the different MAEs was evaluated, Filipina showed the best profile in restoringthe colonic expression of the markers related with the intestinal barrier function, as it significantlyincreases the expression of genes such as Muc-2, Muc-3, and Tff-3 (Figure 8). This improvement wasalso observed in obese mice receiving Italia MAE, although the significant differences in comparisonwith control HFD-fed mice were only obtained with the expression of Muc-3, whereas only a trend wasobtained with the other marker of intestinal integrity. These effects on epithelial barrier function couldbe associated with the prevention of metabolic endotoxemia that takes place in obesity, thus reducingthe inflammatory status and contributing to the beneficial effects observed in this experimental modelof metabolic syndrome.
Considering all the results, the greater efficacy shown by Filipina and, especially, Italia MAEamong the different genotypes evaluated must be due to the specific chemical composition of eachextract. In fact, it has been previously proposed that phenolic compounds are able to enhancethermogenesis, thus regulating the altered energy expenditure observed in obesity; in consequence,further studies are required to evaluate the impact of these extracts on brown and white fat tissueactivities [53,54]. Additionally, the presence of protocatechuic acid is significantly higher in ItaliaMAE. This compound has been reported to show anti-obesity, antidiabetic, antiatherosclerotic, andanti-inflammatory properties, being effects associated with its ability to increase the expression andmembrane translocation of the glucose transporter Glut-4, thus facilitating adipocyte glucose uptake;moreover, protocatechuic acid was able to upregulate the levels of adiponectin, Ppar-γ and Ampk,which can also account for the thus ameliorating of the insulin resistance and obesity-associateddisorders [55,56]. When Filipina MAE is considered, quercetin-3-glucoside is one of the main analytesdetected, with reported beneficial effects against experimental obesity, given its ability to improvethe altered lipid profile and to ameliorate the higher weight gain in obese mice, as well as to modulatethe expression of genes involved in lipid metabolism and adipocyte differentiation [57,58]. Moreover,fumaroprotocetraric acid isomer 2 was found in the two most active MAEs, Filipina and Italia; this fattyacid possesses antioxidant and antimicrobial properties, which may be also involved in their beneficialeffects observed [59].

Antioxidants 2020, 9, 733 21 of 24
4. Conclusions
In conclusion, Morus alba leaf extracts from different genotypes show a positive impact inHFD-mice by reducing the body weight gain, in which the antioxidant or anti-inflammatory propertiesexerted by these extracts are involved. However, these beneficial effects depend on the genotype.Although the Italia genotype does not present an outstanding total polyphenol content and in vitroradical scavenging activity, it showed the greatest protective effect against the acute oxidativestress in the C. elegans model, and the highest anti-inflammatory efficacy in HFD-induced obesity,followed by the Filipina genotype. These extracts could be used as a complementary treatment forobesity and metabolic syndrome, mainly due to the presence of particular bioactive compoundsin their extracts, including protocatechuic acid and quercetin-3-glucoside, with antioxidant andanti-inflammatory properties.
Author Contributions: Conceptualization, J.L.C., A.S.-C. and J.G.; methodology, F.J.L.-J., A.J.R.-M., J.A.M.-T.,P.D.-E., T.V., L.H.-G., J.L.-S., D.A.-R., A.A.L.-P., A.R.-N.; validation, A.A.L.-P., A.S.-C. and J.G.; resources, J.L.C.,A.S.-C. and J.G.; writing—Original draft preparation, F.J.L.-J., A.J.R.-M., A.A.L.-P., A.R.-N., J.G. and A.S.-C.;writing—Review and editing, A.A.L.-P., A.R.-N., A.S.-C. and J.G.; supervision and funding acquisition, J.L.C.,A.S.-C. and J.G. All authors have read and agreed to the published version of the manuscript.
Funding: This research was funded by the Junta de Andalucía (CTS 164) and by the Spanish Ministry of Economyand Competitiveness (AGL2015-67995-C3-3-R), with funds from the European Commission (FEDER/ERDF).Lozano-Pérez’s research contract is partially supported (80%) by the ERDF/FEDER Operational Programme ofthe Region of Murcia CCI Nº 2007ES161PO001 (Project No. 14-20/20). The CIBER-EHD is funded by the Instituto deSalud Carlos III. A.J. Ruiz-Malagón and L. Hidalgo-García are predoctoral fellows from University of Granada of“Programa de Doctorado: Medicina Clínica y Salud Pública” (Formación de Profesorado Universitario Program);J.A. Molina-Tijeras is a predoctoral fellow from University of Granada of “Programa de Doctorado: Nutrición yCiencias de los Alimentos”. P. Diez-Echave is a predoctoral fellow from University of Granada of “Programa deDoctorado: Medicina Clínica y Salud Pública”, T. Vezza is a postdoctoral fellow from Instituto de InvestigaciónBiosanitaria (Ibs.GRANADA) and A. Rodriguez-Nogales is postdoctoral fellow from Instituto de Salud Carlos III(Miguel Servet Program).
Acknowledgments: The authors want to thank Salvador Aznar Cervantes for their useful comments and theirhelp with the English language editing of the manuscript.
Conflicts of Interest: The authors declare no conflict of interest. The funders had no role in the design of the study;in the collection, analyses, or interpretation of data; in the writing of the manuscript, or in the decision to publishthe results.
References
1. Afshin, A.; Forouzanfar, M.H.; Reitsma, M.B.; Sur, P.; Estep, K.; Lee, A.; Marczak, L.; Mokdad, A.H.;Moradi-Lakeh, M.; Naghavi, M.; et al. Health Effects of Overweight and Obesity in 195 Countries over 25Years. N. Engl. J. Med. 2017, 377, 13–27. [CrossRef] [PubMed]
2. García-Ruiz, I.; Solís-Muñoz, P.; Fernandez-Moreira, D.; Grau, M.; Muñoz-Yagüe, M.T.; Solis-Herruzo, J.A.Omentectomy Prevents Metabolic Syndrome By Reducing Appetite and Body Weight In A Diet-InducedObesity Rat Model. Sci. Rep. 2018, 8, 1540. [CrossRef] [PubMed]
3. Gregor, M.F.; Hotamisligil, G.S. Inflammatory Mechanisms in Obesity. Annu. Rev. Immunol. 2011, 29, 415–445.[CrossRef] [PubMed]
4. Herranz-López, M.; Barrajón-Catalán, E.; Segura-Carretero, A.; Menendez, J.A.; Joven, J.; Micol, V. Lemonverbena (Lippia citriodora) polyphenols alleviate obesity-related disturbances in hypertrophic adipocytesthrough AMPK-dependent mechanisms. Phytomedicine 2015, 22, 605–614. [CrossRef] [PubMed]
5. Dugo, P.; Donato, P.; Cacciola, F.; Germanò, M.P.; Rapisarda, A.; Mondello, L. Characterization ofthe polyphenolic fraction of Morus alba leaves extracts by HPLC coupled to a hybrid IT-TOF MS system. J.Sep. Sci. 2009, 32, 3627–3634. [CrossRef] [PubMed]
6. Vijayan, K.T.A.; Zhao, W.G.; Nair, C.V.; Ercisli, S.; Tsou, C.H. Morus. In Wild Crop Relatives: Genomic andBreeding Resources—Tropical and Subtropical Fruits; Springer: Berlin/Heidelberg, Germany, 2011; pp. 75–95.
7. Harauma, A.; Murayama, T.; Ikeyama, K.; Sano, H.; Arai, H.; Takano, R.; Kita, T.; Hara, S.; Kamei, K.;Yokode, M. Mulberry leaf powder prevents atherosclerosis in apolipoprotein E-deficient mice. Biochem.Biophys. Res. Commun. 2007, 358, 751–756. [CrossRef]

Antioxidants 2020, 9, 733 22 of 24
8. Hu, X.-Q.; Thakur, K.; Chen, G.-H.; Hu, F.; Zhang, J.-G.; Zhang, H.-B.; Wei, Z.-J. Metabolic Effect of1-Deoxynojirimycin from Mulberry Leaves on db/db Diabetic Mice Using Liquid Chromatography–MassSpectrometry Based Metabolomics. J. Agric. Food Chem. 2017, 65, 4658–4667. [CrossRef]
9. Ercisli, S.; Orhan, E. Chemical composition of white (Morus alba), red (Morus rubra) and black (Morus nigra)mulberry fruits. Food Chem. 2007, 103, 1380–1384. [CrossRef]
10. Sheng, Y.; Liu, J.; Zheng, S.; Liang, F.; Luo, Y.; Huang, K.; Xu, W.; He, X. Mulberry leaves ameliorate obesitythrough enhancing brown adipose tissue activity and modulating gut microbiota. Food Funct. 2019, 10,4771–4781. [CrossRef]
11. Gunjal, S.; Ankola, A.V.; Bhat, K. In vitro antibacterial activity of ethanolic extract of Morus alba leaf againstperiodontal pathogens. Indian J. Dent. Res. 2015, 26, 533–536. [CrossRef]
12. He, X.; Fang, J.; Ruan, Y.; Wang, X.; Sun, Y.; Wu, N.; Zhao, Z.; Chang, Y.; Ning, N.; Guo, H.; et al. Structures,bioactivities and future prospective of polysaccharides from Morus alba (white mulberry): A review. FoodChem. 2018, 245, 899–910. [CrossRef] [PubMed]
13. Gui, Z.; Raman, S.T.; Ganeshan, A.K.P.G.; Chen, C.; Jin, C.; Li, S.-H.; Chen, H.-J. In vitro and In vivoantioxidant activity of flavonoid extracted from mulberry fruit (Morus alba L.). Pharmacogn. Mag. 2016, 12,128–133. [CrossRef] [PubMed]
14. Yang, Y.; Tan, Y.-X.; Chen, R.-Y.; Kang, J. The latest review on the polyphenols and their bioactivities ofChineseMorusplants. J. Asian Nat. Prod. Res. 2014, 16, 690–702. [CrossRef] [PubMed]
15. Han, W.; Chen, X.; Yu, H.; Chen, L.; Shen, M. Seasonal variations of iminosugars in mulberry leaves detectedby hydrophilic interaction chromatography coupled with tandem mass spectrometry. Food Chem. 2018, 251,110–114. [CrossRef] [PubMed]
16. Qi, S.-Z.; Li, N.; Tuo, Z.-D.; Li, J.-L.; Xing, S.-S.; Li, B.-B.; Zhang, L.; Lee, H.-S.; Chen, J.-G.; Cui, L. Effects ofMorus root bark extract and active constituents on blood lipids in hyperlipidemia rats. J. Ethnopharmacol.2016, 180, 54–59. [CrossRef]
17. Leyva-Jiménez, F.J.; Lozano-Sánchez, J.; Borrás-Linares, I.; Arráez-Román, D.; Segura-Carretero, A.Comparative study of conventional and pressurized liquid extraction for recovering bioactive compoundsfrom Lippia citriodora leaves. Food Res. Int. 2018, 109, 213–222. [CrossRef]
18. Garcia-Gómez, B.; González-Alvarez, H.; Martínez-Mora, C.; Cenis, L.J.; Perez-Hernandez, C.D.M.;Martínez-Zubiaur, Y.; Martínez-Gómez, P. The molecular characterization of an extended mulberry germplasmby SSR markers. Genetika 2019, 51, 389–403. [CrossRef]
19. Gross, J.H. Mass Spectrometry; Springer: Berlin/Heidelberg, Germany, 2011.20. Yen, G.-C.; Der Duh, P. Scavenging Effect of Methanolic Extracts of Peanut Hulls on Free-Radical and
Active-Oxygen Species. J. Agric. Food Chem. 1994, 42, 629–632. [CrossRef]21. Martorell, P.; Bataller, E.; Llopis, S.; González, N.; Álvarez, B.; Monton, F.; Ortiz, P.; Ramón, D.; Genovés, S. A
Cocoa Peptide Protects Caenorhabditis elegans from Oxidative Stress and β-Amyloid Peptide Toxicity. PLoSONE 2013, 8, e63283. [CrossRef]
22. Sánchez-Salcedo, E.M.; Tassotti, M.; Del Rio, D.; Hernández, F.; Martínez, J.J.; Mena, P. (Poly)phenolicfingerprint and chemometric analysis of white (Morus alba L.) and black (Morus nigra L.) mulberry leaves byusing a non-targeted UHPLC–MS approach. Food Chem. 2016, 212, 250–255. [CrossRef]
23. Shao, S.-Y.; Feng, Z.-M.; Yang, Y.-N.; Jiang, J.-S.; Zhang, P. Eight new phenylethanoid glycoside derivativespossessing potential hepatoprotective activities from the fruits of Forsythia suspensa. Fitoterapia 2017, 122,132–137. [CrossRef] [PubMed]
24. Nastic, N.; Borrás-Linares, I.; Lozano-Sánchez, J.; Švarc-Gajic, J.; Segura-Carretero, A. Optimization ofthe extraction of phytochemicals from black mulberry (Morus nigra L.) leaves. J. Ind. Eng. Chem. 2018, 68,282–292. [CrossRef]
25. Cho, N.; Kim, H.W.; Kim, T.B.; Ransom, T.T.; Beutler, J.A.; Sung, S.H. Preparative Purification ofAnti-Proliferative Diarylheptanoids from Betula platyphylla by High-Speed Counter-Current Chromatography.Molecules 2016, 21, 700. [CrossRef] [PubMed]
26. Fakhfakh, N.; Jdir, H.; Jridi, M.; Rateb, M.; Belbahri, L.; Ayadi, M.A.; Nasri, M.; Zouari, N. The mallow,Malva aegyptiaca L. (Malvaceae): Phytochemistry analysis and effects on wheat dough performance and breadquality. LWT 2017, 75, 656–662. [CrossRef]

Antioxidants 2020, 9, 733 23 of 24
27. Katsube, T.; Yamasaki, M.; Shiwaku, K.; Ishijima, T.; Matsumoto, I.; Abe, K.; Yamasaki, Y. Effect of flavonolglycoside in mulberry (Morus alba L.) leaf on glucose metabolism and oxidative stress in liver in diet-inducedobese mice. J. Sci. Food Agric. 2010, 90, 2386–2392. [CrossRef]
28. Hotamisligil, G.; Shargill, N.; Spiegelman, B. Adipose expression of tumor necrosis factor-alpha: Direct rolein obesity-linked insulin resistance. Science 1993, 259, 87–91. [CrossRef]
29. Ouchi, N.; Parker, J.L.; Lugus, J.J.; Walsh, K. Adipokines in inflammation and metabolic disease. Nat. Rev.Immunol. 2011, 11, 85–97. [CrossRef]
30. Greenberg, A.S.; Obin, M.S. Obesity and the role of adipose tissue in inflammation and metabolism. Am. J.Clin. Nutr. 2006, 83, 461S–465S. [CrossRef]
31. Pal, M.; Febbraio, M.A.; Lancaster, G.I. The roles of c-Jun NH2-terminal kinases (JNKs) in obesity and insulinresistance. J. Physiol. 2015, 594, 267–279. [CrossRef]
32. Stienstra, R.; Duval, C.; Muller, M.; Kersten, S. PPARs, Obesity, and Inflammation. PPAR Res. 2006, 2007,1–10. [CrossRef]
33. Wang, Q.; Imam, M.U.; Yida, Z.; Wang, F.; Wang, F. Peroxisome Proliferator-Activated Receptor Gamma(PPARγ) as a Target for Concurrent Management of Diabetes and Obesity-Related Cancer. Curr. Pharm. Des.2017, 23, 3677–3688. [CrossRef] [PubMed]
34. Haluzík, M.M.; Haluzík, M. PPAR-alpha and insulin sensitivity. Physiol. Res. 2005, 55, 115–122. [PubMed]35. Cypess, A.M.; Kahn, C.R. Brown fat as a therapy for obesity and diabetes. Curr. Opin. Endocrinol. Diabetes
Obes. 2010, 17, 143–149. [CrossRef] [PubMed]36. Nedergaard, J.; Cannon, B. The Browning of White Adipose Tissue: Some Burning Issues. Cell Metab. 2014,
20, 396–407. [CrossRef] [PubMed]37. Petrovic, N.; Walden, T.B.; Shabalina, I.G.; Timmons, J.A.; Cannon, B.; Nedergaard, J. Chronic peroxisome
proliferator-activated receptor gamma (PPARgamma) activation of epididymally derived white adipocytecultures reveals a population of thermogenically competent, UCP1-containing adipocytes molecularlydistinct from classic brown adipocytes. J. Biol. Chem. 2010, 285, 7153–7164. [CrossRef]
38. Kershaw, E.E.; Flier, J.S. Adipose Tissue as an Endocrine Organ. J. Clin. Endocrinol. Metab. 2004, 89, 2548–2556.[CrossRef]
39. Acedo, S.C.; Gambero, S.; Cunha, F.G.P.; Lorand-Metze, I.; Gambero, A. Participation of leptin inthe determination of the macrophage phenotype: An additional role in adipocyte and macrophage crosstalk.Vitr. Cell. Dev. Boil. Anim. 2013, 49, 473–478. [CrossRef]
40. Al-Qahtani, S.M.; Bryzgalova, G.; Valladolid-Acebes, I.; Korach-André, M.; Dahlman-Wright, K.; Efendic, S.;Berggren, P.-O.; Portwood, N. 17β-Estradiol suppresses visceral adipogenesis and activates brown adiposetissue-specific gene expression. Horm. Mol. Boil. Clin. Investig. 2016, 29, 13–26. [CrossRef]
41. Gavito, A.L.; Bautista, D.; Suarez, J.D.; Badran, S.; Arco, R.; Pavón, F.J.; Serrano, A.; Rivera, P.; Decara, J.;Cuesta, A.L.; et al. Chronic IL-6 Administration Desensitizes IL-6 Response in Liver, Causes Hyperleptinemiaand Aggravates Steatosis in Diet-Induced-Obese Mice. PLoS ONE 2016, 11, e0157956. [CrossRef]
42. Choi, H.M.; Doss, H.M.; Kim, K.S. Multifaceted Physiological Roles of Adiponectin in Inflammation andDiseases. Int. J. Mol. Sci. 2020, 21, 1219. [CrossRef]
43. Kola, B.; Grossman, A.B.; Korbonits, M. The role of AMP-activated protein kinase in obesity. Front. Horm.Res. 2008, 36, 198–211. [CrossRef] [PubMed]
44. Kobayashi, Y.; Miyazawa, M.; Kamei, A.; Abe, K.; Kojima, T. Ameliorative Effects of Mulberry (Morus alba L.)Leaves on Hyperlipidemia in Rats Fed a High-Fat Diet: Induction of Fatty Acid Oxidation, Inhibition ofLipogenesis, and Suppression of Oxidative Stress. Biosci. Biotechnol. Biochem. 2010, 74, 2385–2395. [CrossRef][PubMed]
45. Abu-Farha, M.; Al-Khairi, I.; Cherian, P.; Chandy, B.; Sriraman, D.; Al-Hubail, A.; Al-Refaei, F.H.; AlTerki, A.;Abubaker, J. Increased ANGPTL3, 4 and ANGPTL8/betatrophin expression levels in obesity and T2D. LipidsHeal. Dis. 2016, 15, 181. [CrossRef] [PubMed]
46. Shepherd, P.R.; Kahn, B.B. Glucose Transporters and Insulin Action—Implications for Insulin Resistance andDiabetes Mellitus. N. Engl. J. Med. 1999, 341, 248–257. [CrossRef] [PubMed]
47. Jangra, S.; Raja Shekar, K.; Sharma, R.K.; Pothuraju, R.; Mohanty, A.K.; Kuruva, R.S. Ameliorative effect offermentable fibres on adiposity and insulin resistance in C57BL/6 mice fed a high-fat and sucrose diet. FoodFunct. 2019, 10, 3696–3705. [CrossRef]

Antioxidants 2020, 9, 733 24 of 24
48. Nagata, N.; Xu, L.; Kohno, S.; Ushida, Y.; Aoki, Y.; Umeda, R.; Fuke, N.; Zhuge, F.; Ni, Y.; Nagashimada, M.;et al. Glucoraphanin Ameliorates Obesity and Insulin Resistance Through Adipose Tissue Browning andReduction of Metabolic Endotoxemia in Mice. Diabetes 2017, 66, 1222–1236. [CrossRef]
49. Kalis, C.; Kanzler, B.; Lembo, A.; Poltorak, A.; Galanos, C.; Freudenberg, M.A. Toll-like receptor 4 expressionlevels determine the degree of LPS-susceptibility in mice. Eur. J. Immunol. 2003, 33, 798–805. [CrossRef]
50. Sharifnia, T.; Antoun, J.; Verriere, T.G.C.; Suarez, G.; Wattacheril, J.; Wilson, K.T.; Peek, R.M.; Abumrad, N.N.;Flynn, C.R. Hepatic TLR4 signaling in obese NAFLD. Am. J. Physiol. Liver Physiol. 2015, 309, G270–G278.[CrossRef]
51. Cox, A.J.; West, N.P.; Cripps, A.W. Obesity, inflammation, and the gut microbiota. Lancet Diabetes Endocrinol.2015, 3, 207–215. [CrossRef]
52. Damms-Machado, A.; Louis, S.; Schnitzer, A.; Volynets, V.; Rings, A.; Basrai, M.; Bischoff, S.C. Gut permeabilityis related to body weight, fatty liver disease, and insulin resistance in obese individuals undergoing weightreduction. Am. J. Clin. Nutr. 2016, 105, 127–135. [CrossRef]
53. Mele, L.; Bidault, G.; Mena, P.; Crozier, A.; Brighenti, F.; Vidal-Puig, A.; Del Rio, D. Dietary (Poly)phenols,Brown Adipose Tissue Activation, and Energy Expenditure: A Narrative Review. Adv. Nutr. 2017, 8, 694–704.[CrossRef] [PubMed]
54. Dos Santos, T.W.; Pereira, Q.C.; Teixeira, L.; Gambero, A.; Villena, J.A.; Ribeiro, M.L. Effects of Polyphenolson Thermogenesis and Mitochondrial Biogenesis. Int. J. Mol. Sci. 2018, 19, 2757. [CrossRef] [PubMed]
55. Scazzocchio, B.; Varì, R.; Filesi, C.; D’Archivio, M.; Santangelo, C.; Giovannini, C.; Iacovelli, A.; Silecchia, G.;Volti, G.L.; Galvano, F.; et al. Cyanidin-3-O-β-Glucoside and Protocatechuic Acid Exert Insulin-Like Effectsby Upregulating PPARγ Activity in Human Omental Adipocytes. Diabetes 2011, 60, 2234–2244. [CrossRef][PubMed]
56. Scazzocchio, B.; Varì, R.; Filesi, C.; Del Gaudio, I.; D’Archivio, M.; Santangelo, C.; Iacovelli, A.; Galvano, F.;Pluchinotta, F.R.; Giovannini, C.; et al. Protocatechuic acid activates key components of insulin signalingpathway mimicking insulin activity. Mol. Nutr. Food Res. 2015, 59, 1472–1481. [CrossRef]
57. Lee, C.W.; Seo, J.Y.; Lee, J.; Choi, J.W.; Cho, S.; Bae, J.Y.; Sohng, J.; Kim, S.O.; Kim, J.; Park, Y.I. 3- O-Glucosylation of quercetin enhances inhibitory effects on the adipocyte differentiation and lipogenesis.Biomed. Pharmacother. 2017, 95, 589–598. [CrossRef]
58. Varì, R.; Scazzocchio, B.; Santangelo, C.; Filesi, C.; Galvano, F.; D’Archivio, M.; Masella, R.; Giovannini, C.Protocatechuic Acid Prevents oxLDL-Induced Apoptosis by Activating JNK/Nrf2 Survival Signals inMacrophages. Oxidative Med. Cell. Longev. 2015, 2015, 1–11. [CrossRef]
59. Fernández-Moriano, C.; Divakar, P.K.; Crespo, A.; Gómez-Serranillos, M.P. In vitro neuroprotective potentialof lichen metabolite fumarprotocetraric acid via intracellular redox modulation. Toxicol. Appl. Pharmacol.2017, 316, 83–94. [CrossRef]
© 2020 by the authors. Licensee MDPI, Basel, Switzerland. This article is an open accessarticle distributed under the terms and conditions of the Creative Commons Attribution(CC BY) license (http://creativecommons.org/licenses/by/4.0/).