Comparative Study of Hyper Elastic Material Models · INTRODUCTION . The applications of hyper...
22
International Journal of Engineering and Manufacturing Science. ISSN 2249-3115 Volume 7, Number 2 (2017), pp. 149-170 © Research India Publications http://www.ripublication.com Comparative Study of Hyper Elastic Material Models Sneha Ramena 1 and Arthesh Basak 2 1 Sneha Ramena, M.Tech, Civil Engineering Department, Gitam University, Andhra Pradesh, India. 2 Arthesh Basak, Assistant professor, Civil Engineering Department, Gitam University, Andhra Pradesh, India. Abstract Hyper elasticity refers to a constitutive response that is derivable from free elastic potential energy. Hyper elastic materials are widely used in different fields due to its unique Stress-Strain relationship and independent strain rate. Rubber is the common example for this kind of material and is most widely used due to their advantages like high elasticity, resistance, breaking strength, good wear, elongation, etc. In structural engineering, Hyper elastic material, rubber have been used in dampers, conveyor belts, vibration isolation bearings or shock absorbers and impact absorbers. An increase of applications requires a better understanding of the mechanical behaviour of rubber-like materials, it is necessary to develop a basic understanding of the various hyper elastic models using ANSYS. It is the best software used for the modelling of large deformations and provides a means of modelling the Stress-Strain behaviour of such materials. The objective of present project is to study the Strain energy functions for various models and the various parameters of each model with different displacements values and to check the Stress Strain relations obtained from each model by using ANSYS 16.2. This work is to be carried for two types of cases, first case is the comparison of Two plates one is with a single central circular hole and the other is single central circular hole with two adjacent holes with one end fixed and the second case is the Dog-bone geometry. Keywords: Hyper elasticity 1, ANSYS 2.
Transcript of Comparative Study of Hyper Elastic Material Models · INTRODUCTION . The applications of hyper...
International Journal of Engineering and Manufacturing Science.
ISSN 2249-3115 Volume 7, Number 2 (2017), pp. 149-170
© Research India Publications
http://www.ripublication.com
Comparative Study of Hyper Elastic Material Models
Sneha Ramena1 and Arthesh Basak2
1 Sneha Ramena, M.Tech, Civil Engineering Department, Gitam University, Andhra Pradesh, India.
2Arthesh Basak, Assistant professor, Civil Engineering Department, Gitam University, Andhra Pradesh, India.
Abstract
Hyper elasticity refers to a constitutive response that is derivable from free
elastic potential energy. Hyper elastic materials are widely used in different
fields due to its unique Stress-Strain relationship and independent strain rate.
Rubber is the common example for this kind of material and is most widely
used due to their advantages like high elasticity, resistance, breaking strength,
good wear, elongation, etc. In structural engineering, Hyper elastic material,
rubber have been used in dampers, conveyor belts, vibration isolation bearings
or shock absorbers and impact absorbers. An increase of applications requires
a better understanding of the mechanical behaviour of rubber-like materials, it
is necessary to develop a basic understanding of the various hyper elastic
models using ANSYS. It is the best software used for the modelling of large
deformations and provides a means of modelling the Stress-Strain behaviour
of such materials. The objective of present project is to study the Strain energy
functions for various models and the various parameters of each model with
different displacements values and to check the Stress Strain relations obtained
from each model by using ANSYS 16.2. This work is to be carried for two
types of cases, first case is the comparison of Two plates one is with a single
central circular hole and the other is single central circular hole with two
adjacent holes with one end fixed and the second case is the Dog-bone
geometry.
Keywords: Hyper elasticity 1, ANSYS 2.
150 Sneha Ramena and Arthesh Basak
INTRODUCTION
The applications of hyper elastic rubber-like materials in different industrial areas
were increased. In engineering fields, rubbers have been used in dampers, conveyor
belts, vibration isolation bearings or shock absorbers and impact absorbers whereas in
aerospace industry rubber rings are used in fuel systems. In hyper elastic materials
lesser stresses are developed for any amount of strains compared to a linear elastic
material. Therefore, hyper elastic materials are able to take much larger strains
without significant in stress. Thus, these plates are compared with different
displacements and with different size of circle diameter with the change of model
parameters.
G.Marckmann and E.Verron [1] studied all material parameters and the stretch range
of validity of each model available in ANSYS and proposed a thorough comparison
of twenty hyper elastic models for rubber-like materials and were ranked based on the
greater is the number of material parameters and larger is the validity range of a
model. Kurt Miller [2] studied the input requirements of mathematical material
models that exist in structural, non-linear and the incompressible attributes of
elastomers by the multiple strian states testings. Prashant Nimbalkar et al., [3] studied
3, 5 & 9 parameter models in ANSYS were used by taking inputs from experimental
stress-strain data and performed a finite element analysis on a hyper elastic Mooney-
Rivlin material model and applied it to the air intake system and Uni-axial test in
ANSYS were performed and curve fitting was carried out. Tie Hu and Jaydev P.
Desai [4] studied D/A ratio upon stress concentration factor for different cases with
different mesh element size and loads to see how part geometry can influence the
maximum stress at critical points for a rectangular plate with a large hole in the centre
and changing the adjacent small hole diameters to see the effects on the magnitude of
the maximum stress and how this influences the stress concentration factor. Vishal
Nayyar et al., [5] studied Stress concentration factor, Finite element analysis to
calculate stress concentration around a circular hole in the composite plate under
longitudinal tensile load.
The primary scope is to compare stress from non-linear models by using ANSYS
16.2. The comparison is done by varying displacement, hole diameter and thickness
of the plate. The secondary scope is to compare stresses with coefficients of different
models by using ANSYS 16.2.
METHODOLOGY
Comparison of non linear hyper elastic material models available in ANSYS for two
different type of cases, first case is The Comparison of Two plates with a central
single circular hole and a central circular hole with two adjacent holes and the second
case is with the Dog-bone geometry.
Comparative Study of Hyper Elastic Material Models 151
CASE 1, A plate of size 1000*1000*10mm is one plate with central circular hole and
another plate with central circular hole with two adjacent holes (adjacent hole
diameter, 50mm). The initial diameter of the central circular hole is 100mm and is
then increased in steps of 200, 300mm by keeping dimensions of the plate fixed. The
plate is fixed with all degrees of freedom at one end and other end is subjected to
displacements in x direction with displacement 500mm. Considering Plane 182
elements (4-noded quadrilateral) that deals with plane stress and plane strain, the
material properties of an hyper elastic rubber like material is obtained from
experimental (stress-strain) data from Prashant Nimbalkar et al., [3] and is used to
evaluate the hyper elastic material models (Mooney-Rivlin(2,3,5parameters), Neo-
Hookean, Ogden) with the mesh element tool size 3 as given in ANSYS 16.2. The
value of maximum stress in x-direction and deflection of a plate is determined and
from time hysteresis analysis a Stress-Strain graph will be obtained. Effect of the
geometry by the stress distribution around the hole is studied.
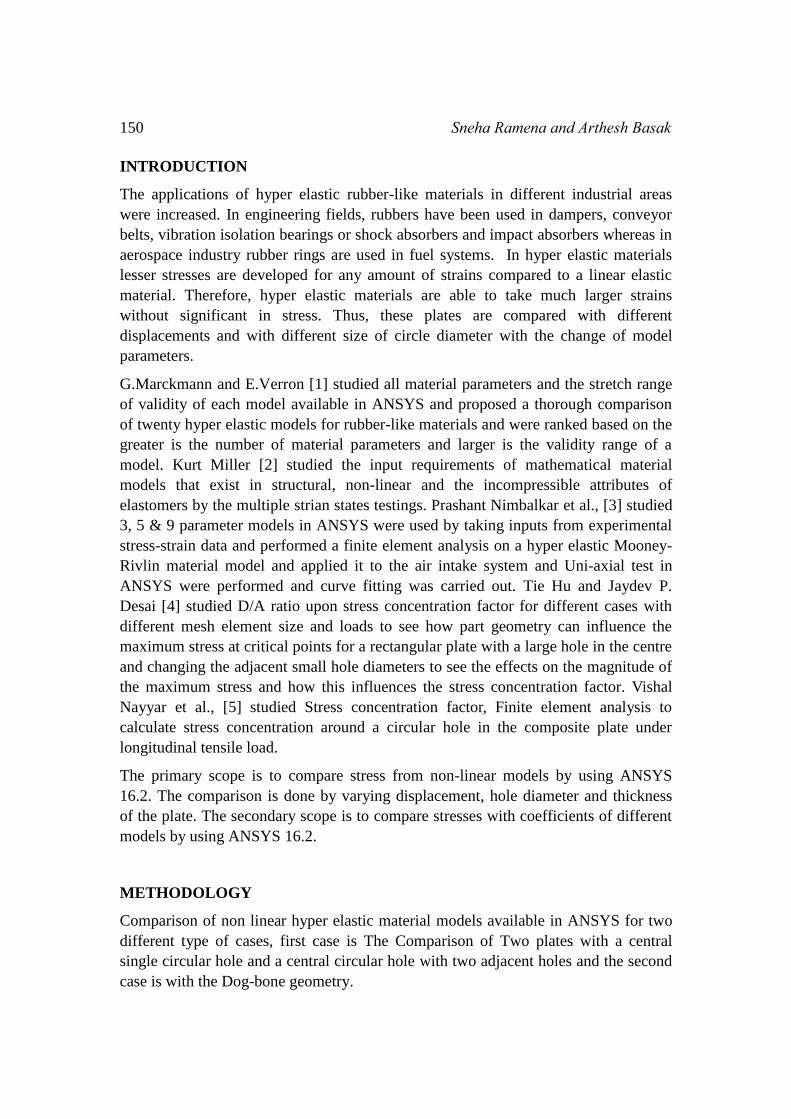
Figure 1: Mesh plate with a circular hole at the centre
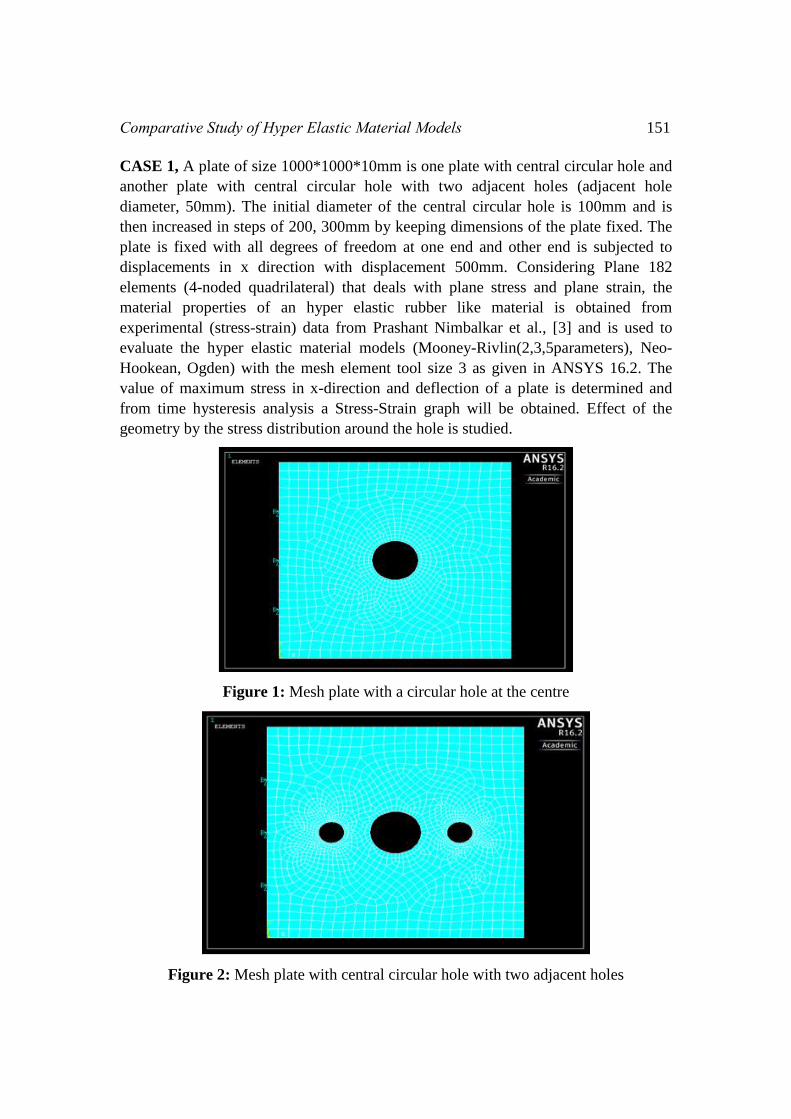
Figure 2: Mesh plate with central circular hole with two adjacent holes

152 Sneha Ramena and Arthesh Basak
CASE 2, A Dog-bone plate with uniform thickness of 6mm as shown in figure 3
below (all dimensions are in mm), one end is fixed with all degrees of freedom and
other end is subjected to displacements in X direction and its adjacent sides were
fixed in Y direction, initial displacement is 10% and is then increased in steps up to
90%. Considering a Plane 182 element (4-noded quadrilateral) that deals with plane
stress and plane strain, the material properties of an hyper elastic rubber like material
is obtained from experimental (stress-strain) data from Prashant Nimbalkar et al., [3]
and is used to evaluate the hyper elastic material models (Mooney-Rivlin (2, 3,
5parameters), Neo-Hookean, Ogden) with the mesh element tool size 3 as given in
ANSYS 16.2. The value of maximum stress in x-direction and deflection of a plate is
determined and from time hysteresis analysis a Stress-Strain graph will be obtained.
Here the original strain length in this case refers to the specimen length 57mm as
shown in figure3.
Figure 3: Dog-bone geometry
Figure 4: Dog-bone geometry with mesh
Comparative Study of Hyper Elastic Material Models 153
RESULTS OBTAINED:
Case 1: The Comparison of Two Plates with a central single circular hole and a
central circular hole with two adjacent holes (Triple hole).
Table 1:. Central hole diameter 100mm and maximum strain 0.5.
Models
Single circular hole Circular hole with two
adjacent holes
Maximum
strain
Maximum
stress
Maximum
strain
Maximum
stress
Mooney Rivlin
(Parameters)
2 0.239335 16.18 0.240048 14.1841
3 0.247005 7.52514 0.247321 6.84716
5 0.239012 16.4077 0.239741 14.436
Neo-Hookean 0.241522 16.2174 0.242015 14.1471
Ogden
(Order)
1 0.240647 15.8986 0.241203 14.0155
2 0.240136 16.2102 0.240771 14.1537
3 0.248241 11.7514 0.240751 14.1622
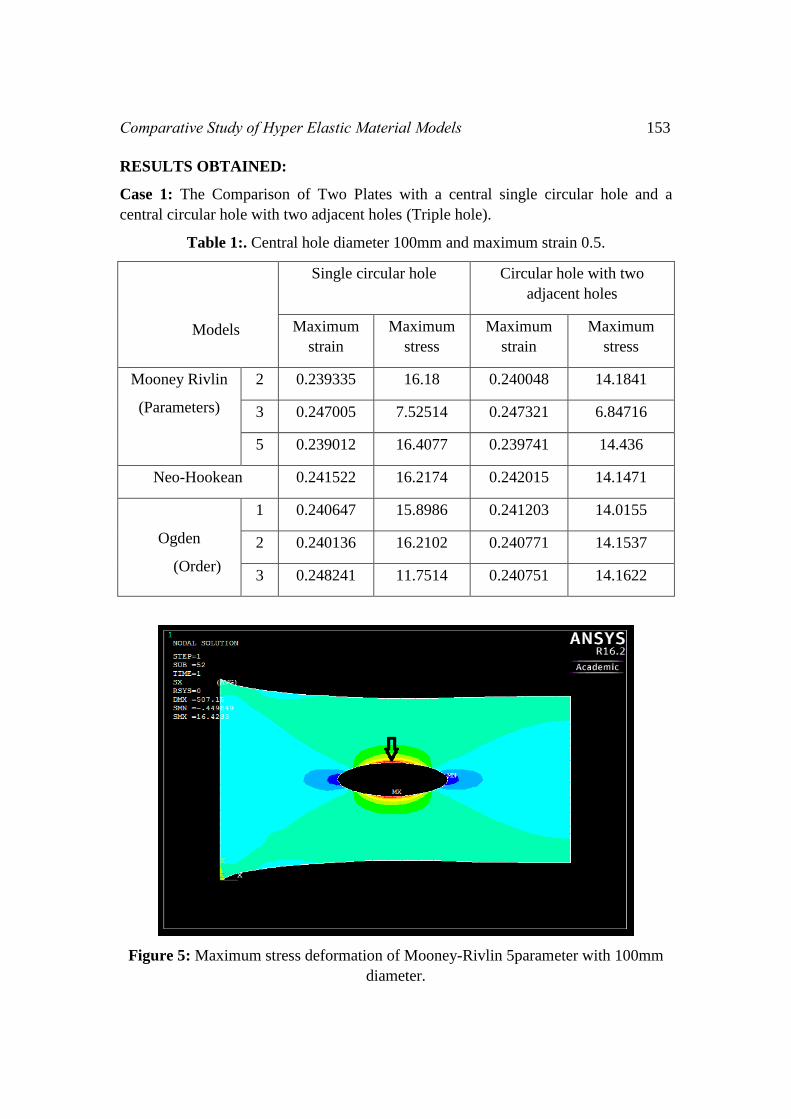
Figure 5: Maximum stress deformation of Mooney-Rivlin 5parameter with 100mm
diameter.
154 Sneha Ramena and Arthesh Basak
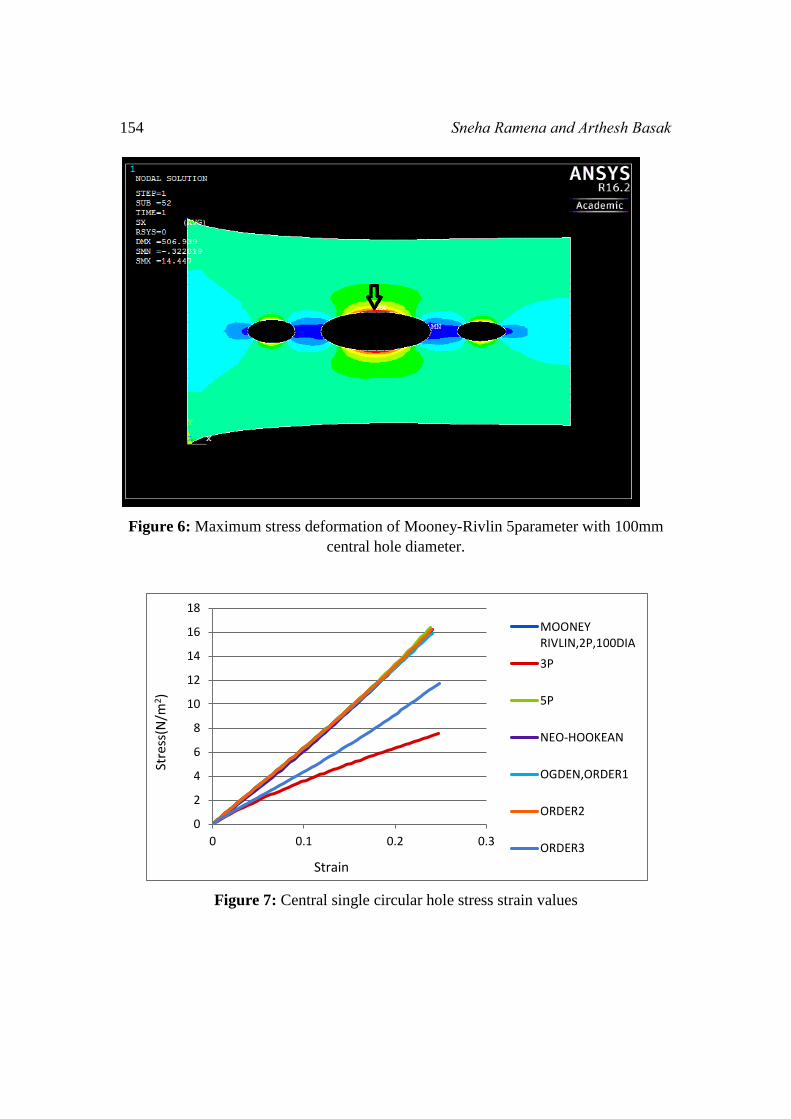
Figure 6: Maximum stress deformation of Mooney-Rivlin 5parameter with 100mm
central hole diameter.
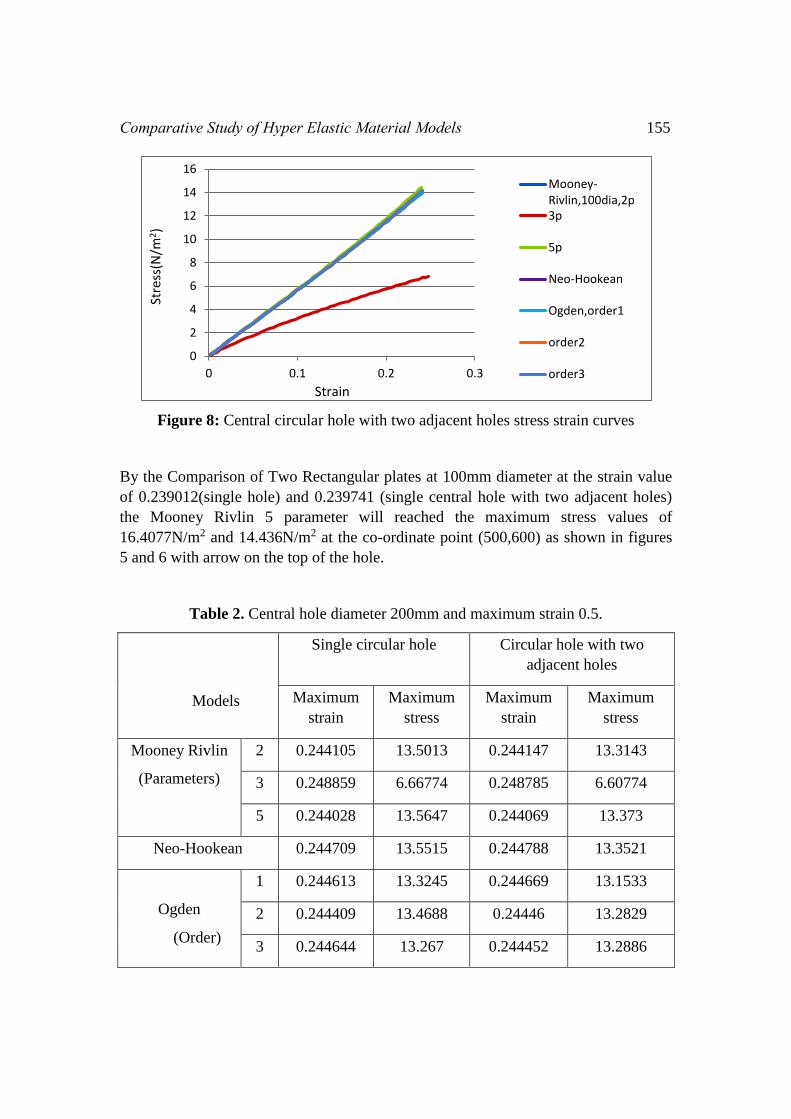
Figure 7: Central single circular hole stress strain values
0
2
4
6
8
10
12
14
16
18
0 0.1 0.2 0.3
MOONEYRIVLIN,2P,100DIA
3P
5P
NEO-HOOKEAN
OGDEN,ORDER1
ORDER2
ORDER3
Stre
ss(N
/m2)
Strain
Comparative Study of Hyper Elastic Material Models 155
Figure 8: Central circular hole with two adjacent holes stress strain curves
By the Comparison of Two Rectangular plates at 100mm diameter at the strain value
of 0.239012(single hole) and 0.239741 (single central hole with two adjacent holes)
the Mooney Rivlin 5 parameter will reached the maximum stress values of
16.4077N/m2 and 14.436N/m2 at the co-ordinate point (500,600) as shown in figures
5 and 6 with arrow on the top of the hole.
Table 2. Central hole diameter 200mm and maximum strain 0.5.
Models
Single circular hole Circular hole with two
adjacent holes
Maximum
strain
Maximum
stress
Maximum
strain
Maximum
stress
Mooney Rivlin
(Parameters)
2 0.244105 13.5013 0.244147 13.3143
3 0.248859 6.66774 0.248785 6.60774
5 0.244028 13.5647 0.244069 13.373
Neo-Hookean 0.244709 13.5515 0.244788 13.3521
Ogden
(Order)
1 0.244613 13.3245 0.244669 13.1533
2 0.244409 13.4688 0.24446 13.2829
3 0.244644 13.267 0.244452 13.2886
0
2
4
6
8
10
12
14
16
0 0.1 0.2 0.3
Mooney-Rivlin,100dia,2p3p
5p
Neo-Hookean
Ogden,order1
order2
order3
Stre
ss(N
/m2)
Strain
156 Sneha Ramena and Arthesh Basak
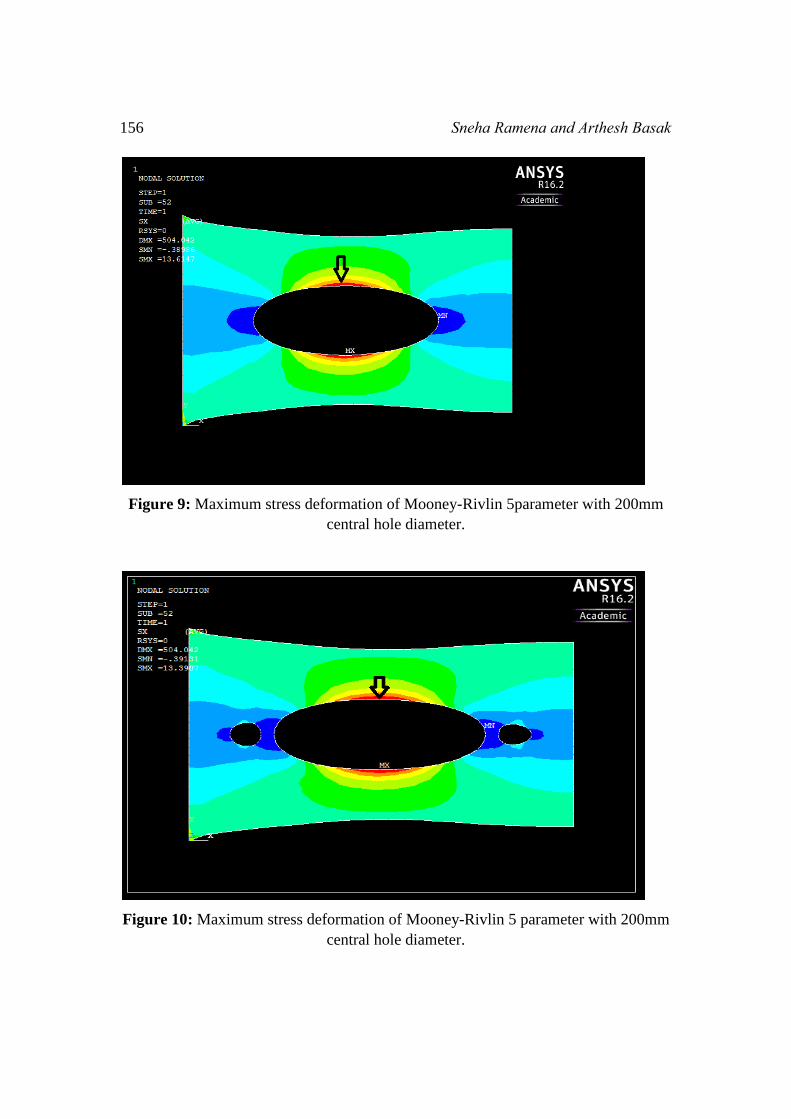
Figure 9: Maximum stress deformation of Mooney-Rivlin 5parameter with 200mm
central hole diameter.
Figure 10: Maximum stress deformation of Mooney-Rivlin 5 parameter with 200mm
central hole diameter.
Comparative Study of Hyper Elastic Material Models 157
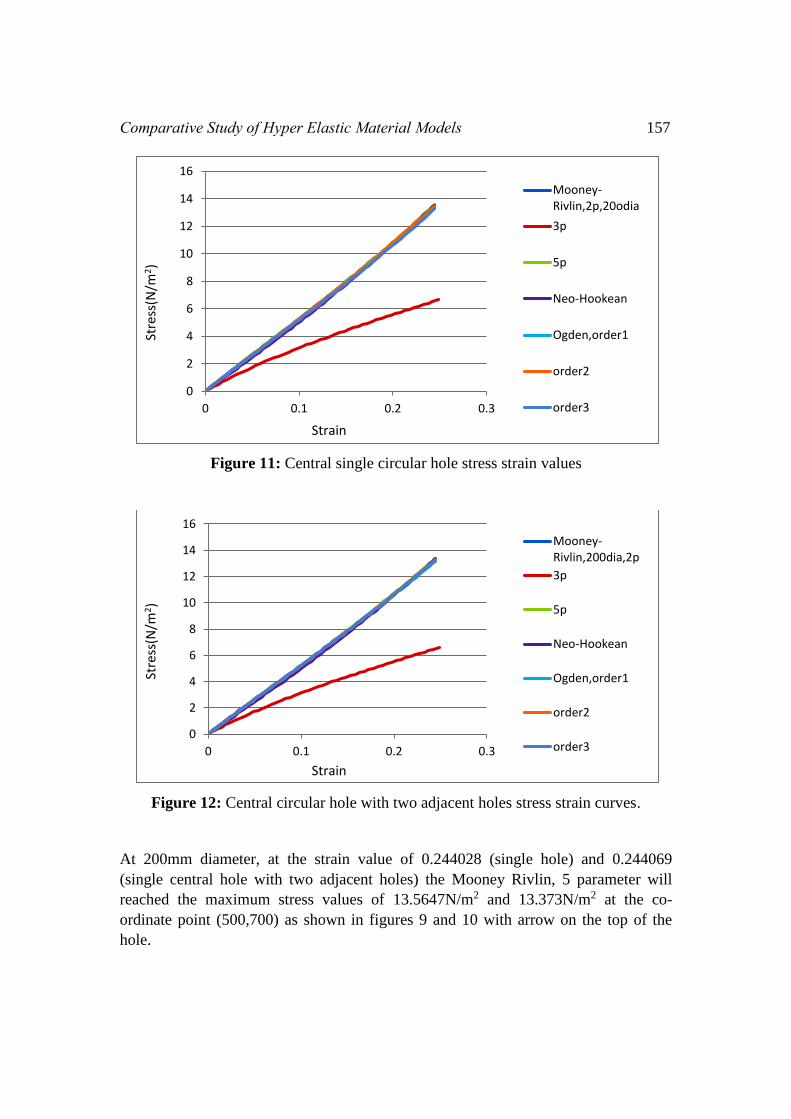
Figure 11: Central single circular hole stress strain values
Figure 12: Central circular hole with two adjacent holes stress strain curves.
At 200mm diameter, at the strain value of 0.244028 (single hole) and 0.244069
(single central hole with two adjacent holes) the Mooney Rivlin, 5 parameter will
reached the maximum stress values of 13.5647N/m2 and 13.373N/m2 at the co-
ordinate point (500,700) as shown in figures 9 and 10 with arrow on the top of the
hole.
0
2
4
6
8
10
12
14
16
0 0.1 0.2 0.3
Mooney-Rivlin,2p,20odia
3p
5p
Neo-Hookean
Ogden,order1
order2
order3
Stre
ss(N
/m2)
Strain
0
2
4
6
8
10
12
14
16
0 0.1 0.2 0.3
Mooney-Rivlin,200dia,2p
3p
5p
Neo-Hookean
Ogden,order1
order2
order3
Stre
ss(N
/m2)
Strain
158 Sneha Ramena and Arthesh Basak
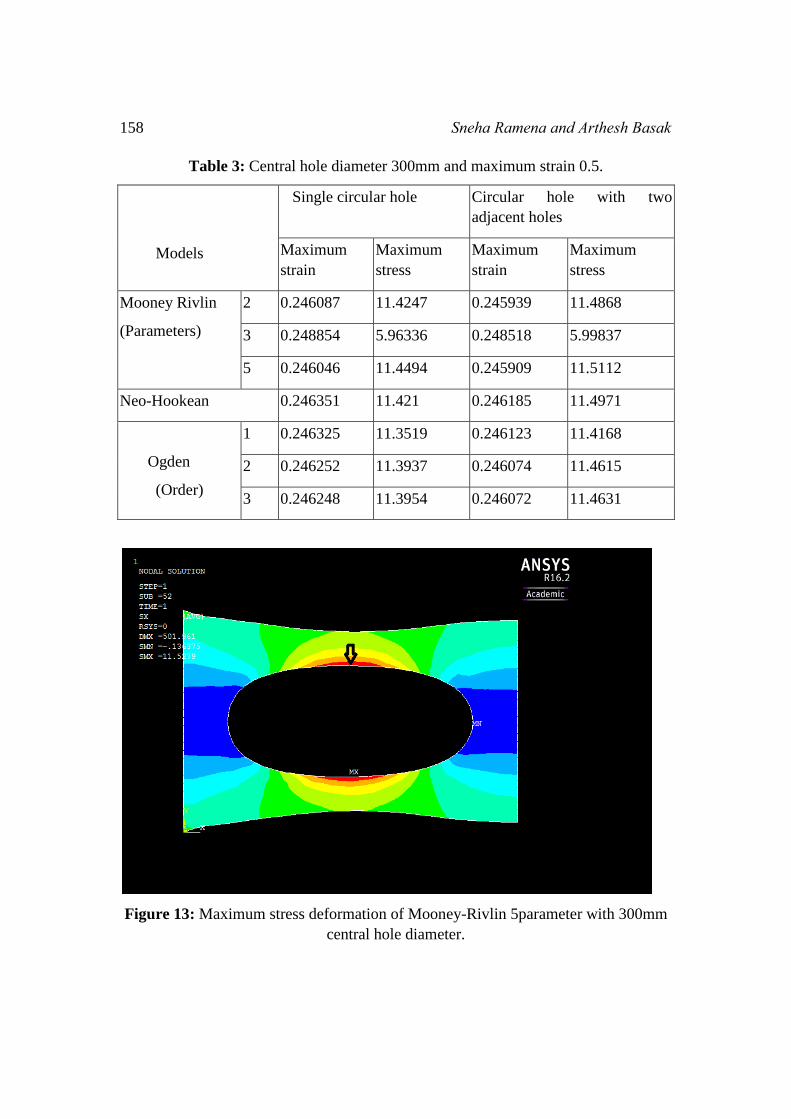
Table 3: Central hole diameter 300mm and maximum strain 0.5.
Models
Single circular hole Circular hole with two
adjacent holes
Maximum
strain
Maximum
stress
Maximum
strain
Maximum
stress
Mooney Rivlin
(Parameters)
2 0.246087 11.4247 0.245939 11.4868
3 0.248854 5.96336 0.248518 5.99837
5 0.246046 11.4494 0.245909 11.5112
Neo-Hookean 0.246351 11.421 0.246185 11.4971
Ogden
(Order)
1 0.246325 11.3519 0.246123 11.4168
2 0.246252 11.3937 0.246074 11.4615
3 0.246248 11.3954 0.246072 11.4631
Figure 13: Maximum stress deformation of Mooney-Rivlin 5parameter with 300mm
central hole diameter.
Comparative Study of Hyper Elastic Material Models 159
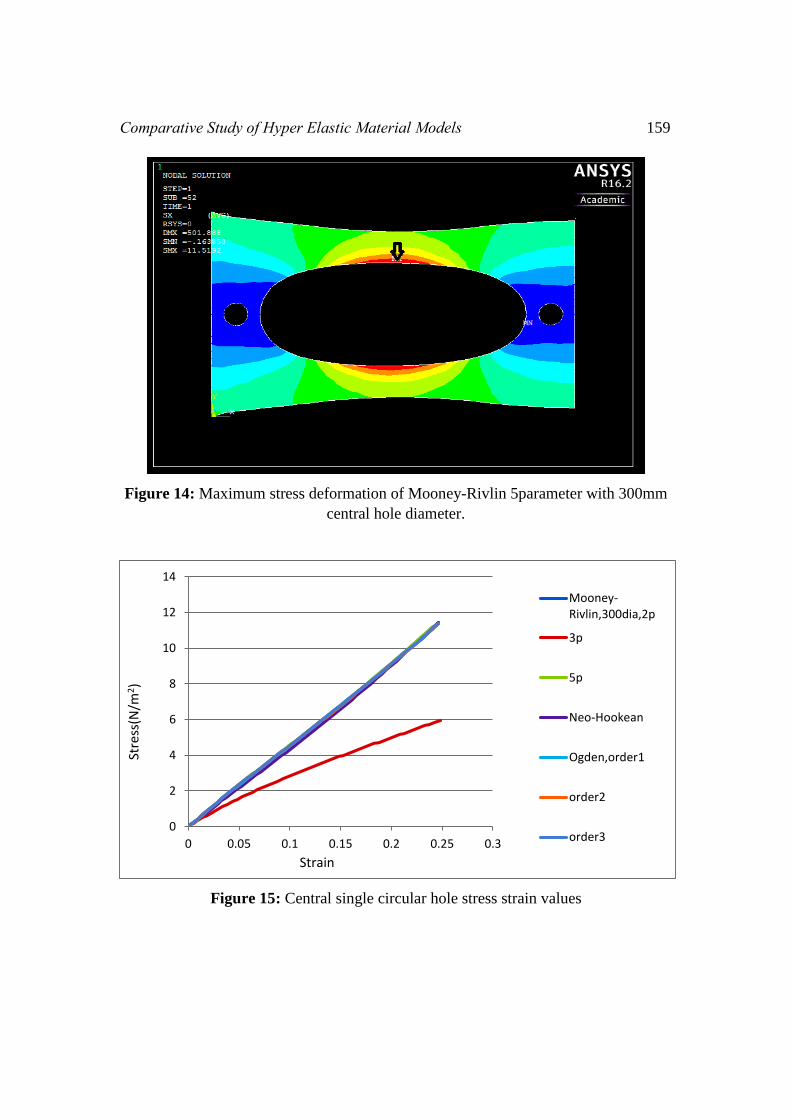
Figure 14: Maximum stress deformation of Mooney-Rivlin 5parameter with 300mm
central hole diameter.
Figure 15: Central single circular hole stress strain values
0
2
4
6
8
10
12
14
0 0.05 0.1 0.15 0.2 0.25 0.3
Mooney-Rivlin,300dia,2p
3p
5p
Neo-Hookean
Ogden,order1
order2
order3
Stre
ss(N
/m2)
Strain
160 Sneha Ramena and Arthesh Basak
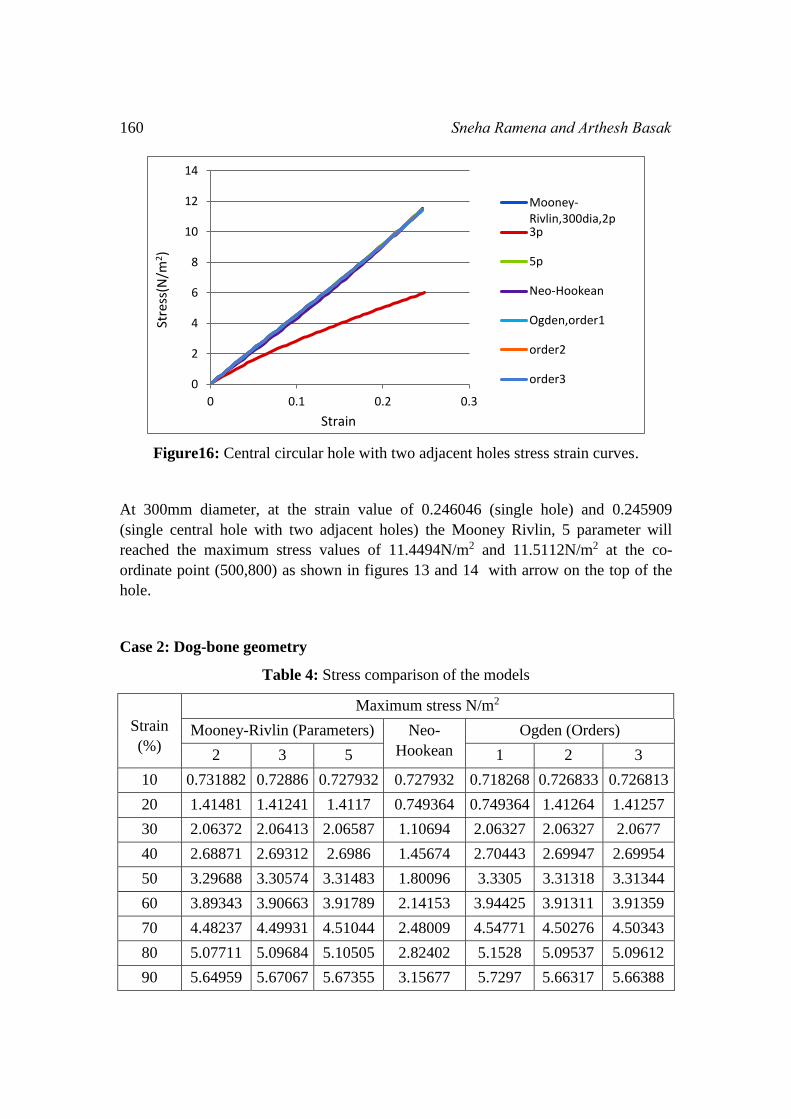
Figure16: Central circular hole with two adjacent holes stress strain curves.
At 300mm diameter, at the strain value of 0.246046 (single hole) and 0.245909
(single central hole with two adjacent holes) the Mooney Rivlin, 5 parameter will
reached the maximum stress values of 11.4494N/m2 and 11.5112N/m2 at the co-
ordinate point (500,800) as shown in figures 13 and 14 with arrow on the top of the
hole.
Case 2: Dog-bone geometry
Table 4: Stress comparison of the models
Strain
(%)
Maximum stress N/m2
Mooney-Rivlin (Parameters) Neo-
Hookean
Ogden (Orders)
2 3 5 1 2 3
10 0.731882 0.72886 0.727932 0.727932 0.718268 0.726833 0.726813
20 1.41481 1.41241 1.4117 0.749364 0.749364 1.41264 1.41257
30 2.06372 2.06413 2.06587 1.10694 2.06327 2.06327 2.0677
40 2.68871 2.69312 2.6986 1.45674 2.70443 2.69947 2.69954
50 3.29688 3.30574 3.31483 1.80096 3.3305 3.31318 3.31344
60 3.89343 3.90663 3.91789 2.14153 3.94425 3.91311 3.91359
70 4.48237 4.49931 4.51044 2.48009 4.54771 4.50276 4.50343
80 5.07711 5.09684 5.10505 2.82402 5.1528 5.09537 5.09612
90 5.64959 5.67067 5.67355 3.15677 5.7297 5.66317 5.66388
0
2
4
6
8
10
12
14
0 0.1 0.2 0.3
Mooney-Rivlin,300dia,2p3p
5p
Neo-Hookean
Ogden,order1
order2
order3
Stre
ss(N
/m2)
Strain
Comparative Study of Hyper Elastic Material Models 161
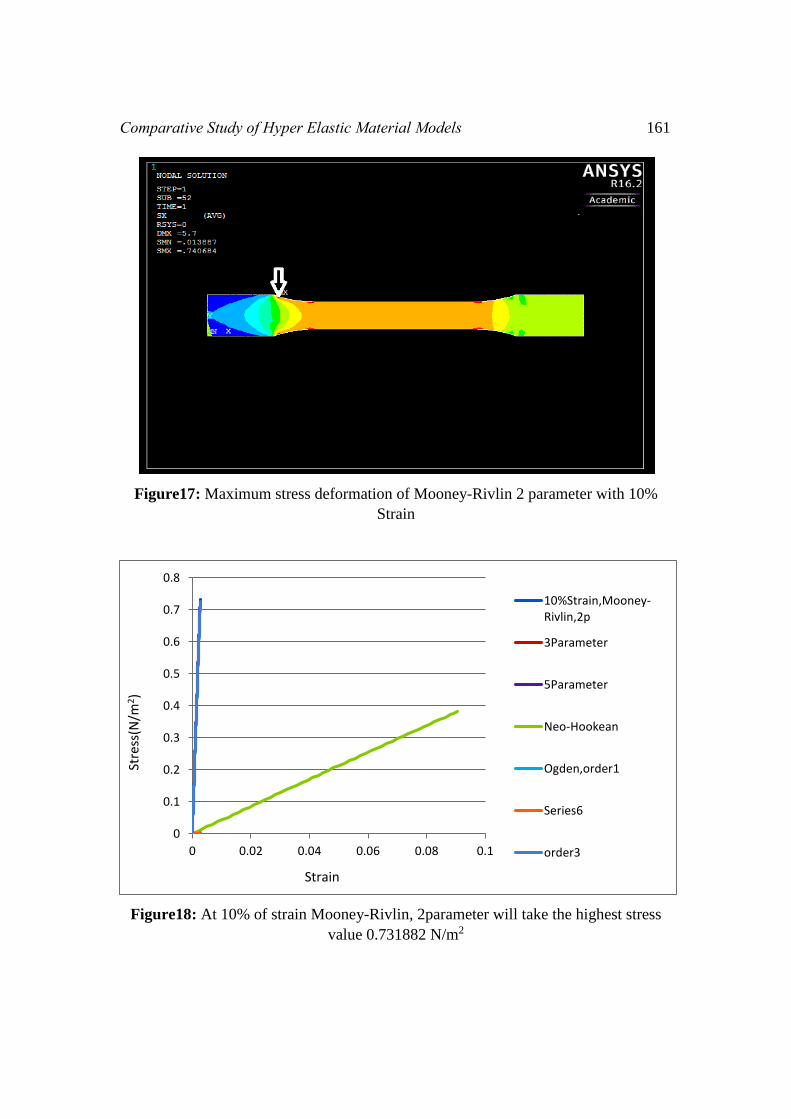
Figure17: Maximum stress deformation of Mooney-Rivlin 2 parameter with 10%
Strain
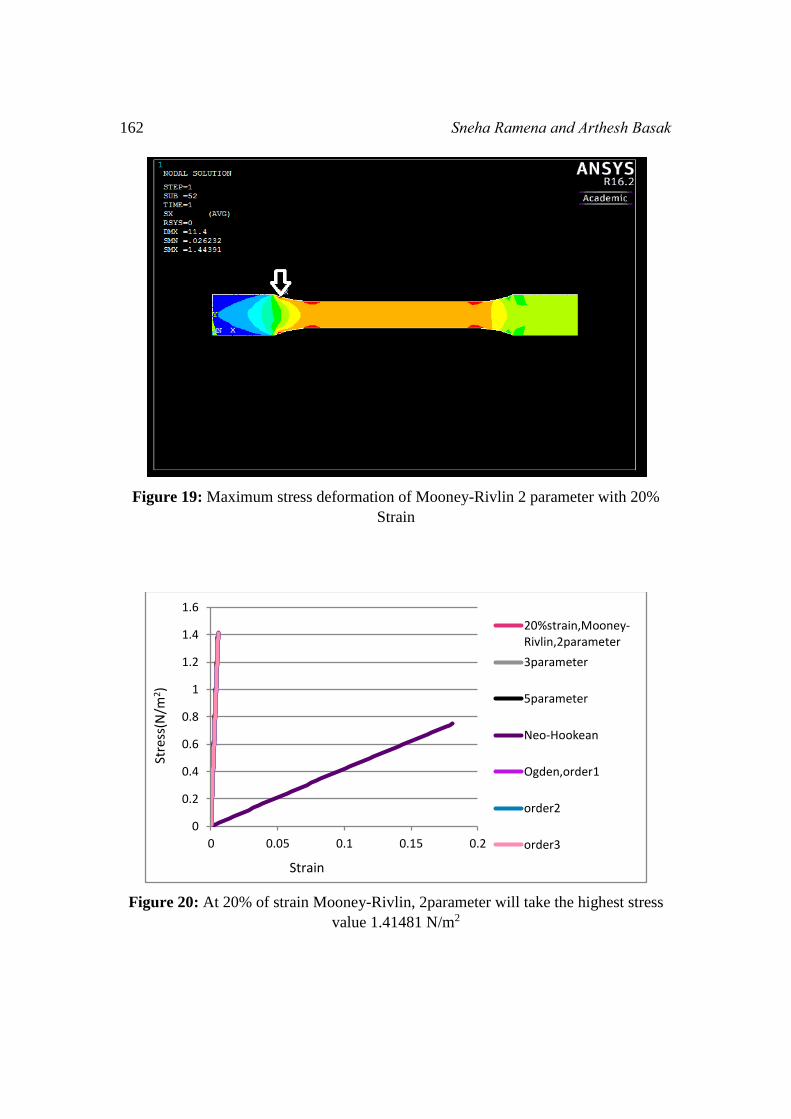
Figure18: At 10% of strain Mooney-Rivlin, 2parameter will take the highest stress
value 0.731882 N/m2
0
0.1
0.2
0.3
0.4
0.5
0.6
0.7
0.8
0 0.02 0.04 0.06 0.08 0.1
10%Strain,Mooney-Rivlin,2p
3Parameter
5Parameter
Neo-Hookean
Ogden,order1
Series6
order3
Stre
ss(N
/m2)
Strain
162 Sneha Ramena and Arthesh Basak
Figure 19: Maximum stress deformation of Mooney-Rivlin 2 parameter with 20%
Strain
Figure 20: At 20% of strain Mooney-Rivlin, 2parameter will take the highest stress
value 1.41481 N/m2
0
0.2
0.4
0.6
0.8
1
1.2
1.4
1.6
0 0.05 0.1 0.15 0.2
20%strain,Mooney-Rivlin,2parameter
3parameter
5parameter
Neo-Hookean
Ogden,order1
order2
order3
Stre
ss(N
/m2)
Strain
Comparative Study of Hyper Elastic Material Models 163
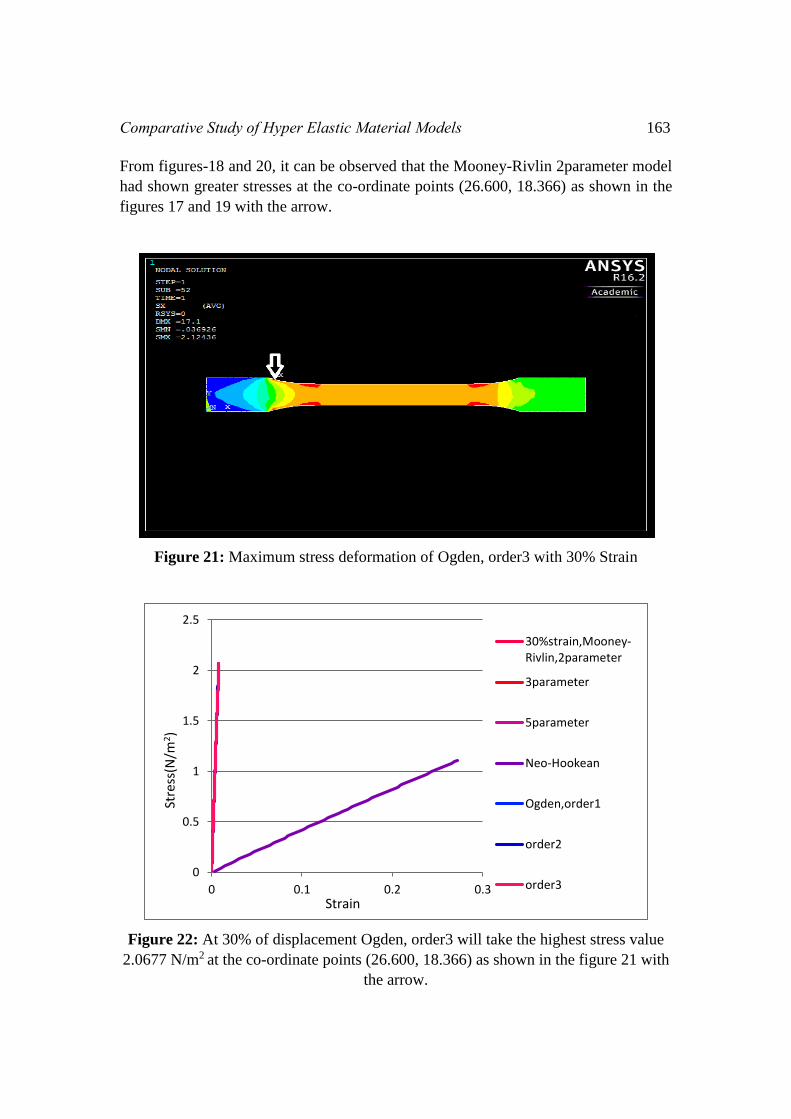
From figures-18 and 20, it can be observed that the Mooney-Rivlin 2parameter model
had shown greater stresses at the co-ordinate points (26.600, 18.366) as shown in the
figures 17 and 19 with the arrow.
Figure 21: Maximum stress deformation of Ogden, order3 with 30% Strain
Figure 22: At 30% of displacement Ogden, order3 will take the highest stress value
2.0677 N/m2 at the co-ordinate points (26.600, 18.366) as shown in the figure 21 with
the arrow.
0
0.5
1
1.5
2
2.5
0 0.1 0.2 0.3
30%strain,Mooney-Rivlin,2parameter
3parameter
5parameter
Neo-Hookean
Ogden,order1
order2
order3
Stre
ss(N
/m2)
Strain
164 Sneha Ramena and Arthesh Basak
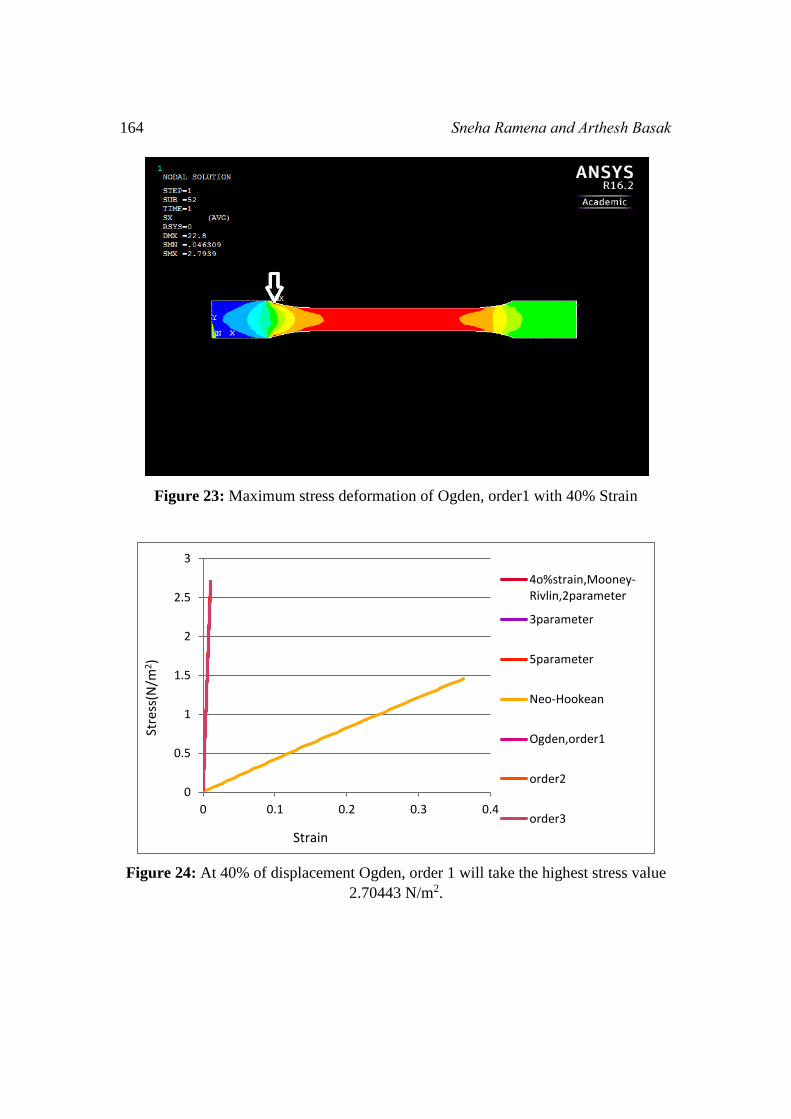
Figure 23: Maximum stress deformation of Ogden, order1 with 40% Strain
Figure 24: At 40% of displacement Ogden, order 1 will take the highest stress value
2.70443 N/m2.
0
0.5
1
1.5
2
2.5
3
0 0.1 0.2 0.3 0.4
4o%strain,Mooney-Rivlin,2parameter
3parameter
5parameter
Neo-Hookean
Ogden,order1
order2
order3
Stre
ss(N
/m2)
Strain
Comparative Study of Hyper Elastic Material Models 165
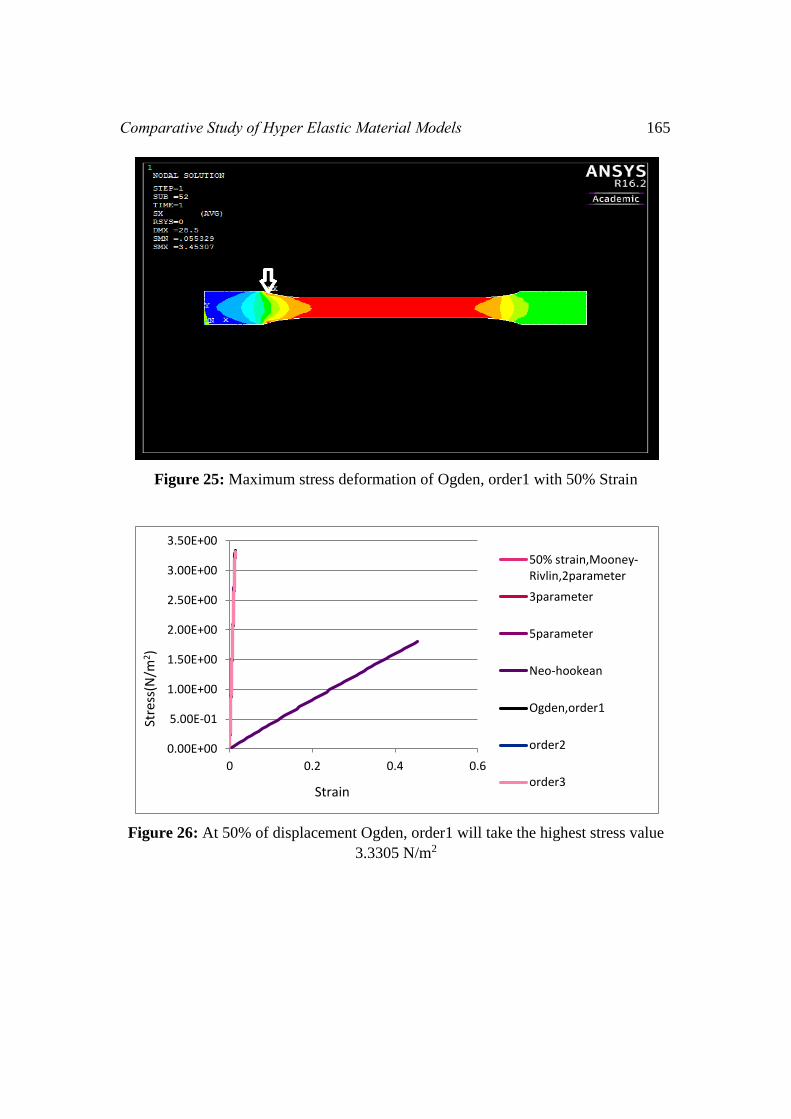
Figure 25: Maximum stress deformation of Ogden, order1 with 50% Strain
Figure 26: At 50% of displacement Ogden, order1 will take the highest stress value
3.3305 N/m2
0.00E+00
5.00E-01
1.00E+00
1.50E+00
2.00E+00
2.50E+00
3.00E+00
3.50E+00
0 0.2 0.4 0.6
50% strain,Mooney-Rivlin,2parameter
3parameter
5parameter
Neo-hookean
Ogden,order1
order2
order3
Stre
ss(N
/m2)
Strain
166 Sneha Ramena and Arthesh Basak
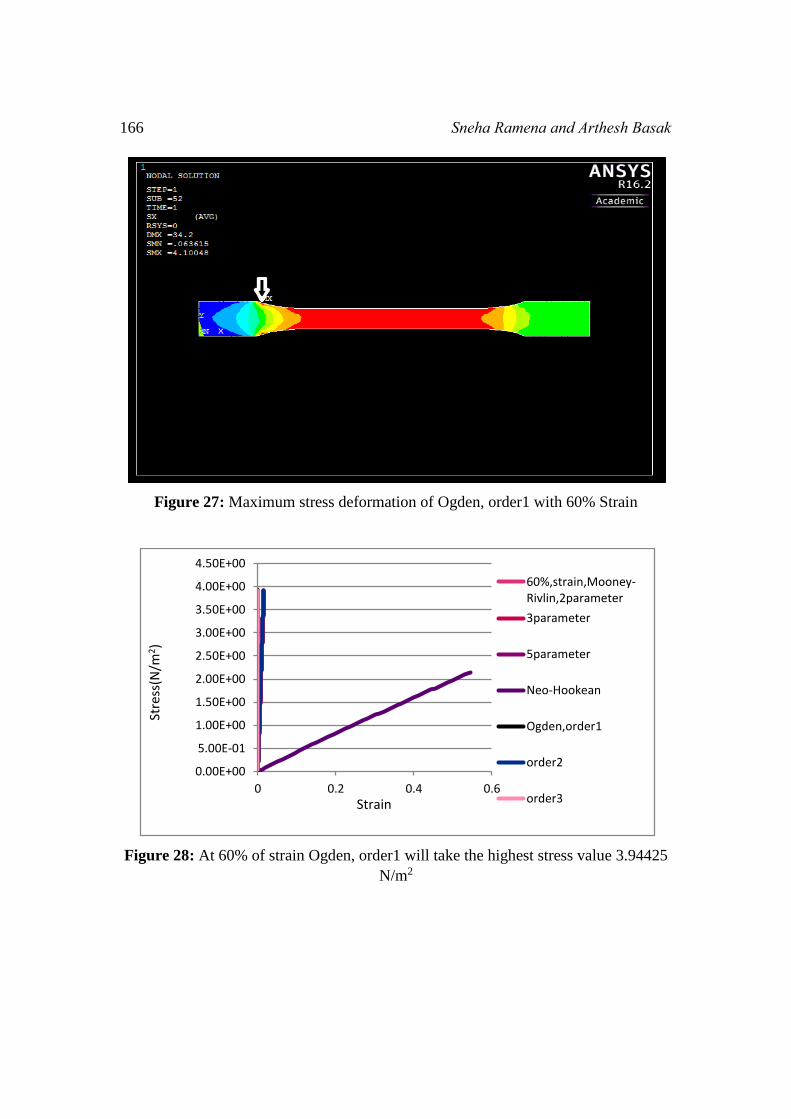
Figure 27: Maximum stress deformation of Ogden, order1 with 60% Strain
Figure 28: At 60% of strain Ogden, order1 will take the highest stress value 3.94425
N/m2
0.00E+00
5.00E-01
1.00E+00
1.50E+00
2.00E+00
2.50E+00
3.00E+00
3.50E+00
4.00E+00
4.50E+00
0 0.2 0.4 0.6
60%,strain,Mooney-Rivlin,2parameter
3parameter
5parameter
Neo-Hookean
Ogden,order1
order2
order3
Stre
ss(N
/m2)
Strain
Comparative Study of Hyper Elastic Material Models 167
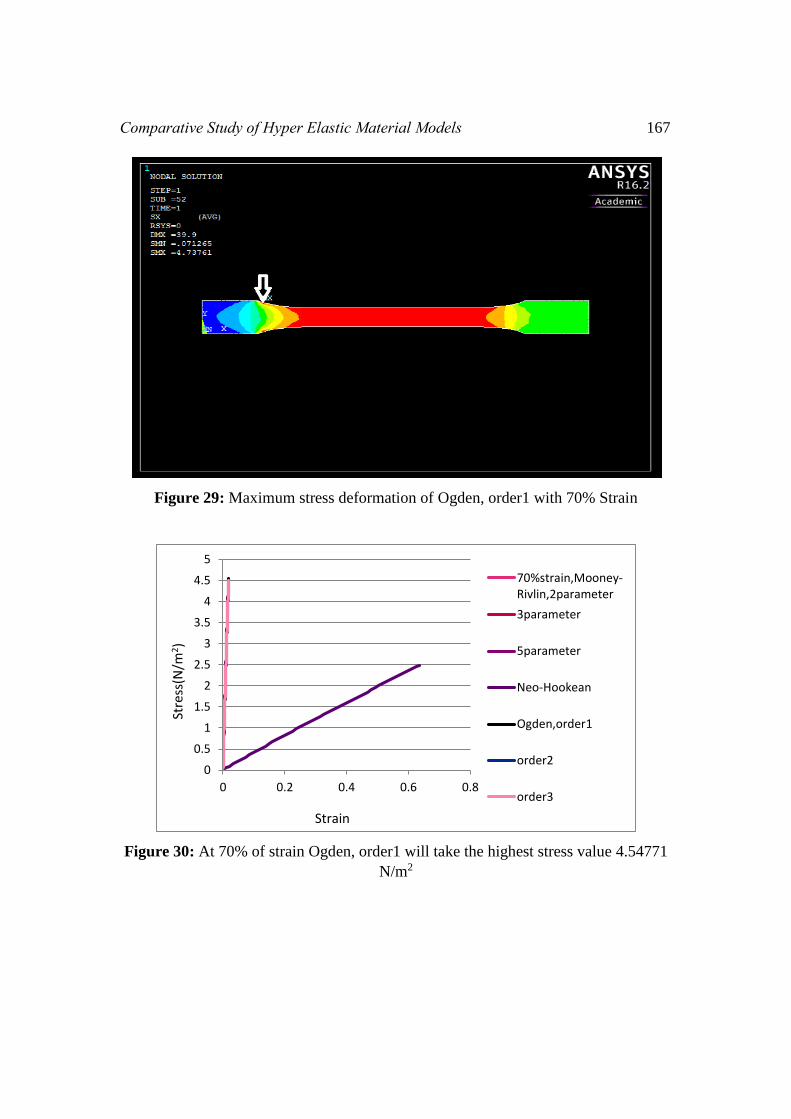
Figure 29: Maximum stress deformation of Ogden, order1 with 70% Strain
Figure 30: At 70% of strain Ogden, order1 will take the highest stress value 4.54771
N/m2
0
0.5
1
1.5
2
2.5
3
3.5
4
4.5
5
0 0.2 0.4 0.6 0.8
70%strain,Mooney-Rivlin,2parameter
3parameter
5parameter
Neo-Hookean
Ogden,order1
order2
order3
Stre
ss(N
/m2)
Strain
168 Sneha Ramena and Arthesh Basak
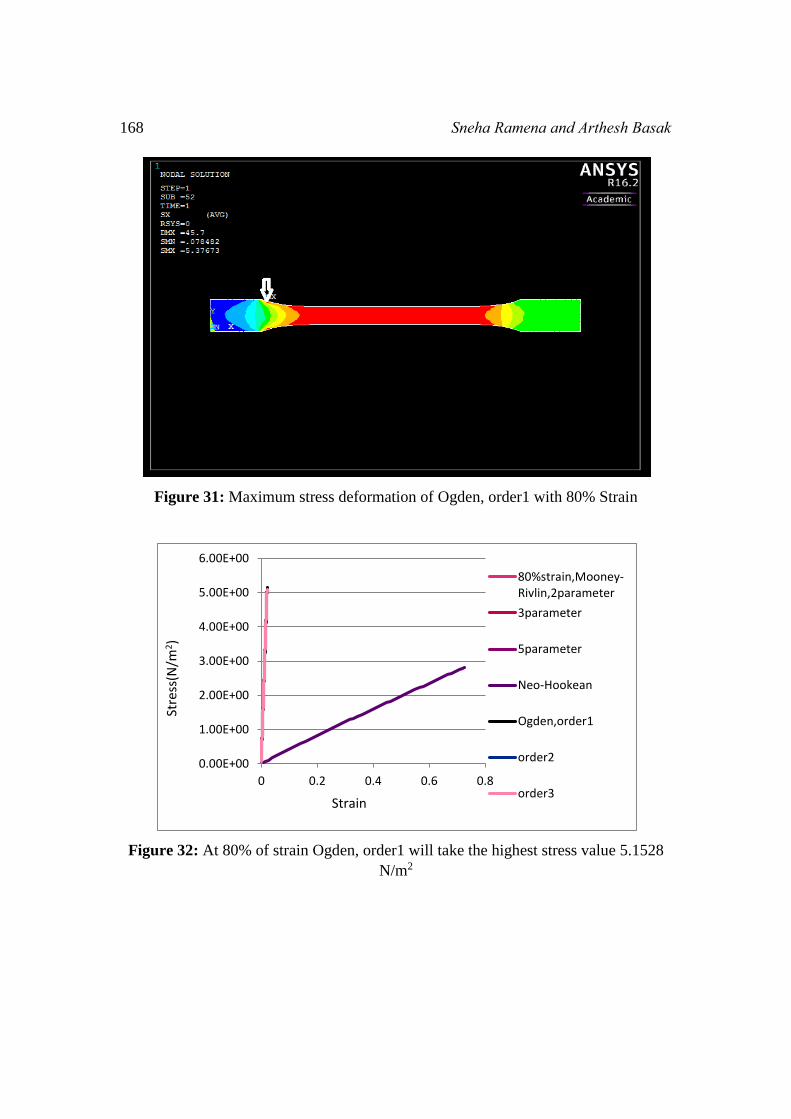
Figure 31: Maximum stress deformation of Ogden, order1 with 80% Strain
Figure 32: At 80% of strain Ogden, order1 will take the highest stress value 5.1528
N/m2
0.00E+00
1.00E+00
2.00E+00
3.00E+00
4.00E+00
5.00E+00
6.00E+00
0 0.2 0.4 0.6 0.8
80%strain,Mooney-Rivlin,2parameter
3parameter
5parameter
Neo-Hookean
Ogden,order1
order2
order3
Stre
ss(N
/m2)
Strain
Comparative Study of Hyper Elastic Material Models 169
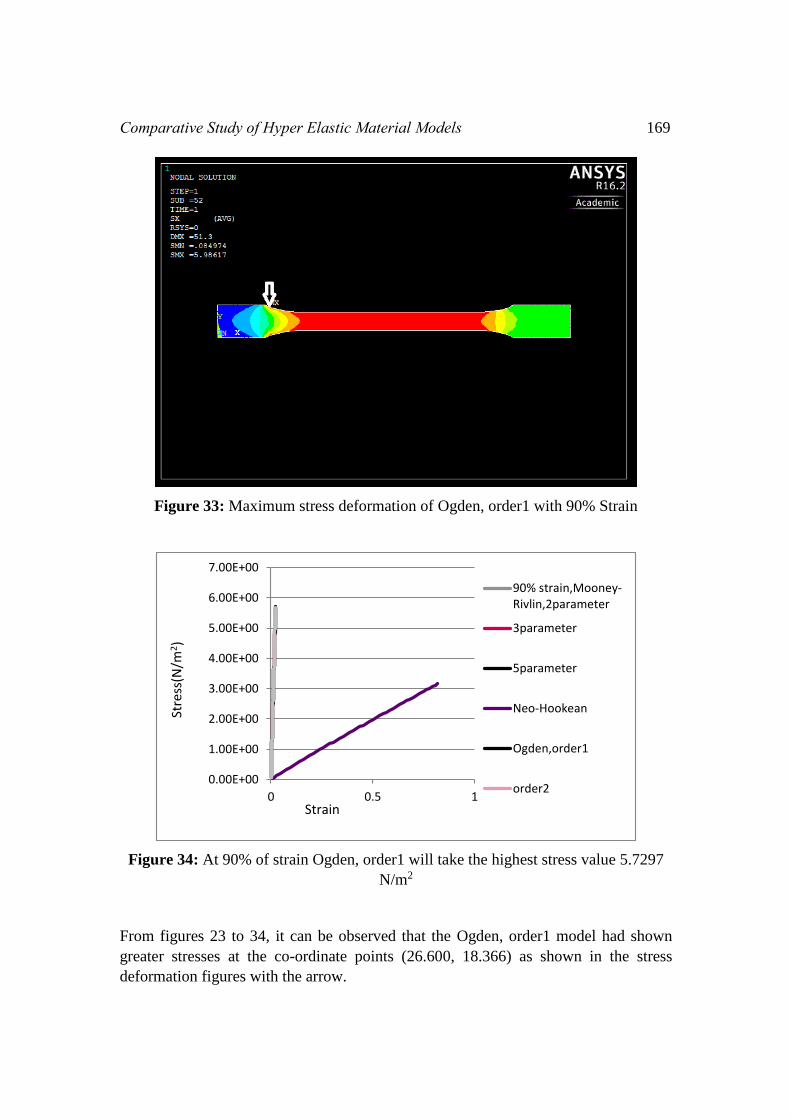
Figure 33: Maximum stress deformation of Ogden, order1 with 90% Strain
Figure 34: At 90% of strain Ogden, order1 will take the highest stress value 5.7297
N/m2
From figures 23 to 34, it can be observed that the Ogden, order1 model had shown
greater stresses at the co-ordinate points (26.600, 18.366) as shown in the stress
deformation figures with the arrow.
0.00E+00
1.00E+00
2.00E+00
3.00E+00
4.00E+00
5.00E+00
6.00E+00
7.00E+00
0 0.5 1
90% strain,Mooney-Rivlin,2parameter
3parameter
5parameter
Neo-Hookean
Ogden,order1
order2
Stre
ss(N
/m2)
Strain

170 Sneha Ramena and Arthesh Basak
CONCLUSIONS
According to this analysis, the order of constants or model had been increased with
the increase of hole diameter and displacement values. By the comparison of two
plates with the single central hole and the central hole with two adjacent holes (triple
hole), at 100 and 200mm diameter Mooney-Rivlin 5parameter single hole geometry
had shown greater stresses and for 300mm diameter Mooney-Rivlin 5parameter triple
hole geometry had shown greater stresses than the single hole geometry. With
increase of hole diameter the stress value had been increased around the hole.
In Dog-bone geometry, with increase of strain value the non-linear model parameters
had been increased according to their relative stiffness. For 10-20% strain the
Mooney-Rivlin 2 parameter, 30% strain Ogden order3 and 40-90% strain Ogden
order1 had shown greater stresses than the other models. The higher the model the
more accurate stress-strain curves will be obtained.
REFERENCES
[1] G.Marckmann, E.Veron, “comparison of hyper elastic models for rubber-like
materials”, Rubber chemistry and technology, 2014, 79, 835-858.
[2] Kurt Miller, “Testing Elastomers for Hyper elastic Material Models in Finite
Element Analysis”, 2002, Axel Products, Inc.
[3] Prashant Nimbalkar, “Approach of Mooney- Rivlin material Model in Air
Intake System”, International Journal of Science, Engineering and Technology
Research, 2015, 4, 4294-4296.
[4] Tie Hu, Jaydev P. Desai, “Modelling Large Deformation in Soft-tissues”,
Experimental results and Analysis Proceedings of eurohaptics, 2004.
[5] Vishal Nayyar, K. Ravi-Chandar and Rui Huang, “Stretch-induced stress
patterns and wrinkles in hyper elastic thin sheets”, International journal of
solids and structures, 2011, volume 48.