Comparative study of greenhouse gas emissions between off...
25
1 Comparative study of greenhouse gas emissions between off-site prefabrication and conventional construction methods: Two Case studies of residential projects Chao MAO abc , Qiping SHEN b , Liyin SHEN ac , Liyaning TANG b a Faculty of Construction Management and Real Estate, Chongqing University, Chongqing 400045, China b Department of Building and Real Estate, The Hong Kong Polytechnic University, Hong Kong, China c International Research Center for Sustainable Built Environment, Chongqing University, Chongqing, 400045, China Abstract Greenhouse gas (GHG) emissions in the construction stage will be more relatively significant over time. Different construction methods influence GHG emissions in the construction phase. This study investigates the differences of GHG emissions between prefabrication and conventional construction methods. This study sets a calculation boundary and five emission sources for the semi-prefabricated construction process: embodied emissions of building materials, transportation of building materials, transportation of construction waste and soil, transportation of prefabricated components, operation of equipment, and construction techniques. A quantitative model is then established using a process-based method. A semi-prefabrication project and a conventional construction project in China are employed for preliminary examination of the differences in GHG emissions. Results show that the semi-prefabrication method produces less GHG emissions per square meter compared with the conventional construction, with the former producing 336 kg/m 2 and the latter generating 368 kg/m 2 . The largest proportion of total GHG emissions comes from the embodied emissions of building materials, accounting for approximately 85%. Four elements that positively contribute to reduced emissions are the embodied GHG emissions of building materials, transportation of building materials, resource consumption of equipment and techniques, and transportation of waste and soil, accounting for 86.5%, 18.3%, 10.3%, and 0.2%, respectively, of reduced emissions; one a negative effect on reduced emissions is the transportation of prefabricated components, which offsets 15.3% of the total emissions reduction. Thus, adopting prefabricated construction methods contribute to significant environmental benefits on GHG emissions in this initial study. Keywords: greenhouse gas, emissions, prefabrication, conventional construction, environmental impact Corresponding author. Tel: +86 23 6512 3204, +852 2766 5187. E-mail address: [email protected] (C. Mao); [email protected] (Q.P. Shen); [email protected] (L.Y. Shen); [email protected] (T.L.Y. Tang) This is the Pre-Published Version.
Transcript of Comparative study of greenhouse gas emissions between off...
1
Comparative study of greenhouse gas emissions between off-site
prefabrication and conventional construction methods: Two Case studies of
residential projects
Chao MAOabc, Qiping SHENb, Liyin SHENac, Liyaning TANGb a Faculty of Construction Management and Real Estate, Chongqing University, Chongqing 400045, China b Department of Building and Real Estate, The Hong Kong Polytechnic University, Hong Kong, China c International Research Center for Sustainable Built Environment, Chongqing University, Chongqing, 400045, China
Abstract
Greenhouse gas (GHG) emissions in the construction stage will be more relatively significant over time.
Different construction methods influence GHG emissions in the construction phase. This study
investigates the differences of GHG emissions between prefabrication and conventional construction
methods. This study sets a calculation boundary and five emission sources for the semi-prefabricated
construction process: embodied emissions of building materials, transportation of building materials,
transportation of construction waste and soil, transportation of prefabricated components, operation of
equipment, and construction techniques. A quantitative model is then established using a process-based
method. A semi-prefabrication project and a conventional construction project in China are employed for
preliminary examination of the differences in GHG emissions. Results show that the semi-prefabrication
method produces less GHG emissions per square meter compared with the conventional construction,
with the former producing 336 kg/m2 and the latter generating 368 kg/m2. The largest proportion of total
GHG emissions comes from the embodied emissions of building materials, accounting for approximately
85%. Four elements that positively contribute to reduced emissions are the embodied GHG emissions of
building materials, transportation of building materials, resource consumption of equipment and
techniques, and transportation of waste and soil, accounting for 86.5%, 18.3%, 10.3%, and 0.2%,
respectively, of reduced emissions; one a negative effect on reduced emissions is the transportation of
prefabricated components, which offsets 15.3% of the total emissions reduction. Thus, adopting
prefabricated construction methods contribute to significant environmental benefits on GHG emissions in
this initial study.
Keywords: greenhouse gas, emissions, prefabrication, conventional construction, environmental impact
Corresponding author. Tel: +86 23 6512 3204, +852 2766 5187.
E-mail address: [email protected] (C. Mao); [email protected] (Q.P. Shen); [email protected] (L.Y. Shen);
[email protected] (T.L.Y. Tang)
This is the Pre-Published Version.

2
1. Introduction
The Fourth Assessment Report of the Intergovernmental Panel on Climate Change (IPCC)
indicated that the building and construction sector is one of the seven dominant sectors that
greatly contribute toward global greenhouse gas (GHG) emissions [1]. The building sector
consumes approximately 40% of total energy used, thus contributing up to 30% of total GHG
emissions annually. The United Nations Environment Programme (UNEP) declared that with the
rapid increase in urbanization and the inefficiencies of existing building stock, GHG emissions
will more than double in the next 20 years unless actions mitigating the emissions are taken [2].
Therefore, GHG emissions reduction in the building sector is a focus of research.
Most relevant studies in this domain evaluated GHG emissions during the entire life cycle
of buildings or several individual phases of a life cycle. Approximately 80% of energy use and
GHG emissions are generated during the operation stage of buildings (such as heating and
cooling, ventilation, lighting, and appliances), whereas only 10% to 20% are from material
manufacturing, construction, and demolition [3]. Numerous studies primarily concentrated on
developing advanced technologies, policies, and measures to cut down GHG emissions in the
operation stage [4-7] rather than in the construction stage. Guggemos et al. [8] pointed out that
the environmental impact and GHG emissions from the construction phase cannot be ignored,
even if this phase only accounts for 0.4% to 12% of the overwhelming impact from the operation
stage. GHG emissions in construction is a small share of the entire life cycle at present, but the
80% to 90% of the life cycle of GHG emissions that occur during the operation has declined
dramatically over time due to existing substantial energy saving codes or other policies, and thus,
the relative contribution of construction stage emissions and impacts becomes more dominant
and significant. Therefore, GHG emissions or impacts in the construction stage must be analyzed.
Several studies have focused on the environmental impacts and GHG emissions in the
construction phase [8-11]. The literature has two common characteristics: (1) they are associated
with conventional cast in situ construction methods, and (2) they concentrate on the scenario
selection of building materials or structural systems to reduce GHG emissions. For example,
Cole [9] examined the energy and GHG emissions associated with three alternatives, namely,
wood, steel, and concrete structural systems, in the construction process to determine if

3
significant differences occur between the structural material alternatives. Gonzalez et al. [10]
indicated that carbon dioxide (CO2) emissions can be reduced by as much as 30% in the
construction phase through a careful selection of materials with low environmental impact.
Guggemos et al. [8] emphasized the importance of the construction phase and designed a
Construction Environment Decision-Support Tool. The tool helps decision-makers and designers
optimize design, selection of materials, and construction scenarios according to estimated energy
use, emissions, and waste generation rates in the construction phase. Yan et al. [11] established a
quantitative model for GHG emissions in building construction. Their results indicated that the
embodied emissions of materials is the main source of GHG, so adopting recycled materials can
decrease GHG emissions in the construction phase.
Research on the aspect of reducing GHG emissions by alternative construction methods,
such as off-site prefabrication instead of conventional methods, are limited. Although Lu et al.
[12] conducted a comparative study on embodied energy use and GHG emissions in the life
cycle among prefabricated steel, wood, and conventional concrete construction systems, the
result of this study virtually suggested to reduce environmental impact via proper selection of
materials in structural systems, rather than actual changes in construction methods or processes.
Meanwhile, although several other studies consider prefabrication an effective and efficient
approach to control environmental impact [13-15], rigorous calculation on the GHG emissions of
prefabrication is lacking.
To fulfill this knowledge gap, this study aims to establish a calculation mode of GHG
emissions for prefabrication, to investigate whether GHG emissions between prefabrication and
conventional construction have significant differences, to determine the extent of the reduction of
GHG emissions that can be achieved by prefabrication in comparison with conventional
construction, and to demonstrate that prefabrication is also an effective way for GHG emissions
reduction. This paper focuses on the discussion of the concrete structural system, because it is the
dominant structural system for residential buildings in China. The objectives of this paper are the
following: to define and delimit the process of prefabrication, the sources of GHG emissions, and
the calculation boundary of GHG emissions; to establish a quantitative model to assess the total
GHG emissions of prefabrication; and to compare the GHG emissions of prefabrication with
those in conventional construction method based on the same structural system.

4
2. Overview of Off-site Prefabrication
Despite being one of the oldest industries, construction practice has had no remarkable
innovation and improvement over the past 40 years. Furthermore, this industry is characterized
as labor-intensive, wasteful, and inefficient because of its conventional on-site construction
approach [16, 17]. As indicated in Egan’s report [18], improving productivity and environmental
performance in the construction industry requires the diffusion of new construction methods such
as lean production and prefabrication. Prefabrication is an effective method already in practice.
The United States National Research Council’s 2009 report recommends prefabrication as an
“opportunity for breakthrough achievement” to a modern construction industry [19]. With the
requirement of environmental sustainability, off-site prefabrication provides a broad forward
evolution compared with conventional construction methods.
Tatum [20] defined prefabrication as a manufacturing process generally conducted at a
specialized facility, in which various materials are joined to form a component part of the final
installation. Prefabrication is the transferring stage of on-site construction activities from field to
an off-site production facility. Gibb [21] regarded off-site fabrication as a process that
incorporates prefabrication and pre-assembly. The process involves the design and manufacture
of units or modules, usually remote from the work site. It also includes their subsequent transport
and installation to form the permanent structures at the work site. Although no single, widely
accepted definition for prefabrication exists so far, numerous common threads are revealed from
the definitions of previous literature. These threads represent a manufacturing process in the
stage of construction, which is characterized by (1) off-site construction, (2) activities undertaken
in a factory environment, (3) precast components built as types of pieces, units, or modules in the
factory (e.g., floor slab, façades, staircases, beams, bathrooms, kitchens and so on), (4)
transportation of prefabricated components to project sites, and (5) their assembly and
installation to form an entire building. A prefabricated building is a product manufactured by the
abovementioned process. The term “prefabrication” in the current study is labeled as possessing
the features described above.
Building frame structural systems commonly used in prefabrication are light-gauge-pressed
steel frame, precast concrete frame, and timber frame [21, 22]. The construction method of
prefabrication is categorized as three types, namely, semi-prefabrication, comprehensive
5
prefabrication, and volumetric modular building [15]. Semi-prefabrication is a construction
method where some elements of the building are cast in situ on-site while the remainder adopts
factory-built components or units. In comprehensive prefabrication, all building elements are
independently manufactured in the factory and then fixed together on-site. Volumetric modular
building refers to an entire building produced in a factory.
In China, Prefabricated Light Steel System (PLS) and Prefabricated Concrete System (PCS)
are predominantly adopted from Japan’s and Hong Kong’s practice. In this study, the type of
PCS by adopting semi-prefabrication construction method is concerned. This type is more
available and acceptable in the Chinese construction market due to its higher cost efficiency
compared with other systems. As the process of semi-prefabrication is significantly distinguished
from conventional construction, the process will be defined in the succeeding sections of this
paper.
3. Methodology
3.1 Selection of quantitative methods
Various evaluation tools are employed to assess the environmental impact of buildings,
including energy use and GHG emissions. From previous studies, four methods are mainly used:
statistical, process-based, input-output, and hybrid analyses [11, 12, 23].
Statistical analysis is an effective and speedy method based on comprehensive, consistent,
thorough, and sufficiently detailed published statistics, which are difficult to collect in most
countries. Therefore, this method is not available in most studies.
Process-based analysis is a bottom-up method developed to assess the environmental impact
of goods and services according to their production process. Fay et al. [24] and Chen et al. [25]
analyzed the energy use of all life cycle processes of buildings in Australia and Hong Kong,
respectively. Yan et al. [11] calculated the GHG emissions in the building construction process.
You et al. [26] established a life cycle model of carbon emissions , which integrated the main
sources of each stage during the life cycle of buildings, to analyze carbon emissions.
Input–output analysis is a top-down method for assessing resource and pollution
embodiments in goods and services on a macroeconomic scale, taking the entire economy as a

6
system and involving any number of inputs from other industry sectors. This method is also
widely adopted in numerous studies on GHG emissions of building sectors. Nassen et al. [27]
used this method to assess energy use and carbon emissions in the production phase of buildings.
Chen et al. [28] established a low-carbon building framework with detailed carbon emission
account procedures based on a multi-scale input–output analysis.
A hybrid analysis combines the advantages of the abovementioned methods and attempts to
incorporate their most useful features. Seo et al. [29] used a hybrid method to estimate CO2
emissions in the life cycle of residential buildings, whereas input-output analysis was adopted to
calculate CO2 emissions in the manufacturing of buildings. They used a process-based method to
analyze the remaining stages of buildings. Lu et al. [12] used an innovative hybrid assessment
approach to evaluate embodied energy, whereby a large base of I-O data were obtained from the
Australian National Accounts and process-specific data related to energy from the manufacture
of building materials were obtained from the SimaPro Australian Database.
Prefabrication is still in its early stage in China. Economic input-output data, which should
be collected from all potential transactions upstream through the supply chain of prefabrication
or associated with the construction industry on the aspect of prefabrication, are currently
unavailable in China. As an innovative attempt and a specific technology in the construction
industry, the more applicable and reliable approach is to use the micro method to calculate GHG
emissions [12]. Therefore, a process-based, micro-bottom-up method is adopted for this study.
The process-based quantitative model can be addressed to define and limit the sources and scope
of GHG emissions for calculation.
3.2 Scope of the study
3.2.1 GHG Emissions
According to the “2006 IPCC Guidelines for National Greenhouse Gas Inventories” [30],
GHG include, but are not limited to, carbon dioxide ( CO2), methane (CH4), nitrous oxide (N2O),
chlorofluorocarbons (CFCs), ozone (O3), hydrofluorocarbons (HFCs), perfluorocarbons (PFCs),
and sulfur hexafluoride (SF6). GHGs are mainly composed of CO2, CH4, and N2O while the
remainder are seldom emitted in this process [9]. Therefore, CO2, CH4, and N2O are represented
as GHG emissions in this study. Different GHGs vary in their environmental impact. Global

7
Warming Potential (GWP) value is commonly used to illustrate the climatic impact of different
gases. Generally, CO2 is adopted as the reference standard for GHG effects. By multiplying the
individual gas emission factor by the respective gas GWP, the emissions of other GHGs such as
CH4, N2O, and CO are converted to so-called CO2 equivalents [31, 32]. The GWP values of CO2,
CH4, and N2O for 100 year time horizons are shown in Table 1. Thus, GHG emission factors (as
equivalent CO2) herein can be calculated by Formula (1),
where Fc is a given gas c emissions factor per unit, and GWPVc is the GWP value of gas c.
<Insert Table 1 here>
3.2.2 Calculation boundaries
Few studies have focused on the GHG emissions in the construction phase. The system
boundary of the construction phase defined by researchers varies. For example, Yan et al. [11]
summarized six sources of emissions in the construction phase from existing literature, namely,
(1) manufacture of building materials, (2) transportation of building materials, (3) transportation
of construction equipment, (4) energy consumption of construction equipment, (5) transportation
of workers, and (6) disposal of construction waste. There is a different view on whether
emissions from manufacturing building materials should be calculated in the construction phase.
Guggemos et al. [8] proposed that the embodied GHG emissions of permanent building materials
should be omitted in this calculation because they belong to an independent part of the materials
manufacturing phase during the overall life cycle assessment (LCA). Nevertheless, construction
processes and techniques used in semi-prefabrication are different from those in conventional
construction methods. The way of handling materials and the amount of materials applied are
different in the two types of construction methods. Therefore, including the embodied GHG
emissions of building materials in the calculation is reasonable. Meanwhile, as the final quality
and performance requirements of building products, requirements of energy consumption of the
operation phase, and quantity of demolition are assumed to be similar during the comparison of
this study, the GHG emissions of operation and demolition are not considered. In addition,
Chinese construction projects observe the special situation where all workers live on-site in; thus,
8
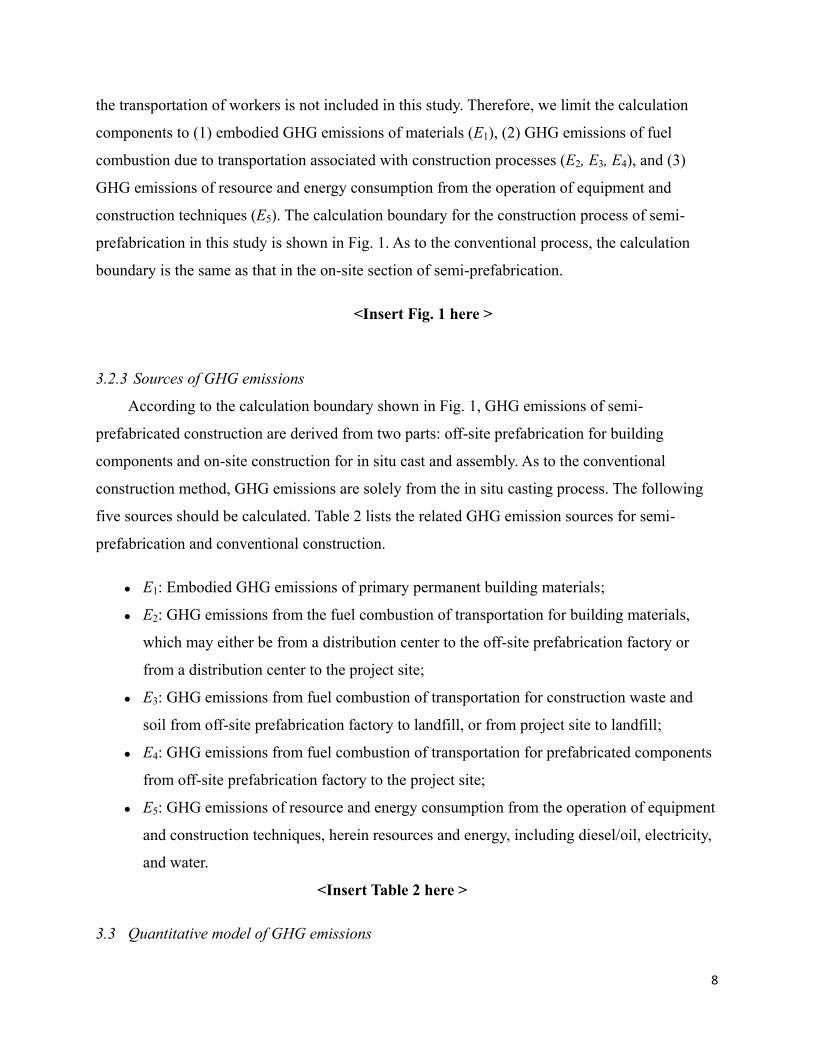
the transportation of workers is not included in this study. Therefore, we limit the calculation
components to (1) embodied GHG emissions of materials (E1), (2) GHG emissions of fuel
combustion due to transportation associated with construction processes (E2, E3, E4), and (3)
GHG emissions of resource and energy consumption from the operation of equipment and
construction techniques (E5). The calculation boundary for the construction process of semi-
prefabrication in this study is shown in Fig. 1. As to the conventional process, the calculation
boundary is the same as that in the on-site section of semi-prefabrication.
<Insert Fig. 1 here >
3.2.3 Sources of GHG emissions
According to the calculation boundary shown in Fig. 1, GHG emissions of semi-
prefabricated construction are derived from two parts: off-site prefabrication for building
components and on-site construction for in situ cast and assembly. As to the conventional
construction method, GHG emissions are solely from the in situ casting process. The following
five sources should be calculated. Table 2 lists the related GHG emission sources for semi-
prefabrication and conventional construction.
E1: Embodied GHG emissions of primary permanent building materials;
E2: GHG emissions from the fuel combustion of transportation for building materials,
which may either be from a distribution center to the off-site prefabrication factory or
from a distribution center to the project site;
E3: GHG emissions from fuel combustion of transportation for construction waste and
soil from off-site prefabrication factory to landfill, or from project site to landfill;
E4: GHG emissions from fuel combustion of transportation for prefabricated components
from off-site prefabrication factory to the project site;
E5: GHG emissions of resource and energy consumption from the operation of equipment
and construction techniques, herein resources and energy, including diesel/oil, electricity,
and water.
<Insert Table 2 here >
3.3 Quantitative model of GHG emissions

9
Based on the classification of emission sources above, the quantitative model for calculating
GHG emissions during the construction stage of semi-prefabricated construction is composed of
Formulas (2) to (7).
where TGE is the total GHG emissions during the entire construction stage in tons CO2-
equivalent (CO2-e), Ei is the ith GHG emission source during the process of construction, and i is
from 1 to 5.
where E1 is the embodied GHG emissions of all building materials (in tons CO2-e), Mj is the
amount of building material j (in tons), is the GHG emissions factor of building material j (in
kg CO2-e/kg), and εj is a factor for waste of building material j during the transportation of
materials or erection of building. The waste factor value varies from the type of building
materials; references [25] and [33] listed waste factors with related materials. The value of
may vary among different countries. However, data on GHG emission factors or CO2 emissions
factors of building materials are limited in China. Therefore, the factors in the calculation model
in this study were collected from several international institutions and reports, such as “Embody
Energy and CO2 Coefficients for NZ Building Materials” from the Centre for Building
Performance Research in New Zealand, and “The Inventory of Carbon and Energy” from the
University of Bath [34-36]. Table 3 presents the related GHG emission factors ( ) of six
dominant materials for buildings collected for the current study.
<Insert Table 3 here >

10
where E2 is the total GHG emissions from the fuel combustion of transportation of building
materials j (in tons CO2-e); is the distance from a distribution center to the off-site
prefabrication factory or from a distribution center to the project site (in km); and is the GHG
emissions factor of fuel combustion for transportation method k (in kg CO2-e/ton km), such as
vehicle, train, or ship. Table 4 lists the GHG emission factors ( ) of different transportation
methods.
<Insert Table 4 here >
here E3 is the GHG emissions from the fuel combustion of construction waste or soil of
earthworks (in tons CO2-e), Ws is the amount of construction waste or soil (in tons), is is the
distance between the off-site prefabrication factory and landfill or the distance between the
project site and landfill (in km), and is the GHG emission factor for transportation methods (in
kg CO2-e/ton km). Normally, transportation of waste, soil, and prefabricated components is done
using heavy trucks. Thus, the 0.207 kg CO2-e/ton km shown in Table 4 is used for in Formulas
(5) and (6).
where E4 is the GHG emission from the fuel combustion of transportation for prefabricated
components from the off-site prefabrication factory to the project site (in tons CO2-e), P is the
total amount of all prefabricated components (in tons); and is is the distance between the off-
site prefabrication factory and the project site (in km).
where E5 is the total GHG emissions from the resource consumption of construction equipment

11
and techniques (in tons CO2-e); and Rr is the amount of resources or energy usage r of related
requirements of construction techniques (in kWh, in L, or in m) during the entire construction
phase, r = 1, 2, 3. Normally, construction equipment include cranes, concrete mixer trucks,
concrete pumps, welders, fork lift trucks, elevators. The main resources of consumption are
examined by three types, namely, diesel, electricity, and water. R1 (in L), R2 (in kWh), and R3 (in
m3) denote the usage amount of the three types of construction equipment, respectively. is the
GHG emission factor of fuel combustion (in kg CO2-e /l), is is the GHG emissions factor of
electricity usage (in kg CO2-e/kWh), and is is the GHG emissions factor from fresh water
processing (in kgCO2-e/m3). Table 5 lists the CO2 emissions factor of electricity in different
regional power grids of China in 2010 published by the Department of Climate Change under
National Development and Reform Commission [39]. Values for are unavailable in the
existing literature of mainland China; thus, 0.4137 kg CO2-e/m3was used as referenced from
EMSD/EPD [40]. Table 6 lists GHG emissions factors ( ) of resources consumption of
construction equipment.
<Insert Table 6 here >
4. Case study
This paper employed two types of cases to demonstrate the aforementioned process-based
quantitative models for GHG emissions and to conduct a detailed calculation and a comparative
study. These two types of cases are Project A using semi-prefabrication and Project B using
conventional construction method. Project A is a public rental housing project, and it is the first
pilot project using prefabrication in Shenzhen. Shenzhen is one of the first places where
industrialized building bases are established in China. Project A is considered representative of
the level of prefabrication application in China. Project B is a general residential project
associated with conventional construction method in Shenzhen. The reasons for choosing these
two projects for comparison are as follows: first, the two cases have similar crucial structural
characteristic variable and profiles that affect the quality, performance, and amount of material
used on the project (such as floor plan, room aspect ratio, foundation, basement, floor-to-floor
height, and structure system), as shown in Table 7 , Fig. 2 and Fig. 3. Second, the management
skills of the two contractors were at an undifferentiated level. Arguably, different management

12
skills or construction technologies of contractors can affect the amount of materials used on
project sites. In this study, the contractors of the two projects are Pengcheng Construction
(Project A) and China Construction Third Engineering Bureau Co., Ltd. (Project B). They both
won the “second star level” award by Shenzhen Government under the “Evaluation Standard for
Green Construction in Shenzhen”. This Standard is an effective tool for assessing construction
activities in terms of the savings of resources (e.g., water, material, energy, and land) and
environmental performance. The same award of green construction star can briefly indicate that
these two contractors have undifferentiated management skills and construction technologies in
the area of green construction. While it is quite normal to acknowledge the heterogeneity of
contractors, we assumed that the influence of construction management skill has, if not
impossible, a negligible impact on the amount of materials used in this study.
Therefore, the assumption is that the two projects are available for comparison to a certain
extent according to the above similarities. To enhance comparability using a consistent basis, the
size of Project B is adjusted to equal that of Project A. To provide a consistent calculation basis
for comparison between these two projects, 216,000 m2 is used to represent a unit of orders of
magnitude.(216,000 m2 is the size of Project A) .Data collection is described in detail in the
succeeding sections of the paper.
<Insert Table 7 here >
4.1. Data collection
Two clusters of data are collected in this study: data from semi-prefabrication in Project A
and data from conventional construction method in Project B (see Fig. 2 and Fig.3).
<Insert Fig. 2 here >
< Insert Fig. 3 here >
4.1.1. Data collection for the semi-prefabrication method
Project A consists of six residential buildings, each adopting a frame-shear wall structure
and a construction floor area (CFA) of 216,000 m2. The project duration for Project A is from
July 2010 to June 2012. The entire construction phase was monitored through site investigation
and regular examination of site reports provided by the surveyors and project manager. In 2011,
this project achieved a Green Star Accreditation from the Ministry of Housing and Urban-Rural

13
Development of China. One of the contributions of this project is the adoption of off-site
prefabricated components. The level of prefabrication was 10.5% by concrete volume. Three
types of prefabricated components were involved, namely, precast façades, precast staircases,
and precast corridor slabs (Fig. 4). The main structure and remainder parts were cast in situ.
Project A was closely monitored to collect relevant GHG emissions data throughout the
construction phase. Monitoring was implemented through the combined methods of site
investigation, Bill of Quantities and project reports review, and interview with senior project
managers, material suppliers, and prefabrication factories associated with the project.
<Insert Fig. 4 here >
For the main body of the buildings (e.g., wall, roof, slab, floor), six building materials were
the focus: steel, cement, sand, glass, ready-mixed concrete, and aerated concrete brick
(hereinafter referred to as “concrete” and “brick”). The actual quantities of building materials
used in the construction of Project A are shown in Table 8. represents the transportation
distance of the materials from their place of origin to the off-site prefabrication factory, whereas
represents the distance from the place of origin to the Project A construction site (Table 8).
All of the building materials were transported by road with a GHG emissions factor of 0.207 (in
kg CO2-e/ton km). Data on the total amount of resources used on diesel, electricity, and water
were collected monthly from the project contractors (Table 9). The amount of waste from the off-
site fabrication factories was reduced substantially. For example, concrete waste during the
process in factory was minimal. Waste was non-existent because for Project A, the factories
produced concrete, which enabled reuse of surplus concrete and steel. Data on the amount of on-
site waste were not directly available, but could be evaluated by the waste factors presented in
Table 3. The quantities of soil generated by earthworks were obtained from the Bill of Quantities
(Table 10). Two prefabrication factories were employed in Project A, which were 45 and 95 km
away from the project site. An average distance of 70 km by truck was used to transport the
precast components to the project site.
4.1.2. Data collection for the conventional construction method
Project B, referenced from the monthly report of Shenzhen Construction Engineering
Price Information [42], was selected as a comparable project using conventional construction
methods. This project is similar to Project A in terms of structural frame, height, foundation,

14
room aspect ratio and so on (See Table 7 and Fig. 4). However, the floor gross area of Project B
is different from that of Project A. To maintain a similar comparison baseline, the floor area of
Project B was adjusted to be the same with that of Project A. The adjusted project is called
Project Bo. In Project B, the values of the used index (a used index is the ratio of the total
amount of a certain material divided by construction floor area) of materials per m2
are as
follows: 57 kg/m2 for steel, 0.495 m
3/m
2 (1.188 kg/m
2)for concrete, 404.46 kg/m
2 for sand,
68.15 kg/m2 for cement, and 287.14 kg/m
2 for brick (see Table 8). The corresponding amount of
use of each material for Project Bo is acquired by multiplying the 216,000 m2 (the same CFA of
Project A) with the unit used as index of each material in Project B. For example, multiplying the
216,000 m2 with the used index of steel per m
2 (0.057 tons/m
2) and the used index of concrete
per CFA (0.495 m3/m
2) yielded the total weight of steel (12,312 tons) and concrete (106,920 m
3
by volume; 256,608 tons by weight) in Project Bo. The other adjusted amounts of building
materials for Project Bo are listed in Table 8. Glass, however, was fixed and installed on site and
had similar quantities in both projects.
As for diesel consumption, it is mainly attributed to the concrete delivery pump and
excavator. The amount of diesel used (120,000 L) by most of the equipment, except for the
concrete delivery pump, was the same in Project A and Project Bo. The concrete delivery pump
used in this study was the HBT40c, which consumes 0.8 L to 1.2 L of diesel to deliver 1 m3 of
concrete. Thus, an average value (1.00 L/m3) was adopted in multiplying the quantities of
concrete in conventional Project Bo (106,920 m3) to obtain the amount of diesel used by the
concrete delivery pump (106,920 L). The total amount of diesel used was 226,920 L. The total
consumption of water (356,400 m3) and electricity (2,470,912 kWh) in Project Bo (Table 9) was
estimated according to the Calculation Handbook of Construction [43] . The amount of
construction waste in Project Bo was assessed through the material waste factors (Table 3) by
multiplying the amount of related materials used.
The variables in Formulas (2) to (7) vary from project to project, as well as in Project A and
Project B. In this study, the differences in GHG emissions between the prefabrication method
and conventional construction were examined by referring to the similar Projects A and B.
Therefore, greater concern was placed on variables whose changes are mainly due to the
different processes or techniques of prefabrication, including amount of materials, amount of

15
water and electricity consumption, and quality of prefabricated components. Meanwhile,
variables whose changes are not because of prefabrication were assumed to have the same value
in Project A and Project B: distance from the place of origin to project site, the distance for
disposal soil and on-site waste, and the amounts of soil. These data can be found in columns 6
and 7 in Table 8 and line 4 in Table 9. The assumption was used to compare emissions between
the two projects under the same bases.
Additional data are shown in detail in Tables 8 to 10. The data were used to calculate the
GHG emissions of semi-prefabrication (Project A) and conventional construction (Project Bo).
<Insert Table 8 here >
<Insert Table 9 here >
<Insert Table 10 here >
5. Results and discussion
5.1. Total GHG Emissions of Semi-prefabrication and Conventional Construction
Detailed GHG emissions from five resources (according to Formulas 2 to 7) are shown in
Table 11. Total GHG emissions in the construction phase of semi-prefabrication and conventional
construction methods are 72,791 and 75,205 tons CO2-e (equivalent to 336 and 348 kg/m2),
respectively. A reduction of 1.1 tons per 100 m2 was seen in the project with semi-prefabrication,
approximately 3.2% less than that emitted in the project with conventional construction. This
reduction seems relatively small, and it is in line with other similar studies by Pons [44]. Pons
conducted life cycle analysis of environmental impacts between three main industrialized
technologies and a non-prefabricated one in school projects. Findings suggest that the emissions of
prefabricated concrete technology were approximately 2% to 5% lower than those of non-
prefabricated one [44]. Table 11 presents the results of the current and previous studies. The small
reduction might be attributed to the lower level of prefabrication. Pons’ studies [44] also implied
that a higher degree of prefabrication could contribute to greater benefits on environmental impact,
such as GHG emissions.
Column 9 in Table 11 presents the contribution proportion of each emissions source to the

16
total GHG emissions reduction brought by the use of semi-prefabrication. A total of 86.5% of the
GHG emissions reduction are due to embodied emissions of building materials (E1); 10.3% are
due to the resource consumption of construction equipment and techniques (E5); and only 3.2%
are due to the fuel combustion from all transportation activities (the sum of E2, E3, and E4). In the
current study, 18.3% are from the transportation of building materials (E2), about 0.2% are from
the transportation of waste and soil (E3), but -15.3% are from the transportation of prefabricated
components (E2). This case is only observed in the prefabricated project, and it is considered a
negative effect on emissions reduction. Columns 4 to 7 in Table 11 show that embodied emissions
of building material are also the most dominant source of GHG emissions either in semi-
prefabrication or conventional construction. Both account for 85.1% of total GHG emissions. The
second largest contributor to total GHG emissions is E2, accounting for 7.7% and 8.1% in semi-
prefabrication and conventional construction, respectively.
From the perspective of the reduction of individual emissions sources when adopting semi-
prefabrication, column 10 in Table 11 shows that sources of E2 and E5 significantly benefited
from semi-prefabrication compared with other sources. In the case studies, a reduction of 7.3% of
the emissions from the transportation of building materials, 7.1% of the emissions from the
resource consumption of construction equipment and techniques, 3.3% of embodied emissions of
building materials, and 0.2 % of the emissions from the transportation of soil and waste were
noted when adopting semi-prefabrication.
<Insert Table 11 here >
5.2. Embodied GHG emissions of building materials (E1)
As the largest contributor to total GHG emissions in both types of construction methods,
embodied emissions of each material vary from its use amount. Embodied GHG emissions per
1,000 m2of each building material are shown in Table 12 and Fig. 5. The six building materials of
the semi-prefabrication project generate about 286 tons of embodied GHG emissions per 1,000
m2, whereas the amount for conventional construction project is about 296 tons per 1,000 m
2.
Specifically, the contribution percentages of each material in semi-prefabrication are 56% for
concrete, 17% for brick, 16% for cement, 8% for steel, 2% for glass, and 1% for sand. The
corresponding figures for conventional construction are 49%, 24%, 17%, 7%, 1.6%, and 1.4%, in

17
that order.
<Insert Table 12 here>
<Insert Fig. 5 here >
A total of 2,414 tons in reduction of GHG emissions is contributed by the semi-
prefabrication project. This amount yields approximately 3.3% in reduction compared with
conventional construction in this study. Comparisons of the two methods show that the disparity
in the use amount of building materials is significant, except for glass (See Table 8). The
significant disparity is due to the differences between semi-prefabrication and the conventional
construction in terms of construction techniques, processes, and design requirements.
Consequently, the use amount and embodied GHG emissions of building materials are also
different. The embodied GHG emissions of concrete and steel in semi-prefabrication project are
about 4% and 7%, respectively, which are more than those of conventional construction (Fig.5).
To determine the reason for the increased embodied emissions of steel in semi-prefabrication
project, the senior technician and the designer of Project A were interviewed. According to them,
the increased usage of steel is due to design requirements and standards, especially evident in the
off-site production of components. Numerous joint parts of reinforcement bars are embedded
into precast façades, staircases, and slabs. These joint parts are also called embedded parts, and
are utilized for on-site assembly together with the main building structures. Analysis of the
embedded parts explains the increase in embodied GHG emissions of steel during prefabrication.
The increased GHG emission of concrete is due to the adoption of precast concrete for the
external wall, instead of conventional brick. As observed during site surveys and interviews,
more steel and concrete are used in semi-prefabrication. However, the project manager stated
that off-site prefabrication can control the usage of materials via a lean production process
characterized by standardized designs, precise sizes, and controllable processes that eliminate
material wastes. For example, the usage of steel can be reduced by optimizing the design of
reinforced joint links in components, thus minimizing the potential of embodied GHG emissions
in semi-prefabrication.
Meanwhile, approximately 15%, 11%, and 11% of the embodied emissions reduction per
18
1,000 m2 for brick, cement, and sand, respectively, are attributed to semi-prefabrication.
Comparison with conventional construction processes is shown in Fig. 5. The significant
reduction is due to the use of precast concrete components, which eliminated the need for on-site
plastering of prefabricated façades, staircases, and slabs before decoration. Simultaneously, this
semi-prefabrication project scarcely adopted bricks on external walls, which decreased the usage
of brick, sand, and cement in semi-prefabrication relative to the usage in conventional
construction. Therefore, further design optimization could reduce the total amount and embodied
emissions of building materials. One alternative is the selection of reasonable and economically
efficient proportions of concrete and bricks, such as on external walls. Moreover, Jaillon and
Poon presented developments in this regard [13]. Building materials could be decreased to 20%
when the precast level is up to 65%. This finding implies a lower environmental impact after
prefabrication adoption. The higher the level of prefabrication, the lesser the amount of building
materials needed, as well as embodied GHG emission. Therefore, projects that adopt
prefabrication have a larger potential to reduce embodied GHG emissions from building
materials.
5.3. GHG emissions during transportation (E2,E3, E4)
<Insert Fig.6 here >
GHG emissions associated with transportation activities include three types: E2, E3, and E4.
GHG emissions of transportation for prefabricated components (E4) only exist in off-site
prefabrication. The total GHG emissions from the three transportation types are 7,664 and 7,740
tons for semi-prefabrication and conventional methods, respectively. As to the lower total GHG
emission in semi-prefabrication, which involves one more type of transportation than
conventional construction, inspection of the off-site factories yielded valuable observations. First,
a part of E3 is zero because most materials in the factory can be recycled without waste. Second,
the distance from the distribution center of the materials to the off-site factories is very short.
Such a short distance is because many prefabrication factories tend to build their factory near the
original place of materials in China as this enhances their competitive ability and efficiency.
Therefore, this factor not only decreases factory expenses, but also reduces GHG emissions from
the fuel combustion of material transport. However, the reduction is only 3.2% from total
emissions from all transportation activities as can be gleaned from Table 11 and Fig. 6. This rate

19
is because emissions from the transport of prefabricated components (370 tons) accounts for
4.8% of the total GHG emissions of all transportation activities (7,664 tons). This value is
equivalent to -15.3% of the total GHG emissions reduction (2,414 tons). Reduction amounts
from E2 and E3 in semi-prefabrication were offset to an approximate 83% reduction by E4.
Furthermore, with a rise in the degree of prefabrication used, E4 could be increased accordingly.
Therefore, transportation of prefabricated components is a critical factor affecting the potential
environmental benefits of prefabrication. The capacity of total GHG emission reduction can be
upgraded into a higher level as long as E4 is reduced. A potential way to reduce GHG emissions
of transportation for prefabrication components is to select off-site factories that are near the
projects and material distribution centers. Thus, the reduction of GHG emissions through
prefabrication can only be achieved by minimizing transportation distance.
5.4. GHG emissions from resource and energy consumption of construction equipment and
techniques (E5)
The reduction in the amount of total GHG emission from diesel, water, and electricity
consumption after adopting prefabrication is 249 tons. This value is 10.3% lower than that of
conventional construction (Table 11). GHG emissions from the use of diesel, electricity, and
water are reduced by -2%, 9%, and 8%, respectively. The increase in diesel use for concrete
delivery pumps is associated with the increase in the amount of concrete during semi-
prefabrication. Concrete work with on-site wet trades, in terms of GHG emissions from the use
of electricity and water, are substantially lower because most concrete works are conducted off-
site. To illustrate, in precast façades, the amount of water used in curing concrete can be
controlled in an off-site factory because a precise template to cast concrete is available for each
piece of the façade. The façade has fixed water and concrete without wet-trade works. A
standardized factory-built process also simplifies the task of manufacturing components, as well
as enables the effective coordination and integration of construction links and interfaces. This
process results in the reduction of unnecessary waste from each link and interface. The frequency
of use of concrete pouring vibrators, welders, and cranes are greatly decreased according to the
site survey conducted in this study. For example, the number of cranes used during semi-
prefabrication construction is half of those used in conventional construction methods.
6. Conclusions

20
The building construction process emits substantial quantities of GHG emissions. Various
construction methods generate different amounts of GHG emissions in the construction stage.
Prefabrication is an alternative construction method to conventional cast in-situ. Its construction
technologies and processes are different from those of the conventional one, as well as its GHG
emissions. This study focuses on semi-prefabrication method for concrete structure system.
Specifically, this study identifies a calculation boundary and five GHG emission sources for
semi-prefabrication. These include embodied GHG emission of building materials, transportation
of building materials, transportation of construction waste and soil, transportation of
prefabricated components, and the operation of equipment and construction techniques. In
addition, this study introduces a quantitative process-based model to calculate and analyze the
GHG emissions of projects using semi-prefabrication. A comparison of two cases that adopt
semi-prefabrication and conventional modes is employed to illustrate the differences and
characteristics of GHG emissions.
Results indicate that the project under semi-prefabrication reduced about 1.1 tons per 100 m2
in GHG emissions compared with the project under conventional construction. The most positive
contributor of GHG emissions reduction is the embodied emissions of building materials,
accounting for 86.5%. The following contributors are the transportation of building materials, the
resource consumption of construction equipment and techniques, and the transportation of waste
and soil, accounting for 18.3 %, 10.3%, and 0.2%, respectively. On the other hand, the negative
contributor is the transportation of prefabricated components, which offsets 15.3% of total
emissions reduction and weakens the emissions reduction advantages of prefabrication. The key
approaches to enhance GHG emissions reduction in semi-prefabrication are reducing the amount
of embedded parts of steel by a design optimization of reinforced joint links of components,
making reasonable and economically efficient proportions of concrete and brick on external
walls, and selecting off-site factories that are near the projects or material distribution centers.
These aspects will gain increased recognition by more governments and clients as the
competition in the prefabrication market increases.
This study presents a method to examine GHG emissions in semi-prefabrication projects in
the construction stage. Analysis on the characteristics and differences of GHG emissions between
semi-prefabrication practice and conventional construction shows the different sources and
21
factors related to emissions. Prefabrication practice induces less emission compared with
conventional construction, although the reduction level is not significant. A limitation of this
research is that the subjects of the study are focused on only one project for each construction
method. Thus, a future study is planned to investigate more practical cases for multiple
examination of the correlation between the level of prefabrication and that of emissions.
Acknowledgements
This study was financially supported by the Hong Kong Polytechnic University through
Research Grant No. 5-ZJD7 ,the China Special Social Science Research Program of National
Higher Education Institute Basic Research Fund under Grant No.CDJSK11040 , and the
Fundamental Research Funds for the Central Universities in 2013of Chongqing University.The
authors wish to express their sincere gratitude to Mr. Duan for his help in data collection. The
authors would also like to acknowledge the editing by Dr. Paul W. Fox of an earlier draft of this
paper.
References
[1] Intergovernmental Panel on Climate Change (IPCC), IPCC Fourth Assessment Report:
Climate Change 2007 (AR4) in: Working Group I: The Physical Science Basis, 2007.
[2] United Nationas Environment Programme (UNEP), Building and Climate
Change:Summary for Decision-Makers, Sustainable Buildings & Climate Initiavtive, 2009, pp.
62.
[3] United Nationas Environment Programme (UNEP), The Kyoto Protocol, the clean
development mechanisam, and the building and construcion sector, 2008.
[4] S.D. Sentman, S.T. Del Percio, P. Koerner, A Climate for Change: Green Building
Policies, Programs, and Incentives, Journal of Green Building, 3 (2) (2008) 46-63.
[5] X.L. Zhang, A. Platten, L.Y. Shen, Green property development practice in China: Costs
and barriers, Building and Environment, 46 (11) (2011) 2153-2160.
[6] X. Su, X. Zhang, Environmental performance optimization of window-wall ratio for

22
different window type in hot summer and cold winter zone in China based on life cycle
assessment, Energy and Buildings, 42 (2) (2010) 198-202.
[7] G.A. Blengini, T. Di Carlo, Energy-saving policies and low-energy residential buildings:
an LCA case study to support decision makers in Piedmont (Italy), International Journal of Life
Cycle Assessment, 15 (7) (2010) 652-665.
[8] A.A. Guggemos, A. Horvath, Decision-support tool for assessing the environmnent
effects of constructing commercial buildings, Journal of Architectural Engineering-ASCE, (2006)
187-195.
[9] R.J. Cole, Energy and greenhouse gas emissions associated with the construction of
alternative structural systems, Building and Environment, 34 (3) (1999) 335-348.
[10] M.J. Gonzalez, J.G. Navarro, Assessment of the decrease of CO2 emissions in the
construction field through the selection of materials: Practical case study of three houses of low
environmental impact, Building and Environment, 41 (7) (2006) 902-909.
[11] H. Yan, Q.P. Shen, L.C.H. Fan, Y.W. Wang, L. Zhang, Greenhouse gas emissions in
building construction: A case study of One Peking in Hong Kong, Building and Environment, 45
(4) (2010) 949-955.
[12] A. Lu, T. Ngo, R.H. Crawford, R. Gammampila, P. Mendis, Life cycle greenhouse gas
emissions and energy analysis of prefabricated reusable building modules, Energy and Buildings,
48 (2012) 159-168.
[13] L. Jaillon, C.S. Poon, The evolution of prefabricated residential building systems in
Hong Kong: A review of the public and the private sector, Automation in Construction, 18 (3)
(2009) 239-248.
[14] W. Pan, A.F. Gibb, A.R.J. Dainty, Leading UK housebuilders' utilization of offsite
construction methods, Building Research and Information, 36 (1) (2008) 56-67.
[15] V.W.Y. Tam, C.M. Tam, S.X. Zeng, W.C.Y. Ng, Towards adoption of prefabrication in
construction, Building and Environment, 42 (10) (2007) 3642-3654.
[16] P.C. Liao, W.J. O'Brien, S.R. Thomas, J.K. Dai, S.P. Mulva, Factors Affecting
Engineering Productivity, Journal of Management in Engineering, 27 (4) (2011) 229-235.
[17] McGraw-Hill, Prefabrication and Modularization: Increasing Productivity in the
Construction Industry, in, McGraw-Hill Construction, New York, 2011.
[18] J. Egan, The Report of the Construction task Force, in, United Kingdom, 1998.

23
[19] N.R.C.o.t.N. Academies(NRCNA), Advancing the Competitiveness and Efficiency of
the U.S. Construction Industry, National Research Council of the National Academies(NRCNA),
Washington DC. USA, 2009.
[20] C.B. Tatum, Vanegas, J. A.,Williams, J. M., Constructability Improvement Using
Prefabrication, Pre-assembly andModularization, in, Construction Industry Institute, Stanford
University: California, Technical report No.297, November, 1986.
[21] A.G.F. Gibb, Off-site Fabrication: Prefabrication, Pre-assembly and Modularization,
Whittles Publishing, Latheronwheel, 1999.
[22] K. Mahapatra, L. Gustavsson, Multi-storey timber buildings: breaking industry path
dependency, 36 (2008) 638-648.
[23] G. Baird, A. Alcorn, P. Haslam, The energy embodied in building materials-updated
New Zealand coefficients and their significance, IPENZ Transactions, 24 (1) (1997) 46-54.
[24] R. Fay, G. Treloar, U. Iyer-Raniga, Life-cycle energy analysis of buildings: a case study,
Building Research and Information, 28 (1) (2000) 31-41.
[25] T.Y. Chen, J. Burnett, C.K. Chau, Analysis of embodied energy use in the residential
building of Hong Kong, Energy, 26 (4) (2001) 323-340.
[26] F. You, D. Hu, H. Zhang, Z. Guo, Y. Zhao, B. Wang, Y. Yuan, Carbon emissions in the
life cycle of urban building systemin China—A case study of residential buildings, Ecological
Complexity, 8 (2011) (2011) 201–212.
[27] J. Nassen, J. Holmberg, A. Wadeskog, M. Nyman, Direct and indirect energy use and
carbon emissions in the production phase of buildings: An input-output analysis, Energy, 32 (9)
(2007) 1593-1602.
[28] G.Q. Chen, H. Chen, Z.M. Chen, B. Zhang, L. Shao, S. Guo, S.Y. Zhou, M.M. Jiang,
Low-carbon building assessment and multi-scale input-output analysis, Communications in
Nonlinear Science and Numerical Simulation, 16 (1) (2011) 583-595.
[29] S. Seo, Y. Hwang, Estimation of CO2 emission in life cycle of residential buildings,
Journal of Construction Engineering and Management, 10 (2011) (2001) 414-418.
[30] Intergovernmental Panel on Climate Change (IPCC), 2006 IPCC Guidelines for
National Greenhouse Gas Inventories,Prepared by the National Greenhouse Gas Inventories
Programme, in, IGES, Japan, 2006.
[31] Environment Protection Agency (EPA), 2011 U.S. Greenhouse Gas Inventories,United
24
States, 2011.
[32] Department of Climate Change and Energy Efficiency(DCCEE), National Greenhouse
Acoounts (NGA) Factors, Austrilian Government, Austrilian, 2010.
[33] K. Adalberth, Energy use during the life cycle of buildings: A method, Building and
Environment, 32 (4) (1997) 317-320.
[34] A. Dimoudi, C. Tompa, Energy and environmental indicators related to construction of
office buildings, Resources Conservation and Recycling, 53 (1-2) (2008) 86-95.
[35] A. Andrew, Embodied Energy and CO2 Coefficients for NZ Building Materials, in:
Centre for Building Performance Research Report, ;2003.
[36] G. Hammond, C. Jones, Embodied Carbon : The Inventory of Carbon and Energy(ICE),
in: A BSRIA GUIDE, University of Bath and BSRIA, 2011.
[37] L. Wang, Calculation of CO2 Emission of Cement Prodution Entreprises, CHINA
CEMENT, 11 (2009 ) (2009) 21-22.(in Chinese).
[38] Y. Zhu, Y. Chen, Cases for life-cycle energy consumption and environmental emissions
in residential buildings, Journal of Tsinghua University (Sci & Tech), 50 (3) (2010) 330-334. (in
Chinese)
[39] Department of Climate Change for National Development and Refrom
Commission(DCC/NDRC), 2010 bseline emission factor for Regional Power Grids in China,
2010. (in Chinese)
[40] Environmental protection department and electrical and machanical sevices
department(EMSD/EPD), Guidelines to account for and report on greenhouse gas emissions and
removals for buildings (commercial, residential or institutional purpose) in Hong Kong, Hong
Kong,2008.
[41] B. Ye, Q. Lu, J. Li, K. Chang, Coal Power GHG Emission Intensity Model and Its
Application, Journal of Harbin University of Scienece and Technology, 16 (5) (2011) 125-130.
(in Chinese)
[42] Shenzhen Construction Cost Management Center (SZCCMC), Shenzhen Construction
Engineering Price Information.2009-2011. (in Chinese)
[43] Z.R. Jiang, The Calculation Handbook of Construction, China Construction Industry
Press (2nd Edition), Beijing, 2007. (in Chinese)
[44] O. Pons, G. Wadel, Environmental impacts of prefabricated school buildings in

25
Catalonia, Habitat International, 35 (4) (2011) 553-563.