Significant Polygenic Effects.pdf Hierarchical Model for ...
Comparative Polygenic Analysis of Maximal EthanolAccumulation Capacity and Tolerance to High EthanolLevels of Cell Proliferation in YeastThiago M. Pais1,2, Marıa R. Foulquie-Moreno1,2, Georg Hubmann1,2, Jorge Duitama3, Steve Swinnen1,2,
Annelies Goovaerts1,2, Yudi Yang1,2, Francoise Dumortier1,2, Johan M. Thevelein1,2*
1 Laboratory of Molecular Cell Biology, Institute of Botany and Microbiology, KU Leuven, Leuven-Heverlee, Flanders, Belgium, 2 Department of Molecular Microbiology,
VIB, Leuven-Heverlee, Flanders, Belgium, 3 Agrobiodiversity Research Area, International Center for Tropical Agriculture (CIAT), Cali, Colombia
Abstract
The yeast Saccharomyces cerevisiae is able to accumulate $17% ethanol (v/v) by fermentation in the absence of cellproliferation. The genetic basis of this unique capacity is unknown. Up to now, all research has focused on tolerance of yeastcell proliferation to high ethanol levels. Comparison of maximal ethanol accumulation capacity and ethanol tolerance of cellproliferation in 68 yeast strains showed a poor correlation, but higher ethanol tolerance of cell proliferation clearly increasedthe likelihood of superior maximal ethanol accumulation capacity. We have applied pooled-segregant whole-genomesequence analysis to identify the polygenic basis of these two complex traits using segregants from a cross of a haploidderivative of the sake strain CBS1585 and the lab strain BY. From a total of 301 segregants, 22 superior segregantsaccumulating $17% ethanol in small-scale fermentations and 32 superior segregants growing in the presence of 18%ethanol, were separately pooled and sequenced. Plotting SNP variant frequency against chromosomal position revealedeleven and eight Quantitative Trait Loci (QTLs) for the two traits, respectively, and showed that the genetic basis of the twotraits is partially different. Fine-mapping and Reciprocal Hemizygosity Analysis identified ADE1, URA3, and KIN3, encoding aprotein kinase involved in DNA damage repair, as specific causative genes for maximal ethanol accumulation capacity.These genes, as well as the previously identified MKT1 gene, were not linked in this genetic background to tolerance of cellproliferation to high ethanol levels. The superior KIN3 allele contained two SNPs, which are absent in all yeast strainssequenced up to now. This work provides the first insight in the genetic basis of maximal ethanol accumulation capacity inyeast and reveals for the first time the importance of DNA damage repair in yeast ethanol tolerance.
Citation: Pais TM, Foulquie-Moreno MR, Hubmann G, Duitama J, Swinnen S, et al. (2013) Comparative Polygenic Analysis of Maximal Ethanol AccumulationCapacity and Tolerance to High Ethanol Levels of Cell Proliferation in Yeast. PLoS Genet 9(6): e1003548. doi:10.1371/journal.pgen.1003548
Editor: Sue Jinks-Robertson, Duke University, United States of America
Received September 26, 2012; Accepted April 23, 2013; Published June 6, 2013
Copyright: � 2013 Pais et al. This is an open-access article distributed under the terms of the Creative Commons Attribution License, which permits unrestricteduse, distribution, and reproduction in any medium, provided the original author and source are credited.
Funding: This work has been supported by predoctoral fellowships to TMP, financed by Mark Anthony Group (Vancouver) and SS, financed by the Agency forInnovation by Science and Technology (IWT-Flanders), and by SBO grants (IWT 50148 and IWT 90043) from IWT-Flanders, the EC 7th Framework program (NEMOproject), IOF-Knowledge platform (IKP/10/002 ZKC 1836) and BOF-Program financing (project NATAR) to JMT. The funders had no role in study design, datacollection and analysis, decision to publish, or preparation of the manuscript.
Competing Interests: The authors have declared that no competing interests exist.
* E-mail: [email protected]
Introduction
The capacity to produce high levels of ethanol is a very rare
characteristic in nature. It is most prominent in the yeast
Saccharomyces cerevisiae, which is able to accumulate in the absence
of cell proliferation, ethanol concentrations in the medium of more
than 17%, a level that kills virtually all competing microorganisms.
As a result this property allows this yeast to outcompete all other
microorganisms in environments rich enough in sugar to sustain the
production of such high ethanol levels [1,2]. Very few other
microorganisms, e.g. the yeast Dekkera bruxellensis, have indepen-
dently evolved a similar but less pronounced ethanol tolerance
compared to S. cerevisiae [3]. The capacity to accumulate high
ethanol levels lies at the basis of the production of nearly all
alcoholic beverages as well as bioethanol in industrial fermentations
by the yeast S. cerevisiae. Originally, all alcoholic beverages were
produced with spontaneous fermentations in which S. cerevisiae
gradually increases in abundance, in parallel with the increase in the
ethanol level, to finally dominate the fermentation at the end.
The genetic basis of yeast ethanol tolerance has attracted much
attention but until recently nearly all research was performed with
laboratory yeast strains, which display much lower ethanol
tolerance than the natural and industrial yeast strains. This
research has pointed to properties like membrane lipid composi-
tion, chaperone protein expression and trehalose content, as major
requirements for ethanol tolerance of laboratory strains [2,4] but
the role played by these factors in other genetic backgrounds and
in establishing tolerance to very high ethanol levels has remained
unknown. We have recently performed polygenic analysis of the
high ethanol tolerance of a Brazilian bioethanol production strain
VR1. This revealed the involvement of several genes previously
never connected to ethanol tolerance and did not identify genes
affecting properties classically considered to be required for
ethanol tolerance in lab strains [5].
A second shortcoming of most previous studies is the assessment
of ethanol tolerance solely by measuring growth on nutrient plates
in the presence of increasing ethanol levels [2,4]. This is a
convenient assay, which allows hundreds of strains or segregants to
PLOS Genetics | www.plosgenetics.org 1 June 2013 | Volume 9 | Issue 6 | e1003548
be phenotyped simultaneously with little work and manpower.
However, the real physiological and ecological relevance of
ethanol tolerance in S. cerevisiae is its capacity to accumulate by
fermentation high ethanol levels in the absence of cell prolifera-
tion. This generally happens in an environment with a large excess
of sugar compared to other essential nutrients. As a result, a large
part of the ethanol in a typical, natural or industrial, yeast
fermentation is produced with stationary phase cells in the absence
of any cell proliferation. The ethanol tolerance of the yeast under
such conditions determines its maximal ethanol accumulation
capacity, a specific property of high ecological and industrial
importance. In industrial fermentations, a higher maximal ethanol
accumulation capacity allows a better attenuation of the residual
sugar and therefore results in a higher yield. A higher final ethanol
titer reduces the distillation costs and also lowers the liquid
volumes in the factory, which has multiple beneficial effects on
costs of heating, cooling, pumping and transport of liquid residue.
It also lowers microbial contamination and the higher ethanol
tolerance of the yeast generally also enhances the rate of
fermentation especially in the later stages of the fermentation
process. Maximal ethanol accumulation capacity can only be
determined in individual yeast fermentations, which are much
more laborious to perform than growth tests on plates. In static
industrial fermentations, maintenance of the yeast in suspension is
due to the strong CO2 bubbling and this can only be mimicked in
lab scale with a sufficient amount of cells in a sufficiently large
volume.
The advent of high-throughput methods for genome sequencing
has created a breakthrough also in the field of quantitative or
complex trait analysis in yeast [6,7]. The new methodology has
allowed efficient QTL mapping of several complex traits [5,8,9]
and reciprocal hemizygosity analysis [10] has facilitated identifi-
cation of the causative genes. The efficiency of the new
methodologies calls for new challenges to be addressed, such as
comparison of the genetic basis of related complex properties. In
addition, complex trait analysis in yeast has been applied up to
now mainly to phenotypic properties that are easy to score in
hundreds or even thousands of segregants [5,8–16]. However,
many phenotypic traits with high ecological or industrial relevance
require more elaborate experimental protocols for assessment and
it is not fully clear yet whether the low numbers of segregants that
can be scored in these cases are adequate for genetic mapping with
pooled-segregant whole-genome sequence analysis.
The aim of this work was to compare the genetic basis of the
complex traits of maximal ethanol accumulation capacity and
tolerance of cell proliferation to high ethanol levels. We show that
both traits have a partially different genetic basis and we have
identified for the first time specific genes involved in maximal
ethanol accumulation capacity.
Results
Strain selection for maximal ethanol accumulationcapacity
We have evaluated 68 different yeast strains in small-scale
fermentations for maximal ethanol accumulation capacity under
very high gravity (VHG) conditions [17], using 33% (w/v) glucose.
The robust wine strain V1116 was used as reference in each series
of fermentation experiments. Figure 1A shows the number of
strains able to accumulate a certain maximal ethanol level
expressed as percentage of the ethanol level accumulated by
V1116 in the same experiment, which was 18.460.4% (v/v).
There was no correlation between the final glycerol and ethanol
levels produced but there was an inverse correlation between the
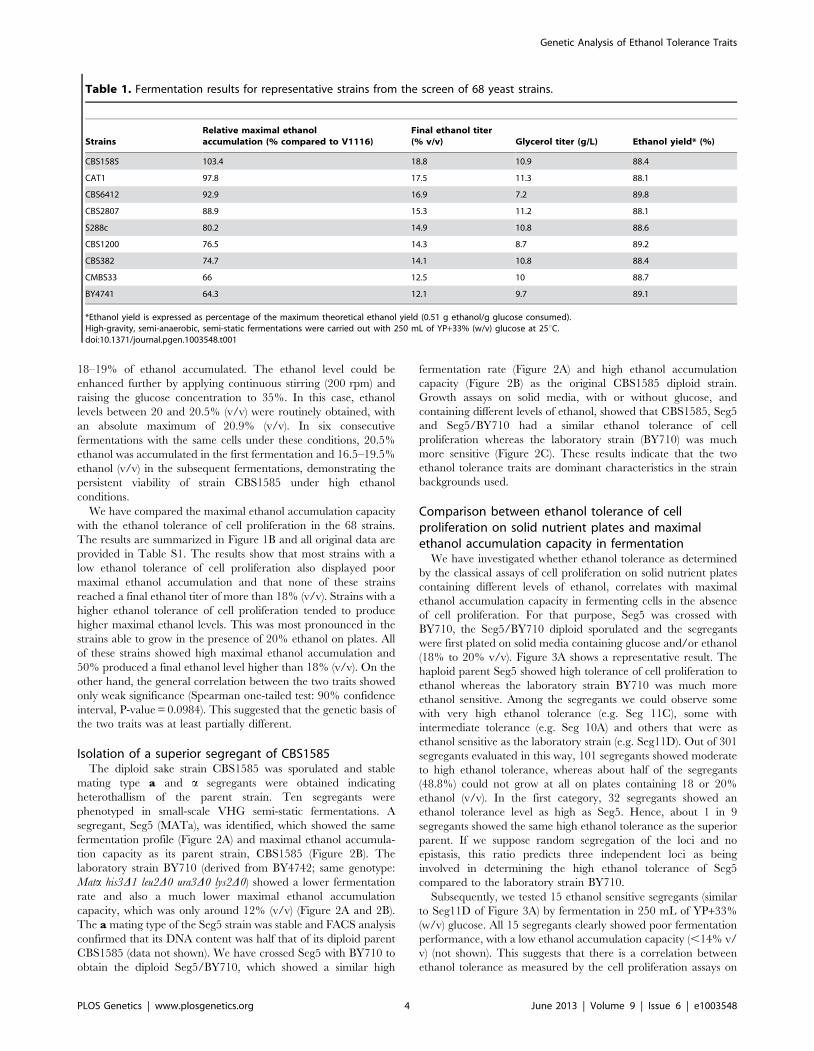
final glycerol level and the ethanol yield. Table 1 shows the
fermentation results for a number of representative strains ranked
according to the maximal ethanol level produced in comparison
with the reference V1116.
The fermentation of the reference strain, V1116, took 9.461.1
days to complete. The ethanol productivity was 0.65 g.L21.h21 (or
0.83 g.L21.h21 when we omit the last two days where the
fermentation had slowed down very much). The productivity was
highest during the first three days (1.17 g.L21.h21). The yield was
0.446 g ethanol/g glucose (87.4%). There was 2.2060.57% (w/v)
glucose leftover. Glycerol production was 10.3460.47 g/L. The
final pH was 4.560.2 for all strains evaluated. The best ethanol
producer was the sake strain, CBS1585, that accumulated 103.4%
of the amount of ethanol accumulated by V1116. The relative
ethanol production (% compared to V1116), the final ethanol %
(v/v), the glycerol yield (g/L) and ethanol yield (% of maximum
theoretical yield) for all 68 strains are listed in Table S1.
The laboratory strains BY4741 (Mata his3D1 leu2D0 ura3D0
met15D0) and S288c (prototrophic) produced only 64% and 80%,
respectively, of the ethanol level accumulated by V1116. This is in
accordance with previous studies that showed the prototrophic
laboratory strain (S288c) to be generally more stress tolerant than
its auxotrophic counterpart (BY4741) [18], although this has not
yet been documented for ethanol tolerance. The eight beer strains
tested all produced less than 80% of the ethanol produced by
V1116, in agreement with the relatively low ethanol levels
generally present in beers. On the other hand, strains used for
the production of bioethanol and sake were among the best for
maximal ethanol accumulation, which fits with the high level of
ethanol produced in these industrial fermentations [19,20].
Cell viability at the end of the fermentation was lower than
10%, and usually only 1–5%, for all strains tested, except for
Ethanol Red and CBS1585. The bioethanol production strain
Ethanol Red retained 22.1%64.1% viable cells and the sake
strain, CBS1585, even 31.5%65.1%. The latter strain also
showed the highest ethanol accumulation among all strains
evaluated. High ethanol production is a well-known trait of sake
strains [21]. The high residual viability is remarkable in view of the
Author Summary
The yeast Saccharomyces cerevisiae is unique in being themost ethanol tolerant organism known. This property liesat the basis of its ecological competitiveness in sugar-richecological niches and its use for the production ofalcoholic beverages and bioethanol, both of which involveaccumulation of high levels of ethanol. Up to now, allresearch on yeast ethanol tolerance has focused ontolerance of cell proliferation to high ethanol levels.However, the most ecologically and industrially relevantaspect is the capacity of fermenting yeast cells toaccumulate high ethanol levels in the absence of cellproliferation. Using QTL mapping by pooled-segregantwhole-genome sequence analysis, we show that maximalethanol accumulation capacity and tolerance of cellproliferation to high ethanol levels have a partiallydifferent genetic basis. We identified three specific genesresponsible for high ethanol accumulation capacity, ofwhich one gene encodes a protein kinase involved in DNAdamage repair. Our work provides the first insight in thegenetic basis of maximal ethanol accumulation capacity,shows that it involves different genetic elements com-pared to tolerance of cell proliferation to high ethanollevels, and reveals for the first time the importance of DNAdamage repair in ethanol tolerance.
Genetic Analysis of Ethanol Tolerance Traits
PLOS Genetics | www.plosgenetics.org 2 June 2013 | Volume 9 | Issue 6 | e1003548
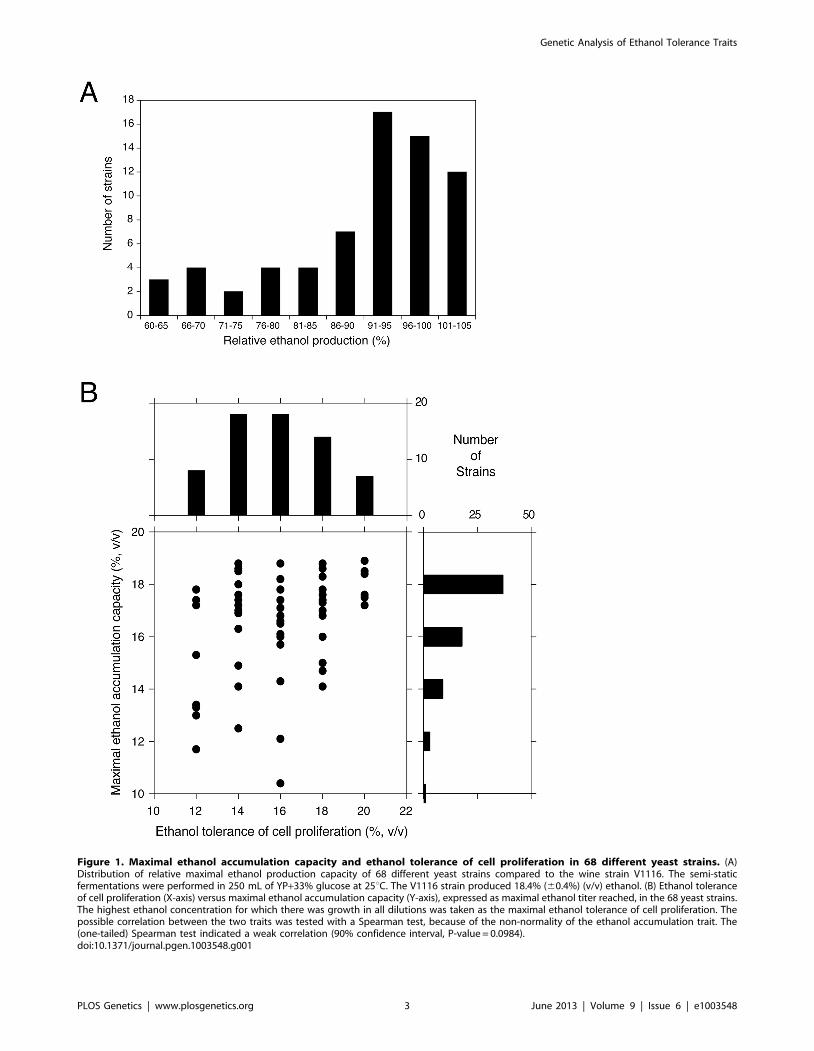
Figure 1. Maximal ethanol accumulation capacity and ethanol tolerance of cell proliferation in 68 different yeast strains. (A)Distribution of relative maximal ethanol production capacity of 68 different yeast strains compared to the wine strain V1116. The semi-staticfermentations were performed in 250 mL of YP+33% glucose at 25uC. The V1116 strain produced 18.4% (60.4%) (v/v) ethanol. (B) Ethanol toleranceof cell proliferation (X-axis) versus maximal ethanol accumulation capacity (Y-axis), expressed as maximal ethanol titer reached, in the 68 yeast strains.The highest ethanol concentration for which there was growth in all dilutions was taken as the maximal ethanol tolerance of cell proliferation. Thepossible correlation between the two traits was tested with a Spearman test, because of the non-normality of the ethanol accumulation trait. The(one-tailed) Spearman test indicated a weak correlation (90% confidence interval, P-value = 0.0984).doi:10.1371/journal.pgen.1003548.g001
Genetic Analysis of Ethanol Tolerance Traits
PLOS Genetics | www.plosgenetics.org 3 June 2013 | Volume 9 | Issue 6 | e1003548
18–19% of ethanol accumulated. The ethanol level could be
enhanced further by applying continuous stirring (200 rpm) and
raising the glucose concentration to 35%. In this case, ethanol
levels between 20 and 20.5% (v/v) were routinely obtained, with
an absolute maximum of 20.9% (v/v). In six consecutive
fermentations with the same cells under these conditions, 20.5%
ethanol was accumulated in the first fermentation and 16.5–19.5%
ethanol (v/v) in the subsequent fermentations, demonstrating the
persistent viability of strain CBS1585 under high ethanol
conditions.
We have compared the maximal ethanol accumulation capacity
with the ethanol tolerance of cell proliferation in the 68 strains.
The results are summarized in Figure 1B and all original data are
provided in Table S1. The results show that most strains with a
low ethanol tolerance of cell proliferation also displayed poor
maximal ethanol accumulation and that none of these strains
reached a final ethanol titer of more than 18% (v/v). Strains with a
higher ethanol tolerance of cell proliferation tended to produce
higher maximal ethanol levels. This was most pronounced in the
strains able to grow in the presence of 20% ethanol on plates. All
of these strains showed high maximal ethanol accumulation and
50% produced a final ethanol level higher than 18% (v/v). On the
other hand, the general correlation between the two traits showed
only weak significance (Spearman one-tailed test: 90% confidence
interval, P-value = 0.0984). This suggested that the genetic basis of
the two traits was at least partially different.
Isolation of a superior segregant of CBS1585The diploid sake strain CBS1585 was sporulated and stable
mating type a and a segregants were obtained indicating
heterothallism of the parent strain. Ten segregants were
phenotyped in small-scale VHG semi-static fermentations. A
segregant, Seg5 (MATa), was identified, which showed the same
fermentation profile (Figure 2A) and maximal ethanol accumula-
tion capacity as its parent strain, CBS1585 (Figure 2B). The
laboratory strain BY710 (derived from BY4742; same genotype:
Mata his3D1 leu2D0 ura3D0 lys2D0) showed a lower fermentation
rate and also a much lower maximal ethanol accumulation
capacity, which was only around 12% (v/v) (Figure 2A and 2B).
The a mating type of the Seg5 strain was stable and FACS analysis
confirmed that its DNA content was half that of its diploid parent
CBS1585 (data not shown). We have crossed Seg5 with BY710 to
obtain the diploid Seg5/BY710, which showed a similar high
fermentation rate (Figure 2A) and high ethanol accumulation
capacity (Figure 2B) as the original CBS1585 diploid strain.
Growth assays on solid media, with or without glucose, and
containing different levels of ethanol, showed that CBS1585, Seg5
and Seg5/BY710 had a similar ethanol tolerance of cell
proliferation whereas the laboratory strain (BY710) was much
more sensitive (Figure 2C). These results indicate that the two
ethanol tolerance traits are dominant characteristics in the strain
backgrounds used.
Comparison between ethanol tolerance of cellproliferation on solid nutrient plates and maximalethanol accumulation capacity in fermentation
We have investigated whether ethanol tolerance as determined
by the classical assays of cell proliferation on solid nutrient plates
containing different levels of ethanol, correlates with maximal
ethanol accumulation capacity in fermenting cells in the absence
of cell proliferation. For that purpose, Seg5 was crossed with
BY710, the Seg5/BY710 diploid sporulated and the segregants
were first plated on solid media containing glucose and/or ethanol
(18% to 20% v/v). Figure 3A shows a representative result. The
haploid parent Seg5 showed high tolerance of cell proliferation to
ethanol whereas the laboratory strain BY710 was much more
ethanol sensitive. Among the segregants we could observe some
with very high ethanol tolerance (e.g. Seg 11C), some with
intermediate tolerance (e.g. Seg 10A) and others that were as
ethanol sensitive as the laboratory strain (e.g. Seg11D). Out of 301
segregants evaluated in this way, 101 segregants showed moderate
to high ethanol tolerance, whereas about half of the segregants
(48.8%) could not grow at all on plates containing 18 or 20%
ethanol (v/v). In the first category, 32 segregants showed an
ethanol tolerance level as high as Seg5. Hence, about 1 in 9
segregants showed the same high ethanol tolerance as the superior
parent. If we suppose random segregation of the loci and no
epistasis, this ratio predicts three independent loci as being
involved in determining the high ethanol tolerance of Seg5
compared to the laboratory strain BY710.
Subsequently, we tested 15 ethanol sensitive segregants (similar
to Seg11D of Figure 3A) by fermentation in 250 mL of YP+33%
(w/v) glucose. All 15 segregants clearly showed poor fermentation
performance, with a low ethanol accumulation capacity (,14% v/
v) (not shown). This suggests that there is a correlation between
ethanol tolerance as measured by the cell proliferation assays on
Table 1. Fermentation results for representative strains from the screen of 68 yeast strains.
StrainsRelative maximal ethanolaccumulation (% compared to V1116)
Final ethanol titer(% v/v) Glycerol titer (g/L) Ethanol yield* (%)
CBS1585 103.4 18.8 10.9 88.4
CAT1 97.8 17.5 11.3 88.1
CBS6412 92.9 16.9 7.2 89.8
CBS2807 88.9 15.3 11.2 88.1
S288c 80.2 14.9 10.8 88.6
CBS1200 76.5 14.3 8.7 89.2
CBS382 74.7 14.1 10.8 88.4
CMBS33 66 12.5 10 88.7
BY4741 64.3 12.1 9.7 89.1
*Ethanol yield is expressed as percentage of the maximum theoretical ethanol yield (0.51 g ethanol/g glucose consumed).High-gravity, semi-anaerobic, semi-static fermentations were carried out with 250 mL of YP+33% (w/v) glucose at 25uC.doi:10.1371/journal.pgen.1003548.t001
Genetic Analysis of Ethanol Tolerance Traits
PLOS Genetics | www.plosgenetics.org 4 June 2013 | Volume 9 | Issue 6 | e1003548
solid nutrient plates and maximal ethanol accumulation capacity
in VHG fermentation, at least for the ethanol sensitive strains.
Hence, to reduce the high workload required for phenotyping all
segregants in fermentations, we tested in the small-scale fermen-
tations only the 101 segregants that showed moderate to high
ethanol tolerance in the growth assays on solid nutrient plates. We
are aware that the strains with poor ethanol tolerance of cell
proliferation may contain mutant genes that compromise maximal
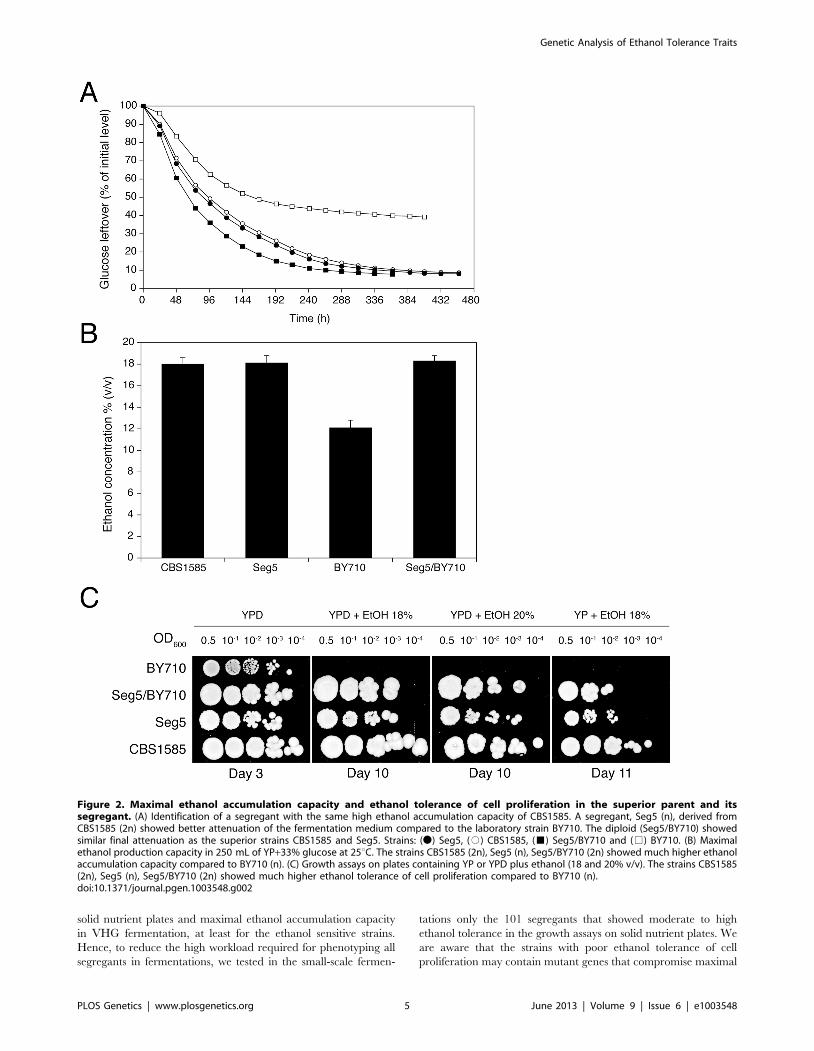
Figure 2. Maximal ethanol accumulation capacity and ethanol tolerance of cell proliferation in the superior parent and itssegregant. (A) Identification of a segregant with the same high ethanol accumulation capacity of CBS1585. A segregant, Seg5 (n), derived fromCBS1585 (2n) showed better attenuation of the fermentation medium compared to the laboratory strain BY710. The diploid (Seg5/BY710) showedsimilar final attenuation as the superior strains CBS1585 and Seg5. Strains: (N) Seg5, (#) CBS1585, (&) Seg5/BY710 and (%) BY710. (B) Maximalethanol production capacity in 250 mL of YP+33% glucose at 25uC. The strains CBS1585 (2n), Seg5 (n), Seg5/BY710 (2n) showed much higher ethanolaccumulation capacity compared to BY710 (n). (C) Growth assays on plates containing YP or YPD plus ethanol (18 and 20% v/v). The strains CBS1585(2n), Seg5 (n), Seg5/BY710 (2n) showed much higher ethanol tolerance of cell proliferation compared to BY710 (n).doi:10.1371/journal.pgen.1003548.g002
Genetic Analysis of Ethanol Tolerance Traits
PLOS Genetics | www.plosgenetics.org 5 June 2013 | Volume 9 | Issue 6 | e1003548
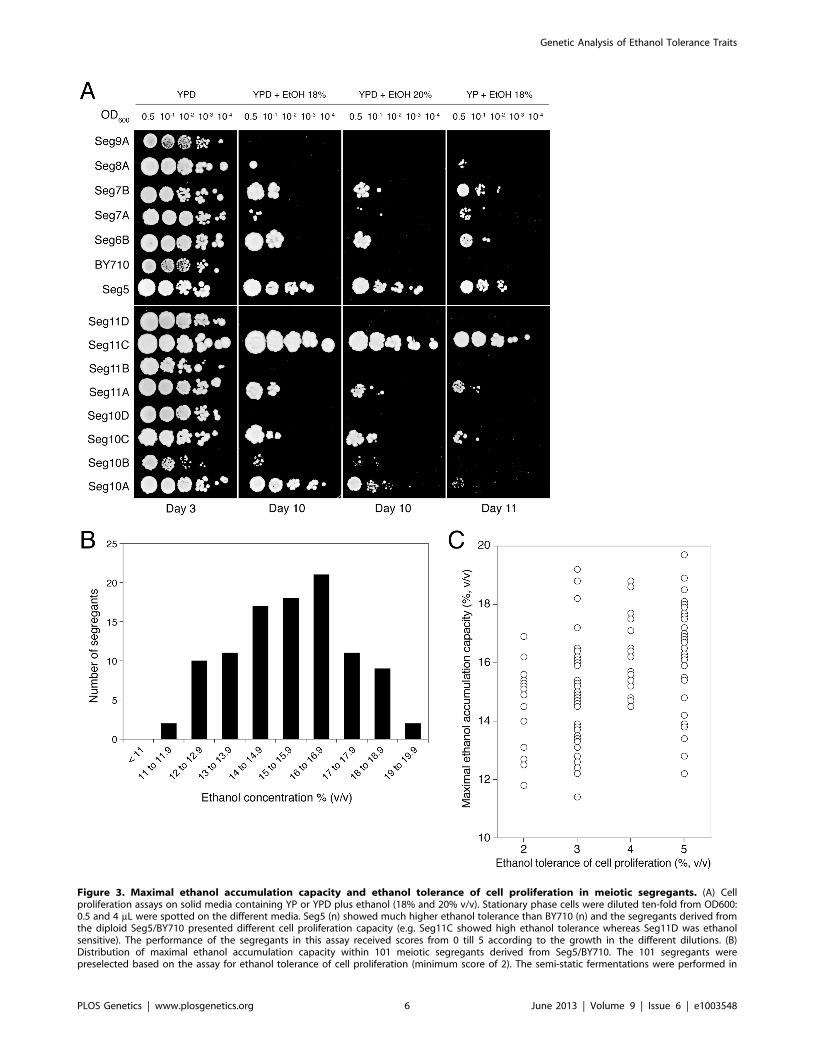
Figure 3. Maximal ethanol accumulation capacity and ethanol tolerance of cell proliferation in meiotic segregants. (A) Cellproliferation assays on solid media containing YP or YPD plus ethanol (18% and 20% v/v). Stationary phase cells were diluted ten-fold from OD600:0.5 and 4 mL were spotted on the different media. Seg5 (n) showed much higher ethanol tolerance than BY710 (n) and the segregants derived fromthe diploid Seg5/BY710 presented different cell proliferation capacity (e.g. Seg11C showed high ethanol tolerance whereas Seg11D was ethanolsensitive). The performance of the segregants in this assay received scores from 0 till 5 according to the growth in the different dilutions. (B)Distribution of maximal ethanol accumulation capacity within 101 meiotic segregants derived from Seg5/BY710. The 101 segregants werepreselected based on the assay for ethanol tolerance of cell proliferation (minimum score of 2). The semi-static fermentations were performed in
Genetic Analysis of Ethanol Tolerance Traits
PLOS Genetics | www.plosgenetics.org 6 June 2013 | Volume 9 | Issue 6 | e1003548
ethanol accumulation capacity or that when these strains show
relatively high maximal ethanol accumulation capacity, they may
contain (in part) different mutant alleles than the strains with high
ethanol tolerance of cell proliferation. The main purpose of this
work, however, was to identify the first set of major causative genes
determining maximal ethanol accumulation capacity and this is
the main reason why we continued first with the strains preselected
for medium to high ethanol tolerance of growth.
The distribution of maximal ethanol accumulation capacity
among the 101 segregants, as tested in semi-static small-scale
fermentations in 250 mL of YP+33% (w/v) glucose, is shown in
Figure 3B. We have also compared ethanol tolerance of cell
proliferation and maximal ethanol accumulation capacity for the
101 segregants. The results are shown in Figure 3C. They are
similar to the results obtained for the 68 natural and industrial
yeast strains (Figure 1B) in two aspects. First, irrespective of the
ethanol tolerance of cell proliferation, the segregants show a wide
range of ethanol accumulation capacities. This confirms that the
correlation between the two properties is weak. Second, the
segregants with a higher ethanol tolerance of cell proliferation
show a tendency towards higher ethanol accumulation capacity.
The latter effect is less pronounced than with the selection of
strains in Figure 1B, but this can be due to the fact that the poorest
segregants for ethanol tolerance of cell proliferation have already
been eliminated for the high-gravity fermentation experiments.
Only 22 segregants produced ethanol titres higher than 17% (v/
v), similar to the ethanol production of Seg5 and Seg5/BY710. If
we assume that all ethanol sensitive segregants, as determined by
growth assays on solid nutrient plates, also display poor maximal
ethanol accumulation, we have a ratio of one superior strain in
614 segregants (301/22 = 13.7). Assuming random segregation of
the QTLs and no epistasis, this ratio is consistent with four
independent loci being responsible for the superior ethanol
accumulation capacity of Seg5 compared to the BY710 control
strain. We constructed several diploids by crossing the four best
performing segregants but none of those showed higher ethanol
accumulation capacity than the original CBS1585 diploid strain
(data not shown).
QTL mapping by pooled-segregant whole-genomesequence analysis
We have performed genetic mapping of the two polygenic traits:
on the one hand, high ethanol accumulation capacity in
fermenting cells in the absence of cell proliferation, using the 22
best-performing segregants (pool 1) as determined in semi-static
VHG fermentations, and on the other hand, tolerance of cell
proliferation to high ethanol levels, using the 32 segregants (pool 2)
that showed the best growth on solid nutrient media containing 18
to 20% (v/v) ethanol. The two pools had 12 segregants in
common. Identification of the QTLs was performed by pooled-
segregant whole genome sequence analysis [5,6,8,9]. Genomic
DNA was sent to two independent companies (GATC Biotech,
Konstanz, and BGI, Hong Kong) for custom whole-genome
sequence analysis with an average depth of ,38 by the Illumina
platform. Other sequencing parameters are summarized in the
Methods section.
Sequence analysis of the genome of the superior parent Seg5
and comparison to S288c, allowed us to select 48,512 high-quality
SNPs after filtering for sufficient coverage ($20 times) and ratio
($80%) [5,22]. The coverage of at least 20 times was based on
previous findings that a 20-fold sequencing coverage is sufficient to
compensate for errors by the number of correct reads [23]. The
ratio of at least 80% was chosen based on the plots of the SNPs
between the two parent strains [5]. We also mapped the reads to
the assembled sequence for the Kyokai nu7 strain available in the
Saccharomyces genome database [24]. We were able to map about
20,000 additional reads to this sequence and 93% of the total read
pairs aligned with proper distance and orientation to the Kyokai
nu7 assembly, while only 87% of the read pairs mapped in the
same way to S288c. We also identified the sake strain specific
genes AWA1 and BIO6 [24], which further confirmed that
CBS1585 belongs to the sake cluster of S. cerevisiae strains.
Genomic DNA was extracted from the two selected pools,
containing 22 and 32 segregants, respectively, and also from an
unselected pool, composed of 237 segregants (pool 3) in order to
assess proper segregation of all chromosomes and possible links to
inadvertently selected traits, such as sporulation capacity or spore
viability. After sequence analysis, the SNP variant frequency was
plotted against the chromosomal position (Figure 4). Upward
deviations from the mean of 0.5 identify QTLs linked to the
superior parent Seg5, while downward deviations identify QTLs
linked to the inferior parent BY710. In most areas of the genome,
and especially in the QTL areas, the independent sequence
analysis by the two companies matched well, which confirms the
robustness of the pooled-segregant whole-genome sequencing
technology. Only in some selected areas the matching was poorer,
which may be due to the low pool sizes. The SNP variant
frequencies were smoothed using a Linear Mixed Model (LMM)
framework [5] and the putative QTLs were identified by applying
a Hidden Markov Model (HMM) similar to the one implemented
in the FastPHASE package [25]. For each polymorphism, the
HMM had three possible states: (i) a link with the superior parent
(Seg5), (ii) a link with the inferior parent (BY710) and (iii) no link
(background level). The SNP frequencies for each pool of
segregants, analysed with the HMM, were assigned probability
scores, that indicated to which state (Seg5, BY710 or background)
they belonged and hence identified the QTLs, linked to either the
superior parent (Seg5) or to the inferior parent (BY710).
The smoothed data of the SNP variant frequency and the
Probability of linkage values obtained by HMM analysis with the
selected pools 1 and 2 and the unselected pool 3, are shown in
Figure 4. The QTLs identified with the HMM approach are listed
in Tables 2 and 3 for pools 1 and 2, respectively. SNPs were
considered significantly linked to the superior or inferior parent
strain when the Probability of linkage was higher than 0.95 or
lower than 20.95, respectively. The QTLs were numbered
according to their position in the genome starting from
chromosome I, independently of the trait (Tables 2 and 3).
The unselected pool 3 (237 segregants) showed 650% SNP
variant frequency in most of the genome and thus no evidence of
any QTLs (Figure 4). The only exception was the right arm of
chromosome V which was preferentially inherited from the BY
parent strain. Comparison with the data of the selected pools,
suggested some weak linkage with the genome of the BY parent
strain in this part of chromosome V. Because of the weak linkage
this was not retained for further analysis. Crosses of Seg5 with
other BY strains did not show aberrant segregation of the right
arm of chromosome V (results not shown). The results obtained
250 mL of YP+33% glucose at 25uC. (C) Ethanol tolerance of cell proliferation (X-axis) versus maximal ethanol accumulation capacity (Y-axis),expressed as maximal ethanol titer reached, in the 101 segregants. The score for ethanol tolerance of cell proliferation was determined as explainedin (A).doi:10.1371/journal.pgen.1003548.g003
Genetic Analysis of Ethanol Tolerance Traits
PLOS Genetics | www.plosgenetics.org 7 June 2013 | Volume 9 | Issue 6 | e1003548
with the unselected pool show that the QTLs identified for the two
ethanol tolerance traits were not due to linkage with inadvertently
selected traits, such as sporulation capacity or spore viability.
The QTLs identified with the selected pools 1 and 2 showed two
common QTLs (on chr XIII and chr XV). They were called 12.1
and 17.1 for pool 1 and 12.2 and 17.2 for pool 2. It has to be
emphasized that the ‘common’ character of these QTLs is only
based on their common location in the genome. In principle, they
could be located in the same place on a chromosome but caused
by a different causative gene. Moreover, the QTLs 15 and 16 (pool
2) were also present in pool 1 as minor putative QTL of which the
significance could not be demonstrated with the current number of
segregants (Probability of linkage ,0.95). Other minor putative
QTLs of which the significance could not be demonstrated with
the current number of segregants (Probability of linkage ,0.95)
were present in pool 1 and pool 2. They were also seen with the
smoothed data and the HMM analysis (Figure 4) (e.g. on
chromosome VII). There was no indication for linkage of the
areas with the sake strain specific genes AWA1 and BIO6 to one or
both of the ethanol tolerance traits.
Identification of causative genes in QTLs of pool 1We have analysed in detail two QTLs (2 and 3) involved in high
ethanol accumulation capacity (pool 1) because this trait is more
relevant in industrial fermentations and because these two QTLs
were among those with the strongest linkage. QTL2 is located on
chromosome I and was fine-mapped by scoring selected markers
in the 22 individual segregants. This reduced the length of the
QTL to the area between chromosomal positions 151 kb and
178 kb (P-value,0.05) (Figure 5A). The association percentage of
the markers, their genomic positions, the respective P-values and
the genes located in the putative QTL 1 are shown in Figure 5A.
Nearly all genes present in the centre of the QTL had at least on
polymorphism either in the ORF, promotor or terminator. Hence,
it was not possible to exclude on this basis a significant number of
genes as candidate causative genes. Because of the large number of
candidate genes and the high workload of the phenotyping for
maximal ethanol accumulation capacity, we have introduced a
modification of the Reciprocal Hemizygosity Analysis (RHA)
methodology, which has been used previously for identification of
causative genes [10]. Instead of testing one candidate gene at a
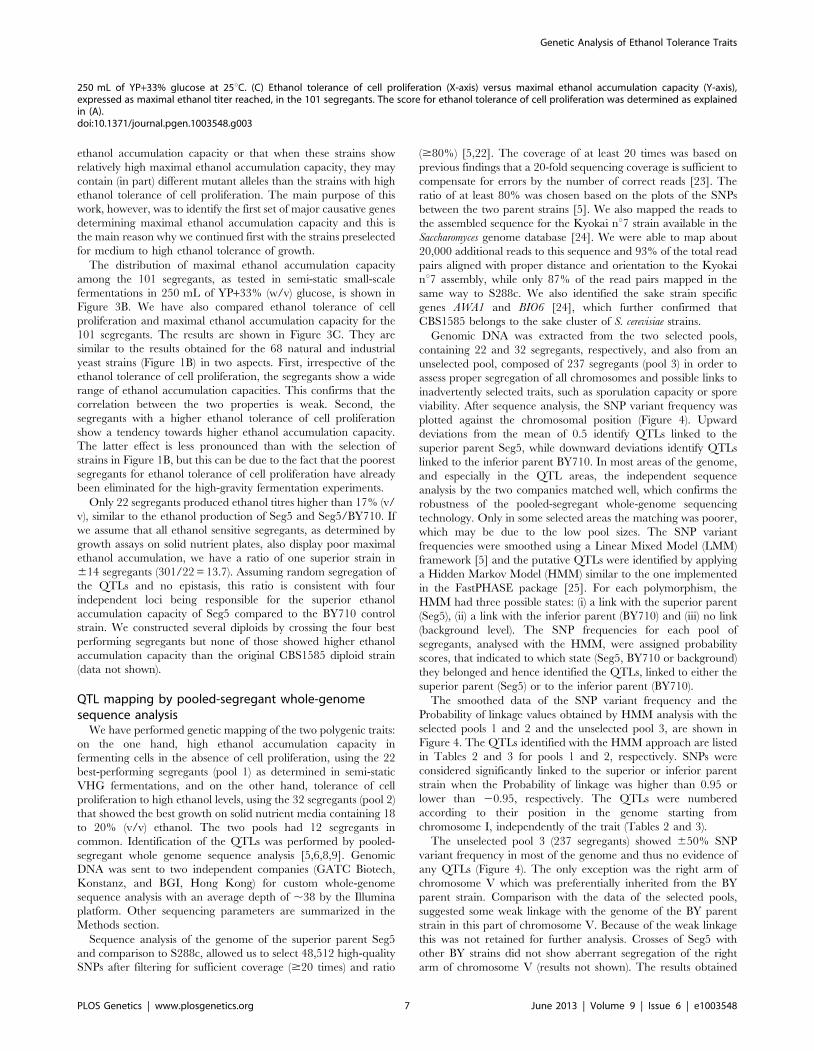
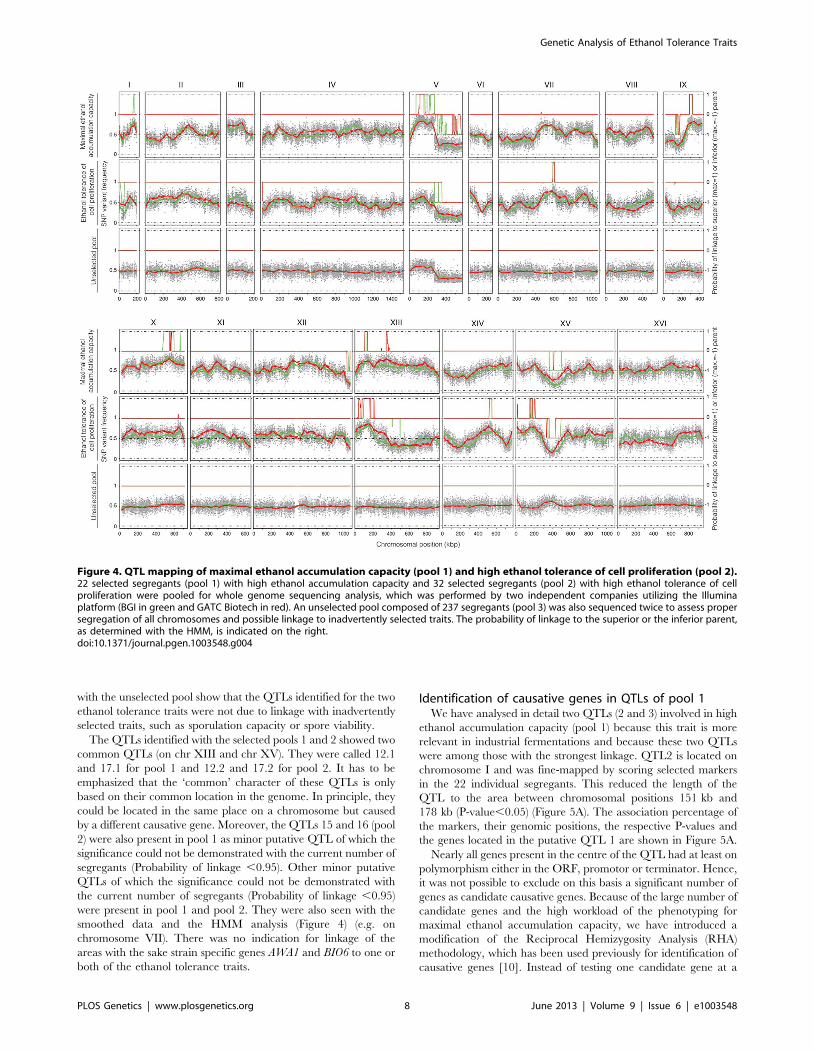
Figure 4. QTL mapping of maximal ethanol accumulation capacity (pool 1) and high ethanol tolerance of cell proliferation (pool 2).22 selected segregants (pool 1) with high ethanol accumulation capacity and 32 selected segregants (pool 2) with high ethanol tolerance of cellproliferation were pooled for whole genome sequencing analysis, which was performed by two independent companies utilizing the Illuminaplatform (BGI in green and GATC Biotech in red). An unselected pool composed of 237 segregants (pool 3) was also sequenced twice to assess propersegregation of all chromosomes and possible linkage to inadvertently selected traits. The probability of linkage to the superior or the inferior parent,as determined with the HMM, is indicated on the right.doi:10.1371/journal.pgen.1003548.g004
Genetic Analysis of Ethanol Tolerance Traits
PLOS Genetics | www.plosgenetics.org 8 June 2013 | Volume 9 | Issue 6 | e1003548
time, we first evaluated a series of adjacent genes by ‘bulk RHA’.
For that purpose a set of adjacent genes was deleted directly in the
heterozygous diploid background (Seg5/BY710) so as to obtain
the two reciprocally deleted hemizygous diploids of which the
phenotype was subsequently compared. The first block of genes
(bRHA 1.1) deleted, consisted of NUP60, ERP1, SWD1, RFA1 and
SEN34. The two reciprocally deleted diploid strains were tested by
fermentation in YP+33% (w/v) glucose, to address the effect of the
Seg5 and BY710 alleles on ethanol accumulation capacity. The
results showed no difference in the fermentation profile and
maximal ethanol accumulation (Figure 5B), suggesting that none
of these five genes were causative genes. There was also no
difference in fermentation profile and maximal ethanol accumu-
lation with the hybrid parent strain Seg5/BY710, further
supporting that these genes did not influence these phenotypes.
The second block of genes tested consisted of YARCdelta3/4/5,
YARCTy1-1, YAR009c, YAR010c, tA(UGC)A, BUD14, ADE1, KIN3
and CDC15 (bRHA 1.2) (Figure 5A). In this case there was a clear
reduction of the fermentation rate and maximal ethanol accumu-
lation when the alleles of the Seg5 strain were absent compared to
absence of the BY710 alleles (Figure 5C). Glucose leftover
correlated inversely with final ethanol titer. This suggested the
presence of one or more causative genes in this region. Moreover,
the fermentation rate was higher in the hemizygous strain where
the BY710 alleles were absent compared to the hybrid parent
strain Seg5/BY710, indicating that one or more of the BY710
alleles had a negative effect on this phenotype.
YARCdelta3/4/5, YARCTy1-1, YAR009c and YAR010c are
transposable elements, while tA(UGC)A encodes one of the
sixteen tRNAs for the amino acid alanine. BUD14 is involved in
bud-site selection [26], ADE1 is involved in de novo purine
biosynthesis [27], KIN3 encodes a non-essential serine/threonine
protein kinase involved in a.o. DNA damage repair [28] and
CDC15 encodes a protein kinase involved in control of the cell
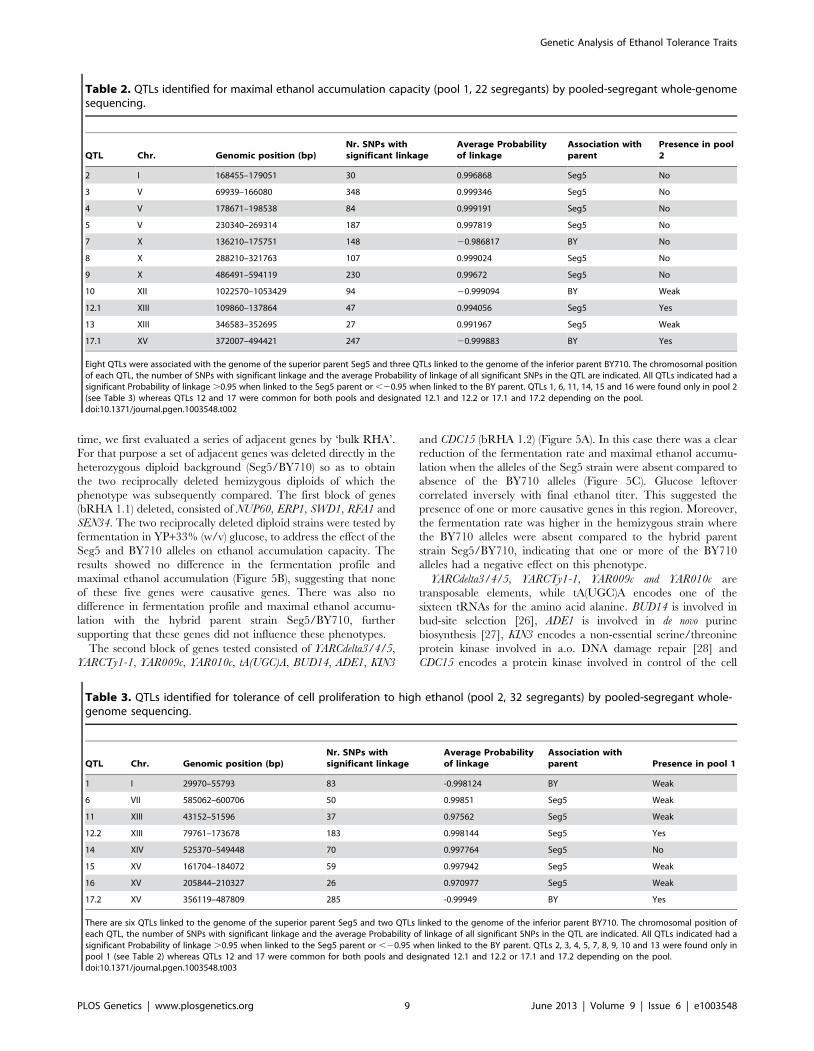
Table 2. QTLs identified for maximal ethanol accumulation capacity (pool 1, 22 segregants) by pooled-segregant whole-genomesequencing.
QTL Chr. Genomic position (bp)Nr. SNPs withsignificant linkage
Average Probabilityof linkage
Association withparent
Presence in pool2
2 I 168455–179051 30 0.996868 Seg5 No
3 V 69939–166080 348 0.999346 Seg5 No
4 V 178671–198538 84 0.999191 Seg5 No
5 V 230340–269314 187 0.997819 Seg5 No
7 X 136210–175751 148 20.986817 BY No
8 X 288210–321763 107 0.999024 Seg5 No
9 X 486491–594119 230 0.99672 Seg5 No
10 XII 1022570–1053429 94 20.999094 BY Weak
12.1 XIII 109860–137864 47 0.994056 Seg5 Yes
13 XIII 346583–352695 27 0.991967 Seg5 Weak
17.1 XV 372007–494421 247 20.999883 BY Yes
Eight QTLs were associated with the genome of the superior parent Seg5 and three QTLs linked to the genome of the inferior parent BY710. The chromosomal positionof each QTL, the number of SNPs with significant linkage and the average Probability of linkage of all significant SNPs in the QTL are indicated. All QTLs indicated had asignificant Probability of linkage .0.95 when linked to the Seg5 parent or ,20.95 when linked to the BY parent. QTLs 1, 6, 11, 14, 15 and 16 were found only in pool 2(see Table 3) whereas QTLs 12 and 17 were common for both pools and designated 12.1 and 12.2 or 17.1 and 17.2 depending on the pool.doi:10.1371/journal.pgen.1003548.t002
Table 3. QTLs identified for tolerance of cell proliferation to high ethanol (pool 2, 32 segregants) by pooled-segregant whole-genome sequencing.
QTL Chr. Genomic position (bp)Nr. SNPs withsignificant linkage
Average Probabilityof linkage
Association withparent Presence in pool 1
1 I 29970–55793 83 -0.998124 BY Weak
6 VII 585062–600706 50 0.99851 Seg5 Weak
11 XIII 43152–51596 37 0.97562 Seg5 Weak
12.2 XIII 79761–173678 183 0.998144 Seg5 Yes
14 XIV 525370–549448 70 0.997764 Seg5 No
15 XV 161704–184072 59 0.997942 Seg5 Weak
16 XV 205844–210327 26 0.970977 Seg5 Weak
17.2 XV 356119–487809 285 -0.99949 BY Yes
There are six QTLs linked to the genome of the superior parent Seg5 and two QTLs linked to the genome of the inferior parent BY710. The chromosomal position ofeach QTL, the number of SNPs with significant linkage and the average Probability of linkage of all significant SNPs in the QTL are indicated. All QTLs indicated had asignificant Probability of linkage .0.95 when linked to the Seg5 parent or ,20.95 when linked to the BY parent. QTLs 2, 3, 4, 5, 7, 8, 9, 10 and 13 were found only inpool 1 (see Table 2) whereas QTLs 12 and 17 were common for both pools and designated 12.1 and 12.2 or 17.1 and 17.2 depending on the pool.doi:10.1371/journal.pgen.1003548.t003
Genetic Analysis of Ethanol Tolerance Traits
PLOS Genetics | www.plosgenetics.org 9 June 2013 | Volume 9 | Issue 6 | e1003548
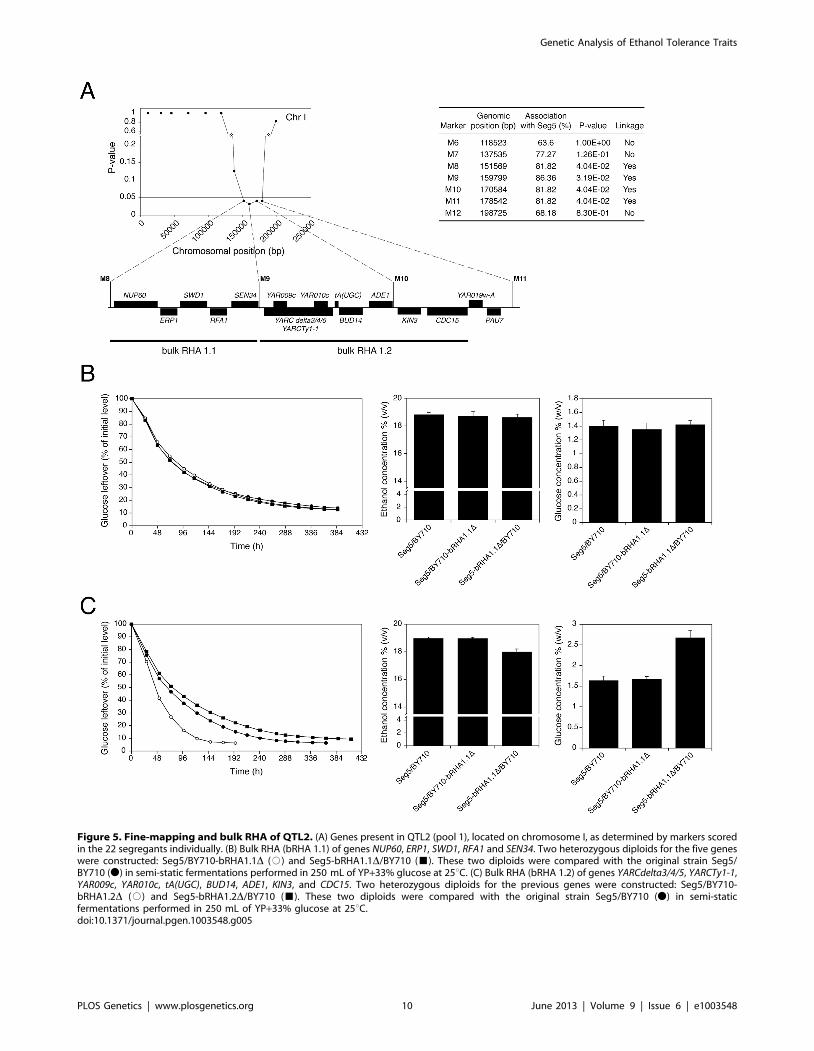
Figure 5. Fine-mapping and bulk RHA of QTL2. (A) Genes present in QTL2 (pool 1), located on chromosome I, as determined by markers scoredin the 22 segregants individually. (B) Bulk RHA (bRHA 1.1) of genes NUP60, ERP1, SWD1, RFA1 and SEN34. Two heterozygous diploids for the five geneswere constructed: Seg5/BY710-bRHA1.1D (#) and Seg5-bRHA1.1D/BY710 (&). These two diploids were compared with the original strain Seg5/BY710 (N) in semi-static fermentations performed in 250 mL of YP+33% glucose at 25uC. (C) Bulk RHA (bRHA 1.2) of genes YARCdelta3/4/5, YARCTy1-1,YAR009c, YAR010c, tA(UGC), BUD14, ADE1, KIN3, and CDC15. Two heterozygous diploids for the previous genes were constructed: Seg5/BY710-bRHA1.2D (#) and Seg5-bRHA1.2D/BY710 (&). These two diploids were compared with the original strain Seg5/BY710 (N) in semi-staticfermentations performed in 250 mL of YP+33% glucose at 25uC.doi:10.1371/journal.pgen.1003548.g005
Genetic Analysis of Ethanol Tolerance Traits
PLOS Genetics | www.plosgenetics.org 10 June 2013 | Volume 9 | Issue 6 | e1003548

division cycle [29]. In order to identify the genes(s) involved in
ethanol accumulation capacity, we investigated the most likely
candidate genes individually with the classical one-gene RHA
[10]. Involvement of the transposable elements appeared unlikely
and was not evaluated by RHA. The other genes, BUD14, ADE1,
KIN3 and CDC15, have polymorphisms (SNPs and/or indels)
within their ORFs and/or promoter regions. RHA with the genes
ADE1 and KIN3 showed that deletion of the Seg5 alleles resulted in
strains with clearly lower ethanol accumulation capacity and
higher glucose leftover compared to the strain with deletion of the
respective BY allele, indicating that ADE1 and KIN3 are causative
genes for high ethanol accumulation capacity in Seg5 (Figure 6A).
For both genes, the hybrid parent strain Seg5/BY710 behaved in
a similar way as the strain with the deleted BY710 allele. For
CDC15 and BUD14 there was no difference in the performance of
the two reciprocally deleted diploid strains (not shown). Deletion of
ADE1 and KIN3 in the Seg5 and BY backgrounds caused a more
pronounced effect in the Seg5 sake genetic background (Figure 6B).
The causative genes ADE1 and KIN3 were located in QTL2,
which was not linked with ethanol tolerance of cell proliferation.
When we tested the hybrid diploid strains previously used in RHA
for maximal ethanol accumulation for determination of ethanol
tolerance of cell proliferation, we could indeed not observe any
significant difference between the two strains (Figure 6C). This
confirms that these causative genes are specific for maximal
ethanol accumulation capacity and that the genetic basis of the
two ethanol tolerance traits is indeed partially different.
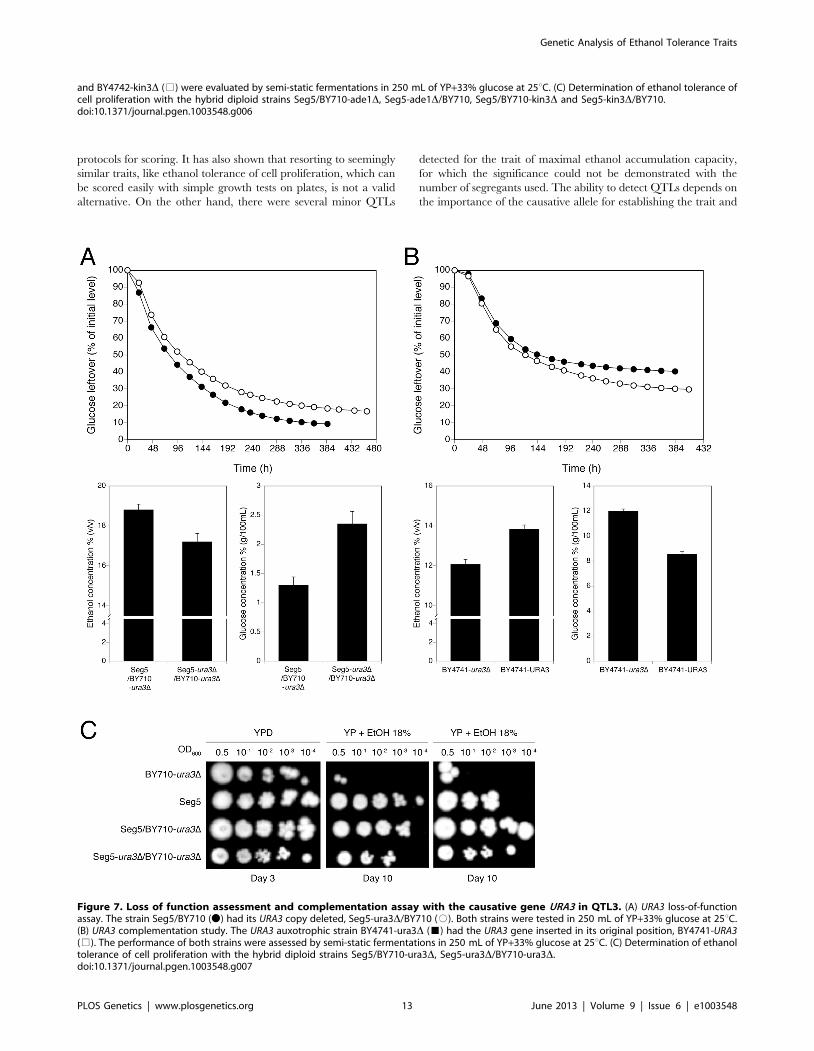
We also analysed in more detail QTL3, located on chromosome
V. In the same chromosomal region, Swinnen et al. [5] previously
identified URA3 as a causative gene in tolerance of cell
proliferation to high ethanol levels of VR1, a Brazilian bioethanol
production strain, in comparison with BY4741 as inferior parent
strain. Since we crossed Seg5 with an ura3 auxotrophic laboratory
strain (BY710), we first tested whether deletion of URA3 in Seg5
affected maximal ethanol accumulation in this genetic back-
ground. The fermentation profile and maximal ethanol accumu-
lation of the strain Seg5-ura3D/BY710-ura3D (which is thus
homozygous for ura3D) compared with the Seg5/BY710-ura3Ddiploid (which is heterozygous for ura3D) are shown in Figure 7A.
Double deletion of URA3 resulted in a strain with a reduced
ethanol fermentation rate, lower maximal ethanol accumulation
and higher glucose leftover. We have also tested the effect of
introducing URA3 in the ura3 auxotrophic strain BY4741, which
accumulates only low amounts of ethanol under VHG conditions
(612% v/v). Introduction of URA3 enhanced the fermentation
rate in the later stages of the fermentation and resulted in a clearly
higher maximal ethanol titer and lower glucose leftover
(Figure 7B). These results show that URA3 positively affects
maximal ethanol accumulation capacity. The URA3 gene was
located in QTL3, which was not significantly linked with ethanol
tolerance of cell proliferation. When we tested the hybrid diploid
strains previously used in RHA for maximal ethanol accumulation
for determination of ethanol tolerance of cell proliferation, we
observed slightly better growth for the strain with the URA3 allele
from Seg5 (Figure 7C). This confirms that URA3 has only a minor
contribution to this phenotype in this genetic background and
suggests that the very weak upward deviation in the SNP variant
frequency plot observed in this position for ethanol tolerance of
cell proliferation might have been due to the URA3 gene.
Occurrence of the SNPs in the causative genes ADE1 andKIN3 in other yeast strains
Comparison of the sequence of ADE1 and KIN3 in Seg5 and
BY710 (S288c background) revealed a C to T transition in the
promoter of ADE1 and a C to T transition in the promoter of KIN3
as well as three synonymous transition mutations in the ORF of
KIN3. We have checked the presence of these SNPs in the ADE1
and KIN3 genes of 36 yeast strains of which the whole genome
sequence has been published. The results are shown in Table 4.
(Among the 36 strains there were additional SNPs compared to
S288c, which were not present in Seg5. These SNPs are not
shown). The C to T change at position 169227 in ADE1 is present
only in two other strains, Kyokai nr. 7 and UC5. Both strains are
sake strains and these strains are known to have superior maximal
ethanol accumulation capacity. Sake fermentation produces the
highest ethanol level of all yeast fermentations for production of
alcoholic beverages [21]. The SNPs in KIN3 of Seg5 at positions
170564 and 170945 are present in many other strains. Interest-
ingly, however, the two other SNPs in KIN3 of Seg5, at positions
170852 (in the ORF) and 171947 (in the promoter) are not present
in KIN3 of any one of the 36 sequenced strains and therefore may
be rather unique.
Discussion
Tolerance to high ethanol levels is an exquisite characteristic of
the yeast Saccharomyces cerevisiae and no other microorganism has
ever been reported to show higher ethanol tolerance. This unique
property of yeast lies at the basis of the production of most
alcoholic beverages and of ethanol as biofuel. In most studies,
ethanol tolerance has been assayed by measuring cell proliferation
in the presence of increasing ethanol levels. Although this assay is
convenient for routine measurement and large-scale screenings, its
true relevance for ethanol tolerance in yeast fermentation is
unclear. Industrial yeast fermentations always start with an excess
of fermentable sugar compared to other essential nutrients. As a
result, the ethanol production rate in the second phase of the
fermentation, the extent of attenuation of the residual sugar and
the final ethanol titer reached are always achieved by stationary
phase cells. In this work we have compared for the first time the
genetic basis of maximal ethanol accumulation capacity in
fermenting cells in the absence of cell proliferation with that of
ethanol tolerance of cell proliferation. To avoid interference by the
genetic background of the strain, we have used the same pool of
segregants derived from one hybrid parent. The results of the
QTL mapping by pooled-segregant whole-genome sequence
analysis reveal a partial overlap between the genetic basis of the
two traits. Although only two significant QTLs, 12.1/12.2 on Chr.
XIII and 17.1/17.2 on Chr. XV appear identical, there were
minor QTLs in pool 1 of which the significance could not be
demonstrated with the current number of segregants (e.g. on Chr.
VII and XV), which are likely overlapping with significant QTLs
in the same position in pool 2. However, because of the lower
number of segregants in pool 1, the P-value of these QTLs is not
low enough for significance. It is also important in this respect to
recall that the two pools had 12 segregants in common. A stronger
argument for partial overlap between the genetic basis of the two
traits could be made if two pools would be assembled not only with
different segregants but containing in each pool only segregants
that would not fit phenotypically in the other pool. This would
have required, however, a large amount of additional experimen-
tal work.
Our work has shown that successful QTL mapping using
pooled-segregant whole-genome sequence analysis can be per-
formed with relatively low numbers of segregants. This is
particularly important for elucidation of the genetic basis of
complex traits of industrial importance, like maximal ethanol
accumulation capacity, which require laborious experimental
Genetic Analysis of Ethanol Tolerance Traits
PLOS Genetics | www.plosgenetics.org 11 June 2013 | Volume 9 | Issue 6 | e1003548

Figure 6. Single gene RHA and loss of function assessment for the causative genes ADE1 and KIN3 in QTL2. (A) RHA of genes ADE1 andKIN3. The diploid strain Seg5/BY710 (N) had ADE1 or KIN3 deleted in one of the alleles separately. The resulting strains Seg5/BY710-ade1D (#), Seg5-ade1D/BY710 (m), Seg5/BY710-kin3D (D) and Seg5-kin3D/BY710 (&) were compared with the original diploid Seg5/BY710 (N) in semi-static small-scale fermentations in YP+33% glucose at 25uC. The deletion of the alleles present in Seg5 resulted in diploids with lower ethanol accumulationcapacity in comparison to the original strain and the deletion of the alleles from BY710. (B) ADE1 and KIN3 loss-of-function assays. The genes ADE1and KIN3 were deleted in the haploid strains Seg5 (N) and BY4742 (D) separately. The strains Seg5-ade1D (#), Seg5-kin3D (m), BY4742-ade1D (&)
Genetic Analysis of Ethanol Tolerance Traits
PLOS Genetics | www.plosgenetics.org 12 June 2013 | Volume 9 | Issue 6 | e1003548
protocols for scoring. It has also shown that resorting to seemingly
similar traits, like ethanol tolerance of cell proliferation, which can
be scored easily with simple growth tests on plates, is not a valid
alternative. On the other hand, there were several minor QTLs
detected for the trait of maximal ethanol accumulation capacity,
for which the significance could not be demonstrated with the
number of segregants used. The ability to detect QTLs depends on
the importance of the causative allele for establishing the trait and
and BY4742-kin3D (%) were evaluated by semi-static fermentations in 250 mL of YP+33% glucose at 25uC. (C) Determination of ethanol tolerance ofcell proliferation with the hybrid diploid strains Seg5/BY710-ade1D, Seg5-ade1D/BY710, Seg5/BY710-kin3D and Seg5-kin3D/BY710.doi:10.1371/journal.pgen.1003548.g006
Figure 7. Loss of function assessment and complementation assay with the causative gene URA3 in QTL3. (A) URA3 loss-of-functionassay. The strain Seg5/BY710 (N) had its URA3 copy deleted, Seg5-ura3D/BY710 (#). Both strains were tested in 250 mL of YP+33% glucose at 25uC.(B) URA3 complementation study. The URA3 auxotrophic strain BY4741-ura3D (&) had the URA3 gene inserted in its original position, BY4741-URA3(%). The performance of both strains were assessed by semi-static fermentations in 250 mL of YP+33% glucose at 25uC. (C) Determination of ethanoltolerance of cell proliferation with the hybrid diploid strains Seg5/BY710-ura3D, Seg5-ura3D/BY710-ura3D.doi:10.1371/journal.pgen.1003548.g007
Genetic Analysis of Ethanol Tolerance Traits
PLOS Genetics | www.plosgenetics.org 13 June 2013 | Volume 9 | Issue 6 | e1003548
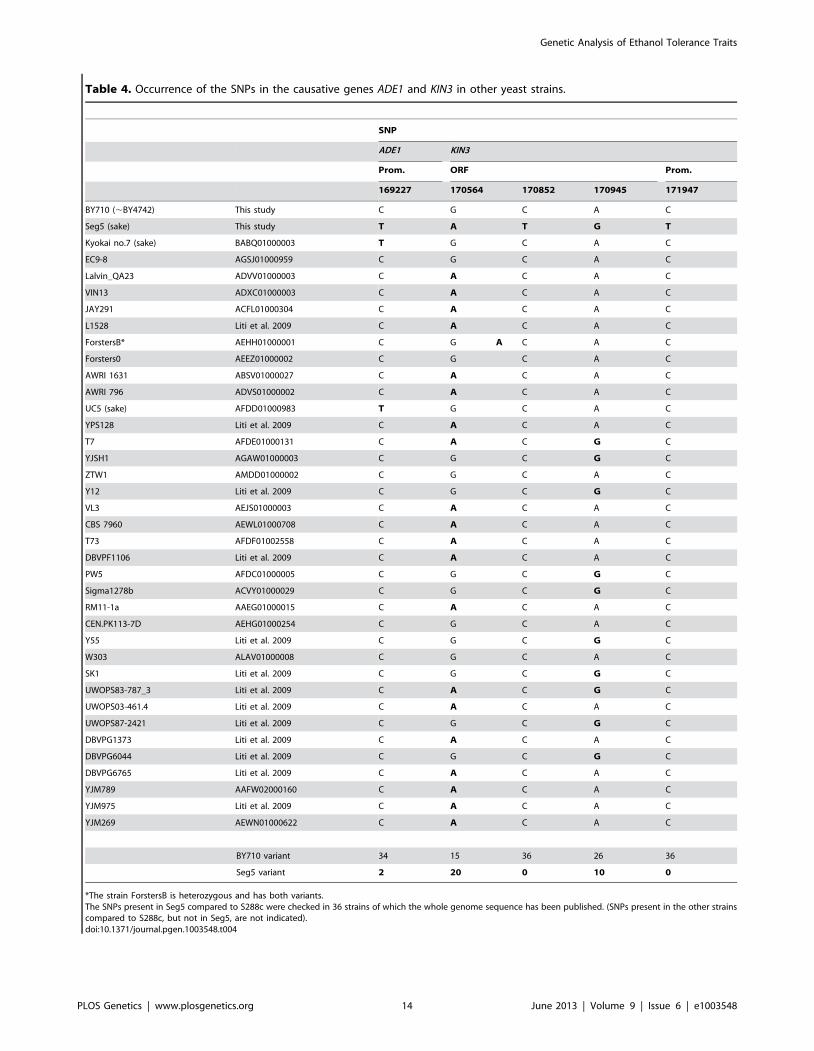
Table 4. Occurrence of the SNPs in the causative genes ADE1 and KIN3 in other yeast strains.
SNP
ADE1 KIN3
Prom. ORF Prom.
169227 170564 170852 170945 171947
BY710 (,BY4742) This study C G C A C
Seg5 (sake) This study T A T G T
Kyokai no.7 (sake) BABQ01000003 T G C A C
EC9-8 AGSJ01000959 C G C A C
Lalvin_QA23 ADVV01000003 C A C A C
VIN13 ADXC01000003 C A C A C
JAY291 ACFL01000304 C A C A C
L1528 Liti et al. 2009 C A C A C
ForstersB* AEHH01000001 C G A C A C
Forsters0 AEEZ01000002 C G C A C
AWRI 1631 ABSV01000027 C A C A C
AWRI 796 ADVS01000002 C A C A C
UC5 (sake) AFDD01000983 T G C A C
YPS128 Liti et al. 2009 C A C A C
T7 AFDE01000131 C A C G C
YJSH1 AGAW01000003 C G C G C
ZTW1 AMDD01000002 C G C A C
Y12 Liti et al. 2009 C G C G C
VL3 AEJS01000003 C A C A C
CBS 7960 AEWL01000708 C A C A C
T73 AFDF01002558 C A C A C
DBVPF1106 Liti et al. 2009 C A C A C
PW5 AFDC01000005 C G C G C
Sigma1278b ACVY01000029 C G C G C
RM11-1a AAEG01000015 C A C A C
CEN.PK113-7D AEHG01000254 C G C A C
Y55 Liti et al. 2009 C G C G C
W303 ALAV01000008 C G C A C
SK1 Liti et al. 2009 C G C G C
UWOPS83-787_3 Liti et al. 2009 C A C G C
UWOPS03-461.4 Liti et al. 2009 C A C A C
UWOPS87-2421 Liti et al. 2009 C G C G C
DBVPG1373 Liti et al. 2009 C A C A C
DBVPG6044 Liti et al. 2009 C G C G C
DBVPG6765 Liti et al. 2009 C A C A C
YJM789 AAFW02000160 C A C A C
YJM975 Liti et al. 2009 C A C A C
YJM269 AEWN01000622 C A C A C
BY710 variant 34 15 36 26 36
Seg5 variant 2 20 0 10 0
*The strain ForstersB is heterozygous and has both variants.The SNPs present in Seg5 compared to S288c were checked in 36 strains of which the whole genome sequence has been published. (SNPs present in the other strainscompared to S288c, but not in Seg5, are not indicated).doi:10.1371/journal.pgen.1003548.t004
Genetic Analysis of Ethanol Tolerance Traits
PLOS Genetics | www.plosgenetics.org 14 June 2013 | Volume 9 | Issue 6 | e1003548
on the number of QTLs/causative alleles involved. Higher
numbers of segregants will therefore always be useful to map
minor QTLs and identify their causative alleles.
Detailed analysis of QTL 2 on Chr. I and QTL 3 on Chr. V
identified three genes specifically linked to maximal ethanol
accumulation capacity, which indicates that ethanol tolerance as
relevant for maximal ethanol accumulation in fermentations
cannot be fully assessed in a reliable way by simple growth tests
on solid nutrient plates in the presence of ethanol. The
identification of KIN3 as a causative gene is striking because it
reveals for the first time a role for DNA damage repair in ethanol
tolerance as required for maximal ethanol accumulation. More-
over, the superior KIN3 allele of Seg5 contained two SNPs, which
were absent in the KIN3 gene of all yeast strains of which the
genome has been fully sequenced up to now, suggesting that they
may be important for the exceptional ethanol accumulation
capacity of the Seg5 strain and its diploid parent CBS1585. KIN3
encodes a serine-threonine protein kinase, required for arrest at
the G2/M-phase checkpoint in response to the DNA damage
inducing agents MMS, cisplatin, doxorubicin and nitrogen
mustard [28]. Involvement of Kin3 in the DNA damage response
may be consistent with its requirement for tolerance to high
ethanol levels. Ethanol was reported to be mutagenic and to
induce single-strand DNA breaks in repair-deficient but not in
repair-proficient yeast cells [30]. It was also reported to trigger
chromatin condensation, fragmentation, and DNA cleavage in
yeast, features suggestive of induction of apoptosis [31]. Mito-
chondrial DNA loss in yeast is induced by ethanol and
mitochondrial DNA from more ethanol tolerant flor yeasts
enhanced ethanol tolerance when transferred into a laboratory
strain [32]. Also in mammalian cells, ethanol was shown to induce
DNA damage and is a known carcinogen [33]. A role for DNA
repair in protecting mammalian cells from ethanol-induced
damage has been proposed [34]. It will be interesting to investigate
to what extent maximal ethanol accumulation in yeast can be
enhanced by further strengthening DNA damage repair capacity.
The case of URA3 is remarkable. It encodes one of the most
active enzymes, oritidine 5-phosphate decarboxylase (OCDase),
that catalyzes the decarboxylation of oritidine 5-phosphate (OMP)
to uridylic acid (UMP) [35,36]. This is the sixth enzymatic step in
the de novo biosynthesis of pyrimidines. Yeast strains lacking URA3
need supplementation with uracil in the medium. Our previous
work identified ura3 [5] and several other auxotrophic mutations
(unpublished results) as causative mutations for ethanol tolerance
of cell proliferation in a cross of a Brazilian bioethanol production
strain VR1 and the BY laboratory strain. We have now identified
ura3 as causative gene for maximal ethanol accumulation capacity
in the cross of the sake strain CBS1585 and BY. However, in this
genetic background ura3 was not significantly linked to ethanol
tolerance of cell proliferation. This indicates that the genetic basis
of the latter property is dependent on the genetic background of
the strain. A stronger capacity to generate the electrochemical
potential required for symport, may for instance offset the ethanol
sensitivity of the uptake of auxotrophic supplements.
Lower expression of auxotrophic genes, like URA3, or lower
activity of the gene product, forces the yeast cells to take up most
uracil using the uracil permease, Fur4, which is an active proton
symporter [37]. Stress conditions, including nutrient starvation,
can trigger degradation of Fur4 [38]. Hence, the requirement of
URA3 for maximal ethanol production capacity might be linked to
nutrient starvation towards the end of the semi-anaerobic, high-
gravity fermentation process, which can take up to 21 days. Uracil
is likely depleted and/or its transporter Fur4 may be degraded
because of the nutrient starvation conditions at the end of the
fermentation. In addition, ethanol toxicity may also compromise
the proton gradient, which is required for uptake by symport of
uracil and protons from the medium. This type of inhibition was
reported for amino acid uptake by the proton symporter Gap1
[39]. The reduction of maximal ethanol accumulation in ura3
auxotrophic strains suggests that in general the active uptake of
nutrients may be compromised by the increasing ethanol level at
the end of the fermentation. Yeast cells have only one permease to
transport uracil, Fur4, which may make this system more sensitive
to ethanol inhibition compared to for instance amino acid
transport, for which many transporters exist.
Another relevant factor may be the general fitness problem of
URA3 deleted strains. URA3 auxotrophic strains (BY710-ura3D,
BY4741-ura3D and Seg5-ura3D/BY710-ura3D) showed much less
biomass production in the pre-cultures performed in YPD,
YP+5% glucose, YP+10% glucose and during the fermentations
in YP+33–35% glucose (OD600 around 12.462.68) whereas
Seg5/BY710-ura3D (prototrophic) for example, had much higher
cell densities (32.663.42 in stirred fermentations). Low cell
densities contribute to a slow fermentation phenotype that is also
associated with lower final ethanol levels. The importance of uracil
supplementation and fitness problems related to uracil auxotro-
phic strains have been reported recently by Basso et al. [19].
We identified the ADE1 allele in Seg5 by RHA as a superior
allele for maximal ethanol accumulation capacity in high-gravity
fermentation. As in the case of URA3, there was no link between
ADE1 and tolerance of cell proliferation to high ethanol levels.
ADE1 encodes a N-succinyl-5-aminoimidazole-4-carboxamide
ribotide (SAICAR) synthetase, that is required for de novo purine
biosynthesis [27]. ADE genes have not been connected previously
to ethanol tolerance, but they have been linked to high sugar
tolerance. In a genome-wide screen with the deletion strain
collection, Ando et al. [40] identified three adenine biosynthetic
genes (ADE5,7, ADE6 and ADE8) as being required for tolerance
to 30% (w/v) sucrose. These genes were not required for tolerance
to high sorbitol and NaCl, indicating a specific role in high sugar
tolerance. The ADE genes are involved in biosynthesis of purine
and derived metabolites, such as ATP. Measurements of the ATP
level revealed a reduction with two-fold in the ade mutants,
indicating that inability to synthesize sufficient ATP could be
related to the high sucrose stress sensitivity. Alternatively, in the ade
mutants the STRE-controlled stress response gene, HSP12, which
encodes a plasma membrane chaperone protein, was not induced
under high-sucrose stress, as opposed to sorbitol and salt stress
[40]. This suggests a possible defect in induction of stress
protection factors as cause for the high-sucrose sensitivity and
once more a specific role of ADE genes in high sugar stress.
Osmotic stress is known to trigger the HOG-pathway [41].
Phosphorylation of Hog1, the central component of the HOG
pathway, however, was normal under all three osmotic stress
conditions in all ade mutant strains, suggesting that deficiency of
the HOG pathway, or at least the osmosensing systems, was not
involved in the sensitivity of the ade mutants [40]. Because we
measured maximal ethanol accumulation in fermentations with a
very high sugar level (33%, w/v, glucose), the link with the
superior allele of ADE1 in QTL2 (chr I) may be due to its
importance for tolerance to high sugar stress. If this would be the
reason why the superior ADE1 allele of Seg5 supports higher
ethanol accumulation under VHG conditions, it would explain
why the ADE1 gene was not linked to ethanol tolerance of cell
proliferation as measured with pool 2, since the solid nutrient
plates contain a low sugar level and a high ethanol level. The
ADE1 gene from the superior parent Seg5 did not have any
mutation in the ORF compared to the sequence in the laboratory
Genetic Analysis of Ethanol Tolerance Traits
PLOS Genetics | www.plosgenetics.org 15 June 2013 | Volume 9 | Issue 6 | e1003548
strain BY. However, one SNP was located in the promoter region
of the Seg5 allele (Chr I: 169.228 bp - C/T). The promoter of
ADE1 is known to bear a hexanucleotide (59 TGACTC 39)
element that is under amino acid control [27]. Although the
mutation is not within that regulatory element, it is possible that it
is affecting ADE1 expression and thereby also high sugar tolerance.
In conclusion, our work has shown that successful QTL
mapping with pooled-segregant whole-genome sequence analysis
can be performed for traits of industrial importance, which require
elaborate experiments to score the phenotype, using a relatively
low number of segregants. We have identified for the first time
genes required for maximal ethanol accumulation capacity in the
absence of cell proliferation in fermenting yeast cells and have
shown that the genetic basis of this trait is partially different from
that of tolerance of cell proliferation to high ethanol levels. The
superior alleles identified can be used for improvement of maximal
ethanol accumulation capacity in industrial yeast strains for
bioethanol production and for the production of alcoholic
beverages. This improves attenuation of the sugar at the end of
the fermentation, which enhances yield in industrial bioethanol
production and reduces residual sugar levels in alcoholic
beverages. A higher final ethanol level in bioethanol production
reduces distillation costs and lowers the liquid volumes in the
plant, which in turn reduces costs associated with cooling, heating,
pumping and transport of liquid residue.
Materials and Methods
Strains and growth conditionsThe S. cerevisiae strains utilized in this study are listed in Table
S2. Yeast cells were grown with orbital agitation (200 rpm) at
30uC in YPD medium containing 1% (w/v) yeast extract, 2% (w/
v) Bacto peptone and 2% (w/v) glucose.
Small-scale VHG fermentations for determination ofmaximal ethanol accumulation capacity
VHG fermentations were performed in which the glucose
concentration was raised to such an extent (33% w/v) that a
maximal final ethanol level (17–18%) was obtained with only
minimal residual sugar left [17]. A further increase in glucose
concentration above this level reduced the maximal ethanol level
again. Cells were first pre-grown in 3 mL of YPD medium for
24 h (200 rpm, 30uC), after which 0.5 mL was transferred to
5 mL of YP+5% (w/v) glucose and the culture incubated for 24 h
(200 rpm, 30uC). Cells of the last pre-culture were inoculated in
100 mL of YP+10% (w/v) glucose with initial OD600 of 1.0. The
cells were grown for 2 days (200 rpm, 30uC) until stationary phase.
12.56109 cells, based on cell counting, were harvested. The cells
were centrifuged (3000 rpm, 5 min, 4uC), the pellet was
resuspended in 3 mL of YP and inoculated into 250 mL of
YP+33% (semi-static) or 35% (continuous stirring) (w/v) glucose.
The fermentations were performed at 25uC. Agitation was
performed with a magnetic rod (3066 mm) at 120 rpm (semi-
static, 4 h) or 200 rpm (continuous stirring). The fermentation was
followed by weighing the tubes and from the weight loss the
glucose leftover was calculated. Samples were taken at the end of
the fermentation for HPLC analysis and cell viability determina-
tion. The metabolites quantified by HPLC were glucose, glycerol
and acetic acid. The HPLC system utilized (Waters Breeze)
consisted of an ion-exclusion column (WAT010290) at 75uC and
detection was performed by refractive index (model 2414). The
eluent used was H2SO4 (5 mM) at a flow rate of 1.0 mL/min.
Samples of 10 mL were automatically injected and processed for
20 min. Ethanol was quantified by near infrared spectroscopy
(Alcolyzer, Anton Paar). Cell viability was assessed by oxonol
staining followed by flow cytometry analysis [42]. The ethanol
yield (g of ethanol produced per g of glucose consumed) was
calculated by dividing the ethanol produced with the glucose
consumed (initial glucose concentration minus glucose leftover).
Ethanol tolerance assays of cell proliferation on solidmedia
The cells were pre-grown in YPD for 2 days (200 rpm, 30uC). The
OD600 was measured in triplicate and the cells were diluted to an
initial OD600 of 0.5. Four serial dilutions were made (1021, 1022,
1023 and 1024). A volume of 4 mL was spotted on plates: YPD
(control), YPD+16% (v/v) ethanol, YP+16% (v/v) ethanol, YPD+18%
(v/v) ethanol, YP+18% (v/v) ethanol and YPD+20% (v/v) ethanol.
The plates were incubated at 30uC for up to 11 days and growth was
scored from the second day on. The ethanol levels indicated are initial
ethanol levels. During the preparation and incubation of the plates
some ethanol may evaporate. Therefore, sample and control strains
were always put together on the same plates.
Sporulation and tetrad dissectionGeneral procedures for sporulation and tetrad dissection were
used [43].
Determination of mating typeA small amount of cells (1.5 mg) was incubated with 10 mL of
NaOH (0.02N) for 1 h (RT). The determination of the mating
type was done by PCR with the primers for the MAT locus and
MATa and MATa (alpha) DNA [44]. The 3 primers were used
together.
Genomic DNA extraction and whole-genome sequenceanalysis
Preparation of the DNA pools from the segregants was done
either by (1) individual genomic DNA extraction and pooling of
the DNA in equimolar concentrations; (2) mixing of the cells,
based on dry weight, prior to DNA extraction, or (3) mixing of the
cells based on OD600, prior to DNA extraction. For all
preparations, the genomic DNA was extracted according to
Johnston [45]. At least 3 mg of DNA per pool was provided for
whole-genome sequencing to both GATC Biotech GA (Konstanz,
Germany) and Beijing Genomics Institute (BGI, Hong Kong,
China). In both cases the sequencing was performed with the
Illumina platform and gave for most of the genome, and especially
in the QTL areas, very similar results. For both pools and at both
companies the sequencing depth was ,38 and the read length was
75 at GATC Biotech and 90 at BGI.
Bioinformatics analysis and confirmation of QTLsAssembly and mapping were done with DNAstar Lasergene
software. Smoothing of the sequencing data was performed with a
Linearized Mixed Model (LMM) framework [5,22]. We imple-
mented a Hidden Markov Model (HMM) to identify regions
related with the phenotypes similar to the one implemented in the
FastPHASE package [25]. For each variant, the HMM has three
possible states: (i) relation with the superior parent, (ii) relation with
the control parent and (iii) no relation (background). To capture
the effect of recombination, the transition between two states of
the same type is the probability of no recombination and the
probability of the transition between two states of different type is
the probability of recombination divided by two. We estimated the
probability of recombination for each pair of neighbor variants
using a negative exponential relation with the physical distance as
Genetic Analysis of Ethanol Tolerance Traits
PLOS Genetics | www.plosgenetics.org 16 June 2013 | Volume 9 | Issue 6 | e1003548
in [25]. The emission of each state is the number of calls of the
alternative allele which is an integer between zero and ni, where ni
is the total number of allele calls for the variant i. We used beta-
binomial distributions for all states to take into account the fact
that given the finite number of segregants, the contribution of each
parent to the pool is not exactly half. For the superior parent states
we setup a= 10 and b= 1. For the control parent states we set
a= 1 and b= 10. For the background states we estimated a and busing the alternative allele frequencies in all sites. We checked that
for the background distribution a<b.1, which makes the
background distribution to be close to a binomial with probability
0.5 (as expected). We used the forward-backward algorithm to
calculate the posterior probability of each state given the allele
counts for each dataset. A manuscript with a complete explanation
of the algorithm and comparisons with currently available
methods is in preparation. The QTLs detected were further
analyzed by scoring SNPs in the segregants individually using
allele-specific primer sets, which were rigorously tested for
reliability with the two variants of each SNP in the parent strains
and all segregants. Statistically significant QTLs were confirmed
by multiple testing using a false discovery rate (FDR) control [46].
Molecular Biology methodsYeast cells were transformed with the LiAc/SS-DNA/PEG
method [47]. Genomic DNA was extracted with PCI [phenol/
chlroform/isoamyl-alcohol (25:24:1)] [48]. Polymerase chain
reaction (PCR) was performed with Accuprime polymerase
(Invitrogen) for sequencing purposes and ExTaq (Takara) for
diagnostic purposes. Sanger sequencing was performed by the
Genetic Service Facility of the VIB. The detection of SNPs by
PCR was performed as previously described [5].
Reciprocal hemizygosity analysis (RHA)RHA was performed as described previously [5,10] in the
diploid Seg5/BY710 genetic background. In addition to single
gene deletions we also performed large deletions (bulk RHA) of
regions up to 27 kb long. The selection marker utilized was the
amidase gene (AMD1), which was amplified from the vector pF6a-
AMD1-MX6. The gene AMD1 was cloned from Z. rouxii [49]. The
primers utilized in the AMD1 amplification had at least 80 extra
bases that corresponded to the flanking regions of the area to be
deleted. The transformants were selected on solid YCB +acetamide 10 mM (yeast carbon base 11.7 g/L; sodium phosphate
buffer 0.03 M; agar 20 g/L). The correct integration of the
constructs was checked by PCR, using one primer that annealed
within AMD1 and two other primers that annealed either
downstream or upstream of the deleted region. The PCR products
were sequenced and the polymorphisms (SNPs and indels) present
in the regions flanking the selection marker were identified when
the Seg5 allele was replaced by AMD1. On the other hand, when
the laboratory allele was deleted, no polymorphism was detected
by Sanger sequencing. Double allele deletion was not observed
during the bulk RHA because the deleted regions contained at
least one essential gene.
Reproducibility and statistical analysisThe fermentations with different yeast strains were done with
the reference strain V1116 as a control in duplicate. The most
interesting strains were repeated at least once. The fermentations
with different meiotic segregants were done with the reference
strains Seg5, BY710 and Seg5/BY710. The segregants showing
more than 16.5% (v/v) ethanol production were evaluated by
fermentation at least once more. The fermentations for RHA were
done in triplicate. The results were analyzed with a paired t-test
(p,0.01, except for the comparison of V1116 and CBS1585 for
which p,0.05 was used).
Data accessAll sequence data have been deposited in the Sequence Read
Archive (SRA) at the National Center for Biotechnology
Information (NCBI) and can be accessed with account number
SRA056812.
Supporting Information
Table S1 Maximal ethanol accumulation capacity and ethanol
tolerance of cell proliferation. Screening of 68 yeast strains in
small-scale fermentations for maximal ethanol accumulation
(250 mL YP+33% glucose). Ethanol production is shown in
comparison to the robust wine strain V1116 and the strains are
listed in descending order of performance. The final ethanol titer
(%, v/v), glycerol level (g/L) and ethanol yield (%) are also
indicated for each strain. The strains were either evaluated once,
twice (*), three times (**) or six times (***). {Ethanol yield is
expressed as percentage of the maximum theoretical ethanol yield
(0.51 g ethanol/g glucose consumed). Ethanol tolerance of cell
proliferation was measured in YPD agar plates with the indicated
concentrations of ethanol. The indicated score is the number of
dilutions in which the strains grew (maximum = 4).
(DOC)
Table S2 Saccharomyces cerevisiae strains utilized in this study.
(DOC)
Acknowledgments
We wish to thank Mekonnen Demeke, Ben Souffriau, and all other
members of the Genetic Analysis Group for stimulating discussions, Paul
Vandecruys for technical support and Nico Vangoethem for preparation of
the figures and informatics support. We thank Prof. P. Piper for providing
the pFA6a-AMD1-MX6 plasmid.
Author Contributions
Conceived and designed the experiments: TMP MRF-M FD JMT.
Performed the experiments: TMP YY. Analyzed the data: TMP MRF-M
GH SS AG YY FD JMT. Contributed reagents/materials/analysis tools:
JD. Wrote the paper: TMP FD JMT.
References
1. Casey GP, Ingledew WM (1986) Ethanol tolerance in yeasts. Crit Rev Microbiol
13: 219–280.
2. D’Amore T, Stewart GG (1987) Ethanol tolerance of yeast. Enzyme and
Microbial Technology 9: 322–330.
3. Rozpedowska E, Hellborg L, Ishchuk OP, Orhan F, Galafassi S, et al. (2011)
Parallel evolution of the make-accumulate-consume strategy in Saccharomyces and
Dekkera yeasts. Nat Commun 2: 302.
4. Ding J, Huang X, Zhang L, Zhao N, Yang D, et al. (2009) Tolerance and stress
response to ethanol in the yeast Saccharomyces cerevisiae. Appl Microbiol Biotechnol
85: 253–263.
5. Swinnen S, Schaerlaekens K, Pais T, Claesen J, Hubmann G, et al. (2012)
Identification of novel causative genes determining the complex trait of high
ethanol tolerance in yeast using pooled-segregant whole-genome sequence
analysis. Genome Res 22: 975–984.
Genetic Analysis of Ethanol Tolerance Traits
PLOS Genetics | www.plosgenetics.org 17 June 2013 | Volume 9 | Issue 6 | e1003548
6. Liti G, Louis EJ (2012) Advances in quantitative trait analysis in yeast. PLoS
Genet 8: e1002912.7. Swinnen S, Thevelein JM, Nevoigt E (2012) Genetic mapping of quantitative
phenotypic traits in Saccharomyces cerevisiae. FEMS Yeast Res 12: 215–227.
8. Ehrenreich IM, Torabi N, Jia Y, Kent J, Martis S, et al. (2010) Dissection ofgenetically complex traits with extremely large pools of yeast segregants. Nature
464: 1039–1042.9. Parts L, Cubillos FA, Warringer J, Jain K, Salinas F, et al. (2011) Revealing the
genetic structure of a trait by sequencing a population under selection. Genome
Res 21: 1131–1138.10. Steinmetz LM, Sinha H, Richards DR, Spiegelman JI, Oefner PJ, et al. (2002)
Dissecting the architecture of a quantitative trait locus in yeast. Nature 416: 326–330.
11. Winzeler EA, Richards DR, Conway AR, Goldstein AL, Kalman S, et al. (1998)Direct allelic variation scanning of the yeast genome. Science 281: 1194–1197.
12. Deutschbauer AM, Davis RW (2005) Quantitative trait loci mapped to single-
nucleotide resolution in yeast. Nat Genet 37: 1333–1340.13. Brem RB, Yvert G, Clinton R, Kruglyak L (2002) Genetic dissection of
transcriptional regulation in budding yeast. Science 296: 752–755.14. Marullo P, Aigle M, Bely M, Masneuf-Pomarede I, Durrens P, et al. (2007)
Single QTL mapping and nucleotide-level resolution of a physiologic trait in
wine Saccharomyces cerevisiae strains. FEMS Yeast Res 7: 941–952.15. Nogami S, Ohya Y, Yvert G (2007) Genetic complexity and quantitative trait
loci mapping of yeast morphological traits. PLoS Genet 3: e31.16. Perlstein EO, Ruderfer DM, Roberts DC, Schreiber SL, Kruglyak L (2007)
Genetic basis of individual differences in the response to small-molecule drugs inyeast. Nat Genet 39: 496–502.
17. Puligundia P, Smogrovicova D, Obulam VSR, Ko S (2011) Very high gravity
(VHG) ethanolic brewing and fermentation: a research update. J Ind MicrobiolBiotechnol 38: 1133–1144.
18. Albers E, Larsson C (2009) A comparison of stress tolerance in YPD andindustrial lignocellulose-based medium among industrial and laboratory yeast
strains. J Ind Microbiol Biotechnol 36: 1085–1091.
19. Basso TO, Dario MG, Tonso A, Stambuk BU, Gombert AK (2010) Insufficienturacil supply in fully aerobic chemostat cultures of Saccharomyces cerevisiae leads to
respiro-fermentative metabolism and double nutrient-limitation. Biotechnol Lett32: 973–977.
20. Watanabe M, Watanabe D, Akao T, Shimoi H (2009) Overexpression of MSN2
in a sake yeast strain promotes ethanol tolerance and increases ethanol
production in sake brewing. J Biosci Bioeng 107: 516–518.
21. Kodama K (1993) Sake-brewing yeast. In: Rose AH, Harrison JS, editors. Theyeasts. London, United Kingdom: Academic Press. pp. 129–168.
22. Claesen J, Clement L, Shkedy Z, Foulquie-Moreno MR, Burzykowski T (2013)Simultaneous mapping of multiple gene loci with pooled segregants. PLoS ONE
8(2): e55133. doi:10.1371/journal.pone.0055133.
23. Dohm JC, Lottaz C, Borodina T, Himmelbauer H (2008) Substantial biases inultra-short read data sets from high-throughput DNA sequencing. Nucleic Acids
Res 36: e105.24. Akao T, Yashiro I, Hosoyama A, Kitagaki H, Horikawa H, et al. (2011) Whole-
genome sequencing of sake yeast Saccharomyces cerevisiae Kyokai no. 7. DNA Res18: 423–434.
25. Scheet P, Stephens M (2006) A fast and flexible statistical model for large-scale
population genotype data: applications to inferring missing genotypes andhaplotypic phase. Am J Hum Genet 78: 629–644.
26. Cullen PJ, Sprague GF, Jr. (2002) The Glc7p-interacting protein Bud14pattenuates polarized growth, pheromone response, and filamentous growth in
Saccharomyces cerevisiae. Eukaryot Cell 1: 884–894.
27. Myasnikov AN, Sasnauskas KV, Janulaitis AA, Smirnov MN (1991) TheSaccharomyces cerevisiae ADE1 gene: structure, overexpression and possible
regulation by general amino acid control. Gene 109: 143–147.
28. Moura DJ, Castilhos B, Immich BF, Canedo AD, Henriques JA, et al. (2010)
Kin3 protein, a NIMA-related kinase of Saccharomyces cerevisiae, is involved in
DNA adduct damage response. Cell Cycle 9: 2220–2229.
29. Bardin AJ, Boselli MG, Amon A (2003) Mitotic exit regulation through distinct
domains within the protein kinase Cdc15. Mol Cell Biol 23: 5018–5030.
30. Ristow H, Seyfarth A, Lochmann ER (1995) Chromosomal damages by ethanol
and acetaldehyde in Saccharomyces cerevisiae as studied by pulsed field gel
electrophoresis. Mutat Res 326: 165–170.
31. Kitagaki H, Araki Y, Funato K, Shimoi H (2007) Ethanol-induced death in yeast
exhibits features of apoptosis mediated by mitochondrial fission pathway. FEBS
Lett 581: 2935–2942.
32. Ibeas JI, Jimenez J (1997) Mitochondrial DNA loss caused by ethanol in
Saccharomyces flor yeasts. Appl Environ Microbiol 63: 7–12.
33. Kido R, Sato I, Tsuda S (2006) Detection of in vivo DNA damage induced by
ethanol in multiple organs of pregnant mice using the alkaline single cell gel
electrophoresis (Comet) assay. J Vet Med Sci 68: 41–47.
34. Brooks PJ (1997) DNA damage, DNA repair, and alcohol toxicity–a review.
Alcohol Clin Exp Res 21: 1073–1082.
35. Umezu K, Amaya T, Yoshimoto A, Tomita K (1971) Purification and properties
of orotidine-59-phosphate pyrophosphorylase and orotidine-59-phosphate de-
carboxylase from baker’s yeast. J Biochem 70: 249–262.
36. Miller BG, Hassell AM, Wolfenden R, Milburn MV, Short SA (2000) Anatomy
of a proficient enzyme: the structure of orotidine 59-monophosphate decarbox-
ylase in the presence and absence of a potential transition state analog. Proc Natl
Acad Sci U S A 97: 2011–2016.
37. Eddy AA, Hopkins P (1998) Proton stoichiometry of the overexpressed uracil
symport of the yeast Saccharomyces cerevisiae. Biochem J 336 (Pt 1): 125–130.
38. Volland C, Urban-Grimal D, Geraud G, Haguenauer-Tsapis R (1994)
Endocytosis and degradation of the yeast uracil permease under adverse
conditions. J Biol Chem 269: 9833–9841.
39. Ferreras JM, Iglesias R, Girbes T (1989) Effect of the chronic ethanol action on
the activity of the general amino-acid permease from Saccharomyces cerevisiae var.
ellipsoideus. Biochim Biophys Acta 979: 375–377.
40. Ando A, Tanaka F, Murata Y, Takagi H, Shima J (2006) Identification and
classification of genes required for tolerance to high-sucrose stress revealed by
genome-wide screening of Saccharomyces cerevisiae. FEMS Yeast Res 6: 249–267.
41. Hohmann S (2002) Osmotic stress signaling and osmoadaptation in yeasts.
Microbiol Mol Biol Rev 66: 300–372.
42. Boyd AR, Gunasekera TS, Attfield PV, Simic K, Vincent SF, et al. (2003) A
flow-cytometric method for determination of yeast viability and cell number in a
brewery. FEMS Yeast Res 3: 11–16.
43. Sherman F, Hicks J (1991) Micromanipulation and dissection of asci. Methods
Enzymol 194: 21–37.
44. Huxley C, Green ED, Dunham I (1990) Rapid assessment of S. cerevisiae mating
type by PCR. Trends Genet 6: 236.
45. Johnston JR, editor (1994) Molecular genetics of yeast: a practical approach.
New York: Oxford University Press.
46. Benjamini Y, Yekutieli D (2005) Quantitative trait Loci analysis using the false
discovery rate. Genetics 171: 783–790.
47. Gietz RD, Schiestl RH, Willems AR, Woods RA (1995) Studies on the
transformation of intact yeast cells by the LiAc/SS-DNA/PEG procedure. Yeast
11: 355–360.
48. Hoffman CS, Winston F (1987) A ten-minute DNA preparation from yeast
efficiently releases autonomous plasmids for transformation of Escherichia coli.
Gene 57: 267–272.
49. Shepherd A, Piper PW (2010) The Fps1p aquaglyceroporin facilitates the use of
small aliphatic amides as a nitrogen source by amidase-expressing yeasts. FEMS
Yeast Res 10: 527–534.
Genetic Analysis of Ethanol Tolerance Traits
PLOS Genetics | www.plosgenetics.org 18 June 2013 | Volume 9 | Issue 6 | e1003548