Comparative Political Studies - arjanschakel.nl · Comparative Political Studies 2013 46: 631...
33
http://cps.sagepub.com/ Comparative Political Studies http://cps.sagepub.com/content/46/5/631 The online version of this article can be found at: DOI: 10.1177/0010414011424112 October 2011 2013 46: 631 originally published online 18 Comparative Political Studies Arjan H. Schakel Congruence Between Regional and National Elections Published by: http://www.sagepublications.com can be found at: Comparative Political Studies Additional services and information for http://cps.sagepub.com/cgi/alerts Email Alerts: http://cps.sagepub.com/subscriptions Subscriptions: http://www.sagepub.com/journalsReprints.nav Reprints: http://www.sagepub.com/journalsPermissions.nav Permissions: What is This? - Oct 18, 2011 OnlineFirst Version of Record - Apr 23, 2013 Version of Record >> at Maastricht University on April 29, 2014 cps.sagepub.com Downloaded from at Maastricht University on April 29, 2014 cps.sagepub.com Downloaded from
Transcript of Comparative Political Studies - arjanschakel.nl · Comparative Political Studies 2013 46: 631...
http://cps.sagepub.com/Comparative Political Studies
http://cps.sagepub.com/content/46/5/631The online version of this article can be found at:
DOI: 10.1177/0010414011424112
October 2011 2013 46: 631 originally published online 18Comparative Political Studies
Arjan H. SchakelCongruence Between Regional and National Elections
Published by:
http://www.sagepublications.com
can be found at:Comparative Political StudiesAdditional services and information for
http://cps.sagepub.com/cgi/alertsEmail Alerts:
http://cps.sagepub.com/subscriptionsSubscriptions:
http://www.sagepub.com/journalsReprints.navReprints:
http://www.sagepub.com/journalsPermissions.navPermissions:
What is This?
- Oct 18, 2011 OnlineFirst Version of Record
- Apr 23, 2013Version of Record >>
at Maastricht University on April 29, 2014cps.sagepub.comDownloaded from at Maastricht University on April 29, 2014cps.sagepub.comDownloaded from
Comparative Political Studies46(5) 631 –662© The Author(s) 2011Reprints and permissions:sagepub.com/journalsPermissions.navDOI: 10.1177/0010414011424112cps.sagepub.com
424112 CPS
1Maastricht University, Maastricht, Netherlands
Corresponding Author:Arjan H. Schakel, Department of Political Science, Faculty of Arts and Social Science, Maastricht University, PO Box 616, 6200 MD Maastricht, Netherlands. Email: [email protected]
Congruence Between Regional and National Elections
Arjan H. Schakel1
Abstract
The number of regional elections and what is at stake at these elections have increased considerably over the past decades. Yet the interpretation of regional election results lags behind, in particular explanations for when and how regional election results deviate from national election results. This article conceptualizes congruence of the vote in three different ways that make it possible to assess the contribution of three competing theoreti-cal approaches in explaining variation in dissimilarity between vote shares across space and time. These approaches are second-order election theo-ry, regional authority and territorial cleavages. The hypotheses are tested against a data set containing the results of more than 4,000 regional and na-tional elections held in 360 regions in 18 countries. It appears that the depth of territorial cleavages explains variation across space, but to understand change over time one needs to consider institutional authority and second-order election effects.
Keywords
regional election, second-order election, regional authority, territorial cleavages
at Maastricht University on April 29, 2014cps.sagepub.comDownloaded from
632 Comparative Political Studies 46(5)
Regional elections are on the rise. The number of regional elections has increased significantly over the past decades. Denmark, France, Sweden, and Norway have introduced regional council elections, Australia and Canada launched elections in the Territories, Germany and Italy have extended regional elections to, respectively, the eastern German Länder and the ordi-nary statute regions, and, more recently, Belgium has held elections for the Gewesten since 1995 and the United Kingdom has devolved elections in Scotland and Wales since 1999. The proliferation of regional elections is not of a strictly quantitative nature; what is at stake in regional elections has increased as well. For example, the policy scope and fiscal capacities have increased for todofuken in Japan, Acores and Madeira in Portugal, and the comunidades autonomás in Spain.
Despite the increased prominence and importance of regional elections, there are only a few comparative studies on multilevel electoral behavior. What’s more, those sparse comparative contributions tend to be restricted in their theoretical scope or in the number of cases. For example, Hearl, Budge, and Pearson (1996) focus on territorial heterogeneity, and although Thorlakson (2007) includes regional institutional variables, her analysis remains restricted to six federations. Jeffery and Hough (2009) consider second-order election effects next to territorial cleavages and institutional power, but their case selection comprises Spain, Germany, and Canada only.
The aim of this article is to explain differences between regional and national vote shares. This article takes a comprehensive approach with respect to three aspects. First is the theoretical scope, which includes three approaches to explain congruence of the vote. These are second-order elec-tion theory, territorial cleavage theory, and institutional power. Second is the methodology; congruence of the vote is conceptualized in three different ways, and suitable statistical techniques are applied to tease out variation across space and time. Third is the universe of cases analyzed; the explana-tory value of the three approaches is evaluated against a data set containing the electoral results of almost 4,400 regional and national elections held in 360 regions and 18 countries for the period 1945–2009.
The analyses show that all three approaches matter significantly for explaining congruence of the vote. The depth of territorial cleavages matters mostly for explaining cross-sectional differences, whereas second-order elec-tion theory and institutional authority can explain change over time. The main conclusion is that to fully grasp differences between national and regional vote shares, one needs to analyze different conceptualizations of congruence of the vote and apply suitable statistical techniques.
at Maastricht University on April 29, 2014cps.sagepub.comDownloaded from
Schakel 633
In the next section, I describe three different conceptualizations of congru-ence of the vote. In the subsequent section I explain how second-order elec-tion characteristics, territorial cleavages, and regional authority may affect dissimilarity between vote shares. The fourth section describes the cases, variables, and method, and the fifth section discusses the results. The final section concludes.
Conceptualizing Congruence of the VoteIn this article I am interested in differences between vote shares of regional and statewide elections. In the literature this is often referred to as congru-ence of the vote. Congruence is nonexistent when no single party competes in regional as well as general elections. The other extreme is complete con-gruence, which occurs when the same parties compete in both general and regional elections and obtain exactly equal vote shares. Congruence is often measured by a dissimilarity index, which subtracts vote shares of the same party participating in different elections, takes absolute values, subsequently sums them over parties, and then divides the sum by two. Dissimilarity (DIS) is calculated as follows (Jeffery & Hough, 2009; Johnston, 1980; Pallares & Keating, 2003),
Dissimilarity X XiN iRi
n
= −=∑12 1
| |
in which XiN
is the percentage of the vote won by party i in a given general/national election N, and X
iR is the percentage of the vote won by party i in the
closest (in time) subnational/regional election to the general election in ques-tion, R. The absolute values are summed and divided by two to avoid double counting. Scores may vary from complete congruence or similarity (0%) to complete incongruence or dissimilarity (100%).
However, an often overlooked interesting aspect of the dissimilarity index is that we may vary the comparison with respect to the type of election or vote share – that is, general elections or subnational elections – in conjunc-tion with the territorial unit of analysis – that is, country/statewide level or regional level. For instance, we may compare the national party system at the statewide level (NN) with the regional or general election results in a particu-lar region (RR or NR). Also, we may compare the general vote with the regional vote in the same region (NN versus RR).
at Maastricht University on April 29, 2014cps.sagepub.comDownloaded from

634 Comparative Political Studies 46(5)
• Dissimilarity between the statewide and the regional party system (DIS1)
• Dissimilarity between the statewide vote for the country as a whole and the statewide election result for a particular region (DIS2)
• Dissimilarity between the statewide and regional vote for a particu-lar region (DIS3)
The different conceptualizations offer some important advantages in the exploration of congruence. DIS1 evaluates the extent to which a particular regional party system is different from the statewide party system and has two sources of variation: the extent to which a regional electorate is different from the statewide electorate combined with the extent to which the regional electorate switch their vote between regional and general elections. The regional election is compared to the general election and, at the same time, the statewide electorate is compared to the regional electorate. To tease out the two sources of variation, one needs to consider two additional conceptu-alizations of dissimilarity.
The extent to which a particular regional electorate is different from the statewide electorate is tapped by DIS2. The type of election is held constant, and one compares general election results for the whole country to the results for a particular region. The benefit of this conceptualization is that one does not have to consider second-order election effects because one uses first-order election results only. A possible drawback of this conceptualization is that it could lead to an underestimation of regional distinctiveness since it does not consider the effect of dual voting, that is, party systems may appear more congruent than they really are because statewide parties typically per-form better in general than in regional elections. In contrast, DIS3 evaluates the extent to which a regional electorate votes differently in general and regional elections. This conceptualization keeps the regional electorate con-stant but varies the type of election. A benefit is that the effects of dual voting are incorporated but one underestimates dissimilarity because regionally dis-tinct electorates may express their distinctiveness in both regional and gen-eral elections with low dissimilarity scores as a result.
Explaining Congruence of the VoteThree approaches are proposed in the literature to explain regional distinct voting patterns. The first approach concerns second-order election theory, which emphasizes the subordination of regional elections to first-order, national elections (Reif & Schmitt, 1980). A territorial cleavage approach
at Maastricht University on April 29, 2014cps.sagepub.comDownloaded from
Schakel 635
starts from a sociological standpoint and predicts that areas with distinct ter-ritorial identities will display dissimilar election results (Caramani, 2004; Rokkan & Urwin, 1983). A third theory focuses on decision-making powers and states that party systems become more differentiated or “provincialized” to the extent that subnational governments control resources that voters care about (Chhibber & Kollman, 2004). Each of the three theories is subse-quently dealt with in this section.
Second-Order Election TheoryPerhaps the most often used framework to study regional elections is the second-order model. The core claim of second-order election theory is that there is a hierarchy in perceived importance of different types of elections. National elections are of a first-order nature, and all other elections, such as European, subnational, and by-elections, are subordinate to first-order elec-tions. Because there is “less at stake” in second-order elections, voters turn out less, and those who show up at the ballot box are prompted to use their vote to vent their spleen about national-level politics (Reif & Schmitt, 1980). National parties in government tend to lose votes in second-order elections and opposition, small, and new parties tend to gain votes.
There are many proposed reasons why voters change their vote between first-order and second-order elections. Second-order elections may serve a means for the electorate to punish the party in government (Tufte, 1975), but regional elections could also been seen as “balancing” elections (Erikson & Filippov, 2001; Kern & Hainmüller, 2006) used by voters to counterbalance the power of the parties running national governments by favoring opposition parties at the regional level. Or voters may switch their vote because of tacti-cal reasons and vote for government parties only in federal elections (Marsh, 1998). Another reason may lie in lower turnout for second-order elections, which coincides with differences in the composition of the electorate because opposition and regional party voters are more likely to turn out “to make a point” than are government supporters to express their satisfaction (Jeffery & Hough, 2009).
The final verdict in this discussion may perhaps be solved by individual-level research only; however, whatever the cause of a voter changing his or her vote, the prediction at the aggregate level remains the same: less congru-ence of the vote. If lower turnout in regional elections means that opposition and regional party voters are overrepresented, then we would expect to observe larger vote shares for opposition and regional parties. Similarly, if voters are inclined to vote strategically in national but “sincerely” in regional
at Maastricht University on April 29, 2014cps.sagepub.comDownloaded from
636 Comparative Political Studies 46(5)
elections, then we would expect to observe larger vote shares for small and regional parties in regional elections.
Some authors argue that the extent of government party loss can be pre-dicted from the placement of the second-order election in the first-order elec-tion cycle, that is, vertical simultaneity. The further away a regional election takes place from a statewide election, the worse the government party will perform. This implies that government parties maximize their vote share if the election is taking place at the same time, at the beginning or the end of the general election cycle, and the maximum loss is incurred at midterm (Hix & Marsh, 2007; Jeffery & Hough, 2001, 2003; Marsh, 1998).
In addition, analyses on regional elections have also shown that the extent of second-order effects increases when second-order elections are held at the same date, that is, horizontal simultaneity (Schakel & Dandoy, 2010; Schakel & Jeffery, 2010). When regional elections are held at the same time, we may expect more involvement of candidates, media, and parties from the state-wide electoral arena. Under these circumstances regional elections gain a status of a “barometer” (Anderson & Ward, 1996) or “referendum” elections (Carsey & Wright, 1998; Simon, 1989; Simon, Osrom, & Marra, 1991), which attract opposition party supporters. As an effect, the “antigovernment swing” should be higher when regional elections are held simultaneously (Palazzolo, 2007).
Vertical and horizontal simultaneity share the same underlying logic, that is, increased second-order election effects to the extent that elections are held simultaneously. Therefore, one may expect to observe higher dissimilarity scores to the extent that a regional election is decoupled from the national and other regional election cycles. One may observe the lowest dissimilarity scores for vertical and horizontal simultaneous elections, somewhat higher dissimilarity scores for vertical nonsimultaneous but horizontal simultaneous elections, and the highest dissimilarity scores for vertical and horizontal non-simultaneous elections.
A final point on second-order election theory is that more recent research on European parliamentary elections has found that the extent to which vot-ers “punish” parties depends on the link between the vote and government formation or policy change (Hix & Marsh, 2007; Marsh, 1998). The classic assumption is that European Parliament elections are second order precisely because the composition of the national government is not what is at stake. However, in many European states, party systems are fragmented, multiparty coalitions are the norm, and some parties are more or less constant presences in national government. In these countries, voting in national elections can have little impact on the composition of national governments, and the
at Maastricht University on April 29, 2014cps.sagepub.comDownloaded from

Schakel 637
“relationship between elections and government formation is extremely opaque” (Marsh, 1998, p. 597). In contrast, second-order elections may be a common feature in bipolar systems where there is regular national govern-ment alternation (Reif, 1985). This has been confirmed in the case of regional elections (Schakel & Dandoy, 2010; Schakel & Jeffery, 2010). In sum, second-order election effects may be stronger and dissimilarity between vote shares should be higher in countries where there is a direct link between the (regional) vote and government formation.
Territorial CleavagesThe basis of territorial cleavage theory lies in sociological approaches that explain dissimilarity of party systems by the extent to which territorial cleav-ages are politicized (Lijphart, 1977; Livingston, 1956). Several scholars analyzing regional elections have observed that if substate elections are held in areas with distinctive territorial identities, voters are more likely to discon-nect themselves from the first-order arena and make different vote choices in the substate context (Jeffery & Hough, 2009). Territorial heterogeneity can be found with respect to an infinite number of dimensions, but most authors relate voting patterns to territorial cleavages with respect to ethnicity, lan-guage, religion, history, or economy (Lipset & Rokkan, 1967; Rokkan & Urwin, 1983; Van Houten, 2007).
Heterogeneity with respect to the economy deserves some more attention. Authors do not agree on the question whether economic deprivation or eco-nomic affluence leads to regional voting. Some authors consider regionalism as a reaction against “internal colonialism” and focus on the grievances of relatively poor peripheries exploited economically by the center (Hechter, 1975; Parks & Elcock, 2000). However, a competing thesis has been put for-ward by other authors (Gourevitch, 1979; Harvie, 1994), which sees regional-ism more likely to be stronger in relatively wealthy regions because, basically, the wealthy do not want to pay for the poor (Bolton & Roland, 1997).
Increased dissimilarity between vote shares may be expected when socio-logical differences are politicized by regional actors. Newman (1996) ascribes the tendency for ethnic differences to be politicized to “the rational desire [of social actors] to convert efficiently political resources into political power” (p. 7). Political actors adapt their demands and presentation to the concerns and language of regionally differentiated groups so as to maximize their influence on state policies.
In sum, a territorial cleavage approach predicts that the regional vote will be different from the national vote to the extent that regional voters have a
at Maastricht University on April 29, 2014cps.sagepub.comDownloaded from
638 Comparative Political Studies 46(5)
distinctive socioeconomic identity and, more so, to the extent that this dis-tinctive identity is mobilized by a regionalist party.
Regional AuthorityAnother assertion is that regional power is a key institutional variable capa-ble of influencing party strategy and political behavior. The regional level is an increasingly important site of competition as more policies are devolved to regional governments. Voters respond to the location of power in a general sense by directing their political demands to the most effective arena (Deschouwer, 2003; Thorlakson, 2007). When regional elections are more important contests, regional branches of statewide parties will have little incentive to maintain similar policies to party as a whole if this risks electoral disadvantage in the regional arena (Hough & Jeffery, 2006). In addition, under decentralization regional candidates have fewer pressures to join national parties because voters will know that regional governments make the important decisions (Chhibber & Kollman, 2004).
With decentralization of authority, party systems may decentralize as well because the transfer of powers increases opportunities for regional par-ties to thrive. Regional electoral arenas may be used for developing region-specific policies to “build” distinctive identities (Thorlakson, 2000, 2007). Regional public policies may shape the political goals of parties and interest groups, generate new policy demands, and provoke political opposition (Pierson, 1993). Also, parties may take an active role in the mobilization and promotion of issues to endogenously shape voter preferences (Przeworski & Sprague, 1986).
In conclusion, the regional authority hypothesis predicts that the regional vote will differ from the national vote according to the powers invested in regional government.
There are plenty of reasons to assume that the different explanations are interlinked. For example, the regional authority and territorial cleavage hypotheses may be connected in several ways. Several authors have observed a positive association between socially fragmented countries, on one hand, and decentralization and regional party strength, on the other (Amoretti & Bermeo, 2004; Arzaghi & Henderson, 2005; Treisman, 2007). A discon-nected regional and national party system and increasing regional authority may both be reflections of (the political mobilization of) territorial cleavages. In addition, regional authority may include the power for a region to time its own elections, which subsequently may introduce second-order election effects into the regional electoral arena.
at Maastricht University on April 29, 2014cps.sagepub.comDownloaded from
Schakel 639
Despite the linkage between the different explanations, it is still possible to evaluate the explanatory power of the different approaches. The different second-order election hypotheses may be fruitfully explored by conceptual-izing congruence as DIS3, which keeps the regional electorate constant and evaluates the extent of vote switching between general and regional elec-tions. In contrast, territorial cleavages may be explored by analyzing dissimi-larity conceptualized as DIS2, which focuses on differences between electorates. Finally, the relative contribution of the different variables may be observed when one thinks of congruence as DIS1, which takes into account variation in the type of election and electorate.
Variables, Cases, and MethodDependent Variable
As argued above, the vote shares that can be plugged into the dissimilarity index are the following:
• General electoral results at the statewide (country) level (Xigc
)• The vote share in a particular region for the general election (X
igr)
• The vote share in a particular region for the regional election (Xisr
)
Using these building blocks, we can operationalize congruence in the follow-ing ways:
• Dissimilarity between the statewide and the regional party system (DIS1 = NN minus RR)
• Dissimilarity between the statewide vote for country as a whole and the statewide election results for a particular region (DIS2 = NN minus NR)
• Dissimilarity between the statewide and regional votes for a particu-lar region (DIS1 = NR minus RR)
Independent VariablesSecond-order election theory. The hypotheses regarding turnout and strate-
gic or sincere voting are analyzed with the help of three difference variables. I use difference variables instead of level variables to avoid multicollinearity between the independent variables. The three variables are differences in turnout, in regional party vote shares, and in electoral systems. The turnout
at Maastricht University on April 29, 2014cps.sagepub.comDownloaded from
640 Comparative Political Studies 46(5)
difference variable is calculated by subtracting turnout for the regional elec-tion from turnout in the general election.
The regional party strength difference variable is similarly constructed by subtracting regional party vote share for the general election from those obtained in the regional election. A regional party is defined as a party that obtains all votes in one region only (Brancati, 2008). The difference variable is operationalized in the same manner as our dependent variable. For exam-ple, the regional party vote share at the statewide level is subtracted from the result for a particular regional election when DIS1 dissimilarity scores (state-wide vs. regional party systems) are analyzed.
The extent to which voters vote strategically may also result from elec-toral system characteristics, and I accommodate this by including an electoral system difference variable. Plurality and majoritarian electoral systems tend to produce small party systems, whereas proportional systems often lead to larger party systems. Majoritarian and plurality electoral systems score 0, proportional representation systems score 1, and mixed systems score 0.5. The difference variable is obtained by subtracting the score for the national electoral system from the score for the regional electoral system. Data for the difference variables are obtained from Golder (2005) and Schakel (in press).
Electoral cycle effects are measured by three variables. Second-order election theory expects that government parties lose in regional elections, and this loss is highest at midterm in the general election cycle. To assess this quadratic function, two variables are introduced (Hix & Marsh, 2007; Marsh, 1998). A variable labeled “cycle” indicates the timing of the regional election in the general election cycle. This variable is operationalized by dividing the number of days between the regional and the previous general election by the number of days in a complete general election cycle (4 years in most coun-tries). The second variable is obtained by squaring the cycle variable (after standardizing the cycle variable to avoid multicollinearity). In the case of the United States, presidential elections are used as general elections. The third variable, horizontal simultaneity, is operationalized as the number of regions that hold their elections at the same date as a proportion of the total number of regions in a country.
Territorial cleavages. Five variables capture territorial heterogeneity in eth-nicity, religion, history, language, and economy. Two variables vary at the country level (fragmentation indices), and three variables vary at the regional level (region indices).
Ethnic and religious fragmentation are operationalized as the probability that two randomly selected individuals belong to a different ethnic group or
at Maastricht University on April 29, 2014cps.sagepub.comDownloaded from
Schakel 641
have a different religion (Alesina, Devleeschauwer, Eaterly, Kurlat, & Wacziarg, 2003).
Regions with a distinct history and/or language are measured by a regional language and history index (Fitjar, 2010). The language index is made up of the following items, with one point awarded for each item: there is an indig-enous regional language that is different from the dominant (plurality) lan-guage in the state, the regional language is spoken by at least half the region’s population, and the language is not the dominant language of any state.
The history index captures the extent to which the region itself or other states than the current sovereign have governed the territory. The index is made up of the following three criteria, with one point awarded for each: the region has not been part of the current state since its formation, the region was not part of the current state for the entire 20th century, and the region has been an independent state. Data for regions within Europe are taken from Fitjar (2010) and are extended to Australia, Canada, Japan, and Switzerland (Bosworth, Van Donzel, Lewis, & Pellat, 1986; Encyclopædia Britannica, 2010; Lewis, 2009).
The regional economy index measures relative affluence of a region. The index indicates regional deviation in GDP per capita with respect to the coun-try average, which is set at 100%. Scores greater than 100% indicate that regions are richer than average, whereas scores less than 100% mean that regions are poorer than average. Data are obtained from EUROSTAT (1983–1997, 2011) and are supplemented with Organisation for Economic Co-operation and Development (2011) data for Australia, Canada, Japan, Norway, and the United States. The covered time period is rather limited, but, nevertheless, all countries are covered except Switzerland, for the late 1990s and early 2000s. To test the hypotheses with regard to economic heterogeneity, I test several mod-els. Models that introduce the regional economy index and regional economy index squared (after standardizing) assess whether there is a quadratic relation-ship between economic affluence and congruence of the vote. Another set of models include a regional economy index only but run the model for cases equal to or less than 100% and equal to or greater than 100%. The latter models test whether there is a relationship between regional economy and dissimilarity between vote shares for nonaffluent or affluent regions, respectively.
Regional authority. Regional authority is indicated by the regional authority index proposed by Hooghe, Marks, and Schakel (2010). This measurement distinguishes between self-rule—authority exercised by a regional govern-ment over those who live in the region—and shared rule—authority exer-cised by a regional government or its representatives in the country as a
at Maastricht University on April 29, 2014cps.sagepub.comDownloaded from
642 Comparative Political Studies 46(5)
whole. Self-rule and shared rule are operationalized according to the follow-ing eight dimensions.
Self-rule is the sum of the following four dimensions:
• Institutional depth: the extent to which a regional government is autonomous rather than deconcentrated (0–3)
• Policy scope: the range of policies for which a regional government is responsible (0–4)
• Fiscal autonomy: the extent to which a regional government can independently tax its population (0–4)
• Representation: the extent to which a region is endowed with an independent legislature and executive (0–4)
Shared rule is the sum of the following four dimensions:
• Law making: the extent to which regional representatives codeter-mine national legislation (0–2)
• Executive control: the extent to which a regional government code-termines national policy in intergovernmental meetings (0–2)
• Fiscal control: the extent to which regional representatives codeter-mine the distribution of national tax revenues
• Constitutional reform: the extent to which regional representatives codetermine constitutional change (0–3)
Control VariablesIn most countries, large regions elect more representatives in parliaments than small regions and exhibit less dissimilarity. Therefore, I include the number of regional votes relative to the total, statewide number of votes. Presidentialism is often associated with smaller party systems, which may lead to smaller dif-ferences between regional and national vote shares. I include a dummy vari-able to account for the presidential office in France and the United States. Descriptive statistics for the variables can be found in the appendix.
CasesI follow the conceptualization of a region given by Hooghe et al. (2010) to establish congruence with the regional authority variables. They define the region as “a coherent territorial entity situated between the local and national levels with a capacity for authoritative decision making” (p. 4). The highest
at Maastricht University on April 29, 2014cps.sagepub.comDownloaded from
Schakel 643
tier below the national level is included when it holds elections and has an average population greater than 150,000. Table 1 introduces the countries, regions, and elections included in this study. The analysis includes about 4,400 regional election results for 360 regions in 18 countries for the post–World War II period.
MethodThe data reflect typical cross-time cross-section series. I use panel-corrected standard errors (PCSEs) while controlling for autocorrelation (Beck & Katz, 1995). However, most of the proposed independent variables are time invari-ant (territorial cleavage variables) or rarely changing variables (regional authority), which complicate dynamic analysis. Therefore, results of a three-stage estimation technique, called fixed-effects vector decomposition, with a first-order control for autocorrelation, are reported as well (Plümper & Troeger, 2007).
I present the results for all three estimation techniques because each esti-mation technique has benefits and drawbacks. The fixed-effects approach uses a Cochrane–Orcutt transformation to control for autocorrelation whereby the first observation is lost. The multilevel mixed-effects linear regression model leaves the random-effects portions assigned to the country and region levels largely unexplained, which may result in an underestimation of the contribution of time-invariant and rarely changing variables. A benefit of the method is that it gives due weight to within-region variation. The PCSE framework, finally, uses a Prais–Winsten transformation to control for auto-correlation that retains the first observation, but one cannot control for the fact that regions are clustered within countries.
Finally, several authors propose including a lagged dependent variable in the models to deal with dynamics over time (Beck & Katz, 1995; Plümper & Troeger, 2007). I have done this for all models presented below, and the results (not shown) remain robust.
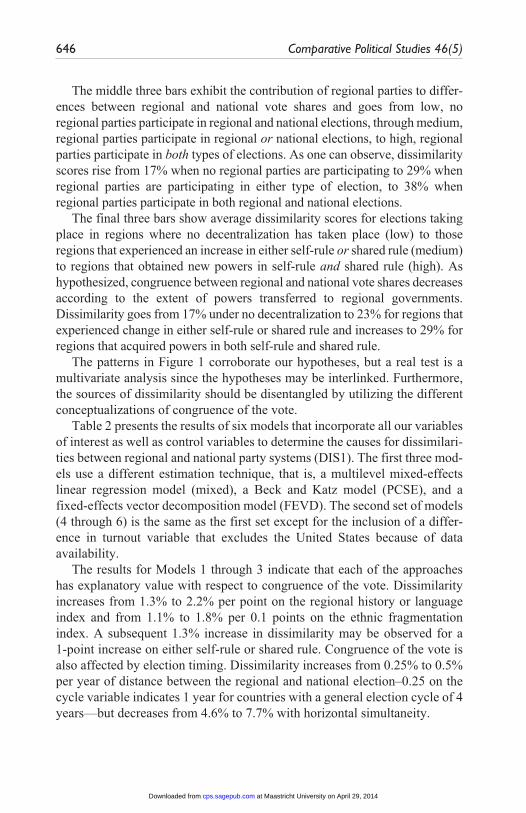
ResultsFigure 1 explores aggregate scores for dissimilarity between national and regional party systems (DIS1). Figure 1 displays average dissimilarity scores and their 95% confidence intervals for different groups of elections.
The first three bars refer to the degree of “second-orderness” of regional elections, which varies from low (left) to high (right). Above it was hypoth-esized that the antigovernment swing in regional elections should be small
at Maastricht University on April 29, 2014cps.sagepub.comDownloaded from

644 Comparative Political Studies 46(5)
Table 1. Countries, Regions, and Elections Covered.
Country Regions n
Election period
First Last
Australia States 6 1946 2008 Territories 2 1974 2008Austria Länder 9 1945 2009Belgium Gemeenschappen/Gewesten 4 1974 2007Canada Provinces 10 1943 2009 Yukon 1 1978 2006Denmark Amter 14 1974 2001 Region 5 2005 2005France Région 22 1986 2004Germany Länder 16 1947 2009Greece Nomoi 49 1994 2006Italy Regioni a statuto speciale 5 1947 2009 Regioni a statuto ordinare 15 1970 2005Japan Todofuken 47 1965 2007Netherlands Provincie 12 1946 2007Norway Fylker 19 1975 2007Portugal Acores and Madeira 2 1976 2008Spain Comunidades autónomas 19 1980 2009Sweden Län 24 1973 2006Switzerland Cantons 24 1945 2009United Kingdom Scotland, Wales, and London 3 1999 2007United States States 50 1968 2003 Washington, D.C. 1 1994 2002
Source: Schakel (in press).The following regions have a different year for the first election: Australia: Northern Territory as of 1974 and Australian Capital Territory as of 1989; Belgium: Deutsche Gemeinschaft as of 1974, Bruxelles as of 1989, and Vlaams Gewest and Communataire francaise as of 1995; Germany: six eastern German Länder as of 1990; Italy: Friuli-Venezia-Giulia as of 1964; Netherlands: Flevoland as of 1987; Spain: Ceuta and Mellila as of 1995; Switzerland: Jura as of 1978. The following regions have been excluded because their party system is (almost) completely different from that of the statewide electoral arena (i.e., dissimilarity scores of 100%): Northern Territory and Nunavut (Canada); Faroe Islands and Greenland (Denmark); Åland (Finland); Northern Ireland (United Kingdom). The 1982, 1983, and 1992 elections for Corse in France, the elections in Appenzell Ausser Rhoden, Appenzell Inner Rhoden, and Obwalden before 1966 in Switzerland, and the elections before 1968 and after 2003 for the states in the United States are excluded because of data availability.
at Maastricht University on April 29, 2014cps.sagepub.comDownloaded from

Schakel 645
Second orderelection effects
Participation ofregional parties
Change ininstitutional authority
0
5
10
15
20
25
30
35
40
45
50
low
medium hig
hlow
medium hig
hlow
medium hig
h
Dis
sim
ilarit
y be
twee
n na
tiona
l and
regi
onal
ele
ctio
n vo
te s
hare
s (%
vot
es)
Figure 1. Average dissimilarity scores for different groups of elections.Shown are average dissimilarity scores (and their 95% confidence interval) between national and regional party systems for different groups of elections. The elections are categorized as follows. Second-order election effects: vertical and horizontal simultaneous elections (low), vertical nonsimultaneous but horizontal simultaneous elections (medium), vertical and horizontal nonsimultaneous (high); participation of regional parties: none (low), in regional or national elections (medium), in regional and national elections (high); change in institutional authority: no change (low), change in self-rule or shared rule (medium), change in self-rule and shared rule (high).
when the regional election is being held close to the national election or when regional elections are held at the same time. The first bar reflects average dis-similarity for simultaneous regional and general elections (vertical simulta-neity). The second bar shows average dissimilarity for regional elections that are held at the same time as other regional elections (horizontal simultaneity) but that are not held simultaneous with national elections. The third bar shows the average for vertical and horizontal nonsimultaneous elections.
As hypothesized, dissimilarity increases according to the extent the regional election is decoupled from other election cycles. Dissimilarity is lowest for vertical simultaneous elections (12%), increases for vertical non-simultaneous but horizontal simultaneous elections (16%), and is highest for vertical and horizontal nonsimultaneous elections (22%).
at Maastricht University on April 29, 2014cps.sagepub.comDownloaded from
646 Comparative Political Studies 46(5)
The middle three bars exhibit the contribution of regional parties to differ-ences between regional and national vote shares and goes from low, no regional parties participate in regional and national elections, through medium, regional parties participate in regional or national elections, to high, regional parties participate in both types of elections. As one can observe, dissimilarity scores rise from 17% when no regional parties are participating to 29% when regional parties are participating in either type of election, to 38% when regional parties participate in both regional and national elections.
The final three bars show average dissimilarity scores for elections taking place in regions where no decentralization has taken place (low) to those regions that experienced an increase in either self-rule or shared rule (medium) to regions that obtained new powers in self-rule and shared rule (high). As hypothesized, congruence between regional and national vote shares decreases according to the extent of powers transferred to regional governments. Dissimilarity goes from 17% under no decentralization to 23% for regions that experienced change in either self-rule or shared rule and increases to 29% for regions that acquired powers in both self-rule and shared rule.
The patterns in Figure 1 corroborate our hypotheses, but a real test is a multivariate analysis since the hypotheses may be interlinked. Furthermore, the sources of dissimilarity should be disentangled by utilizing the different conceptualizations of congruence of the vote.
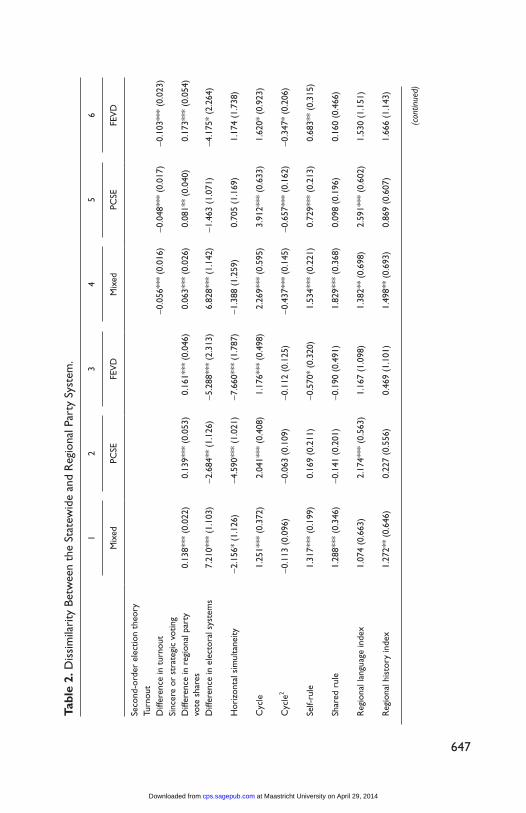
Table 2 presents the results of six models that incorporate all our variables of interest as well as control variables to determine the causes for dissimilari-ties between regional and national party systems (DIS1). The first three mod-els use a different estimation technique, that is, a multilevel mixed-effects linear regression model (mixed), a Beck and Katz model (PCSE), and a fixed-effects vector decomposition model (FEVD). The second set of models (4 through 6) is the same as the first set except for the inclusion of a differ-ence in turnout variable that excludes the United States because of data availability.
The results for Models 1 through 3 indicate that each of the approaches has explanatory value with respect to congruence of the vote. Dissimilarity increases from 1.3% to 2.2% per point on the regional history or language index and from 1.1% to 1.8% per 0.1 points on the ethnic fragmentation index. A subsequent 1.3% increase in dissimilarity may be observed for a 1-point increase on either self-rule or shared rule. Congruence of the vote is also affected by election timing. Dissimilarity increases from 0.25% to 0.5% per year of distance between the regional and national election–0.25 on the cycle variable indicates 1 year for countries with a general election cycle of 4 years—but decreases from 4.6% to 7.7% with horizontal simultaneity.
at Maastricht University on April 29, 2014cps.sagepub.comDownloaded from
647
Tabl
e 2.
Dis
sim
ilari
ty B
etw
een
the
Stat
ewid
e an
d R
egio
nal P
arty
Sys
tem
.
12
34
56
M
ixed
PCSE
FEV
DM
ixed
PCSE
FEV
D
Seco
nd-o
rder
ele
ctio
n th
eory
T u
rnou
t
Diff
eren
ce in
tur
nout
− 0
.056
***
(0.0
16)
−0.0
48**
* (0
.017
)−0
.103
***
(0.0
23)
Sinc
ere
or s
trat
egic
vot
ing
D
iffer
ence
in r
egio
nal p
arty
vo
te s
hare
s
0.13
8***
(0.
022)
0.13
9***
(0.
053)
0.16
1***
(0.
046)
0.06
3***
(0.
026)
0.08
1**
(0.0
40)
0.17
3***
(0.
054)
Diff
eren
ce in
ele
ctor
al s
yste
ms
7.21
0***
(1.
103)
−2.6
84**
(1.
126)
−5.2
88**
* (2
.313
)6.
828*
** (
1.14
2)−1
.463
(1.
071)
−4.1
75*
(2.2
64)
Hor
izon
tal s
imul
tane
ity−2
.156
* (1
.126
)−4
.590
***
(1.0
21)
−7.6
60**
* (1
.787
)−1
.388
(1.
259)
0.70
5 (1
.169
)1.
174
(1.7
38)
Cyc
le1.
251*
** (
0.37
2)2.
041*
** (
0.40
8)1.
176*
** (
0.49
8)2.
269*
** (
0.59
5)3.
912*
** (
0.63
3)1.
620*
(0.
923)
Cyc
le2
−0.1
13 (
0.09
6)−0
.063
(0.
109)
−0.1
12 (
0.12
5)−0
.437
***
(0.1
45)
−0.6
57**
* (0
.162
)−0
.347
* (0
.206
) Se
lf-ru
le1.
317*
** (
0.19
9)0.
169
(0.2
11)
−0.5
70*
(0.3
20)
1.53
4***
(0.
221)
0.72
9***
(0.
213)
0.68
3**
(0.3
15)
Shar
ed r
ule
1.28
8***
(0.
346)
−0.1
41 (
0.20
1)−0
.190
(0.
491)
1.82
9***
(0.
368)
0.09
8 (0
.196
)0.
160
(0.4
66)
Reg
iona
l lan
guag
e in
dex
1.07
4 (0
.663
)2.
174*
** (
0.56
3)1.
167
(1.0
98)
1.38
2**
(0.6
98)
2.59
1***
(0.
602)
1.53
0 (1
.151
) R
egio
nal h
isto
ry in
dex
1.27
2**
(0.6
46)
0.22
7 (0
.556
)0.
469
(1.1
01)
1.49
8**
(0.6
93)
0.86
9 (0
.607
)1.
666
(1.1
43)
(con
tinue
d)
at Maastricht University on April 29, 2014cps.sagepub.comDownloaded from
648
12
34
56
M
ixed
PCSE
FEV
DM
ixed
PCSE
FEV
D
Ethn
ic fr
agm
enta
tion
3.91
5 (1
1.14
3)11
.447
***
(2.7
13)
18.3
40**
* (6
.125
)6.
936
(10.
493)
12.5
54**
* (2
.569
)14
.914
***
(5.7
19)
Rel
igio
us fr
agm
enta
tion
Con
trol
s−2
0.32
7* (
10.4
95)
0.39
8 (2
.791
)−1
.608
(6.
121)
−18.
976*
(9.
983)
6.75
2**
(2.7
49)
5.59
4 (5
.816
)
Pres
iden
tialis
m
−0.9
41 (
7.07
6)−9
.019
***
(1.3
12)
−7.3
84**
* (2
.599
)12
.067
(8.
657)
1.54
3 (2
.014
)5.
059
(3.9
78)
Size
reg
ion
−9.0
91**
(4.
517)
−2.5
45 (
4.87
2)−1
0.77
2 (1
7.26
1)−1
0.65
2**
(4.5
18)
−5.5
77 (
4.85
9)−1
0.10
1 (1
5.93
9)
Con
stan
t12
.824
**
.611
17.1
54**
*
.7
0727
.084
***
.4
747.
421
.595
4.63
2.6
735.
128*
**
.454
Rho
Log
likel
ihoo
d−1
4175
22
1***
321*
**−1
2467
−112
30
218*
**
346*
**−9
733
Wal
d χ2
R2.1
5.7
1.1
6.6
8N
reg
iona
l ele
ctio
ns4,
368
4,36
8
3,98
4 3
,439
3,43
93,
082
N r
egio
ns 3
60 3
60
360
31
0 3
10 3
10N
cou
ntri
es
18
18
18
1
7
17
17
Show
n ar
e th
e re
sults
(st
anda
rd e
rror
s in
par
enth
eses
) of
a m
ultil
evel
mix
ed-e
ffect
s hi
erar
chic
al m
odel
(m
ixed
), a
pane
l-cor
rect
ed s
tand
ard
erro
r m
odel
(PC
SE),
and
a fix
ed-e
ffect
s ve
ctor
dec
ompo
sitio
n m
odel
(FE
VD
). M
odel
s 4–
6 in
clud
e a
diffe
renc
e in
the
tur
nout
var
iabl
e. A
ll m
odel
s co
ntro
l for
firs
t-or
der
auto
corr
elat
ion
(AR
(1))
.*p
< .1
0. *
*p <
.05.
***
p <
.01.
Tab
le 2
. (co
ntin
ued)
at Maastricht University on April 29, 2014cps.sagepub.comDownloaded from
Schakel 649
There are three notable differences in the estimates of the models. First, horizontal simultaneity, ethnic fragmentation, and presidentialism are statis-tically significant in the PCSE and FEVD models but not in the mixed mod-els. Second, self-rule, shared rule, the regional history index, and the size of the region are significant in the mixed models but not in the PCSE and FEVD models. Third, the beta coefficient for the difference in electoral systems variable is negative in the PCSE and FEVD models but positive in the mixed models. As discussed in the methods section, the mixed models focus on variation within regions and between elections, whereas the PCSE and FEVD models put more emphasis on variation across countries and regions. Hence, the differences between the models could indicate that some of the variables have more explanatory power for within-region variation rather than varia-tion between regions or countries. Dissimilarities between vote shares across space and time are analyzed in more depth below.
Inclusion of the turnout difference variable in Models 4 through 6 pro-duces some differences in the estimates as well. The difference in electoral systems, horizontal simultaneity, and presidentialism variables lose statisti-cal significance, whereas self-rule and cycle2 gain significance. The United States is excluded from these analyses, so the changes could come about because of the exclusion of the United States or because we control for dif-ferences in turnout. This question can be answered by rerunning Models 1 through 3 with the exclusion of the United States, and it appears that drop-ping U.S. elections is driving the observed differences. For self-rule, presi-dentialism, and horizontal simultaneity, this is not surprising. The states in the United States score high on self-rule, the United States is the only country (next to France) with a strong presidential office, and horizontal simultaneity is omnipresent in the United States, and all this is related to relatively low dissimilarity scores for the U.S. states. The result for the cycle2 variable is interesting because one would expect to see the strongest second-order elec-tion effects for the United States since midterm elections have produced a consequent loss for the presidential party but for a few rare occasions.
Turning to the difference variables, one may observe that the difference in turnout variable is negative, which means that dissimilarity between vote shares decreases with lower turnout in regional elections. It is not surprising that dissimilarity increases when voters cast their vote for regional parties in regional elections. Finally, different electoral systems for regional and national elections affect congruence of the vote too, and dissimilarity decreases when regional electoral systems are more proportional than those used in general elections. Second-order election effects are further explored below.
at Maastricht University on April 29, 2014cps.sagepub.comDownloaded from

650 Comparative Political Studies 46(5)
I also ran models with the regional economy index variables, but in none of the specifications (see above) did the regional economy index gain statisti-cal significance. In addition, the results remain robust when regional party strength variables are included, which means that statewide parties are affected as well.
Two different operationalizations of dissimilarity are analyzed to tease out the different sources for dissimilarities between regional and national elec-tion vote shares. First, I focus on the difference between the national party system for the whole country and the national vote in the region (DIS2). In this analysis, the type of election is held constant, and second-order variables are excluded because the analysis utilizes first-order election results only. In a second step, I explore differences between the national and regional vote (DIS3), which keeps the type of electorate constant and thereby enables an exploration of the causes for dual voting.
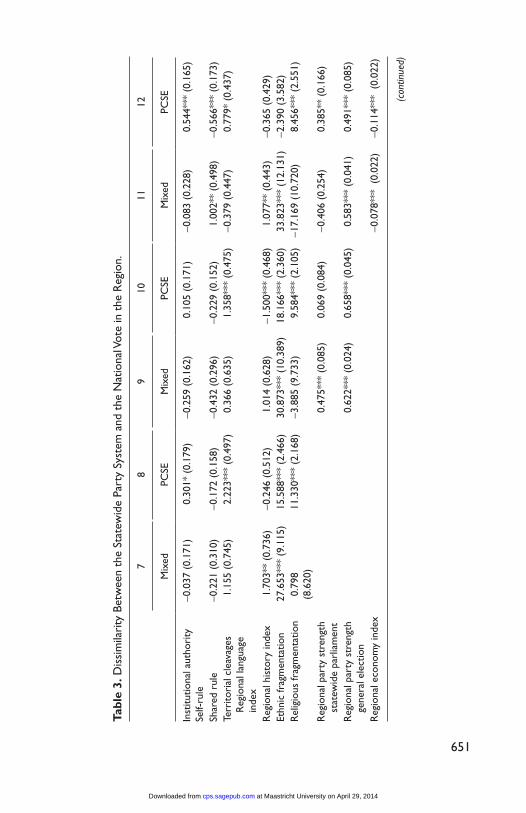
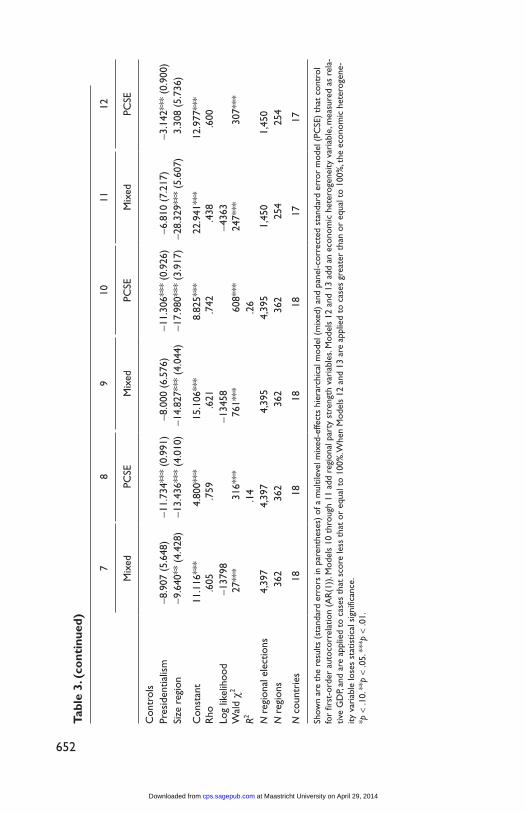
Table 3 presents the results for dissimilarity scores between the statewide party system and the national vote in the region (DIS2). This measurement allows us to focus on territorial cleavages since only first-order elections are analyzed. Fixed-effects models cannot be estimated because most indepen-dent variables are time invariant. Table 3 presents the results for three differ-ent sets of models. Models 7 and 8 are the same as the mixed and PCSE models in Table 2 except for the exclusion of the second-order election vari-ables. Models 9 and 10 include regional party strength variables, and Models 11 and 12 include the regional economy index.
A comparison of the results for Models 7 and 8 presented in Table 3 with the results displayed in Table 2 reveals no differences and corroborates the finding that all sources of heterogeneity lead to less congruence of the vote. It is not surprising that inclusion of regionalist party strength variables (Models 9 and 10) indicate that politicization of regional distinctiveness also contributes to dissimilarity between vote shares. However, the more interest-ing finding is that regional distinctiveness affects not only regional but also statewide parties because the fragmentation and regional indices remain sta-tistically significant after inclusion of the regional party strength variables.
In contrast to the results presented in Table 2, one model reveals a signifi-cant beta coefficient for the regional economy index. It appears that economi-cally deprived regions (scores less than or equal to 100%) are more dissimilar with respect to the vote (Models 11 and 12). The effect is modest though; for every 10% decrease in relative regional GDP per capita, dissimilarity increases from 0.8% to 1.1%
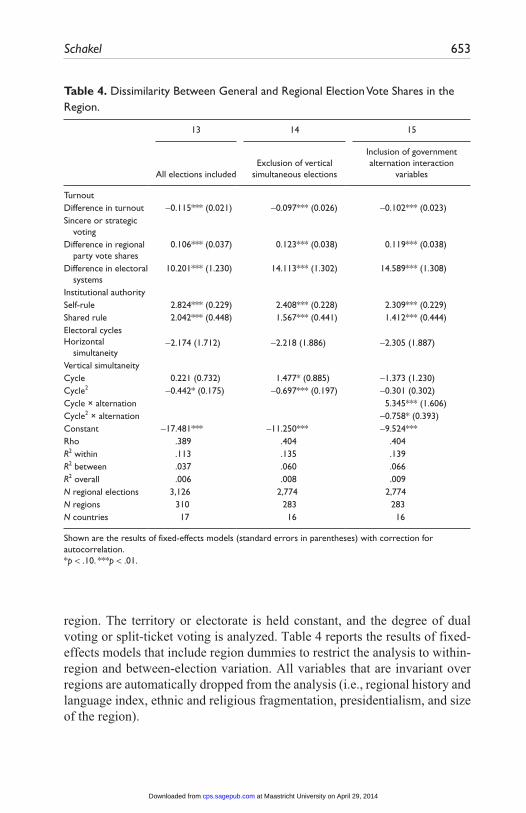
Table 4 explores second-order effects in more detail by analyzing dissimi-larity between the regional vote in the region and the national vote in the
at Maastricht University on April 29, 2014cps.sagepub.comDownloaded from
651
Tabl
e 3.
Dis
sim
ilari
ty B
etw
een
the
Stat
ewid
e Pa
rty
Syst
em a
nd t
he N
atio
nal V
ote
in t
he R
egio
n.
78
910
1112
M
ixed
PCSE
Mix
edPC
SEM
ixed
PCSE
Inst
itutio
nal a
utho
rity
Se
lf-ru
le−0
.037
(0.
171)
0.30
1* (
0.17
9)−0
.259
(0.
162)
0.10
5 (0
.171
)−0
.083
(0.
228)
0.54
4***
(0.
165)
Shar
ed r
ule
−0.2
21 (
0.31
0)−0
.172
(0.
158)
−0.4
32 (
0.29
6)−0
.229
(0.
152)
1.00
2**
(0.4
98)
−0.5
66**
* (0
.173
)Te
rrito
rial
cle
avag
es
Reg
iona
l lan
guag
e in
dex
1.15
5 (0
.745
)2.
223*
** (
0.49
7)0.
366
(0.6
35)
1.35
8***
(0.
475)
−0.3
79 (
0.44
7)0.
779*
(0.
437)
Reg
iona
l his
tory
inde
x1.
703*
* (0
.736
)−0
.246
(0.
512)
1.01
4 (0
.628
)−1
.500
***
(0.4
68)
1.07
7**
(0.4
43)
−0.3
65 (
0.42
9)Et
hnic
frag
men
tatio
n27
.653
***
(9.1
15)
15.5
88**
* (2
.466
)30
.873
***
(10.
389)
18.1
66**
* (2
.360
)33
.823
***
(12.
131)
−2.3
90 (
3.58
2)R
elig
ious
frag
men
tatio
n0.
798
(8.6
20)
11.3
30**
* (2
.168
)−3
.885
(9.
733)
9.58
4***
(2.
105)
−17.
169
(10.
720)
8.45
6***
(2.
551)
Reg
iona
l par
ty s
tren
gth
stat
ewid
e pa
rlia
men
t0.
475*
** (
0.08
5)0.
069
(0.0
84)
−0.4
06 (
0.25
4)0.
385*
* (0
.166
)
Reg
iona
l par
ty s
tren
gth
gene
ral e
lect
ion
0.62
2***
(0.
024)
0.65
8***
(0.
045)
0.58
3***
(0.
041)
0.49
1***
(0.
085)
Reg
iona
l eco
nom
y in
dex
−0
.078
***
(0.
022)
−0.1
14**
* (
0.02
2)
(con
tinue
d)
at Maastricht University on April 29, 2014cps.sagepub.comDownloaded from
652
78
910
1112
M
ixed
PCSE
Mix
edPC
SEM
ixed
PCSE
Con
trol
s
Pres
iden
tialis
m−8
.907
(5.
648)
−11.
734*
** (
0.99
1)−8
.000
(6.
576)
−11.
306*
** (
0.92
6)−6
.810
(7.
217)
−3.1
42**
* (0
.900
)Si
ze r
egio
n−9
.640
** (
4.42
8)−1
3.43
6***
(4.
010)
−14.
827*
** (
4.04
4)−1
7.98
0***
(3.
917)
−28.
329*
** (
5.60
7)3.
308
(5.7
36)
Con
stan
tR
ho11
.116
***
.6
054.
800*
**
.759
15.1
06**
*
.621
8.82
5***
.7
4222
.941
***
.4
3812
.977
***
.6
00Lo
g lik
elih
ood
Wal
d χ2
−137
98
27*
** 31
6***
−134
58
761
***
608*
**−4
363
24
7***
307*
**R2
.14
.26
N
reg
iona
l ele
ctio
ns4,
397
4,39
74,
395
4,39
51,
450
1,45
0N
reg
ions
362
362
362
362
25
4
254
N c
ount
ries
18
18
18
18
17
17
Show
n ar
e th
e re
sults
(st
anda
rd e
rror
s in
par
enth
eses
) of
a m
ultil
evel
mix
ed-e
ffect
s hi
erar
chic
al m
odel
(m
ixed
) an
d pa
nel-c
orre
cted
sta
ndar
d er
ror
mod
el (
PCSE
) th
at c
ontr
ol
for
first
-ord
er a
utoc
orre
latio
n (A
R(1
)). M
odel
s 10
thr
ough
11
add
regi
onal
par
ty s
tren
gth
vari
able
s. M
odel
s 12
and
13
add
an e
cono
mic
het
erog
enei
ty v
aria
ble,
mea
sure
d as
rel
a-tiv
e G
DP,
and
are
appl
ied
to c
ases
tha
t sc
ore
less
tha
t or
equ
al t
o 10
0%. W
hen
Mod
els
12 a
nd 1
3 ar
e ap
plie
d to
cas
es g
reat
er t
han
or e
qual
to
100%
, the
eco
nom
ic h
eter
ogen
e-ity
var
iabl
e lo
ses
stat
istic
al s
igni
fican
ce.
*p <
.10.
**p
< .0
5. *
**p
< .0
1.
Tabl
e 3.
(co
ntin
ued)
at Maastricht University on April 29, 2014cps.sagepub.comDownloaded from
Schakel 653
Table 4. Dissimilarity Between General and Regional Election Vote Shares in the Region.
13 14 15
All elections includedExclusion of vertical
simultaneous elections
Inclusion of government alternation interaction
variables
Turnout Difference in turnout −0.115*** (0.021) −0.097*** (0.026) −0.102*** (0.023)Sincere or strategic
voting
Difference in regional party vote shares
0.106*** (0.037) 0.123*** (0.038) 0.119*** (0.038)
Difference in electoral systems
10.201*** (1.230) 14.113*** (1.302) 14.589*** (1.308)
Institutional authority Self-rule 2.824*** (0.229) 2.408*** (0.228) 2.309*** (0.229)Shared rule 2.042*** (0.448) 1.567*** (0.441) 1.412*** (0.444)Electoral cyclesHorizontal
simultaneity
−2.174 (1.712) −2.218 (1.886) −2.305 (1.887)
Vertical simultaneity Cycle 0.221 (0.732) 1.477* (0.885) −1.373 (1.230)Cycle2 −0.442* (0.175) −0.697*** (0.197) −0.301 (0.302)Cycle × alternation 5.345*** (1.606)Cycle2 × alternation −0.758* (0.393)Constant −17.481*** −11.250*** −9.524***Rho .389 .404 .404R2 within .113 .135 .139R2 between .037 .060 .066R2 overall .006 .008 .009N regional elections 3,126 2,774 2,774N regions 310 283 283N countries 17 16 16
Shown are the results of fixed-effects models (standard errors in parentheses) with correction for autocorrelation.*p < .10. ***p < .01.
region. The territory or electorate is held constant, and the degree of dual voting or split-ticket voting is analyzed. Table 4 reports the results of fixed-effects models that include region dummies to restrict the analysis to within-region and between-election variation. All variables that are invariant over regions are automatically dropped from the analysis (i.e., regional history and language index, ethnic and religious fragmentation, presidentialism, and size of the region).
at Maastricht University on April 29, 2014cps.sagepub.comDownloaded from
654 Comparative Political Studies 46(5)
Table 4 analyzes two different groups of elections. The first group con-tains all elections (Model 13). In the second group (Models 14 and 15), vertical simultaneous elections are excluded, which leaves out all elec-tions in Sweden but also several elections in other countries. In Model 15, two interaction variables are introduced to observe whether the cycle vari-ables have more explanatory power in countries where there is a direct (potential) link between the (regional) vote and (statewide) government change.
The results for the fixed-effects model with respect to the first three vari-ables are the same as those presented in Tables 2 and 3 but are still left for interpretation. The negative sign for difference in turnout indicates that dis-similarity decreases according to a decline in the turnout difference variable. For most regions, the difference in turnout becomes smaller because regional turnout increases. This provides support for the finding that low regional turnout coincides with a larger proportion of opposition and regional party supporters among the voters who do turn out. It should be noted, however, that for a minority of regions, turnout for regional elections is higher than for national elections, which results in a negative score on the turnout difference variable, which subsequently results in a higher dissimilarity score (744 cases). This is not surprising because Schakel and Dandoy (2010) have shown that participation of regional parties is associated with higher turnout in regional elections.
The beta coefficient for the difference in electoral systems variable is pos-itive, which means that for a minor subset of the regions—that is, those that employ majoritarian or plurality electoral systems, whereas a proportional system is used at the statewide level (87 cases)—display lower congruence of the vote. Dissimilarity decreases for those regions that use more proportional systems at the regional level (876 cases). Both findings are contrary to expec-tations. Perhaps the answer may be found on the electoral supply side instead on the electoral demand side. Party systems produced at the statewide level may spill over into and dominate the regional electoral arena despite the incentives produced by regional electoral systems.
Table 4 displays one major difference in comparison to the previous anal-yses. The regional authority variables are statistically significant, whereas this is not the case for most of the PCSE and FEVD models presented in Tables 2 and 3. Clearly, regional authority has more explanatory power with regard to variation across time than across regions and countries. The increase
at Maastricht University on April 29, 2014cps.sagepub.comDownloaded from
Schakel 655
in dissimilarity is from 2.3% to 2.8% for a 1-point increase in self-rule and from 1.4% to 2.0% for every additional point on shared rule.
Two second-order election hypotheses remain to be explored. We should find stronger second-order effects for vertical nonconcurrent elections and for elections held in those regions where there is a (potential) direct link between the (regional) vote and statewide government change. To explore the latter hypothesis, the cycle variables are interacted with an alternation dummy that indicates the presence of a direct vote–government link. Cases with a vote–government link are coded on “the basis that changes in the composition of government and its policy outlook have generally been minimal and of a kind hard to predict from the actual pattern of gains and losses in elections, or from any likely pattern” (Marsh, 1998, p. 598). A tradition of nonalternation of gov-ernment may have different sources. Either the government includes the same (senior) government party for a long time (e.g., the Democrazia Cristiana in Italy or the Christelijk Democratisch Appél in the Netherlands) or some spe-cial, consociational rules are put into practice, as is the case in Austria and Switzerland (Marsh, 1998; Selb, 2006). Following Marsh (1998), we consider the following countries to have a direct vote–government alternation link: Australia, Canada, Denmark, Germany, Italy (1994–present), Norway, Portugal, Spain, the United Kingdom, and the United States. The nonalterna-tion of government cases are Austria, Belgium, France, Greece, Italy (1945–1993), Japan, the Netherlands, Sweden, and Switzerland.
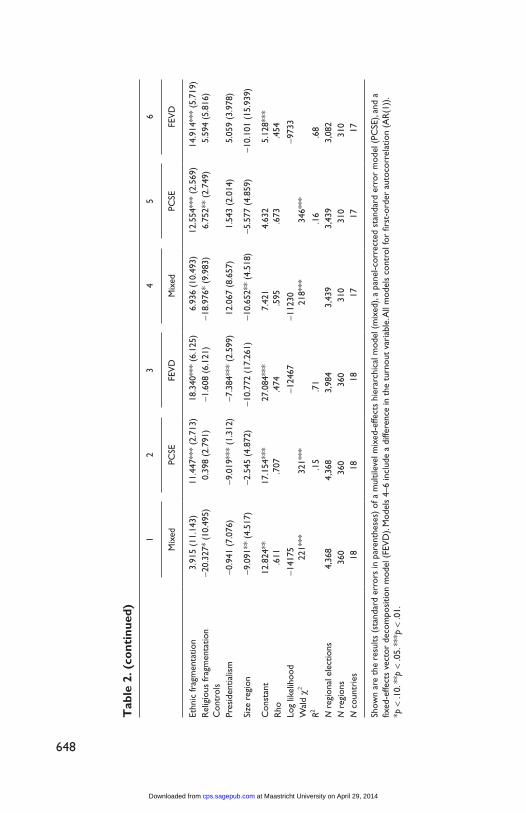
As hypothesized, the cycle variables gain statistical significance when vertical simultaneous elections are excluded (Model 14), and the beta coef-ficients for the interaction variables are larger in size, indicating that the anti-government swing is mainly produced in those regions where the regional vote may send a clear signal to the statewide government (Model 15). These findings remain robust when alternation and nonalternation elections are separately analyzed but are not robust when an alternation dummy variable is included (results not shown). However, the beta coefficient for the alterna-tion dummy is positive and about 9 in size, which means that dissimilarity in alternation countries is about 9% higher than for nonalternation countries. In addition, the alternation dummy is highly collinear with the cycle interaction variables (Pearson correlations = .79 and .54), which might suppress the effect of the cycle interaction variables when all variables are included in a model. To assess the impact of the cycle variable on dissimilarity, I plot esti-mates in Figure 2.
at Maastricht University on April 29, 2014cps.sagepub.comDownloaded from

656 Comparative Political Studies 46(5)
-3
-2
-1
0
1
2
3
0 0,25 0,5 0,75 1Time elapsed in the general election cycle
Dis
sim
ilarit
y be
twee
n na
tiona
l and
regi
onal
ele
ctio
n vo
te s
hare
s (%
vot
es)
Government alternation electionsVertical simultaneous elections exlcuded
Figure 2. Dissimilarity between the national and regional vote along the general election cycle.Shown are dissimilarity scores between the regional and national vote according to the tim-ing of the regional election in the general election cycle. Since most countries have a 4-year statewide government term, each 0.25 on the x-axis represent one year. Estimates are based on the results for the cycle and cycle2 variables in Models 14 and 15 presented in Table 4.
Figure 2 displays dissimilarity scores along the general election cycle. The x-axis shows cycle scores, which resemble the time elapsed since the previous general election. Since most countries use a general election cycle of 4 years, 1 year is represented by a 0.25 increase in the cycle score. The y-axis shows the increase in dissimilarity score based on the estimates provided in Table 4. Estimates are provided for vertical nonsimultaneous elections (Model 14) and vertical nonsimultaneous elections taking place in countries with a tradition of government alternation (Model 15). The pattern for both groups of elections is the same. Negative dissimilarity scores exist when the election is held within a year of the general election, but positive scores may be found between 2 and 3 years after the general election, with the highest dissimilarity scores found at about midterm (0.5; 2 years). The second-order effects are stronger for those
at Maastricht University on April 29, 2014cps.sagepub.comDownloaded from

Schakel 657
elections held in countries with a tradition of government alternation, but the difference is modest, with 2% to 3% less similarity between vote shares at midterm and the end of the general election cycle.
ConclusionA major contribution of this article is to show that one has to look at territo-rial cleavages, regional authority, and second-order election effects to under-stand congruence of the vote. Each of these three approaches can explain differences between national and regional vote shares, and each of the vari-ables specified by the theories has an independent effect on dissimilarity scores. Most of the variation in congruence of the vote can be explained by the depth of territorial cleavages, which are relatively fixed over time. However, if one wants to understand temporal dynamics within a region, one needs to look at institutional authority and the placement of the regional elec-tion in the national and other regional election cycles.
Another contribution of this article is of a more methodological nature. To fully grasp variation in dissimilarity between regional and national vote shares, one should use different conceptualizations of congruence and uti-lize different kinds of vote shares regarding the type of election and level of aggregation. The use of varying kinds of dissimilarity indices enables us to disentangle the sources of variation. Similarly, one should use suitable statistical techniques to establish whether the theoretical approaches are better in explaining variation in dissimilarity scores across space or across time.
A fruitful next step in regional election research would be to conduct individual-level survey analyses of the reasons why voters switch their vote between the regional and general election. Does the voter want to balance the party in statewide government with an opposition party in regional govern-ment? Or does the increase in institutional authority induce the voter to cast her or his vote for a party that she or he considers to have the best program for her or his region? Perhaps the voter is inclined to vote sincerely in regional elections and more strategically in general elections depending on electoral system characteristics and size of the region. In this article, the macro-institutional and macro-sociological factors for dissimilarity between the national and regional vote have been explored, but we still lack micro-level explanations.
at Maastricht University on April 29, 2014cps.sagepub.comDownloaded from
658 Comparative Political Studies 46(5)
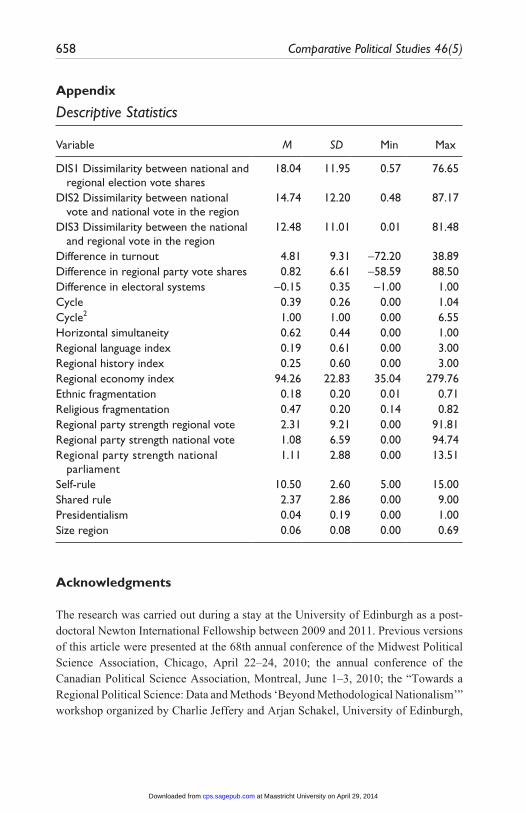
Appendix
Descriptive Statistics
Variable M SD Min Max
DIS1 Dissimilarity between national and regional election vote shares
18.04 11.95 0.57 76.65
DIS2 Dissimilarity between national vote and national vote in the region
14.74 12.20 0.48 87.17
DIS3 Dissimilarity between the national and regional vote in the region
12.48 11.01 0.01 81.48
Difference in turnout 4.81 9.31 −72.20 38.89Difference in regional party vote shares 0.82 6.61 −58.59 88.50Difference in electoral systems −0.15 0.35 −1.00 1.00Cycle 0.39 0.26 0.00 1.04Cycle2 1.00 1.00 0.00 6.55Horizontal simultaneity 0.62 0.44 0.00 1.00Regional language index 0.19 0.61 0.00 3.00Regional history index 0.25 0.60 0.00 3.00Regional economy index 94.26 22.83 35.04 279.76Ethnic fragmentation 0.18 0.20 0.01 0.71Religious fragmentation 0.47 0.20 0.14 0.82Regional party strength regional vote 2.31 9.21 0.00 91.81Regional party strength national vote 1.08 6.59 0.00 94.74Regional party strength national
parliament1.11 2.88 0.00 13.51
Self-rule 10.50 2.60 5.00 15.00Shared rule 2.37 2.86 0.00 9.00Presidentialism 0.04 0.19 0.00 1.00Size region 0.06 0.08 0.00 0.69
Acknowledgments
The research was carried out during a stay at the University of Edinburgh as a post-doctoral Newton International Fellowship between 2009 and 2011. Previous versions of this article were presented at the 68th annual conference of the Midwest Political Science Association, Chicago, April 22–24, 2010; the annual conference of the Canadian Political Science Association, Montreal, June 1–3, 2010; the “Towards a Regional Political Science: Data and Methods ‘Beyond Methodological Nationalism’” workshop organized by Charlie Jeffery and Arjan Schakel, University of Edinburgh,
at Maastricht University on April 29, 2014cps.sagepub.comDownloaded from

Schakel 659
Edinburgh, June 19–20, 2010; the CEVIPOL staff seminar at the Université Libre des Bruxelles, Brussels, October 21, 2010; the “Multilevel Governance: Estimating Authority Below and Above the State” workshop organized by Gary Marks and Liesbet Hooghe, Berlin, December 20–21, 2010; and at the Institute of Government staff seminars (University of Edinburgh) on May 27, 2010, and February 24, 2011. The research presented in this article has benefited from collaborations on other papers with Régis Dandoy, Charlie Jeffery, and Wilfried Swenden. The normal dis-claimers apply.
Declaration of Conflicting Interests
The author(s) declared no potential conflicts of interest with respect to the research, authorship, and/or publication of this article.
Funding
The author(s) disclosed receipt of the following financial support for the research, authorship, and/or publication of this article: Financial support was provided by the International Newton Fellowship scheme of the British Academy, the UK’s National Academy for the Humanities and Social Science.
References
Alesina, A., Devleeschauwer, A., Eaterly, W., Kurlat, S., & Wacziarg, R. (2003). Fractionalization (Working Paper No. 9411). Cambridge, MA: National Bureau of Economic Research.
Amoretti, U. M. & Bermeo, N. (Eds.). (2004). Federalism and territorial cleavages. Baltimore: The John Hopkins University Press.
Anderson, C. J., & Ward, D. S. (1996). Barometer elections in comparative perspec-tive, Electoral Studies, 15, 447-460.
Arzaghi, M., & Henderson, J. V. (2005). Why countries are fiscally decentralizing. Journal of Public Economics, 89, 1157-1189.
Beck, N., & Katz, J. (1995). What to do (and not to do). with time-series-cross-section data? American Political Science Review, 89, 634-647.
Bolton, P., & Roland, G. (1997). The breakup of nations: A political economy analy-sis. Quarterly Journal of Economics, 112, 1057-1090.
Bosworth, C. E., Van Donzel, E., Lewis, B., & Pellat, C. (Eds.). (1986). The encyclo-paedia of Islam (Vol. 5, pp. 439-440). Leiden, Netherlands: Brill.
Brancati, D. (2008). The origins and strengths of regional parties. British Journal of Political Science, 38, 135-159.
Caramani, D. (2004). The nationalization of politics. The formation of national electorates and party systems in Western Europe. Cambridge, UK: Cambridge University Press.
at Maastricht University on April 29, 2014cps.sagepub.comDownloaded from

660 Comparative Political Studies 46(5)
Carsey, T. M., & Wright, G. C. (1998). State and national factors in gubernational and senatorial elections. American Journal of Political Science, 42, 994-1002.
Chhibber, P. K., & Kollman, K. (2004). The formation of national party systems: Federalism and party competition in Canada, Great Britain, India, and the United States. Princeton, NJ: Princeton University Press.
Deschouwer, K. (2003). Political parties in multi-layered systems. European Urban and Regional Studies, 10, 213-226.
Encyclopædia Britannica. (2010). Encyclopædia Britannica online. Retrieved from http://www.britannica.com
Erikson, R. S., & Filippov, M. G. (2001). Electoral balancing in federal and sub-national elections: The case of Canada. Constitutional Political Economy, 12, 313-331.
EUROSTAT. (1983–1997). Regions—Statistical yearbook. Luxembourg: Publications Office of the European Union.
EUROSTAT. (2011). Statistics database. Retrieved from http://epp.eurostat.ec.europa .eu/portal/page/portal/statistics/search_database
Fitjar, R. D. (2010). The rise of regionalism: Causes of regional mobilization in Western Europe. London, UK: Routledge.
Golder, M. (2005). Democratic electoral systems around the world. Electoral Studies, 24, 103-121.
Gourevitch, P. A. (1979). The re-emergence of “peripheral nationalisms”: Some comparative speculations on the spatial distribution of political leadership and economic growth. Comparative Studies in Society and History, 21, 303-322.
Harvie, C. (1994). The rise of regional Europe. London, UK: Routledge.Hearl, D., Budge, I., & Pearson, B. (1996). Distinctiveness of regional voting: A com-
parative analysis across the European Community (1979–1993). Electoral Studies, 15, 167-182.
Hechter, M. (1975). Internal colonialism: The Celtic fringe in British national devel-opment, 1536–1966. Berkeley: University of California Press.
Hix, S., & Marsh, M. (2007). Punishment or protest? Understanding European Parliament elections. Journal of Politics, 69, 495-510.
Hooghe, L., Marks, G., & Schakel, A. H. (2010). The rise of regional authority: A comparative study of 42 democracies. London, UK: Routledge.
Hough, D., & Jeffery, C. (2006). Germany: An erosion of federal-Länder linkages? In D. Hough & C. Jeffery (Eds.), Devolution and electoral politics (pp. 119-139). Manchester, UK: Manchester University Press.
Jeffery, C., & Hough, D. (2001). The electoral cycle and multi-level voting in Germany. German Politics, 10, 73-98.
Jeffery, C., & Hough, D. (2003). Regional elections in multi-level systems. European Urban and Regional Studies, 10, 199-212.
at Maastricht University on April 29, 2014cps.sagepub.comDownloaded from
Schakel 661
Jeffery, C., & Hough, D. (2009). Understanding post-devolution elections in Scotland and Wales in comparative perspective. Party Politics, 15, 219-240.
Johnston, R. (1980). Federal and provincial voting. In D. J. Elkins & R. Simeon (Eds.), Small worlds: Provinces and parties in Canadian political life (pp. 131-78). Toronto, Canada: Methuen.
Kern, H., & Hainmüller, J. (2006). Electoral balancing, divided government, and midterm loss in German state elections. Journal of Legislative Studies, 12, 127-149.
Lewis, M. P. (Ed.). (2009). Ethnologue: Languages of the world (16th ed.). Retrieved from http://www.ethnologue.com/
Lijphart, A. (1977). Democracy in plural societies. New Haven, CT: Yale University Press.
Lipset, S. M., & Rokkan, S. (1967). Cleavage structures, party systems and voter alignments: An introduction. In S. M. Lipset & S. Rokkan (Eds.), Party systems and voter alignments: Cross national perspectives (pp. 1-64). New York, NY: Free Press.
Livingston, W. (1956). Federalism and constitutional change. Oxford, UK: Clarendon.
Marsh, M. (1998). Testing the second-order election model after four European elections. British Journal of Political Science, 28, 591-607.
Newman, S. (1996). Ethnoregional conflict in democracies: Mostly ballots, rarely bullets. Westport, CT: Greenwood.
Organisation for Economic Co-operation and Development. (2011). Regional data-base. Retrieved from http://stats.oecd.org/Index.aspx
Palazzolo, C. A. (2007). Electoral independence, dependence, or co-dependence? A reassessment of second-order electoral explanations in subnational elections (Unpublished doctoral dissertation). Emory University, Atlanta, GA.
Pallares, F., & Keating, M. (2003). Multi-level electoral competition: Sub-state elections and party systems in Spain. European Urban and Regional Studies, 10, 239-255.
Parks, J., & Elcock, H. (2000). Why do regions demand autonomy? Regional and Federal Studies, 10, 87-106.
Pierson, P. (1993). When effect becomes cause: Policy feedback and political change. World Politics, 45, 595-628.
Plümper, T., & Troeger, V. E. (2007). Efficient estimation of time-invariant and rarely changing variables in finite sample panel analysis with unit fixed effects. Political Analysis, 15, 124-139.
Przeworski, A., & Sprague, J. (1986). Paper stones: A history of electoral socialism. Chicago, IL: Chicago University Press.
Reif, K. (1985). Ten second-order elections. In K. Reif (Ed.), Ten second-order elec-tions (pp. 1-36). Aldershot, UK: Gower.
at Maastricht University on April 29, 2014cps.sagepub.comDownloaded from
662 Comparative Political Studies 46(5)
Reif, K., & Schmitt, H. (1980). Nine second-order national elections: A conceptual framework for the analysis of European election results. European Journal of Political Research, 8, 3-44.
Rokkan, S., & Urwin, D. (1983). Economy, territory, identity: Politics of West Euro-pean peripheries. London, UK: Sage.
Schakel, A. H. (in press). Regional election database. Available at www.arjanschakel.nlSchakel, A. H., & Dandoy, R. (2010, June). Second-order election theory and
regional elections: The effects of institutional authority and electoral cycles on regional turnout. Paper presented at the Towards a Regional Political Science workshop, Edinburgh, UK.
Schakel, A. H., & Jeffery, C. (2010, June). Are regional elections really second-order elections? Paper presented at the Towards a Regional Political Science workshop, Edinburgh, UK.
Selb, P. (2006). Multilevel elections in Switzerland. Swiss Political Science Review, 12, 49-75.
Simon, D. M. (1989). Presidents, governors and electoral accountability. Journal of Politics, 51, 286-304.
Simon, D. M., Osrom, C. W., Jr., & Marra, R. F. (1991). The president, referendum voting, and sub-national elections in the United States. American Political Sci-ence Review, 85, 1177-1192.
Thorlakson, L. (2000). Government building and political development in federa-tions: Applying Canadian theory to the German case. Regional and Federal Stud-ies, 10, 129-148.
Thorlakson, L. (2007). An institutional explanation of party system congruence: Evi-dence from six federations. European Journal of Political Research, 46, 69-96.
Treisman, D. (2007). The architecture of government: Rethinking political decentral-ization. Cambridge, UK: Cambridge University Press.
Tufte, E. R. (1975). Determinants of the outcomes of midterm congressional elec-tions. American Journal of Political Science Review, 69, 812-826.
Van Houten, P. (2007). Regionalist challenges to European states: A quantitative assessment. Ethnopolitics, 6, 545-568.
Author Biography
Arjan H. Schakel is an assistant professor in research methods at Maastricht University. Before that he was a Newton International Fellow at the University of Edinburgh. His research interests are in federalism, decentralization, regional govern-ment, regional elections, and regional party politics, and he has published several articles in journals such as Regional and Federal Studies (2008), Acta Politica (2009), and Governance (2010). He is also co-author (with Liesbet Hooghe and Gary Marks) of a book published by Routledge titled The Rise of Regional Authority: A Comparative Study of 42 Democracies. His website is available at www.arjanschakel.nl.
at Maastricht University on April 29, 2014cps.sagepub.comDownloaded from