Comparative Guide to Nutritional Supplements by Lyle MacWilliam

1
COMPARATIVE NUTRITIONAL STUDY BETWEEN THE
SCHOOL CHILDREN AGED 5-10 YEARS OF PRIVATE AND
PUBLIC SCHOOLS OF GAURADAHA MUNICIPALITY,
JHAPA
by
Prakash Raut
Department of Nutrition and Dietetics
Central Campus of Technology
Institute of Science and Technology
Tribhuvan University, Nepal
2018

i
Comparative Nutritional Study between the School Children Aged
5-10 Years of Private and Public Schools of Gauradaha
Municipality, Jhapa.
A dissertation submitted to the Department of Nutrition and Dietetics, Central
Campus of Technology, Tribhuvan University, in partial fulfillment of the
requirements for the Bachelor’s degree in Nutrition and Dietetics.
by
Prakash Raut
Department of Nutrition and Dietetics
Central Campus of Technology
Institute of Science and Technology
Tribhuvan University, Nepal
July, 2018

ii
Tribhuvan University
Institute of Science and Technology
Department of Nutrition and Dietetics
Central Campus of Technology, Dharan
Approval Letter
This dissertation entitled Comparative Nutritional Study between the School
Children Aged 5-10 Years of Private and Public Schools of Gauradaha
Municipality, Jhapa presented by Prakash Raut has been accepted as the
partial fulfillment of the requirement for the Bachelor degree in Nutrition and
Dietetics.
Dissertation Committee
1. Head of Department _________________________________
(Mr. Dambar B. Khadka, Asst. Prof.)
2. External Examiner _________________________________
(Prof. Dr. Surendra B. Katwal)
3. Supervisor __________________________________
(Mr. Devraj Acharya, Asst. Prof.)
4. Internal Examiner ___________________________________
(Mr. Yadav K.C, Asst. Prof.)
July, 2018

iii
Acknowledgements
Foremost I would like to express my sincere gratitude to my supervisor Assistant
Prof. Mr. Devraj Acharya for his support and encouragement to complete this task.
I am indeed grateful to Mr. Dambar Bahadur Khadka, Head of Department
(Nutrition and Dietetics), Prof. Dr. Dhan Bdr. Karki (Campus Chief, CCT) for their
kind co-operation to pursue my Bachelor degree. I am indebted to Central Campus
of Technology and all the teaching and non-teaching staffs of this campus for their
support.
My sincere gratitude goes towards all the residence of Gauradaha Municiplaity
for their good co-operation which make easier.
I would like to thank my friends Madan Pandey, Mohan khadka, Rajan Subedi,
Sundar Silwal and my juniors Bibek Upreti, Suresh Thapa, Arjun Poudel and Heli
jimee Rai for their help and support to accomplish it.
I wish to express my gratitude to my beloved parents for their love and support
.Thanks, to all those helping hands who directly or indirectly contributed to the
success of this study.
Date of submission
July, 2018
___________________
(Prakash Raut)

iv
Contents
Approval Letter…………………………………………………….……………...ii
Acknowledgements………………..………………………………….….………..iii
Contents………………………..…………………………………….…………….iv
Abstract……………………………………….………………….……………....viii
List of Tables………………………………………………………………………ix
List of Figures………………………..……………………………….…….……...x
List of Abbreviations………………….…………………………….…………….xi
Introduction……………………………………………………………………...1-4
1.1 Background ................................................................................................ 1
1.2 Statement of the problem .......................................................................... 2
1.3 Objectives ................................................................................................... 3
1.3.1 General Objective ................................................................................ 3
1.3.2 Specific objective ................................................................................. 3
1.4 Research questions ..................................................................................... 3
1.5 Significance of the study ............................................................................ 4
1.6 Limitations of the study ............................................................................. 4
1.7 Hypothesis ................................................................................................... 4
Literature Review…………………………………………………………..….5-22
2.1 Malnutrition ............................................................................................... 5
2.2 Types of malnutrition ................................................................................ 6
2.2.1 Kwashiorkor ........................................................................................ 6
2.2.2 Marasmus ............................................................................................. 7
2.2.3 Marasmic kwashiorkor ....................................................................... 7
2.2.4 Vitamin A deficiency ........................................................................... 7

v
2.2.5 Iron deficiency anemia (IDA) ............................................................. 8
2.2.6 Iodine deficiency disorder .................................................................. 8
2.2.7 Zinc deficiency ..................................................................................... 9
2.3 Causes of malnutrition ............................................................................ 10
2.3.1 Immediate causes of malnutrition ................................................... 10
2.3.2 Underlying causes of malnutrition................................................... 10
2.3.3 Basic causes of malnutrition ........................................................... 10
2.4 Consequences of malnutrition ................................................................ 11
2.4.1 Physical and cognitive development ................................................ 11
2.4.2 School performance........................................................................... 11
2.4.3 Economic productivity ...................................................................... 12
2.5 Intergenerational cycle of malnutrition ................................................. 12
2.6 Malnutrition and Infection ..................................................................... 13
2.7 Nutritional status ..................................................................................... 14
2.8 Factors affecting Nutritional status ........................................................ 14
2.9 RDA of school aged children ................................................................... 16
2.10 Nutritional status of women in Nepal .................................................. 17
2.11 Methods for assessing nutritional status .............................................. 18
2.12 Nutritional status indicators ................................................................. 18
2.13 Literature from previous studies .......................................................... 21
Materials and methods…………………………………………………..…...23-27
3.1 Research Design ....................................................................................... 23
3.2 Study area .................................................................................................. 23
3.3 Study variables ......................................................................................... 23
3.4 Target Population .................................................................................... 23
3.5 Sampling Technique ................................................................................ 24

vi
3.6 Sample size determination ...................................................................... 24
3.7 Research Instruments .............................................................................. 25
3.8 Pre-testing ................................................................................................. 25
3.9 Validity and Reliability ........................................................................... 26
3.10 Data collection techniques ..................................................................... 26
3.11 Data Analysis ........................................................................................... 27
3.12 Logistical and Ethical considerations .................................................. 27
Results and discussion……………………………………………..…………28-51
4.1 Demographic and socio-economic characteristics ................................ 28
4.2 Child characteristics ................................................................................ 32
4.3 Household characteristics ....................................................................... 34
4.4 Food preferences ...................................................................................... 35
4.5 Physical activities ..................................................................................... 36
4.6 Nutritional status of primary level school children aged 5-10 years of
Gauradaha Municipality ................................................................................... 38
4.7 Distribution of malnutrition according to age group of both private
and public school ................................................................................................ 39
4.8 Distribution of malnutrition according to gender of both private and
public school ....................................................................................................... 39
4.9 Distribution of malnutrition according to height for age of public
school ................................................................................................................... 40
4.10 Factors associated with stunting of public school children ................ 41
4.11 Distribution of malnutrition according to weight for age of public
school ................................................................................................................... 42
4.12 Factors associated with underweight of public school children ........ 43
4.13 Distribution of malnutrition according to BMI for age of public
school ................................................................................................................... 44
4.14 Factors associated with thinness of public school children ................ 45

vii
4.15 Distribution of malnutrition according to height for age of private
school ................................................................................................................... 46
4.16 Factors associated with stunting of private school children .............. 47
4.17 Distribution of malnutrition according to weight for age of private
school ................................................................................................................... 48
4.18 Factors associated with underweight of private school children ....... 49
4.19 Distribution of malnutrition according to BMI for age of private
school ................................................................................................................... 50
4.20 Factors associated with thinness of private school children .............. 51
Conclusions and recommendations……………………………………………..52
5.1 Conclusions ............................................................................................... 52
5.2 Recommendations……………………………………………………….52
Summary……………………………………………………………...……….53-55
References……………………………………………………………………..56-61
Appendices…………………………………………………………………….62-79

viii
Abstract
This study was conducted with the aim for comparative nutritional status between
primary level school children aged 5-10 years of private and public schools of
Gauradaha Municipality, Jhapa. Simple random sampling method was used to
determine the sample population. Out of 180 sample size, 90 were from private
schools and 90 were from public schools. Anthropometric measurements of the
children were taken by measuring their height and weight using standardized tools.
To obtain information on socio-demographic characteristics, household
characteristics, physical activities etc interview students was done by using
structure pre-tested questionnaires. Data were analyzed by using SPSS version 20.0
and WHO Anthro Plus version 1.0.4. Chi-square test was used to find out the
factors associated with stunting, underweight and thinness.
The overall prevalence stunting, thinness and underweight in the surveyed
area was found to be 41.1%, 20% and 37.7% respectively. Out of which children
from private school comprises 20% of stunting, 7.8% of thinness and 13.3% of
underweight whereas children from public school comprise 21.1% of stunting,
12.2% of thinness and 24.4% of underweight. Highest percentage of stunting and
underweight was found in the age group of 8-10 years i.e.14.4% and 16.7%
respectively. Similarly, children who belong to 5-8 yr age group were found to be
more thinned i.e. 6.7%. Male child from both private and public school were found
to be more stunted, thinned and underweight than female child. Among public
school children gender (P= 0.009) and the type of game usually played (P=0.023)
was found to be significantly associated with underweight. Factors such as gender
(P=0.018), type of house (P=0.020) and purification of water (P=0.030) were found
to be significantly associated with thinness of public school children. From public
schools, vegetarian children were found to significantly associated (P=0.049) with
stunting. No any factors such as family type, father‘s occupation, birth order and
food preferences were found to be significantly associated with stunting, thinness
and underweight of children from private school.

ix
List of Tables
Table
No Title
Page
No
2.1
2.2
Recommended dietary intake of nutrient for school children
Interpretation of cut-off points based on WHO
28
31
4.1
Distribution of caste and religion of the surveyed population
(n=180) 38
4.2 Economic characteristics of the surveyed population (n = 180) 39
4.3
Socio-demographic characteristics of the surveyed population (n
=180) 40
4.4 Child characteristics of the surveyed population (n=180) 42
4.5 Household characteristics of the study population (n=180) 42
4.6 Food preferences of the surveyed population (n=180) 44
4.7 Physical activities of the surveyed populations (n=180) 45
4.8 Age wise distribution of malnutrition of children from public school 47
4.9
Age wise distribution of malnutrition of children from private
school 47
4.10
Distribution of malnutrition according to gender of both private and
public 48
4.11
School
Result of chi-square test for factors associated with stunting of
public school 49
4.12
Result of chi-square for factors associated with underweight of
public school 51
4.13
Result of chi-square for factors associated with thinness of public
school 52
4.14
Result of chi-square test for factors associated with stunting of
private school 54
4.15
Result of chi-square test for factors associated with underweight of
private School 56
4.16
Result of chi-square for factors associated with thinness of private
school 57

x
List of Figures
Figure
No Title
Page
No.
2.1 Conceptual framework of malnutrition 21
2.2 The intergenerational cycle of growth failure 24
2.3 Malnutrition and infection cycle 25
4.1
Nutritional status of 5-10 years children of both private and
public 46
4.2
school of the study area
Height for age Z-score curve of public school children with
reference 48
4.3
to WHO standard
Weight for age Z-score curve of public school children with
reference 50
4.4
to WHO standard
BMI for age Z-score curve of public school children with
reference to 52
4.5
WHO standard
Height for age Z-score curve of private school children with
reference 54
4.6
to WHO standard
Weight for age Z-score curve of private school children with
reference 55
4.7
to WHO standard
BMI for age Z-score curve of private school children with
reference to
57
WHO standard

xi
List of Abbreviations
Abbreviations Full form
BMIZ Body Mass Index for age Z-score
CBS Central Bureau of Statistics
CI Confidence Interval
FCHV's Female Community Health Volunteers
GoN
HAZ
Government of Nepal
Height for age Z score
IDA Iron Deficiency Anemia
IFPRI International Food Policy Research Institute
MoH Ministry of Health
MoPE Ministry of Population and Environment
NDHS Nepal Demographic and Health Survey
NLSS Nepal Living Standard Survey
PEM Protein Energy Malnutrition
RDA Recommended Dietary Allowance
SD Standard Deviation
UNDP United Nations Development Programme
UNICEF United Nations International Children Education Fund
VAD Vitamin-A Deficiency
WAZ Weight for age Z score

1
Part-I
Introduction
1.1 Background
Nutrition is the science that encompasses all aspects of food, how food nourishes
our body and influences our health. It also involves studying the factors that
influence our eating patterns, making recommendations about the amount we
should eat of each type of food, attempting to maintain food safety, and addressing
issues related to the global food supply (Thompson and Manore, 2012). Nutritional
status refers to the condition of health of the individual as influenced by the
utilization of the nutrients. It can be determined only by the correlation of
information obtained through a careful medical and dietary history, through
physical examination and appropriate laboratory investigation (Srilakshmi, 2014).
Nepal is one of the least developed nations ranking 144th
position among 188
countries in the Human Development Index (UNDP, 2016). Nepal Living Standard
Surveys (NLSS) showed that in 2010-2011, 25% of population was poor in Nepal,
compared to 42% in 1995-96 and 31% in 2003-04 (GoN and MoPE, 2016).
Malnutrition results from the interaction of poor quality diet, lack of health and care
environment and behaviors, which are shaped in a part by a host of underlying
factors, such as political instability, poor economic development, inequality, etc.
One in three people is malnourished in one form or another (IFPRI, 2015). Various
forms of malnutrition affect a large group of population in the developing country
like Nepal and remain a major public health concern. Malnutrition, household food
insecurity and poverty are the prevalent problems existing in our country. The most
common form of malnutrition is Protein-Energy Malnutrition (PEM) and the other
forms of malnutrition are Iodine Deficiency Disorder (Hiddinnott and Yohannes),
Iron Deficiency Anemia (IDA) and Vitamin A deficiency (VAD) (MoHP, 2010).
According to Nepal Demographic and Health Survey (2016), 36% of children
under-5 years are chronically malnourished whereas 10% of children under-5 years
are acutely malnourished. The composite form of malnutrition (both acute and
chronic) affects 27% of under-five children. About 53% of children suffered from
some degree of anemia out of which 26% are mildly anemic, 26% are moderately

2
anemic and 1% severely anemic. 86% of children aged 6-59 months received Vit-A
supplements and 95% of children live in household that consume iodized salt (MoH
et al., 2016).
1.2 Statement of the problem
The school age period is nutritionally significant because this is the prime time to
build up body stores of nutrients in preparation for rapid growth of adolescence
(Kumari and Jain, 2005). Protein or calorie deficiency results in underweight,
wasting and lowered resistance to infection in children whereas iron deficiency in
school age children is associated with decreased immunity, stunted growth, poor
cognitive development resulting in lower Intelligence Quotient (IQ) and behavioral
abnormalities (Gowri and Sangunam, 2005).
School aged children suffering from under or over nutrition can inhibit a child‘s
physical and mental development. Stunting (low height-for-age) is associated with
long-term consequences, such as impaired intellectual achievement and school
performance(Frongillo, 1999). It also leads to reduction in adult body size and,
subsequently, reduced work capacity and obstetric complications. Thinness or low
body mass index (BMI-for-age) can result in delayed maturation, deficiencies in
muscular strength and work capacity, and reduced bone density later in life (WHO,
1995). The overweight or obesity also increased the risks of hypertension,
metabolic syndrome, non-insulin-dependent (type II) diabetes, and psychological
disorders (WHO, 2003). School going children have typically been considered a
low risk group for poor health, and often receive few healthcare resources and scant
attention. However, this approach ignores the fact that many health problems later
in life can be improved or avoided by adopting healthy lifestyle habits in
adolescence (Anon., 2003).
Childhood is the age range that needs more attention to nutritional needs. When
compared with infants and toddlers, school-age children received less attention
both from the parents and the environment, because the attention is focused on the
nutritional needs of infants and toddlers. Therefore, school-age children need good
nutrition because it can affect the health, fitness, and the motivation in learning
itself at school. These school going children gain education either from

3
public/government schools or from private boarding schools. Basically high class
people admit their children to some top ranked private schools whereas middle
class people are likely to admit their children in either private boarding school or
public schools too. Similarly, people of low income class mostly admit their
children in public schools. Exceptionally in some cases it has been found that low
income class people also admit their children in private boarding schools and the
trend is in increasing order. However, in both categories of schools, the nutrition
education seems to be far backward.
No any studies regarding nutritional status of primary level school aged children
has been done in Gauradaha Municipality where 22 private and 26 public schools
are situated. So the study focus on collecting the information related to the
nutritional status of primary school children of Gauradaha.
1.3 Objectives
1.3.1 General Objective
The general objective was to study the nutritional status of school children aged 5-
10 years of private and public schools of Gauradaha Municipality, Jhapa.
1.3.2 Specific objective
i. To figure out the prevalence and distribution of malnutrition of primary
school children aged 5-10 years of Gauradaha Municipality.
ii. To assess the factors associated with nutritional status among of school
going children aged 5-10 years of Gauradaha Municipality.
iii. To compare the nutritional status of children aged 5-10 years of private and
public schools of that area.
1.4 Research questions
i. What is the existing nutritional status of children aged 5-10 years studying
in private and public schools of Gauradaha Municipality?
ii. Is there any difference in the nutritional status of school going children aged
5-10 years studying in private and public schools of Gauradaha
Municipality?

4
1.5 Significance of the study
The result of the survey will contribute to:
i. Figure out the distribution of the malnutrition among children studying in
private and public schools.
ii. Address malnutrition and encourage responsible personalities for the
improvement of nutritional status of school children by improving dietary
pattern.
iii. Reflect sanitary condition, socio-economic variables, degree of malnutrition
and condition of school children.
iv. Provide information to government as well as voluntary organization to take
initial step to tackle the problem.
v. Encourage concerned authorities for the proper nutrition planning and
implementation of nutrition program effectively.
1.6 Limitations of the study
The limitations of this study are:
1. This study being cross-sectional in nature, seasonal variation may exist.
2. The biochemical and clinical assessment methods were not included in this
study.
1.7 Hypothesis
It is based on the hypothesis that there will be no any significant differences
between the nutritional status of primary level schools children (5-10years)
studying in private and public schools.

5
Part-II
Literature Review
2.1 Malnutrition
Malnutrition is defined as a diet containing insufficient quantities of nutrients or a
diet in which one or more essential nutrients is missing or is present in the wrong
proportions(De Souza et al., 2011). It is a major health problem in developing
countries affecting 20% of all in the developing world, causing 50% of all child
deaths globally. The main nutritional problems faced by a school-age child include
wasting, stunting, underweight, anemia, iodine deficiency and vitamin A deficiency
(Khuwaja et al., 2005). Undernutrition contributes to half of all deaths and 28% of
stunting in children worldwide (Onis et al., 2012). Malnourished children have
lowered resistance to infection, early death from common childhood ailments, e.g.,
diarrheal diseases and respiratory infections. Those who survive, frequent illness
saps their nutritional status, putting them into a vicious cycle of recurring sickness,
faltering growth and diminished learning ability. More than 70% of children with
protein-energy malnutrition live in Asia(Ergin et al., 2007). In developing
countries, an estimated 99 million children of primary-school age are not enrolled,
and of those enrolled, only 78% complete primary school. Children from
developing countries have much lower achievement levels than children in
developed countries in the same grade(McGregor et al., 2007).
The World Health Organization (WHO) states that nutritional deficiencies and poor
health in primary school age children are among the causes of low school
enrollment, high school absenteeism, early dropout from school and poor classroom
performance (Saluja et al., 2009). The adverse effects of stunting could affect the
adulthood by limiting work capacity owing to reduced muscle mass (Haas et al.,
1996). The Maternal and Child Undernutrition Study Group (Victora et al., 2008)
reviewed cohort studies from five low‐income and middle‐income countries:
Brazil, Guatemala, India, Philippines and South Africa which involved long‐term
follow‐up of children into late adolescence and adulthood. The study group
concluded that small size at birth and childhood stunting were linked with short
adult stature, reduced lean body mass, less schooling, diminished intellectual

6
functioning, reduced earnings and lower birth weight of infants born to women who
themselves had been stunted as children. Recent evidence also indicates that
children born to women who are stunted are at greater risk of dying than children of
mothers with normal height(Ozaltin et al., 2010). Experimental studies have shown
that prenatal or postnatal nutritional deficits may program adult size, metabolism,
blood lipids, diabetes, obesity, blood pressure, glomerular hypertrophy,
atherosclerosis, behavior, and learning (Cottrell and Ozanne, 2008).
2.2 Types of malnutrition
The World Food Program, a United Nations agency, has identified five main types
of malnutrition as the deadliest forms: protein energy malnutrition, in which the
body lacks sufficient quantities of all major macronutrients, and deficiencies in
iron, vitamin A, iodine and zinc (WFP, 2011).
2.2.1 Kwashiorkor
Kwashiorkor usually refers to acute PEM and can develop within a few weeks. All
systems and functions are affected in kwashiorkor. No single etiological agent is
responsible. It is difficult to determine which factors are major contributors and
which are responses. Oedema with weight loss has been accepted as the main
criteria to identify kwashiorkor. Kwashiorkor is more prevalent in children who are
stunted or wasted but it can occur in children of normal size (Jackson and Golden,
1991).
The main symptoms of Kwashiorkor are given bellow (Srilakshmi, 2016):
Low body weight inspite of oedema, pitting oedema is appears in feet and
legs.
Puffy face
Growth failure
Muscle wasting with oedema
Mental change like apathy and Irritability
Scaly pigmentation

7
2.2.2 Marasmus
The term ‗marasmus‘ is derived from the Greek word meaning ‗to waste‘. It occurs
due to the deficiency of protein. It is most predominant form of PEM in developing
countries. Marasmus is commonly seen in babies whose mothers had inadequate
breast milk and occurs mostly during the child‗s first year. It may also occur when
there is too long a reliance on breast milk without complementary solid foods.
Improper use of bottle-feeding is closely associated with marasmus, especially in
urban areas (FAO, 1997).
The main symptoms of marasmus are given below (Srilakshmi, 2016):
Severe wasting of muscle mass and growth retardation
Shrunken eyeball
Depressed cheeks
Ribs becomes prominent
Wrinkled skin
Loss of subcutaneous fat
2.2.3 Marasmic kwashiorkor
The term marasmic kwashiorkor is used to describe the wasted form of PEM (as
with marasmus, there is no subcutaneous fat), which has the characteristics of
dermatoses and/or oedema that is seen with kwashiorkor. Pure conditions of
marasmus and kwashiorkor are uncommon as there are many cases which are not
purely one or the other, but present rather with signs of both. This can be due to
changes in diets and seasons (Torún, 2006).
2.2.4 Vitamin A deficiency
Vitamin A deficiency is one of the most common vitamin deficiencies in children
throughout the developing world. Sixty-nine percentages of children in Southeast
Asia have vitamin A deficiency (Ramkrishna, 2002). Deficiency of vitamin A can
lead to blindness i.e. Xerophthalmia (Ramkrishna, 2002), disease mobilization of
iron from stores and impair the immune system. Vitamin A is integral to the
mucosal lining of small intestine that protects the body from bacteria; thus vitamin
A deficiency is associated with higher risk of diseases, such as measles and malaria
(Bhaskaram, 2002).

8
A specific consequence of vitamin A deficiency is xerophthalmia, a severe eye
disorder and a primary cause of childhood blindness, which is responsible for
350,000 cases of blinding in children worldwide every year (Whitcher et al., 2001).
The prevalence of severe corneal xerophthalmia usually peaks at 2 to 3 years of
age, but the prevalence of mild xerophthalmia increases with age beyond 5 years,
probably because vitamin A deficiency builds up over time due to a chronic
shortage of the vitamin (West and Darnton-Hill, 2008). In addition to causing
reduced immune competence and eye disease, vitamin A deficiency is likely to
negatively influence iron status (Underwood and Arthur, 1996). Intervention
studies showed that vitamin A supplementation or fortification can contribute to
anemia control efforts by increasing hemoglobin levels in preschool and school-
aged children (Mohanram et al., 1977).
2.2.5 Iron deficiency anemia (IDA)
Anemia is characterized by a low level of hemoglobin in the blood. It is a major
health problem, especially among young children and pregnant women. Anemia
may lead to maternal mortality, spontaneous abortions, premature births, and low
birth weight. The most common cause of anemia is inadequate dietary intake of
nutrients necessary for synthesis of hemoglobin, such as iron, folic acid, and
vitamin B12 (MoHP, 2012). Iron deficiency is one of the 10 leading risk factors
contributing to the global burden of disease, mainly in Asia and Africa (WHO,
2002). IDA can lead to reduced muscle function and work capacity and less
explorative behavior in school-aged children (Zimmermann et al., 2000). It is also
consistently associated with impaired cognitive function and lower school
performance in school aged children (Sungthong et al., 2002).
2.2.6 Iodine deficiency disorder
Iodine deficiency disorders (Hiddinnott and Yohannes) are the world‘s leading
cause of preventable mental retardation and impaired psychomotor development in
young children contributing to poor school performance, reduced intellectual
ability, and impaired work performance. IDD also may cause cretinism. It increases
the risks of still birth and miscarriage in pregnant women. Iodine deficiency is most
commonly and visibly associated with goiter. In Nepal, universal iodization of all
edible salt is the key intervention implemented to control IDD. Other strategies

9
include advocacy at national and district levels, mass media campaigns to promote
the use of packet iodized salt and awareness rising among health workers and the
general public. In MFWR of Nepal, it shows that very small proportion of
households (0.2%) had no salt available and salt was found to be adequately
iodized in half of interviewed households (50%), i.e. containing 15 ppm or more of
iodine (NMISC, 2010). One-quarter of children ate iron-rich foods in the day
before the survey, and only 3% were given iron supplements in the week before the
survey (MoHP, 2012).
Iodine deficiency is evidently associated with deficits in cognitive function as well.
There is evidence from two meta-analyses showing that the intelligence quotients
of young and school-aged children from iodine-deficient regions were 12.5 and
13.5 points lower, respectively, than those of children from iodine sufficient
regions (Qian et al., 2005).
2.2.7 Zinc deficiency
Zinc helps cells to divide and grow and assists the body in healing wounds. It is
also necessary for proper function of body immune system. Deficiency of zinc
includes frequent infections, hair loss, poor appetite, problems in tasting and
smelling and long healing times for wounds. Zinc is found in nuts, legumes, yeast,
whole grains, beef, pork and lamb (WFP, 2011).
Zinc deficiency may negatively influence vitamin A absorption, transport, and
utilization, especially in marginally nourished individuals, leading to secondary
vitamin A deficiency (Christian and West 1998). This might suggest that zinc
deficiency can limit the health effect of vitamin A supplementation alone in
individuals with coexisting zinc and vitamin A deficiency. Supplementation of
malnourished children with zinc, on the other hand, might improve not only zinc
but also vitamin A status (Rahman et al., 2002).

10
2.3 Causes of malnutrition
There are 3 different causes of malnutrition and is classified as immediate,
underlying and basic as shown in Fig. 2.1
Source: (UNICEF, 1998)
Fig. 2.1 Conceptual framework of malnutrition
2.3.1 Immediate causes of malnutrition
The immediate causes of malnutrition are inadequate food intake and disease and
create a vicious cycle in which diseases and malnutrition exacerbate each other.
Malnutrition lowers the body‘s ability to fight against infection resulting into
frequent episodes of illness. Thus, inadequate food intake and diseases must be
both addressed to support recovery from malnutrition (UNICEF, 1998).
2.3.2 Underlying causes of malnutrition
The three major underlying causes of malnutrition include inadequate household
food security, limited access to adequate health services and/or inadequate
environmental health conditions and inadequate care in the households and at
community level especially with regards to women and children (UNICEF, 1998).
2.3.3 Basic causes of malnutrition
The basic causes of malnutrition in a community originate at the regional and
national level where strategies and policies that affect the allocation of resources
(human and, economic, political and cultural) influence what happens at
community level. Geographical isolation and lack of access to market due to poor
infrastructure can have a huge negative impact on food security, access to
Immediatecauses
Underlyingcauses
Basiccauses
Formal and informalinfrastructure, political ideology,
economic structure, resources
Household foodsecurity
Health care andenvironment
Social and careenvironment
Nutritionaldeficiencies
Inadequatefood intake
Diseases andrecurrent infections

11
healthcare services as well as healthy environment. The above model characterizes
the correlates of malnutrition as factors that impair access to food, maternal and
child care, and health care. It is these very factors that impact the growth of
children. Consequently, the assessment of children‘s growth is a suitable indicator
for investigating the well-being of children, and for examining households‘ access
to food, health and care (UNICEF, 1998).
2.4 Consequences of malnutrition
2.4.1 Physical and cognitive development
Cognitive development is influenced by many factors, including nutrition. There is
an increasing body of literature that suggests a connection between improved
nutrition and optimal brain function. Nutrients provide building blocks that play a
critical role in cell proliferation, DNA synthesis, neurotransmitter and hormone
metabolism, and are important constituents of enzyme systems in the
brain(Bhatnagar and Taneja, 2001)(Lozoff and Georgieff, 2006)(Zeisel,
2009).Brain development is faster in the early years of life compared to the rest of
the body (Benton, 2010a), which may make it more vulnerable to dietary
deficiencies.
Significant brain formation and development takes place beginning from the time
the child is in the womb. Early studies of malnourished children showed changes in
the developing brain including a slower rate of growth of the brain, lower brain
weight, thinner cerebral cortex, decreased number of neurons, insufficient
myelinization and changes in the dendritic spines. More recently, neuro-imaging
studies have found severe alterations in the dendritic spine apparatus of cortical
neurons in infants with severe protein calorie malnutrition. These changes are
similar to those described in patients with mental retardation of different causes
(Bernitez-Bribiesca et al., 1999).
2.4.2 School performance
Ross and Mirowsky (1999) state ―Schooling builds human capital - skills, abilities,
and resources—which ultimately shapes health and well-being.‖ Indeed, more
education has been linked to better jobs, higher income, higher socio-economic
status, better health care access and housing, better lifestyle, nutrition, and physical

12
activity (Florence et al., 2008)which are all well-known health determinants.
Recent studies have found that severe stunting in the first two years of life is
strongly associated with lower test scores in school-age children (age 8-11).
2.4.3 Economic productivity
Improving nutrition in early childhood leads to substantial increases in wage rates
which suggest that investments in early childhood nutrition can be long term
drivers of economic growth. This is according to study done on effect of a nutrition
intervention on economic productivity in Guatemalan adults which showed an
increase of US dollars 0.67 per hour (46%increase in average wages ) among those
who received a more nutritious supplement compared to those who received a less
nutritious supplement (Hoddinott et al., 2008).
2.5 Intergenerational cycle of malnutrition
Source: (ACC/SCN, 1992)
Fig 2.2 The intergenerational cycle of growth failure
The intergenerational cycle of growth failure explains how growth failure is
transmitted across generations through the mother. Children born with a low birth
weight are more likely to have growth failure during childhood. Thus, in turn, girls
born with a low birth weight are more likely to become small adult women. This
cycle is accentuated by high rates of teenage pregnancy, as adolescent girls are
even more likely to have low-birth-weight babies. Low birth weight is a baby born
weighing less than 2.5 kg. Studies revealed that birth weight can be rapidly

13
improved, even in populations of short adult women, and that improving the diet,
both in quantity and quality, be it through food or micronutrient supplementation,
fortification with micronutrients, or both, can help achieve this, especially if the
pre-pregnancy nutritional status of the mother is taken into account .There is
growing evidence that improving the quality of the diet of the mother during the
first half of pregnancy can have as big an effect on birth weight as providing food
supplements later in pregnancy. Certainly, the risk of delivering a low-birth-weight
baby can be determined very early in pregnancy (G. C. S. Smith et al., 2002), and
the influence of maternal nutritional status on pregnancy outcomes is more
important in early rather than late pregnancy (Neufeld et al., 2004).
2.6 Malnutrition and Infection
The complex interaction between infection and malnutrition creates a hostile
environment that perpetuates a vicious circle that leads to the two entities
benefiting from each other. Some of the phenomenon involved during different
parts of the cycle includes decreases in the activity of macrophages, diminishment
of the inflammatory response, and a reduction in the capacity to create specific
antibodies. However, there are two effects that can occur in the presence of both
malnutrition and infection. The first one is the synergistic effect, and it happens
when an infection worsens the malnutrition or when the malnutrition contributes to
decreasing the immune response to infection. The second effect is an antagonist
mechanism, which occurs less frequently than the synergistic effect. The
antagonistic mechanism happens when malnutrition decreases the multiplication of
the agent. Malnutrition can make a person more susceptible to infection, and
infection contributes to malnutrition, which causes a vicious cycle as shown in the
fig 2.3 (Rodriguez-Morales et al., 2016).

14
Fig 2.3 Malnutrition and infection cycle
2.7 Nutritional status
Nutritional status is the current body status of a person or a population group,
related to their state of nourishment (the consumption and utilization of nutrients).
The principal aim of assessing the nutritional status of a community is, to map out
the magnitude and geographical distribution of malnutrition as a public health
problem, to discover and analyze the ecological factors that are directly or
indirectly responsible, and, where possible to suggest appropriate corrective
measures, preferably capable of being applied with continuing community
participation (WHO, 1996).
This is determined by a complex interaction between internal/constitutional factors
and external/environmental factors. Some of these internal factors include age, sex,
nutrition, behaviour, physical activity and diseases while the external factors
include food safety, cultural, social and economic circumstances. There is increased
risk of malnutrition than over-nutrition in children from poor socioeconomic
families where the nutrition intake is reduced (Aziz and Devi, 2012). Some disease
conditions can also cause reduced absorption of nutrients in the body leading to
malnutrition (Katz and Weaver, 2014).
2.8 Factors affecting Nutritional status
There are various other factors that affect the nutritional status like food availability
and its distribution, food intake, source of income and purchasing power, family
size, illiteracy, socio-cultural and religious faith, birth order, environmental hygiene

15
and health facility. The main reasons of nutritional insufficiency in developing
country like Nepal are poverty, lack of food security and nutrition education
(Devkota et al., 2015). The factors that affect the nutritional status are discussed
below:
1. Inadequate dietary intake
According to FAO (2011), dietary diversity reflects the nutrient quality of an
individual‘s diet. A study on Iran and India reported that increasing dietary
diversity scores (DDS) were associated with higher BMI of children (Hooshmand
and Udipi, 2013).
2. Impact on immune function
Poor dietary intake can deteriorate immune response through alterations in mucus
membranes of the body. Suppressed immunity thus raises the risk of getting
infection. As soon as immune function is depressed, it may result to infectious
disease. Along with the occurrences infectious diseases, malnutrition can
furthermore increase the severity and duration of illness (Bhatta et al., 1998).
3. Infections
School-age children have been reported to have the highest intensity of worm
infection and are detrimental to their physical growth and educational
advancement. Severe anemia that is caused as a result of worm infections usually
result in undernutrition, disability as well as pain among children (Project, 2008).
Malnutrition is associated with suffering from childhood diseases such as diarrhea
or other severe illness. Children who suffer from repeated episodes of diarrhea or
Acute Respiratory Infections (ARI) are more likely to suffer from malnutrition.
This is partly because of reduced appetite, less quantity of fluids and foods offered
during diarrhea and other sickness (Sah, 2004).
4. Socio-economic status
Nutritional status of children does reflect the socioeconomic status of the family
and social wellbeing of the community on a whole. The surrounding environment
which is sometimes influenced by socioeconomic status also affects the nutritional

16
status of school aged children status (Srivastava et al., 2012). He also found that
mothers‘ educational status was a strong predictor of child nutritional status.
Malnutrition among children is directly or indirectly caused by mother‘s
educational and social status, food availability and access to safe water, these are
indicators of socioeconomic status (L. C. Smith and Haddad, 2000).
5. Physical activity
Physical activity and sedentary behaviours such as television viewing, using
computer or playing video games act as a key factors of current obesity epidemic
(Chung et al., 2012). Decreasing the level of physical activity has a significant role
in increasing childhood obesity rates (Bellows et al., 2013).
6. Water, sanitation and hygiene
The body‘s ability to properly absorb nutrients is affected by diarrhea, soil
transmitted helminth infections or parasitic intestinal worm infections and
environmental enteropathy (characterized by increased gut permeability and
nutrition malabsorption), all caused by inadequate sanitation, insufficient hygiene
and unsafe water (Checkley et al., 2008).
2.9 RDA of school aged children
Nutritional Requirements refers to the amount of food, energy and nutrient needed
on an average per day by specific group and sex categories to meet the needs of
healthy individuals for normal functioning of the body for work and growth (Burk,
1984).
The dietary requirement of school children aged 6-12 years is given below in Table
(Srilakshmi, 2014)

17
Table 2.1 Recommended dietary intake of nutrient for school children (ICMR-
2010)
Nutrients 6-9 years 10-12 years
Boys Girls
Calories (Kcal/day) 1690 2190 2010
Protein (g/day) 29.5 39.9 40.4
Fat(g/day) 30 35 35
Calcium(mg/day) 600 800 800
Iron(mg/day/day) 16 21 27
Vitamin A( µg/day) 600 600 600
Thiamine(mg/day) 0.8 1.1 1
Riboflavin(mg/day) 1 1.3 1.2
Nicotinic acid(mg/day) 13 15 13
Pyridoxine(mg/day) 1.6 1.6 1.6
Ascorbic acid(mg/day) 40 40 40
Folic acid(µg/day) 40 60 60
Vitamin B12(µg/day) 0.2-1 0.2-1 0.2-1
2.10 Nutritional status of women in Nepal
In contest of Nepal girls are married soon after the puberty and almost 40% of
women have their first child between the age of 15 and 19. The average family diet
is the regular food during the pregnancy period. On an average after 22 days of
giving birth, most of Nepalese women start their work on fields and they got the
same family diet. Most Nepalese women spent their lives in pregnancy and location
with 5 to 6 births. Thus whole life of most Nepalese women passes through poor
nutritional status and they are always malnourished (Dhakal, 1995). Most of the
women in Nepal lack both adequate calorie and micronutrients from their own
childhood that results in a very low average Body Mass Index (BMI) as compared
to their amount of work burden. A low BMI among mothers causes poor lactation
which leads to lowered growth rate in infants. This increases the risk of
complication during delivery, and can result in the death of both mothers and
children. Anemia is a severe public health problem in Nepal and pregnant women is

18
likely to result in a newborn with iron depletion. More than two thirds (67%) of
non- pregnant and 75% of pregnant women are anemic in Nepal. It is found that
18% of Nepalese mothers suffer from night blindness during pregnancy. Iodine
deficiency is also another nutritional problem in Nepal (Pandey, 2007). Similarly,
pregnancy induced hypertension (PIH) affects about 7% of first pregnancies and is
a leading cause of maternal morbidity and mortality. Eighteen percent of women of
reproductive age are thin or undernourished (BMI < 18.5 kg/m2). The proportions
of mild thinness (17.0-18.4 kg/m2) and moderate and severe thinness (<17 kg/m2)
are 12% and 7%, respectively in Nepal (MoHP, 2012).
2.11 Methods for assessing nutritional status
The assessment of nutritional status can be done using the following information
(WHO, 1966).
a) Direct method: Deals with the individual and measures objective criteria such as
Anthropometric, Clinical examination, Biochemical and Bio- physical parameters.
b) Indirect method: Use community indices that reflect the community nutritional
status or need e.g. Dietary intake, morbidity and mortality rates, as specific
mortality and vital statistics.
c) Ecological factors: e.g. Socio-economic status, housing and environmental
hygiene, health and education services, conditioning infection.
2.12 Nutritional status indicators
For studies of both individuals and populations, the anthropometric indices can be
compared to the reference population using percentiles or Z-score system derived
from the reference data. In most industrialized countries, percentiles are used,
whereas in low income countries, the use of Z-scores is preferred (Gibson, 2005).
Height- and weight based anthropometric indicators are used worldwide to
characterize the nutritional status of populations. As such, the SD of Z-scores can
be used as quality indicators for anthropometric data. Consequently, height-for-age
Z-scores (HAZ), weight-for-age Z-scores (WAZ), weight-for-height Z-scores
(WHZ) and body-mass-index-for-age Z-scores (BMIZ) are the widely used
indicators (Meia and Grummer-Strawna2007).

19
Z-score is defined as a score that indicates how far a measurement is from the
median, also known as standard deviation (SD) score and is often used to assess
anthropometric measures to help evaluate children‘s growth and nutritional status.
Compared to percentiles, Z-scores have a number of advantages: first, they are
calculated based on the distribution of the reference population (mean and standard
deviation), and thus reflect the reference distribution; second, as standardized
quantities, they are comparable across ages, sexes, and anthropometric measures;
third, Z-scores can be analyzed as a continuous variable in studies. In addition, they
can quantify extreme growth status at both ends of the distribution (Wang and
Chen, 2012).
The formula for calculating the Z-score is:
Z-score (or SD-score)= (observed value - median value of the reference population)
Standard deviation value of reference population
Interpreting the results in terms of Z-scores has several advantages as follows:
a) The Z-score scale is linear and therefore a fixed interval of Z-scores has a fixed
height difference in cm, or weight difference in kg, for all children of the same
age. For example, on the height-for-age distribution for a 36-month-old boy, the
distance from a Z-score of -2 to a Z-score of -1 is 3.8 cm. The same difference
is found between a Z-score of 0 and a Z-score of +1 on the same distribution. In
other words, Z-scores have the same statistical relation to the distribution of the
reference around the mean at all ages, which makes results comparable across
ages groups and indicators.
b) Z-scores are also sex-independent, thus permitting the evaluation of children's
growth status by combining sex and age groups
These characteristics of Z-scores allow further computation of summary statistics
such as means, standard deviations, and standard error to classify a population's
growth status (WHO, 2015). The WHO global database on child growth and
malnutrition practices a z-score cut-off point lesser than minus two SD to classify
low weight-for-age, low height-for-age and low weight-for-height as moderate and
severe malnutrition, and less than minus three SD to define severe under nutrition.

20
The cut-off point further than plus two SD categorizes high weight-for-height as
overweight in children. A main benefit of the z-score system is that a group of z-
scores can be exposed to summary statistics like mean and standard deviation. The
mean z-score, however less commonly used, has the benefit of describing the
nutritional status of the entire population directly without resorting to a subset of
those below a set cut-off. A mean z-score suggestively lower than zero-the
expected value for the reference distribution usually indicates that the whole
distribution has shifted downward, signifying that most of the individuals have
been affected. Using the mean z-score as an index of severity for health and
nutrition issues leads to the increase in awareness that, if a situation is severe, an
intervention is essential for the whole community, not only those who are
categorized as "malnourished" using the cut-off criteria (WHO, 1997). The
commonly used anthropometric measurements or indicators of nutritional status for
school aged children are briefly discussed in the following section:
a) Underweight: It denotes weight for age less than minus two standard deviations
(SD) of the WHO child growth standards median. Evidence has made known that
the mortality risk of children who are even mildly underweight is increased, and
severely underweight children are at even greater risk (WHO, 2010).
b) Stunting: It refers to height for age less than minus two SD of the WHO child
growth standards median. Children who suffer from growth retardation as an end
result of poor diets or frequent infections tend to be at greater risk for illness and
death. Stunting is the consequence of long-term nutritional deficiency that might
result delayed mental development, poor school performance and reduced
intellectual capacity. This at national level (WHO, 2010).
c) Overweight: It refers weight for height more than plus two SD of the WHO
child growth standards consecutively affects economic productivity median.
Childhood obesity is related with a higher probability of obesity in adulthood that
can result to a variety of disabilities and diseases, such as diabetes and
cardiovascular diseases. The risks for most non-communicable diseases as a
consequence of obesity depend partially on the age at onset and the duration of
obesity (WHO, 2010).

21
d) Thinness: It refers BMI for age less than minus two SD of the WHO child
growth standards median. Thinness indicates a recent and severe process of weight
loss, which is often connected with acute starvation and/or severe disease (WHO,
2010).
Table 2.2 Interpretation of cut-off points.
Moderate Severe
Stunting HFA < -2SD HFA < -3SD
Underweight WFA < -2SD WFA < -3SD
Thinness BFA < -2SD BMIFA < -3SD
(WHO, 2010)
2.13 Literature from previous studies
A cross sectional study was conducted in Lalipur district of Nepal among 319
children of aged 6-12 years showed that mean height, weight and BMI were high in
children from Chhetri ethnicity and low in Dalit children. BMI for age was less
than 5th percentile in 23.2% of children. The proportions of underweight and
stunted children were 10% and 8.3% respectively (Paudel et al., 2017).
A cross sectional study was conducted in 290 primary school children of age group
of 5 to 10 years selected from 6 public schools of PumdiBhumdi village of Kaski
district using simple random sampling revealed 35.4%, 44.2%, 12.3% prevalence
rate of underweight, stunting and wasting respectively. The socio demographic
factor significantly associated with underweight were family occupation (χ2 value
=15.679, P value=0.047) and economic status of family (χ2 value =15.464, P
value<0.001). Education status of mother (χ2 value =10.691, P value=0.014) was
significantly associated with wasting (Banstola and Acharya, 2015).
A cross-sectional study conducted on 438 rural school going children (169 male
and 259 female) with the age group 4-16 years children in Kavre district showed
prevalence of stunting, thinness and underweight to be 24.54%, 10.05% and
30.85% respectively (Mansur et al., 2015).
A cross-sectional study conducted on Western region of Nepal revelaed58% of
mothers of malnourished children did not have adequate knowledge regarding the
diet requirements of the child and the nutritional value of food items. There is a

22
highly significant association of maternal literacy, occupation, income and diet
knowledge on child malnutrition (Joshi et al., 2011).
A cross-sectional investigation on parents and children aged 6 to 13 years in
elementary schools in Makassar, Indonesia. The participants included 877 children
and their parents. The prevalence rates of underweight and overweight among the
children were 14.5% and 20.4%, respectively. Underweight was more prevalent in
boys. Factors such as mother‘s level of education, having an underweight father,
and playing outdoors on weekends for more than 2 hours were significantly
associated with underweight children. By contrast, mothers with high levels of
education, overweight parents, sleeping for less than 9 hours, and playing outdoors
on weekends for less than 1 hour were significantly associated with overweight
children (Syahrul et al., 2016)

23
Part-III
Materials and methods
3.1 Research Design
Cross-sectional study was carried out to assess the following information
a) Anthropometric measurement of primary level schools children between the
age group of
5- 10 yrs.
b) General survey of the situation of household belonging to the children under
study with the help of questionnaire.
3.2 Study area
The study was conducted in Gauradaha Municipality, Jhapa, Mechi zone, Nepal. It
is located in the Eastern Terai region as shown in Appendix-C.
3.3 Study variables
Study variables were categorized into two groups: dependent variable and
independent variable. 1. Dependent variables
i. Stunting
ii. Underweight
iii. Thinness
2. Independent variables
i. Demographic and socioeconomic characteristics
ii. Child characteristics
iii. Household characteristics
iv. Food preferences and physical activities
3.4 Target Population
The target population of the study was 5-10 yrs school children in Gauradaha
Municipality, Jhapa.

24
Inclusion criteria:
Students present at the day of survey and those of primary level and within age
group of 5-10 years.
Exclusion criteria:
Students absent at the day of survey and who does not belong to age group 5-10
years.
3.5 Sampling Technique
Cross-sectional descriptive study was conducted in Gauradaha Municipality.
Purposive sampling technique was used for the selection of the study site. Then by
using the simple random sampling method schools (private and public) were
selected from the list of schools. The students from both schools were selected on
the basis of their respective proportions. Then, students were selected from each
class by using lottery method by drawing out the roll numbers of students present in
the class.
3.6 Sample size determination
The sample size was determined by using a single proportion formula assuming
the prevalence rate of malnutrition to be 13%% in the survey area, 95% confidence
interval (Hoddinott et al.), 5% margin of error (d) and 5% non-response rate was
added to the total calculated sample size.
Sample size n= z2. P (1-p)/m
2
Where, n = required sample size
z= confidence interval at 95% (standard value of 1.96)
p = estimated prevalence of malnutrition in project area
m = margin of error at 5% (standard value of 0.05)
Here, p is estimated on the basis of the research conducted by (Joshi et al., 2011)in
schools of Kaski district of western Nepal. The result obtained from his study
showed that 13% of students were found to be stunted. Thus, 13% is taken as the

25
estimated prevalence of malnutrition (p) for the calculation of sample size for this
research study.
The sample size was obtained as below,
n = z2. P. (1- P) / m
2
= (1.962 * 0.13 * 0.87) / 0.05
2
= (3.8416 * 0.13 * 0.87) / 0.0025
= 0.4344/0.0025
= 173.6
= 174
As some of the parents may refuse or may not be reachable so considering non-
response rate as 5%, the adjusted sample size is calculated to be 174+8.7=182.7.
Therefore the sample size was 182. Here 180 samples so selected were divided into
two halves, 90 in each. 90 samples were taken from the 5 public schools (18 from
each) and another 90 from the 5 private schools (18 from each).
3.7 Research Instruments
Equipment used during the survey was:
1. Digital weighing machine: Micro life Pvt. Ltd. Having capacity of 100kg (1
piece).
2. Height measuring scale (Stadiometer):- The height measuring tape of 5ft
capacity (1 piece). The minimum measurement capacity was 0.1cm.
3. Questionnaire:- A well designed set of questionnaire to collect information
on household characteristics, child characteristics etc.
3.8 Pre-testing
The study site was visited first and designed questionnaire was pre- tested among
school children of 5-10 yrs. age group before conducting the final survey. The pre-
testing was conducted to establish accuracy of questions and clarity and to check
for consistency in the interpretation of questions and to identify ambiguous items.

26
After review of instruments all suggested revisions were made before being
administered in the actual study.
3.9 Validity and Reliability
To ascertain the degree to which the data collection instruments will measure what
they purposed to measure, the instruments were validated by a group of
professionals from Central Campus of Technology, Department of Nutrition and
Dietetics. The questionnaire was also pre-tested prior to data collection to ascertain
content and face validity.
Reliability refers to quality control measure of data collected. Before data
collection the research assistants were intensively trained on the objectives of the
study and on data collection techniques. The process of data collection involved the
principal researcher and two research assistants. Questionnaire was checked daily
for completeness, consistency and clarity as mentioned earlier.
3.10 Data collection techniques
Primary data was collected using structured questionnaire and anthropometric
measurement. Interview with students was done to obtain socio-demographic and
economic information.
Secondary data was obtained from Municipality office, Nepal Demographic Health
Survey (NDHS), Central Bureau of Statistics, and key informants like Female
Community Health Volunteers (FCHV), local leaders etc.
The structured questionnaires comprised mainly of details on household profiles
like age, sex, education level and occupation of household members and household
size. Data on sources of income was also collected. The date of birth for each child
was inquired from the students and school registers were also checked.
Anthropometric measurements taken for the children included:
a) Height: The height of children was measured using stadiometer placed on hard
flat surface with line of sight perpendicular to the horizontal surface. Children were
made to stand bare foot on height board and with feet parallel and joined together
and with heels and buttock touching the wall. It was made sure that head was held
erect and hands were hung closely at the sides. The child‘s height was measured to

27
the nearest one decimal place.
b) Weight: Weight was measured by electronic digital weighing scale and read to
the nearest 0.1 kg with minimal clothing and no shoes. Calibration was done before
and after weighing every child by setting it to zero.
3.11 Data Analysis
The collected data was first edited, organized, coded and entered into Microsoft
excel 2010. The data were then entered into statistical package for social science
(SPSS) version 20.0. and analyzed by using both descriptive and inferential
statistics. Anthropometric data were analyzed by using WHO Anthro plus v1.0.4.
Chi-square test was used to test the association between dependent and independent
variables and also for the factors associated with dependent variable.
3.12 Logistical and Ethical considerations
Permission to conduct survey in Gauradaha Municipality was obtained from the
office. Similarly, clearance was obtained from principals of respective schools
selected for study. The study participants were provided with an oral consent prior
to the survey. Respondents were assured that the data collected was for the purpose
of the study and to be treated with the uttermost confidentiality.

28
PART- IV
Results and discussion
The cross- sectional descriptive study was conducted in Gauradaha Municipality,
Jhapa with 180 sample size to compare the nutritional status of 5-10 yrs primary
level school studying in private and public schools. The results and findings of the
study are:
4.1 Demographic and socio-economic characteristics
Table 4.1 Distribution of caste and religion of the surveyed population (n=180)
Variables
Public school
Private school
Frequency Percent Frequency Percent
Caste
Brahmin 32 35.6 17 18.9
Magar 2 2.2 4 4.4
Chettri 34 37.8 19 21.1
Limbu 2 2.2 5 5.6
Dalit 20 22.2 45 50
Religion
Hindu 87 96.7 84 93.3
Christian 3 3.3 4 4.4
Buddhist 0 0 2 2.2
Out of 180 surveyed children, 90 children were from public school and 90 were
from private school. In terms of caste children public school comprises 35.6%
Brahmin, 2.2% Magar, 37.8% Chhetri, 2% Limbu and 20% Dalit. Similarly,
children from private school comprise 18.9% Brahmin, 4.4% Magar, 21.1%
Chhetri, 5.6% Limbu and 50% Dalit. 96.7% of children from public school were
Hindu, 3.3% were Christian and none of them were Buddhist whereas 93.3% of
children from private school were Hindu, 4.4% were Christian and 2.2% were
Buddhist as shown in the Table 4.1.

29
Similar finding was observed by the study of primary school children in
PhumdiBhumdi village of Kaski district where majority of respondents, (95.9%)
were Hindu, (3.1%) Christian and only (1%) were Buddhist. The major ethnic
group was upper caste group as (54.9%), followed by (33.3%) so called dalits and
relatively advantaged and disadvantaged janajati consisted of 20(6.9%) and
16(4.9%) respectively(Banstola and Acharya, 2015). A cross-sectional study
conducted in all the households of Dukuchhap village in Lalitpur district of Nepal
showed that mean height, weight and BMI were high in children from Chhetri
community and low in Dalit children. BMI for age was less than 5th
percentile in
23.2% of children. The proportions of underweight and stunted children were 10%
and 8.3% respectively (Paudel et al., 2017).
Table 4.2 Economic characteristics of the surveyed population (n = 180)
Variables Private school
Public school
Frequency Percent Frequency Percent
Father's occupation
Agriculture 22 24.4 22 24.4
Business 19 21.1 12 13.3
Foreign employment 25 27.8 30 33.3
Service 10 11.1 4 4.4
Labor 5 5.6 18 20
Others 9 10 3 3.3
Mother's occupation
Housewife 70 77.8 67 74.4
Business 12 13.3 7 7.8
Foreign employment 4 4.4 6 6.7
Service 1 1.1 1 1.1
Labor 0 0 .00 8 8.9
Others 3 3.3 1 1.1
Annual income
1 lakh to 3 lakhs 35 38.9 66 73.3
More than 3 lakhs 55 61.1 24 26.7
Table 4.2 showed the major occupation of their father, mother and their annual
income. Most of the fathers of children studying in private school had gone to
foreign employment (27.8%) and the least percentage of their father‘s job was labor
30
(5.6%). Similarly, 24.4% were farmers, 21.15 were businessman, 11.1% were at
government service and only 10% were engaged in other activities. Similarly,
majority of the fathers of children studying in public school had gone to foreign
employment (33.3%), 24.4% were engaged in agriculture, 13.3% were engaged in
business, 4.4% were engaged in government service, 20% were labor and 3.3%
performed other activities. Most of the mothers of students from private school
were housewife (77.8%), 13.3% had their own business, 4.4% were gone for
foreign employment, 1.1% worked at government service, 3.3% were engaged in
other activities and none of them were labor. Majorities (61.1%) of the children
from private school belong to the household whose annual income was more than 3
lakhs and 38.9% of families had income in between 1-3 lakhs. Similarly, majorities
(73.3%) of children from public school belong to the household whose annual
income is in between 1-3 lakhs and only 26.7% of children belong to family whose
annual income was more than 3 lakhs.
A cross sectional study was conducted in 290 primary school children of age group
of 5 to 10 years selected from 6 public schools of PumdiBhumdi village of Kaski
district using simple random sampling revealed socio demographic factor
significantly associated with underweight were family occupation (χ2 value
=15.679, P value=0.047) and economic status of family (χ2 value =15.464, P
value<0.001). Education status of mother (χ2 value =10.691, P value=0.014) was
significantly associated with wasting (Banstola and Acharya, 2015).

31
Table 4.3 Socio-demographic characteristics of the surveyed population (n =180)
Variables Private school
Public school
Frequency Percent Frequency Percent
Family Type
Nuclear 48 53.3 57 63.3
Joint 42 46.7 33 36.7
Father's education
Primary 12 13.3 35 38.9
Secondary 49 54.4 37 41.1
Higher secondary 29 32.2 7 7.8
Informal education 0 0 11 12.2
Mother's education
Primary 14 15.6 43 47.8
Secondary 50 55.6 27 30
Higher secondary 26 28.9 8 8.9
Informal education 0 0 12 13.3
From the above Table (4.3) 53.3% of children were from nuclear families and 46.7
% of children were from joint families who belong to private school while children
belonging to public school, 63.3% were from nuclear families and 36.7% were
from joint families. About more than half (54.4%) of the fathers of children
studying in private school had passed secondary education, only 13.3% and 32.2%
had passed primary and higher secondary level of education. Most of the fathers of
children studying in public school had passed secondary education (41.1%) and
only least (7.8%) of them had passed higher secondary education level. Similarly,
38.9% of them had passed primary education and 12.2% of them had received
informal education. 15.6% of mothers of private school children had passed
primary level, 55.6% had passed secondary level, 28.9% had passed higher
secondary level while 47.8% of mothers of public school children had passed
primary level, 30% had passed secondary level, 13.3% had received informal
education and 8.9% had passed higher secondary level.
A cross-sectional study conducted on Western region of Nepal revelaed58% of
mothers of malnourished children did not have adequate knowledge regarding the
diet requirements of the child and the nutritional value of food items. There is a
highly significant association of maternal literacy, occupation, income and diet
knowledge on child malnutrition. Economic status of the household is associated

32
with the general health and development status of the family. Literate mothers
adopt many improved behaviors related to maternal and child health care, feeding
and eating practices which ultimately affect the nutritional status of children (Joshi
et al., 2011).
4.2 Child characteristics
Out of 90 children from public school 40% were male and 60% were female.
Similarly, out of 90 children from private school 52.2% of children were male and
47.8% were female. Among sampled population from private school 46 (51.1%)
were first child, 33 (36.7%) were second child, 7 (7.8%) were third child and only
few i.e.4 (4.4%) were fourth child according to birth order. Similarly, among
sampled population from public school 28 (31.1%) were first child, 47(52.2%)
were second child, 9(10%) were third child, 3(3.3%) were fourth child and 1.1%
were fifth, sixth and seventh child as shown in table (4.4).

33
Table 4.4 Child characteristics of the surveyed population (n=180)
Private school Public school
Variables Frequency Percent Frequency Percent
Sex
Female 43 47.8 54 60
Male 47 52.2 36 40
Birth order
First 46 51.1 28 31.1
Second 33 36.7 47 52.2
Third 7 7.8 9 10
Fourth 4 4.4 3 3.3
Fifth 0 0 1 1.1
Sixth 0 0 1 1.1
Seventh 0 0 1 1.1
Age classification
5 to 8 years 16 17.8 21 23.3
8 to 10 years 74 82.2 69 76.7
Only 17.8% of children from private school were in between the age group of 5-8
years and 82.2% were in between the age group of 8-10 years. Out of sampled
children from public school, percentage of children belonging to age group 5-8 yrs
was 23.3% and 76.7% belongs to 8-10 yr age group.

34
4.3 Household characteristics
Table 4.5 Household characteristics of the study population (n=180)
Private school Public school
Variables Frequency Percent Frequency Percent
Type of house
Cemented 59 65.6 29 32.2
Wooden 28 31.1 30 33.3
Bamboo and Soil 3 3.3 31 34.4
Purification of water
Yes 57 63.3 31 34.4
No 33 36.7 59 65.6
Salt Intake
Iodized 90 100 90 100
Non-Iodized 0 0 0 0
Toilet facility
Yes 90 100 90 100
No 0 0 0 0
The household characteristics as shown in the above Table 4.5 showed 65.6% of
children studying in private school had cemented house, 31.1% had wooden house
and 3.3% had house made up of bamboo and soil. Similarly, 32.2% of children
studying in public school had cemented house while 33.3% had wooden house and
34.4% had house made of bamboo and soil. Majorities (63.3%) of household of
private school children adopted water purification technique and few household
(36.7%) drink water directly without purifying. Whereas only few (34.4%)
household of public school children purify water before drinking and more than
half (65.%) of the household did not purify water. All the household of sampled
population used iodized salt and had toilet facility.
Majority of Nepalese households consume salt with iodine; 95% of children live in
households that consume iodized salt. The percentage of children living in
households that use iodized salt is lowest in State 6 (82%), in the Mid-Western
region, and in the lowest wealth quintile. Three in five Nepalese households (62%)
have improved sanitation facilities. 38% of households have unimproved sanitation
facilities with 15% having no facilities (MoH et al., 2016).

35
According to Nepal Multiple Indicator Cluster Survey, 93% of population used
drinking water from an improved drinking water source. Among those who did not
have access to an improved drinking water source, only 14 percent used an
appropriate water treatment method. About 67 percent of users of improved
drinking water sources had a water source directly on their premises. The education
level of the household head and the household‘s wealth status were both positively
associated with having a water source on the premises. Eight out of 10 households
(84 percent) with unimproved sources of drinking water had E. coli, whereas it
dropped to 70 percent for those households that had an improved source of drinking
water (CBS/UNICEF, 2015).
4.4 Food preferences
Table 4.6 Food preferences of the surveyed population (n=180)
Private school Public school
Variables Frequency Percent Frequency Percent
Food Source
Self-production 78 86.7 78 86.7
Purchasing from market 12 13.3 12 13.3
Food preferences
Vegetarian 10 11.1 3 3.3
Non vegetarian 80 88.9 87 96.7
Water Intake
1 glass 21 23.3 21 23.3
2-4 glasses 68 75.6 68 75.6
More than 8 glasses 1 1.1 1 1.1
About 86.7% of children from both public and private school belong to the
household producing their own food themselves while only 13.3% of them bought
food from market. Similarly, 11.1% of children from private school and 3.3% of
children from public school were vegetarian while 88.9% of children from private
school and 96.7% of children from public school were non-vegetarian. Majorities
(75.6%) of children from both type of schools drink 2-4 glasses of water per day,
23.3% of them drink only 1 glass of water per day and very few (1.1%) of them
drink more than 8 glasses of water per day.

36
Encouraging children to drink fluid regularly during physical activity and to drink
several glasses of water or other fluid after the physical activity prevents them from
dehydration (Agriculture and Services, 2010).
4.5 Physical activities
Based on the means of transportation from school to home among children from
private school, 34.4% of them went by walking, 28.9% went by bicycle, 22.2%
went by private vehicles and only 14.4% went by public vehicles. Similarly among
children from public school, 82.2% went by walking, 12.2% went by bicycle, 4.4%
went by private vehicle and very few (1.1%) went by public vehicles.
Table 4.7 showed the homework time per day, 52.2% of children from private
school completed their homework within 1 to 2 h, 31.1% completed their
homework at less than 1 h and 16.7% of them took to complete their homework for
more than 2h. Similarly, 55.6% of children from public school completed their
homework within 1 to 2 h, 42.2% completed their homework at less than 1 h and
2.2% of them took to complete their homework for more than 2h.

37
Table 4.7 Physical activities of the surveyed populations (n=180)
Private Public
Variables Frequency Percent Frequency Percent
Means of transportation from
school to home
private vehicles 20 22.2 4 4.4
public vehicles 13 14.4 1 1.1
Bicycle 26 28.9 11 12.2
Walking 31 34.4 74 82.2
Homework time per day
1 to 2 h 47 52.2 50 55.6
less than 1 h 28 31.1 38 42.2
more than 2 h 15 16.7 2 2.2
TV and computer time
1 to 2 h 34 37.8 47 52.2
less than 1 h 54 60 40 44.4
more than 2 h 2 2.2 3 3.3
Activities in break time
Sit, eat, talk, study 42 46.7 27 30
Walk 0 0 3 3.3
Play, Run 48 53.3 60 66.7
Among children from private school 60% of them spend less than 1h on Television
(TV) and computer, 37.8% spend 1-2h per day and 2.2% spend more than 2h per
day. Similarly, 44.4% of children from public school spend less than 1h on
Television (TV) and computer, 52.2% spend 1-2h per day and 3.3% spend more
than 2h per day. More than half (53.3%) of children from private school involved in
playing and running activities in break time while 46.7% of them just sit, eat, talk
and study in break time. 66.7% of children from public school engaged in different
activities during break time like playing and running, 30% of them performed
activities like sitting, eating, talking and studying and only 3.3% of them were
involved in walking.

38
4.6 Nutritional status of primary level school children aged 5-10 years of
Gauradaha Municipality
Fig 4.1Nutritional status of 5-10 years children of both private and public school of
the study area
Among 180 studied populations from both private and public school, the overall
prevalence of stunting, thinness and underweight was found to be 41.1%, 20% and
37.7% respectively. From the above Fig.4.1 children from private school comprises
20% of stunting, 7.8% of thinness and 13.3% of underweight whereas children
from public school comprise 21.1% of stunting, 12.2% of thinness and 24.4% of
underweight. The prevalence of malnutrition was higher in children from public
school compared to that of children from private school.
21.1
12.2
24.4
20
7.8
13.3
0
5
10
15
20
25
30
Stunting Thinness Underweight
Per
centa
ge
Public Private

39
4.7 Distribution of malnutrition according to age group of both private and
public school
Table 4.8 Age wise distribution of malnutrition of children from public school
(n=90)
HAZ BAZ WAZ
Age (Yr.) N Stunted Normal Thin Normal UnderWt Normal
5-8 42 6.70% 40% 6.70% 40% 7.80% 38.90%
8-10 48 14.40% 38.9% 5.60% 47.80% 16.70% 36.70%
Out of 180 surveyed children, 90 children were from public school and the study
showed that highest percentage of stunting and underweight was found in the age
group of 8-10 years i.e.14.4% and 16.7% respectively. Similarly, children who
belong to 5-8 yrs age group were found to be more thinned i.e. 6.7% as shown in
the Table above 4.8.
Table 4.9 Age wise distribution of malnutrition of children from private school
(n=90)
HAZ BAZ WAZ
Age (Yr.) N Stunted Normal Thinned Normal Underweight Normal
5-8 41 5.60% 40% 2.20% 43.30% 3.30% 42.20%
8-10 49 14.40% 40% 5.60% 48.90% 10% 44.40%
Out of 180 surveyed children, 90 were from private school and the study revealed
that highest percentage of stunting (14.4%), thinness (5.6%) and underweight
(10%) was found in the age group of 8-10 years than children belonging to the age
group of 5-8 years as shown in the Table (4.9).
4.8 Distribution of malnutrition according to gender of both private and
public school
Out of 180 studied population, 43 were females and 47 were males belonging to
private school whereas 54 were females and 36 were males belonging to public
school. The study result showed male child from both private and public school
were found to be more stunted, thinned and underweight than female child as
shown in the Table 4.10.

40
Table 4.10 Distribution of malnutrition according to gender of both private and
public school
Gender
N
HAZ
(%)
WAZ
(%)
BMIZ
(%)
Private
<-3 SD <-2SD <-3 SD <-2 SD <-3 SD <-2SD
Female 43 Nil 8.9 2.2 2.2 Nil 2.2
Male 47 1.1 10 2.2 6.7 1.1 4.4
Public
Female 54 6.4 3.2 2.1 6.4 1.1 2.1
Male 36 1.1 9.6 3.2 11.7 1.1 7.4
4.9 Distribution of malnutrition according to height for age of public school
Fig 4.2 Distribution of height for age Z-score curve of public school children with
reference to WHO standard
The height for age Z-score curve of public school children is slightly skewed to the
left side of WHO standard curve as shown in the Fig 4.2. The median height for age
z-score was found to be -1.2 which is less by 1.2 with reference WHO standard. A
HAZ < -2SD defines the presence of chronic malnutrition. Among 90 surveyed
populations from public school of Gauradaha Municipality, the prevalence of

41
stunting was found to be 21.1% where 12.8% were moderately stunted and 7.4%
severely stunted.
4.10 Factors associated with stunting of public school children
Table 4.11 Result of chi-square test for factors associated with stunting of public
school
Variables
Height for Age ² value P-
value
Stunted
n (%)
Normal
n (%)
Gender Female 9 (16.7%) 45 (83.3%) 1.6 0.206
Male 10 (27.8%) 26 (72.2%)
Type of house Cemented 4 (13.8%) 25 (86.2%) 2.123 0.346
Wooden 6 (20%) 24 (80%)
Bamboo and
soil 9 (29%) 22 (71%)
Purification of
water Yes 5 (16.1%) 26 (83.9%) 0.705 0.401
No 14 (23.7%) 45 (76.3%)
Food preferences Vegetarian 2 (66.7%) 1 (33.3%) 3.867 0.049*
Non-
vegetarian 17 (19.5%) 70 (80.5%)
Means of
transportation
Private
vehicle 1 (25%) 3 (75%)
Public vehicle 0 (0%) 1 (100%) 1.412 0.703
Bicycle 1 (9.1%) 10 (90.9%)
Walking 17 (23%) 57 (77%)
Type of game
usually played Outdoor 4 (44.4%) 5 (55.6%) 3.269 0.071
Indoor 15 (18.5%) 66 (81.5%)
*Statistically significant (P-value <0.05)
Vegetarian children were found to significantly associated (P=0.049) associated
with stunting. The result is in accordance with the study conducted among rural
school going children aged 4-16 yrs in Kavre district.(Mansur et al., 2015).

42
4.11 Distribution of malnutrition according to weight for age of public
school
Fig 4.3 Distribution of weight for age Z-score curve of public school children with
reference to WHO standard
The weight for age Z-score curve of public school children is slightly skewed to the
left side of WHO standard curve as shown in the Fig 4.3. The median weight for
age z-score was found to be -1.2 which is less by 1.2 with reference WHO standard.
A WAZ < -2SD defines the presence of both acute and chronic malnutrition.
Among 90 surveyed populations from public school of Gauradaha Municipality,
the prevalence of underweight was found to be 24.4% where 18.1% were
moderately underweight and 5.3% severely underweight.

43
4.12 Factors associated with underweight of public school children
Table 4.12 Result of chi-square for factors associated with underweight of public
school
Variables
Weight for age ²
value P-
value
UnderWt Normal
Gender Female 8 (14.8%) 46 (85.2%) 6.778 0.009*
Male 14 (38.9%) 22 (61.1%)
Type of house Cemented 6 (20.7%) 23 (79.3%)
Wooden 7 (23.3%) 23 (76.7%) 0.595 0.743
Bamboo and
soil 9 (29%) 22 (71%)
Purification of
water Yes 10 (32.3%) 21 (67.7%) 1.563 0.211
No 12 (20.3%) 47 (79.7%)
Food
preferences Vegetarian 1 (33.3%) 2 (66.7%) 0.133 0.716
Non-vegetarian 21 (24.1%) 66 (75.9%)
Means of
transportation Private vehicle 1 (25%) 3 (75%)
Public vehicle 0 (0%) 1 (100%) 0.372 0.946
Bicycle 3 (27.3%) 8 (72.7%)
Walking 18 (24.3%) 56 (75.7%)
Type of game
played Outdoor 5 (55.6%) 4 (44.4%) 5.241 0.022*
Indoor 17 (21%) 64 (79%)
*Statistically significant (P-value <0.05)
As shown in the table (4.16) the percentage of underweight boys were significantly
higher than the percentage of underweight girls. Gender (P=0.009) and type of
game usually played (P=0.022) was found to be significantly associated with
underweight.
The result is in accordance to the study conducted by (Prakash and Yadav, 2017)
which signifies that most of the boys (70%) were found to be underweight than
girls (30%).This finding was similar to the study conducted in Indonesia which
showed more boys than girls were underweight. Factors such as mother‘s level of
education, having an underweight father, and playing outdoors on weekends for
more than 2 hours were significantly associated with underweight children. By

44
contrast, mothers with high levels of education, overweight parents, sleeping for
less than 9 hours, and playing outdoors on weekends for less than 1 hour were
significantly associated with overweight children
4.13 Distribution of malnutrition according to BMI for age of public school
The BMI for age Z-score curve of public school children is slightly skewed to the
left side of WHO standard curve as shown in the Fig 4.4. The median BMI for age
z-score was found to be -0.8 which is less by 0.8 with reference WHO standard.
Among 90 surveyed populations from public school of Gauradaha Municipality,
the prevalence of thinness was found to be 12.2% where 9.6% were moderately
underweight and 2.1% severely underweight.
Fig 4.4 Distribution of BMI for age Z-score curve of public school children with
reference to WHO standard
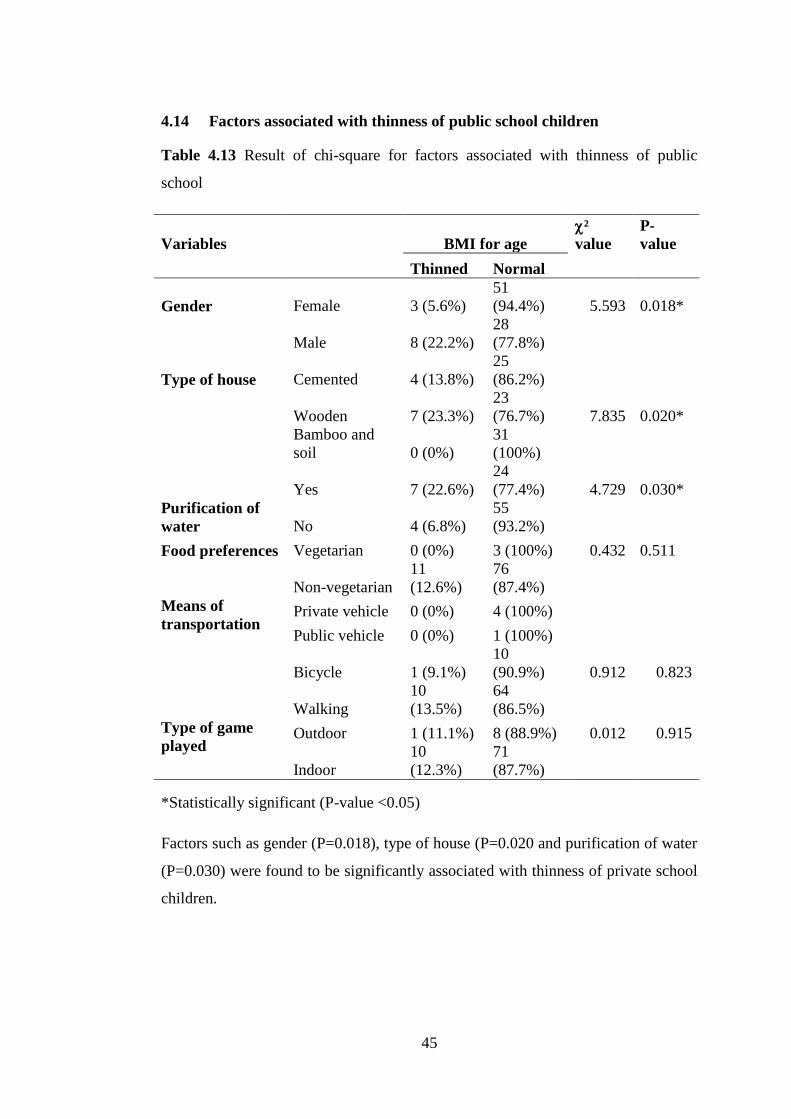
45
4.14 Factors associated with thinness of public school children
Table 4.13 Result of chi-square for factors associated with thinness of public
school
Variables
BMI for age
²
value
P-
value
Thinned Normal
Gender Female 3 (5.6%)
51
(94.4%) 5.593 0.018*
Male 8 (22.2%)
28
(77.8%)
Type of house Cemented 4 (13.8%)
25
(86.2%)
Wooden 7 (23.3%)
23
(76.7%) 7.835 0.020*
Bamboo and
soil 0 (0%)
31
(100%)
Purification of
water
Yes 7 (22.6%)
24
(77.4%) 4.729 0.030*
No 4 (6.8%)
55
(93.2%)
Food preferences Vegetarian 0 (0%) 3 (100%) 0.432 0.511
Non-vegetarian
11
(12.6%)
76
(87.4%)
Means of
transportation Private vehicle 0 (0%) 4 (100%)
Public vehicle 0 (0%) 1 (100%)
Bicycle 1 (9.1%)
10
(90.9%) 0.912 0.823
Walking
10
(13.5%)
64
(86.5%)
Type of game
played Outdoor 1 (11.1%) 8 (88.9%) 0.012 0.915
Indoor
10
(12.3%)
71
(87.7%)
*Statistically significant (P-value <0.05)
Factors such as gender (P=0.018), type of house (P=0.020 and purification of water
(P=0.030) were found to be significantly associated with thinness of private school
children.

46
4.15 Distribution of malnutrition according to height for age of private
school
The height for age Z-score curve of private school children is slightly skewed to the
left side of WHO standard curve as shown in the Fig 4.5. The median height for age
z-score was found to be -1.3 which is less by 1.3 with reference WHO standard. A
HAZ < -2SD defines the presence of chronic malnutrition. Among 90 surveyed
populations from private school of Gauradaha Municipality, the prevalence of
stunting was found to be 20% where 18.9% were moderately stunted and 1.1%
severely stunted.
Fig 4.5 Distribution of height for age Z-score curve of private school children with
reference to WHO standard

47
4.16 Factors associated with stunting of private school children
Table 4.14 Result of chi-square test for factors associated with stunting of private
school
Variables Height for age ² value P- value
Stunted Normal
Family type Nuclear 6 (12.5%) 42
(87.5%)
0.057 3.616
Joint 12
(28.6%)
30 (71.4%)
Father's
occupation
Agriculture 5 (22.7%) 17 (77.3%)
Business 3 (15.8%) 16 (84.2%)
Foreign
Employment
5 (20%) 20 (80%) 0.093 9.438
Service 5 (50%) 5 (50%)
Labor 0 (0%) 5 (100%)
Others 0 (0%) 9 (100%)
Birth order First 6 (13%) 40 (87%)
Second 6 (18.2%) 27 (81.8%) 0.021 9.745
Third 4 (57.1%) 3 (42.9%)
Fourth 2 (50%) 2 (50%)
Purification
of water
Yes 9 (15.8%) 48 (84.2%) 0.189 1.722
No 9 (27.3%) 24 (72.7%)
Food
preferences
Vegetarian 0 (0%) 10 (100%) 0.094 2.813
Non-vegetarian 18
(22.5%)
62 (77.5%)
*Statistically significant (P-value <0.05)
No any factors such as family type, father‘s occupation, birth order, and
purification of water and food preferences were found to be significantly associated
with stunting of children from private school as shown in the above table (4.11).

48
4.17 Distribution of malnutrition according to weight for age of private
school
Fig 4.6 Distribution of weight for age Z-score curve of private school children with
reference to WHO standard
The weight for age Z-score curve of private school children is slightly skewed to
the left side of WHO standard curve as shown in the Fig 4.6. The median weight
for age z-score was found to be -1 which is less by 1 with reference WHO standard.
A WAZ < -2SD defines the presence of both acute and chronic malnutrition.
Among 90 surveyed populations from private school of Gauradaha Municipality,
the prevalence of underweight was found to be 13.3% where 8.9% were moderately
underweight and 4.4% severely underweight.

49
4.18 Factors associated with underweight of private school children
Table 4.15 Result of chi-square for factors associated with underweight of private
school children
Variables Weight
for
age ²
value
P- value
Underweigh
t
Normal
Family type Nuclear. 5 (10.4%) 43 (89.6%) 0.384 0.757
Joint 7 (16.7%) 35 (83.3%)
Father's
occupation
Agriculture 3 (13.6%) 19 (86.4%)
Business 2 (10.5%) 17 (89.5%)
Foreign
Employment
4 (16%) 21 (84%) 0.916 1.477
Service 2 (20%) 8 (80%)
Labor 0 (0%) 5 (100%)
Others 1 (11.1%) 8 (88.9%)
Birth order First 3 (6.5%) 43 (93.5%)
Second 6 (18.2%) 27 (81.8%) 0.066 7.178
Third 1 (14.3%) 6 (85.7%)
Fourth 2 (50%) 2 (50%)
Purification
of water
Yes 5 (8.8%) 52 (91.2%) 0.094 2.799
No 7 (21.2%) 26 (78.8%)
Food
preferences
Vegetarian 0 (0%) 10 (100%) 0.188 1.731
Non-vegetarian 12 (15%) 68 (85%)
*Statistically significant (P-value <0.05)
No any factors were found to be significantly associated with underweight of
private school children.

50
4.19 Distribution of malnutrition according to BMI for age of private school
Fig 4.7 Distribution of BMI for age Z-score curve of private school children with
reference to WHO standard
The BMI for age Z-score curve of private school children is slightly skewed to the
left side of WHO standard curve as shown in the Fig 4.5. The median BMI for age
z-score was found to be -0.5 which is less by 0.5 with reference WHO standard.
Among 90 surveyed populations from private school of Gauradaha Municipality,
the prevalence of thinness was found to be 7.8% where 6.7% were moderately
thinned and 1.1% severely thinned.

51
4.20 Factors associated with thinness of private school children
Table 4.16 Result of chi-square for factors associated with thinness of private
school children
Variables BMI for age ²
value
P-
value
Thinned Normal
Family type Nuclear 5 (10.4%) 43 (89.6%) 0.318 0.999
Joint 2 (4.85) 40 (95.2%)
Father's
occupation
Agriculture 1 (4.5%) 21 (95.5%)
Business 2 (10.5%) 17 (89.5%)
Foreign
Employment
2 (8%) 23 (92%) 0.949 1.152
Service 1 (10%) 9 (90%)
Labor 0 (0%) 5 (100%)
Others 1 (11.1%) 8 (88.9%)
Birth order First 1 (2.2%) 45 (97.8%)
Second 5 (15.2%) 28 (84.8%) 0.08 6.76
Third 0 (0%) 7 (100%)
Fourth 1 (25%) 3 (75%)
Purification
of water
Yes 5 (8.8%) 52 (91.2%) 0.643 0.214
No 2 (6.1%) 31 (93.9%)
Food
preferences
Vegetarian 0 (0%) 10 (100%) 0.33 0.949
Non-vegetarian 7 (8.8%) 73 (91.2%)
No any factors such as family type, father‘s occupation, birth order, and
purification of water and food preferences were found to be significantly associated
with thinness of children from private school as shown in fig 4.12

52
Part V
Conclusions and recommendations
5.1 Conclusions
The following conclusions were made from the study:
1. The prevalence of malnutrition in private school was 20% stunting, 7.8%
thinness and 13.3% underweight whereas prevalence in public school was
21.1% stunting, 12.2% thinness and 24.4% underweight.
2. Comparatively the prevalence of underweight and thinness was found high
in public school by 11.1% and 3.4% respectively than in private school.
3. Factors such as gender (P=0.018), type of house (P=0.020 and purification
of water (P=0.030) were found to be significantly associated with thinness
of public school children.
4. Gender (P=0.009) and type of game played (P=0.022) was found to be
significantly associated with underweight of public school children.
5. No any factors were found significantly associated with the stunting,
wasting, and Underweight of private school children.
5.2 Recommendations
1. Cross-sectional survey should be conducted periodically with special
emphasis on the nutritional status of school aged children.
2. A large number of school and children should be included in future studies
of this kind.
3. More information on dietary habits, duration and type of sporting activities
should be sought.
4. Teams of health care professionals should develop and implement
preventive and management programs to cure the potential economic drain
that could result from childhood malnutrition.
5. There is need of Multi Sectorial Nutritional Plan to solve the existing
problems of malnutrition.

53
Part- VI
Summary
A cross-sectional study was conducted among 180 sample population of Gauradaha
Municipality, Jhapa for comparative nutritional study between primary level school
children aged 5-10 yrs school of private and public schools of Gauradaha. Simple
random sampling method was used for the collection of data. Anthropometric
measurements like height, weight were taken and BMI was also calculated to assess
nutritional status of primary level school aged children. A structured questionnaires
were asked to the children about their food preferences, physical activities
information on socioeconomic characteristiccs and household characteristics. Data
obtained were analyzed by using SPSS version 20.0 and WHO Anthro Plus version
1.0.4. Chi-square test was used to find out the factors associated with stunting,
underweight and thinness.
The overall prevalence stunting, thinness and underweight in the surveyed area was
found to be 41.1%, 20% and 37.7% respectively. Out of which children from
private school comprises 20% of stunting, 7.8% of thinness and 13.3% of
underweight whereas children from public school comprise 21.1% of stunting,
12.2% of thinness and 24.4% of underweight. Highest percentage of stunting and
underweight was found in the age group of 8-10 years i.e.14.4% and 16.7%
respectively. Similarly, children who belong to 5-8 yr age group were found to be
more thinned i.e. 6.7%.Out of 180 studied populations, 43 were females and 47
were males belonging to private school whereas 54 were females and 36 were
males belonging to public school. The study result showed male child from both
private and public school were found to be more stunted, thinned and underweight
than female child.
Most of the fathers of children studying in both private and public school had gone
to foreign employment i.e. 27.8% and 33.3% respectively. Most of the mothers of
students from private school were housewife (77.8%). Majorities (61.1%) of the
children from private school belong to the household whose annual income was
more than 3 lakhs whereas majorities (73.3%) of children from public school
belong to the household whose annual income is in between 1-3 lakhs. 53.3% of
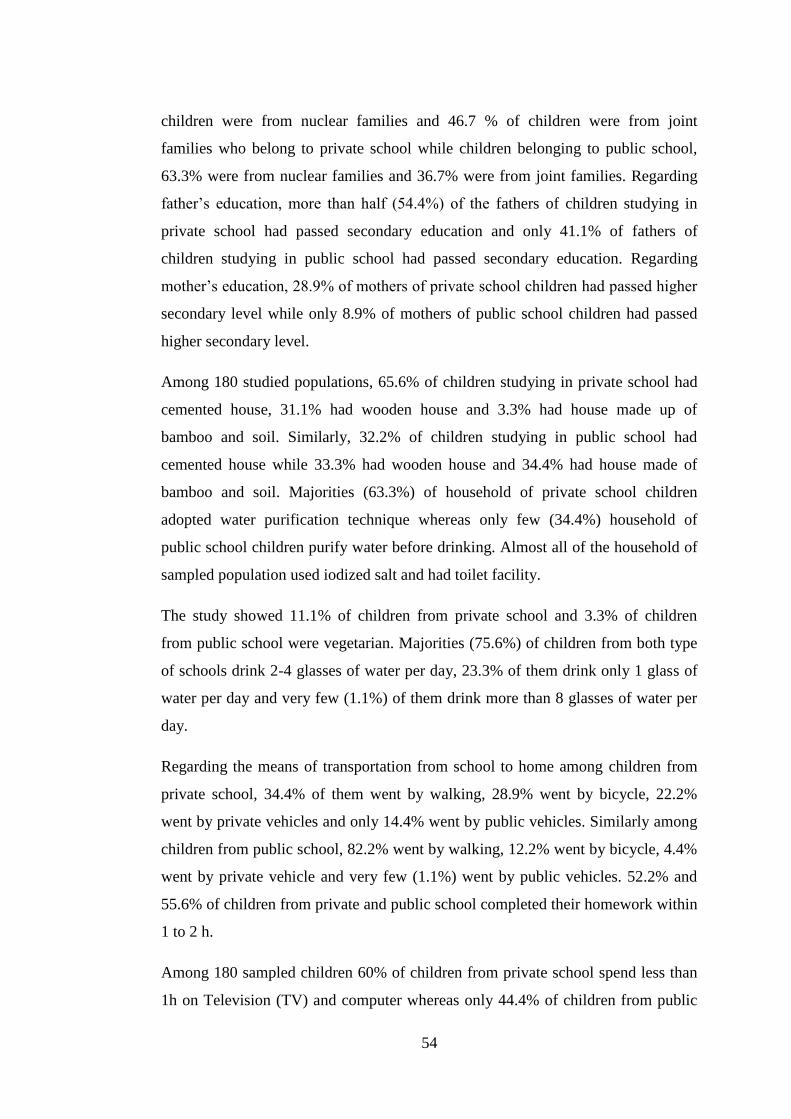
54
children were from nuclear families and 46.7 % of children were from joint
families who belong to private school while children belonging to public school,
63.3% were from nuclear families and 36.7% were from joint families. Regarding
father‘s education, more than half (54.4%) of the fathers of children studying in
private school had passed secondary education and only 41.1% of fathers of
children studying in public school had passed secondary education. Regarding
mother‘s education, 28.9% of mothers of private school children had passed higher
secondary level while only 8.9% of mothers of public school children had passed
higher secondary level.
Among 180 studied populations, 65.6% of children studying in private school had
cemented house, 31.1% had wooden house and 3.3% had house made up of
bamboo and soil. Similarly, 32.2% of children studying in public school had
cemented house while 33.3% had wooden house and 34.4% had house made of
bamboo and soil. Majorities (63.3%) of household of private school children
adopted water purification technique whereas only few (34.4%) household of
public school children purify water before drinking. Almost all of the household of
sampled population used iodized salt and had toilet facility.
The study showed 11.1% of children from private school and 3.3% of children
from public school were vegetarian. Majorities (75.6%) of children from both type
of schools drink 2-4 glasses of water per day, 23.3% of them drink only 1 glass of
water per day and very few (1.1%) of them drink more than 8 glasses of water per
day.
Regarding the means of transportation from school to home among children from
private school, 34.4% of them went by walking, 28.9% went by bicycle, 22.2%
went by private vehicles and only 14.4% went by public vehicles. Similarly among
children from public school, 82.2% went by walking, 12.2% went by bicycle, 4.4%
went by private vehicle and very few (1.1%) went by public vehicles. 52.2% and
55.6% of children from private and public school completed their homework within
1 to 2 h.
Among 180 sampled children 60% of children from private school spend less than
1h on Television (TV) and computer whereas only 44.4% of children from public

55
school spend less than 1h on Television (TV) and computer. More than half
(53.3%) of children from private school involved in playing and running activities
in break time while 46.7% of them just sit, eat, talk and study in break time. 66.7%
of children from public school engaged in different activities during break time like
playing and running, 30% of them performed activities like sitting, eating, talking
and studying and only 3.3% of them were involved in walking.

56
References
ACC/SCN. (1992). "Second Report on World Nutrition Situation". UN-Sub
committee on Nutrition. Geneva.
Agriculture, U. S. D. o. and Services, U. S. D. o. H. a. H. (2010). "Dietary
Guidelines for Americans" (7th ed.). U.S.Government Printing Office.
Washington,DC.
Aziz, M. F. and Devi, M. N. (2012). Nutritional status and eating practices among
children aged 4-6 years old in selected urban and rural kindergarten in
Selangor Malaysia. . Asian Journal of Clinical Nutrition.4 (4), 116-131.
Banstola, S. and Acharya, B. (2015). Nutritional status of primary school children
in Pumdi Bhumdi village of Kaski district, Nepal. International Journal of
Health Sciences and Research.5 (5).
Bellows, L. L., Davies, P. L., Anderson, J. and Kennedy, C. (2013). Effectiveness
of a physical activity intervention for Head Start preschoolers: a randomized
intervention study. American Journal of Occupational Therapy.67 (1), 28.
Bernitez-Bribiesca, L., De la -Rosa Alvarez, I. and Mansilla -Olivares, A. (1999).
Dendritic spine pathology in infants with severe protein calorie
malnutrition. Paediatrics 104 (2).
Bhaskaram, P. (2002). "Micronutrient Malnutrition, Infection and Immunity an
Overview".
Bhatnagar, S. and Taneja, S. (2001). Zinc and cognitive development. Br Jr.
Nutr.85, 139-145.
Bhatta, K., Mishra, S. and Gurung, G. (1998). A case study of Bishanku Narayan
Village. Journal of Nepal Medical Association.37 (128), 614-619.
Burk, M. (1984). "Brief Introduction For Good Economics To Nutrition Problems,
Integrating Nutrition Into Agriculture and Rural Development Project".
FAO.
CBS/UNICEF. (2015). Nepal Multiple Indicator Cluster Survey [Report].
Kathmandu, Nepal. [Accessed 11 July, 2018].
Checkley, W., Buckley, G. and Gilman, R. H. (2008). Multi-country analysis of the
effects of diarrhoea on childhood stunting. International Journal of
Epidemiology. (37), 816-830.
Christian , P. and West , K. P. (1998). Interactions between zinc and vitamin A: an
update. American Journal of Clinical Nutrition.68, 435-441.
Chung, A. E., Skinner, A. C., Steiner, M. J. and Perrin, E. M. (2012). Physical
activity and BMI in a nationally representative sample of children and
adolescents. Clinical Pediatrics.51 (2), 122-129.

57
Cottrell, E. C. and Ozanne, S. E. (2008). Early life programming of obesity and
metabolic disease. Physiology & Behaviour.94, 17-28.
De Souza, A. S., Fernandes, F. S. and Do Carmo, M. G. (2011). Effects of maternal
malnutrition and postnatal nutritional rehabilitation on brain fatty acids,
learning, and memory. Nutrition Reviews.69 (3), 132-144.
Devkota, S. C., Dahal, A. and Sathian, B. (2015). Nutritional deficiencies: major
public health problem in Nepal. American Journal of Public Health
Research.3 (1), 1-5.
Dhakal, A. (1995). An area nutritional survey of Uttarpani Chungbang VDC-1,
Dhankuta. B.Tech Dissertation. Tribhuwan University, Nepal.
Ergin, F., Okyay, P., Atasoylu, G. and Beşer, E. (2007). Nutritional status and risk
factors of chronic malnutrition in children under five years of age in Aydın,
a western city of Turkey. Turk Jr Paediatr.49 (3), 283-289.
FAO. (1997). Malnutrition and micronutrient deficiencies. In: "Agriculture, Food
and Nutrition for Africa - A resource book for teachers of agriculture" (Vol.
1).). Rome,Italy. Publishing Management Group and F. I. Division, Eds.
Florence, M. D., Asbridge, M. and Veugelers, P. J. (2008). Journal of School
Health. Diet quality and academic performance. 78, 209–215.78 (4), 209-
215.
Frongillo, J. E. (1999). Symposium: causes and etiology of stunting. Introduction.
J. Nutr.129.
Gibson, R. S. (2005). "Principles of nutrition assessmrnt" (2nd ed.). Oxford
University Press. New Yorl.
GoN and MoPE. (2016). Nepal Population Report 2016 [Report]. Nepal.
Gowri, A. R. and Sangunam, H. J. (2005). Assessment of mental and motor
abilities of school going children with anemia. Ind. J.Nutr.Dietet.42, 99-
105.
Haas, J. D., Murdoch, S., Rivera, J. and Martorell, R. (1996). Early nutrition and
later physical work capacity. Nutr Rev,.54 (2), 41-48.
Hiddinnott, J. and Yohannes, Y. (2002). " Dietary Diversity as a food security
indicator: FCND discussion Paper ". International Food policy Research
Institute. Washington D.C. IJSA.
Hoddinott, J., Maluccio, J. A., Behrman, J. R., Flores, R. and Martorell, R. (2008).
Effect of a nutrition intervention during early childhood on economic
productivity in Guatemalan adults The Lancet.371, 411-416.

58
Hooshmand, S. and Udipi, S. A. (2013). Dietary Diversity and Nutritional Status of
Urban Primary School Children from Iran and India. Jr. Nutritional
Disorders & Therapy.
IFPRI. (2015). Global Nutrition Report 2015: Actions and Accountability to
Accelerate the World's Progress on Nutrition [Report]. Washington, DC,
[Accessed 27 November, 2017].
Jackson, A. A. and Golden, M. H. N. (1991). Protein Energy Malnutrition:
Kwashiorkor and Marasmic Kwashiorkor, Part 1: Physiopathology. In:
"Clinical Nutrition of the Young Child".). New York. Raven Press Ltd.
Joshi, H., S., Gupta, R., Joshi, M. C. and Mahajan, V. (2011). Determinants of
nutritional status of school Children - A cross sectional study in the
Western region of Nepal National Journal of Integrated Research in
Medicine.2 (1).
Katz, S. H. and Weaver, W. W. (2014). Gale encyclopaedia of food and culture.
Scribner. New York.
Khuwaja, S., Selwyn, B. J. and Shah, S. M. (2005). Prevalence and correlates of
stunting among primary school children in rural areas of southern Pakistan
Jr. Trop Paediatric 51.
Kumari, S. and Jain, R. (2005). Assessment of school children from rural Bihar.
Ind.J. Nutr. Dietet.42, 326-334.
Lozoff, B. and Georgieff, M. K. (2006). Iron deficiency and brain development.
Seminars in Pediatric Neurology.13, 158-165.
Mansur, D. I., Haque, M. K., Sharma, K., Mehta, D. K. and Shakya, R. (2015). A
study on nutritional status of rural school going children in Kavre district
Kathmandu Uni Med J.50 (2), 146-151.
McGregor , S. G., Cheung , Y. B., Cueto, S., Glewwe, P., Richter, L., Strupp, B.
and Group, t. I. C. D. S. (2007). Developmental potential in the first 5 years
for children in developing countries. The Lancet.369, 60-70.
MoH, New ERA and ICF. (2016). Nepal Demographic and Health survey [Report].
Ministry of Health. kathmandu, Nepal. [Accessed 26 june, 2017].
Mohanram , M., Kulkarni, K. A. and Reddy, V. (1977). Hematological studies in
vitamin A deficient children. International Journal for Vitamin and
Nutrition Research.47, 389-393.
MoHP. (2010). Nepal Demographic Health Survey [Report]. Population divison
MoHP, New ERA, ICF International and US Agency of Investigation
Department. Kathmandu, Nepal.
Neufeld, M., Haas, J. D., Grajeda, R. and Martorell, R. (2004). Changes in maternal
weight from the fi rst to second trimester of pregnancy are associated with

59
fetal growth and infant length at birth. American Journal of Clinical
Nutrition.79 (4), 646-652.
Onis, M. d., Blössner, M. and Borghi, E. (2012). Prevalence and trends of stunting
among preschool children, 1990–2020. Public Health Nutr. 15.
Ozaltin, E., Hill, K. and Subramanian, S. V. (2010). Association of maternal stature
with offspring mortality, under-weight, and stunting in low- to middle-
income countries. The Journal of the American Medical Association.303,
1507-1516.
Paudel, S., Pradhan, P. M. S., Limbu, N. P. M., Shrestha, S. M., Pandeya, P. and
Regmi, B. (2017). Nutritional status of young children in periphery of
Lalitpur Sub-Metropolitan city in Nepal. Journal of Common Market
Studies.13 (3), 330-334.
Prakash, S. and Yadav, K. (2017). Anthropometric dimensions on nutritional grade
among school children. Jr. of Nutritional Health and food engineering.6 (3).
Project, D. C. P. (2008). "Deworming Children Brings Huge Health and
Development Gains in Low-Income Countries".
Qian , M., Wang, D., Watkins , W., Gebski , V., Yan , Y. Q., Li , M. and Chen , Z.
P. (2005). The effects of iodine on intelligence in children: a meta-analysis
of studies conducted in China. Asia Pacific Journal of Clinical Nutrition.14,
32-42.
Rahman , M. M., Wahed , M. A., Fuchs , G. J., Baqui , A. H. and Alvarez, J. O.
(2002). Synergistic effect of zinc and vitamin A on the biochemical indexes
of vitamin A nutrition in children. American Journal of Clinical
Nutriton.75, 92-98.
Ramkrishna, U. (2002). Prevalance of micronutrient malnutrition worldwide.
Rodriguez-Morales, A. J., Bolivar-Mejı´a, A., Alarco´n-Olave, C. and Calvo-
Betancourt, L. S. (2016). "Encyclopedia of Food and Health ". Elsevier.
Sah, N. (2004). Determinants of child malnutrition in Nepal: a case analysis from
Dhanusha. urnal of Nepal Health Research Council.2 (3), 50-54.
Saluja, N., Bhatnagar, M., Garg, S. K., Chopra, H. and Bajpai, S. K. (2009).
Nutritional status of urban primary school children in Meerut. The Internet
Journal of Epidemiology.8 (1).
Smith, G. C. S., Jstenhouse, E., Crossley, J. A., Aitken, D. A., Cameron, A. D. and
Connor, J. M. (2002). Early-pregnancy origins of low birth weight.
NATURE.417.
Smith, L. C. and Haddad, L. (2000). "Explaining Child Malnutrition in Developing
Countries: A Cross-Country Analysis". Washington,D.C. International Food
Policy Research Institute. Retrieved from

60
Srilakshmi, B. (2014). "Dietetics". New Age International (p) Limited. New Delhi.
Srilakshmi, B. (2016). "Nutrition Science" (15th ed.). New Age International Pvt.
Ltd. New Dehli,India.
Srivastava, A., Syed E Mahmood, S. E., Srivastava, P. M., Shrotriya, V. P. and
Kumar, B. (2012). Nutritional status of school-age children - A scenario of
urban slums in India. Archives of Public Health.70 (8).
Sungthong, R., Mo-Suwan, L. and Chongsuvivatwong, V. (2002). Effects of
haemoglobin and serum ferritin on cognitive function in school children
Asia Pacific Journal of Clinical Nutrition.11, 117-122.
Syahrul, S., Kimura, R., Tsuda, A., Susanto, T., Saito, R. and Ahmad, F. (2016).
Prevalence of underweight and overweight among school-aged children and
it's association with children's sociodemographic and lifestyle in Indonesia.
International Journal of Nursing Sciences.3, 169-177.
Thompson, J. and Manore, M. (2012). "Nutrition: An Applied Approach" (3rd ed.).
Pearson Benjamin Cummings. United States of America.
Torún, B. (2006). Protein-Energy Malnutrition. In: "Modern Nutrition in Health
and Disease" (10th ed.).). pp. 881-906. United States of America. Lippincott
Williams & Wilkins.
Underwood, B. A. and Arthur, P. (1996). The contribution of vitamin A to public
health. FASEB Journal.10.
UNDP. (2016). Human Development Report 2016 [Report]. UNDP. New York,
USA. [Accessed 27 November, 2017
UNICEF. (1998). "The state of the World‘s children". Oxford. Oxford University
Press. pp. 13-18.
Victora, C. G., Adair, L., Fall, C., Hallal, P. C., Martorell, R., L., R., Sachdev, H. S.
and Group, C. U. S. (2008). Maternal and child undernutrition:
consequences for adult health and human capital. Lancet.371, 340–357.
West, K. P. and Darnton-Hill, I. I. (2008). Vitamin A deficiency. In: "Nutrition and
Health in Developing Countries" (2nd ed.). (R. D. Semba and M. W.
Bloem, Eds.). pp. 377-434. USA. Humana Press.
WFP. (2011). "Food Aid Information System; Assessing Nutritional
Requirements".
Whitcher, J. P., Srinivasan, M. and Upadhyay, M. P. (2001). Corneal blindness: a
global perspective. Bulletin of the World Health.79, 214-221.
WHO. (1966). "The Assessment of the Nutritional Status of Community : WHO
Monograph Sereis 53". World Health Organization. Geneva, Switzerland.

61
WHO. (1995). Physical Status: The Use and Interpretation of Anthropometry
[Report]. WHO Expert Committee.World Health Organ Tech Rep Ser.
WHO. (1996). The Assessment of the Nutritional Status of the Community. WHO
Monograph [Report]. 53. World Health Organization. Geneva, Switzerland.
[Accessed 15 April, 2018].
WHO. (1997). "Global Database on Child Growth and Malnutrition.". World
Health Organization. Retrieved from http://www.who.int/nutgrowthdb.html.
[Accessed November 2017].
WHO. (2002). The World Health Report-Reducing risks, promoting healthy life
[Report]. World Health Organization. Geneva,
WHO. (2003). "Diet, Nutrition and The Prevention of Chronic Diseases". World
Health Organ Tech Rep Ser. pp. 1-149.
WHO. (2010). Nutrition landscape information system country profile indicators.
World Health Organization. Retrieved from
http://www.who.int/nutrition/nlis_interpretation_guide.pdf. [Accessed 14
March, 2017].
WHO. (2015). "Global Database on Child Growth and Malnutrition". Retrieved
from http://www.who.int/nutgrowthdb/about/introduction/en/index6.html.
[Accessed January, 2018].
Zeisel, S. H. (2009). Importance of methyl donors during reproduction. Am J Clin
Nutr 89, 673-677.
Zimmermann, M., Adou, P., Torresani, T., Zeder , C. and Hurrell , R. (2000).
Persistence of goiter despite oral iodine supplementation in goitrous
children with iron deficiency anemia in Côte d‘Ivoire. American Jr of
Clinical Nutrition.71, 88-93.

62
Appendices
Appendix-A
Questionnaire
A. GENERAL INFORMATION
School‘s Code: Date of interview (B.S.):
Student‘s Code No.: Class:
Name of child: __________________________________________
Date of birth (B.S.): Age (in years):_________
Address -Municipality: Gauradaha Ward no: _____
Tole:_________________
Gender
a. Male b. Female
Caste/Ethnicity:
a. Brahmin
b. Chhettri
c. Tharu
d. Magar
e. Thakuri
f. Others:_________
__
Religion:
a. Hindu
b. Muslim
c. Christian
d. Buddhist
e. Others:
______________
B. ANTHROPOMETRIC INFORMATION
Reading 1 Reading 2 Reading 3 Mean reading
Height (cm)
Weight (kg)
C. FAMILY INFORMATION
1. Type of family: a) Nuclear b) Joint
2. Number of family members: __________
3. Occupation (of father):
a. Agriculture
b. Service
c. Labour
d. Business
e. Foreign
employment
Mth
.
Yr. da
y
day Mth. Yr.

63
f. Others:_________ __
4. Occupation (of mother):
a. Housewife
b. Agriculture
c. Service
d. Labor
e. Business
f. Foreign employment
g. Others______
5. Family income:
a. Less than Rs. 1 Lakh annually (less than Rs. 8300 monthly )
b. Rs. 1 lakh to 3 lakhs (Rs. 8300 to 25000 monthly)
c. More than Rs. 3 lakhs (more than Rs.25000
6. Father‘s Education level:
a. University
level
b. Secondary
c. Basic
d. Informal
e. Illiterate
f. Not aware
7. Mother‘s education level :
a. University
level
b. Secondary
c. Basic
d. Informal
e. Illiterate
f. Not aware
8. How many siblings do you have?
Total: ________ Brothers: ______ Sisters:______
9. Your sequence among siblings(from the eldest):__________
10. Which is your main source of drinking water in your family?
a. Tube well
b. Well
c. River
d. Drinking water tap
e. Other: ___________
11. Is the water purified?
a. Yes b. No
12. Do you have toilet facility in your house?
a. Yes b. No
13. What is the main source of food for your family?

64
a. Own
production
b. Purchased
from market
c. Other:_______
D. DIETARY INTAKE AND
FOOD HABITS (students may
answer more than one option, for
such answer what we can do?)
14. What are you?
a. Vegan
b. Lacto-vegetarian
c. Lacto-ovo vegetarian
d. Non-vegetarian
15. If non vegetarian, what do you prefer to eat?
a. Fish
b. White meat
(chicken/duck)
c. Red meat
(goat/buffalo/po
rk)
16. How many glasses (fix the volume) of water do you drink/day?
a. 1
b. 2-4
c. 5-7
d. 8 or more
17. Do you have daily pocket money? (What to do if he occasionally gets pocket
money?)
a. Yes b. No
18. Do you buy food from school canteen?
a. Yes b. No
If yes, what type?
____________________
19. Do you smoke?
a. Yes b. No
20. Do you drink alcoholic beverages?
a. Yes b. No
E. PHYSICAL ACTIVITY
21. Which form of transport do you normally use when travel to and from school
and apart from your journey to and from school?

65
a. Private vehicle
b. Cycle
c. Public transport
d. Walk
22. How many hours per day do you spend on doing your homework?
a. None
b. Less than an hour a day
c. 1 to 2 hours a day
d. More than 2 hours a day
23. How many hours per day do you spend watching TV or Video or using
computer?
a. None
b. Less than an hour a day
c. 1 to 2 hours a day
d. More than 2 hours a day
24. What do usually do at school breaks?
a. Sitting down
(talking,
reading or
eating)
b. Standing or
walking
around
c. Running or
playing games
25. Do you normally play games or perform physical activities outside school?
a) Yes b)
No
If yes, what type?
a. Play games
b. Aerobics/zumb
a
c. Swimming
d. Gymming
e. Running/joggi
ng
f. Walking
g. Yoga
26. In a day, how many minutes do you do such activity? _______
Minutes

66
Appendix-B
Study Site