COMPARATIVE NITROGEN PARTITIONING AND WATER USE BY …
152
COMPARATIVE NITROGEN PARTITIONING AND WATER USE BY NATIVE AND INTRODUCED GRASS COMMUNITIES IN SOUTHERN ALBERTA, CANADA by Shane Warren Porter A dissertation submitted in partial fulfillment of the requirements for the degree of Doctor of Philosophy in Land Resources and Environmental Sciences MONTANA STATE UNIVERSITY Bozeman, Montana August 2005
Transcript of COMPARATIVE NITROGEN PARTITIONING AND WATER USE BY …

COMPARATIVE NITROGEN PARTITIONING AND WATER USE BY NATIVE
AND INTRODUCED GRASS COMMUNITIES IN
SOUTHERN ALBERTA, CANADA
by
Shane Warren Porter
A dissertation submitted in partial fulfillment of the requirements for the degree
of
Doctor of Philosophy
in
Land Resources and Environmental Sciences
MONTANA STATE UNIVERSITY Bozeman, Montana
August 2005

© COPYRIGHT
by
Shane Porter
2005
All Rights Reserved

ii
APPROVAL
of a dissertation submitted by
Shane Warren Porter
This dissertation has been read by each member of the dissertation committee and has been found to be satisfactory regarding content, English usage, format, citations,bibliographic style, and consistency, and is ready for submission to the College ofGraduate Studies.
Dr. Jon M. Wraith
Approved for the Department of Land Resources and Environmental Science
Dr. Jon M. Wraith
Approved for the College of Graduate Studies
Dr. Joseph J. Fedock

iii
STATEMENT OF PERMISSION TO USE
In presenting this dissertation in partial fulfillment of the requirements for a
doctoral degree at Montana State University–Bozeman, I agree that the Library shall
make it available to borrowers under rules of the Library. I further agree that copying of
this dissertation is allowable only for scholarly purposes, consistent with "fair use" as
prescribed in the U.S. Copyright Law. Requests for extensive copying or reproduction of
this dissertation should be referred to Bell & Howell Information and Learning, 300
North Zeeb Road, Ann Arbor, Michigan 48106, to whom I have granted "the exclusive
right to reproduce and distribute my dissertation in and from microform along with the
non-exclusive right to reproduce and distribute my abstract in any format in whole or in
part."
Shane Warren Porter
August, 2005

iv
ACKNOWLEDGMENTS
I would like to thank my major advisor at Montana State University, Dr. Jon
Wraith, and my advisor at the Lethbridge Research Center, Agriculture and Agrifood
Canada, Dr. Walter Willms, for the ideas, support, and encouragement they have given
me as a graduate student at Montana State University–Bozeman.
I would also like to thank the other members of my graduate committee, Dr. Paul
Hook, Dr. Jerry Nielsen, Dr. Clayton Marlow, and Dr. David Weaver for their assistance.
I could not have accomplished this without the help of Marj Scheurokogel and
Paula Dressler who assisted in the word-processing and formatting of this dissertation.
My special thanks go to the following researchers at the Lethbridge Research
Center: Dr. Chi Cheung, Dr. Henry Janzen, Dr. Ben Ellhert, and Toby Entz. I would also
like to thank Ryan Beck, Dan Hoover, Harriet Douwes, Rosie Wallender, Emily Davies,
and Mari Henry for their help with laboratory work.
I am especially grateful to Dr. Johann Dormaar who told me the story of grassland
soils and was always willing to listen and discuss.
Finally, I would like to give special thanks to my wife, mom, and family for their
loving support.

v
TABLE OF CONTENTS
1. INTRODUCTION . . . . . . . . . . . . . . . . . . . . . . . . . . . . . . . . . . . . . . . . . . . . . 1
References Cited . . . . . . . . . . . . . . . . . . . . . . . . . . . . . . . . . . . . . . . . . . . . . . . 7
2. LITERATURE REVIEW . . . . . . . . . . . . . . . . . . . . . . . . . . . . . . . . . . . . . . . 10
Plant Community Dynamics . . . . . . . . . . . . . . . . . . . . . . . . . . . . . . . . . . . . . 10Cultivation and Nitrogen . . . . . . . . . . . . . . . . . . . . . . . . . . . . . . . . . . . . . . . 12Cultivation and Water Relations . . . . . . . . . . . . . . . . . . . . . . . . . . . . . . . . . . 15References Cited . . . . . . . . . . . . . . . . . . . . . . . . . . . . . . . . . . . . . . . . . . . . . . 19
3. NITROGEN PARTITIONING IN NATIVE AND AGRONOMIC COMMUNITIES IN THE NORTHERN GREAT PLAINS . . . . . . . . . . 27
Introduction . . . . . . . . . . . . . . . . . . . . . . . . . . . . . . . . . . . . . . . . . . . . . . . . . . 27Materials and Methods . . . . . . . . . . . . . . . . . . . . . . . . . . . . . . . . . . . . . . . . . 28
Site Description . . . . . . . . . . . . . . . . . . . . . . . . . . . . . . . . . . . . . . . . . . 28Experimental Design . . . . . . . . . . . . . . . . . . . . . . . . . . . . . . . . . . . . . . 29Methods . . . . . . . . . . . . . . . . . . . . . . . . . . . . . . . . . . . . . . . . . . . . . . . . 31
Statistical Analyses . . . . . . . . . . . . . . . . . . . . . . . . . . . . . . . . . . . . . . . . . . . . 32Results . . . . . . . . . . . . . . . . . . . . . . . . . . . . . . . . . . . . . . . . . . . . . . . . . . . . . . 33
Site and Year Effect . . . . . . . . . . . . . . . . . . . . . . . . . . . . . . . . . . . . . . . 33Biomass and Root: Shoot . . . . . . . . . . . . . . . . . . . . . . . . . . . . . . . . . . . 35Nitrogen Concentration in Roots and Shoots . . . . . . . . . . . . . . . . . . . 39Total Nitrogen in Biomass . . . . . . . . . . . . . . . . . . . . . . . . . . . . . . . . . . 39
Discussion . . . . . . . . . . . . . . . . . . . . . . . . . . . . . . . . . . . . . . . . . . . . . . . . . . . 44Native Grassland Communities . . . . . . . . . . . . . . . . . . . . . . . . . . . . . . 47Annual Monocultures . . . . . . . . . . . . . . . . . . . . . . . . . . . . . . . . . . . . . 48Perennial Monocultures . . . . . . . . . . . . . . . . . . . . . . . . . . . . . . . . . . . . 49
Summary and Conclusions . . . . . . . . . . . . . . . . . . . . . . . . . . . . . . . . . . . . . . 50References Cited . . . . . . . . . . . . . . . . . . . . . . . . . . . . . . . . . . . . . . . . . . . . . . 52

vi
TABLE OF CONTENTS - (Continued)
4. SOIL NITROGEN PARTITIONING IN NORTHERN GREAT PLAINS GRASSLANDS: SHORT-TERM RESPONSE TO AGRONOMIC TREATMENTS . . . . . . . . . . . . . . . . . . . . . . . . . . . . . . . 55
Introduction . . . . . . . . . . . . . . . . . . . . . . . . . . . . . . . . . . . . . . . . . . . . . . . . . . 55Materials and Methods . . . . . . . . . . . . . . . . . . . . . . . . . . . . . . . . . . . . . . . . . 56
Site Description . . . . . . . . . . . . . . . . . . . . . . . . . . . . . . . . . . . . . . . . . . 56Experimental Design . . . . . . . . . . . . . . . . . . . . . . . . . . . . . . . . . . . . . . 57Soil Nitrogen Determination Methods . . . . . . . . . . . . . . . . . . . . . . . . . 57
Statistical Analyses . . . . . . . . . . . . . . . . . . . . . . . . . . . . . . . . . . . . . . . . . . . . 59Results . . . . . . . . . . . . . . . . . . . . . . . . . . . . . . . . . . . . . . . . . . . . . . . . . . . . . . 60Discussion . . . . . . . . . . . . . . . . . . . . . . . . . . . . . . . . . . . . . . . . . . . . . . . . . . . 66Summary and Conclusions . . . . . . . . . . . . . . . . . . . . . . . . . . . . . . . . . . . . . . 69References Cited . . . . . . . . . . . . . . . . . . . . . . . . . . . . . . . . . . . . . . . . . . . . . . 72
5. WATER UPTAKE RESUMPTION FOLLOWING SOIL DROUGHT: A COMPARISON BETWEEN NATIVE AND AGRONOMIC COMMUNITIES . . . . . . . . . . . . . . . . . . . . . . . . . . . . . . . . . . . . . . . . . . . 76
Introduction . . . . . . . . . . . . . . . . . . . . . . . . . . . . . . . . . . . . . . . . . . . . . . . . . . 76Materials and Methods . . . . . . . . . . . . . . . . . . . . . . . . . . . . . . . . . . . . . . . . . 78
Description of Source Material Sites . . . . . . . . . . . . . . . . . . . . . . . . . . 78Experimental Design . . . . . . . . . . . . . . . . . . . . . . . . . . . . . . . . . . . . . . 78
Results . . . . . . . . . . . . . . . . . . . . . . . . . . . . . . . . . . . . . . . . . . . . . . . . . . . . . . 81Discussion . . . . . . . . . . . . . . . . . . . . . . . . . . . . . . . . . . . . . . . . . . . . . . . . . . . 84
Water Uptake Following Periods of Drought . . . . . . . . . . . . . . . . . . . . 84Differences in the Rate of Water Uptake After Drought . . . . . . . . . . . 86
Summary and Conclusions . . . . . . . . . . . . . . . . . . . . . . . . . . . . . . . . . . . . . . 88References Cited . . . . . . . . . . . . . . . . . . . . . . . . . . . . . . . . . . . . . . . . . . . . . . 89
6. COMPARATIVE WATER USE EFFICIENCY OF SELECTED NATIVE AND AGRONOMIC GRASS COMMUNITIES . . . . . . . . . . . 93
Introduction . . . . . . . . . . . . . . . . . . . . . . . . . . . . . . . . . . . . . . . . . . . . . . . . . . 93Materials and Methods . . . . . . . . . . . . . . . . . . . . . . . . . . . . . . . . . . . . . . . . . 94
vii
TABLE OF CONTENTS - (Continued)
Site Description of Source Plant Material . . . . . . . . . . . . . . . . . . . . . . 94Experimental Design . . . . . . . . . . . . . . . . . . . . . . . . . . . . . . . . . . . . . . 95
Results . . . . . . . . . . . . . . . . . . . . . . . . . . . . . . . . . . . . . . . . . . . . . . . . . . . . . . 96Environmental Conditions . . . . . . . . . . . . . . . . . . . . . . . . . . . . . . . . . . 96Above Ground Water Use Efficiency (Above Ground WUE) . . . . . . 97Crown and Root Mass . . . . . . . . . . . . . . . . . . . . . . . . . . . . . . . . . . . . 100
Discussion . . . . . . . . . . . . . . . . . . . . . . . . . . . . . . . . . . . . . . . . . . . . . . . . . . 101The Effect of Water Content on Roots, Crowns and Above Ground Water Use Efficiency . . . . . . . . . . . . . . . . . . . . . . 101Above Ground WUE . . . . . . . . . . . . . . . . . . . . . . . . . . . . . . . . . . . . . 103
Summary and Conclusions . . . . . . . . . . . . . . . . . . . . . . . . . . . . . . . . . . . . . 104References Cited . . . . . . . . . . . . . . . . . . . . . . . . . . . . . . . . . . . . . . . . . . . . . 106
7. SUMMARY . . . . . . . . . . . . . . . . . . . . . . . . . . . . . . . . . . . . . . . . . . . . . . . . 111
APPENDICES . . . . . . . . . . . . . . . . . . . . . . . . . . . . . . . . . . . . . . . . . . . . . . . . . . . . 118
APPENDIX A: NITROGEN PARTITIONING TABLES IN CHAPTER 3 . . . 119
APPENDIX B: NITROGEN PARTITIONING TABLES IN CHAPTER 4 . . . 130
viii
LIST OF TABLES
Table Page
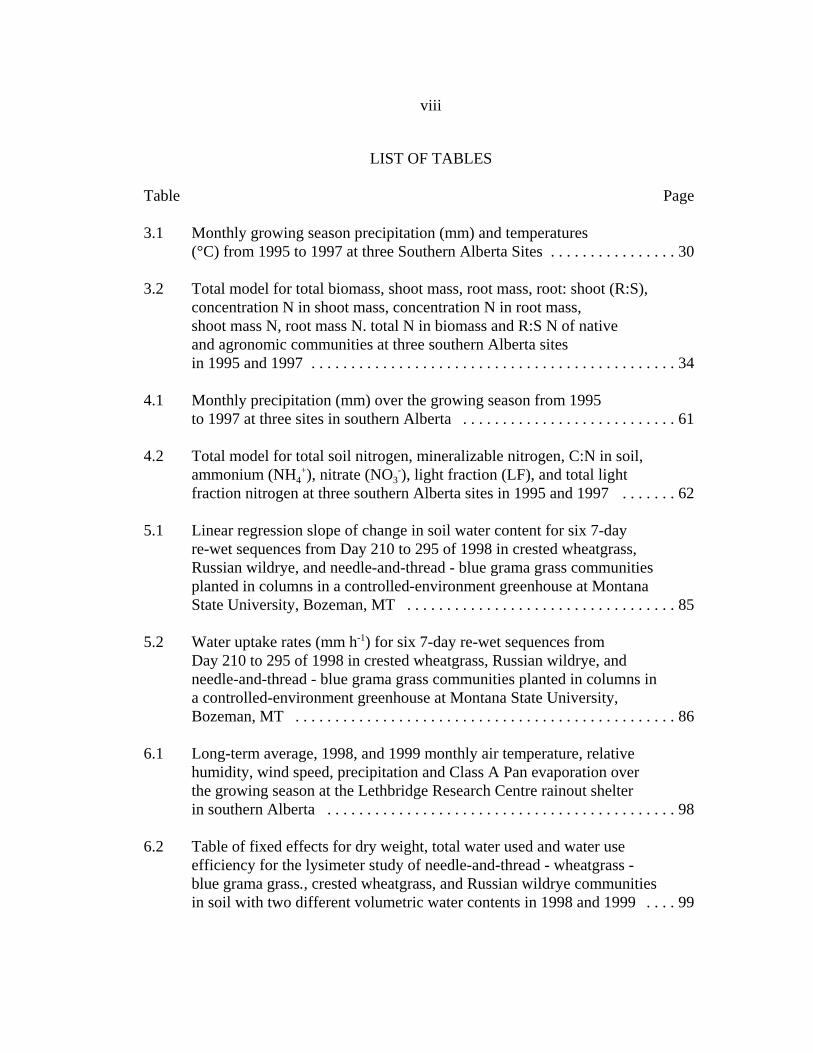
3.1 Monthly growing season precipitation (mm) and temperatures (°C) from 1995 to 1997 at three Southern Alberta Sites . . . . . . . . . . . . . . . . 30
3.2 Total model for total biomass, shoot mass, root mass, root: shoot (R:S),concentration N in shoot mass, concentration N in root mass, shoot mass N, root mass N. total N in biomass and R:S N of native and agronomic communities at three southern Alberta sites in 1995 and 1997 . . . . . . . . . . . . . . . . . . . . . . . . . . . . . . . . . . . . . . . . . . . . . . 34
4.1 Monthly precipitation (mm) over the growing season from 1995 to 1997 at three sites in southern Alberta . . . . . . . . . . . . . . . . . . . . . . . . . . . 61
4.2 Total model for total soil nitrogen, mineralizable nitrogen, C:N in soil,ammonium (NH4
+), nitrate (NO3-), light fraction (LF), and total light
fraction nitrogen at three southern Alberta sites in 1995 and 1997 . . . . . . . 62
5.1 Linear regression slope of change in soil water content for six 7-day re-wet sequences from Day 210 to 295 of 1998 in crested wheatgrass, Russian wildrye, and needle-and-thread - blue grama grass communities planted in columns in a controlled-environment greenhouse at Montana State University, Bozeman, MT . . . . . . . . . . . . . . . . . . . . . . . . . . . . . . . . . . 85
5.2 Water uptake rates (mm h-1) for six 7-day re-wet sequences from Day 210 to 295 of 1998 in crested wheatgrass, Russian wildrye, and needle-and-thread - blue grama grass communities planted in columns in a controlled-environment greenhouse at Montana State University, Bozeman, MT . . . . . . . . . . . . . . . . . . . . . . . . . . . . . . . . . . . . . . . . . . . . . . . . 86
6.1 Long-term average, 1998, and 1999 monthly air temperature, relative humidity, wind speed, precipitation and Class A Pan evaporation over the growing season at the Lethbridge Research Centre rainout shelter in southern Alberta . . . . . . . . . . . . . . . . . . . . . . . . . . . . . . . . . . . . . . . . . . . . 98
6.2 Table of fixed effects for dry weight, total water used and water use efficiency for the lysimeter study of needle-and-thread - wheatgrass - blue grama grass., crested wheatgrass, and Russian wildrye communities in soil with two different volumetric water contents in 1998 and 1999 . . . . 99

ix
LIST OF TABLES - (Continued)
Table Page
6.3 Dry matter production (g), total water use (kg) and water use efficiency (g kg -1) in native (needle-and-thread grass - wheatgrass - blue grama grass), crested wheatgrass, and Russian wildrye communities in 1998 and 1999 . . . . . . . . . . . . . . . . . . . . . . . . . . . . . . . . 99
6.4 Total root mass and root mass for 0-15 cm, 0-45 cm, and 45-90 cm depths in native (needle-and-thread grass - wheatgrass - blue grama grass), crested wheatgrass, and Russian wildrye communities grown in a rain-out shelter under two soil moisture regimes at Lethbridge, Alberta, Canada, in 1999 . . . . . . . . . . . . . . . . . . . . . . . . . . 100
6.5 Mass of crowns at two different soil water contents (2) in crested wheatgrass, Russian wildrye and native Mixed Prairie (needle-and-thread grass - wheatgrass - blue grama grass) grown in a rain-out shelter at the Lethbridge Research Centre, Lethbridge, Alberta, Canada in 1998-1999 . . . . . . . . . . . . . . . . . . . . . . . . . . . . . . . 101
x
LIST OF FIGURES
Figure Page
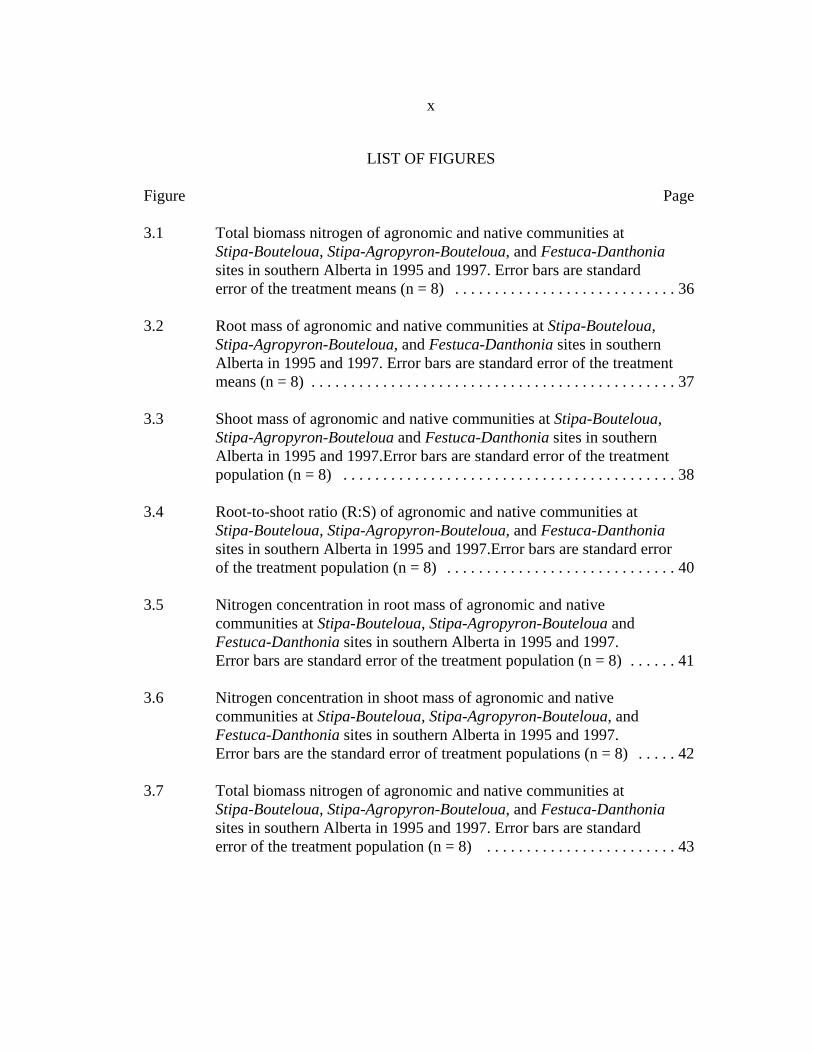
3.1 Total biomass nitrogen of agronomic and native communities at Stipa-Bouteloua, Stipa-Agropyron-Bouteloua, and Festuca-Danthonia sites in southern Alberta in 1995 and 1997. Error bars are standard error of the treatment means (n = 8) . . . . . . . . . . . . . . . . . . . . . . . . . . . . 36
3.2 Root mass of agronomic and native communities at Stipa-Bouteloua,Stipa-Agropyron-Bouteloua, and Festuca-Danthonia sites in southern Alberta in 1995 and 1997. Error bars are standard error of the treatment means (n = 8) . . . . . . . . . . . . . . . . . . . . . . . . . . . . . . . . . . . . . . . . . . . . . . 37
3.3 Shoot mass of agronomic and native communities at Stipa-Bouteloua,Stipa-Agropyron-Bouteloua and Festuca-Danthonia sites in southern Alberta in 1995 and 1997.Error bars are standard error of the treatment population (n = 8) . . . . . . . . . . . . . . . . . . . . . . . . . . . . . . . . . . . . . . . . . . 38
3.4 Root-to-shoot ratio (R:S) of agronomic and native communities atStipa-Bouteloua, Stipa-Agropyron-Bouteloua, and Festuca-Danthonia sites in southern Alberta in 1995 and 1997.Error bars are standard error of the treatment population (n = 8) . . . . . . . . . . . . . . . . . . . . . . . . . . . . . 40
3.5 Nitrogen concentration in root mass of agronomic and native communities at Stipa-Bouteloua, Stipa-Agropyron-Bouteloua and
Festuca-Danthonia sites in southern Alberta in 1995 and 1997. Error bars are standard error of the treatment population (n = 8) . . . . . . 41
3.6 Nitrogen concentration in shoot mass of agronomic and native communities at Stipa-Bouteloua, Stipa-Agropyron-Bouteloua, and Festuca-Danthonia sites in southern Alberta in 1995 and 1997. Error bars are the standard error of treatment populations (n = 8) . . . . . 42
3.7 Total biomass nitrogen of agronomic and native communities at Stipa-Bouteloua, Stipa-Agropyron-Bouteloua, and Festuca-Danthonia sites in southern Alberta in 1995 and 1997. Error bars are standard error of the treatment population (n = 8) . . . . . . . . . . . . . . . . . . . . . . . . 43

xi
LIST OF FIGURES - (Continued)
Figure Page
3.8 Total nitrogen in shoot mass of agronomic and native communities at Stipa-Bouteloua, Stipa-Agropyron-Bouteloua, and Festuca-Danthonia sites in southern Alberta in 1995 and 1997. Error bars are standard error of the treatment population (n = 8) . . . . . . . . . . . . . . . . . . . . . . . . . . . . . . . . 45
3.9 Total nitrogen in roots of agronomic and native communities at Stipa-Bouteloua, Stipa-Agropyron-Bouteloua and Festuca-Danthonia sites in southern Alberta in 1995 and 1997. Error bars are standard error of the treatment population (n = 8) . . . . . . . . . . . . . . . . . . . . . . . . . . . . . . . . 46
4.1 Light fraction (LF) concentrations in the upper 7.5 cm of agronomic and native communities in Stipa-Bouteloua, Stipa-Agropyron-Bouteloua, and Festuca-Danthonia sites in 1995 and 1997. Error bars are the standard error of treatment means (n = 8) . . . . . . . . . . . . . . . . . . . . . . . . . . . 63
4.2 Total nitrogen content of the light fraction (LFN) in the upper 7.5 cm ofagronomic and native communities at Stipa-Bouteloua (SB), Stipa-Agropyron-Bouteloua (SAB), and Festuca-Danthonia (FD) sites in 1995 and 1997. Error bars are the standard error of treatment means (n = 8) . . . . . . . . . . . . . . . . . . . . . . . . . . . . . . . . . . . . . . . . . . . . . . . . 64
4.3 Mineralizable N in the upper 15 cm of agronomic and native communities at Stipa-Bouteloua, Stipa-Agropyron-Bouteloua, and Festuca-Danthonia sites in 1995 and 1997. Error bars are the standard error of treatment (n = 8) . . . . . . . . . . . . . . . . . . . . . . . . . . . . . . . . . . . . . . . 65
4.4 Nitrate content in the upper 15 cm of agronomic and native communities at Stipa-Bouteloua, Stipa-Agropyron-Bouteloua, and Festuca-Danthonia sites in 1995 and 1997. Error bars are the standard error of treatment means (n = 8) . . . . . . . . . . . . . . . . . . . . . . . . . . . . . . . . . . . . . . . . . . . . . . . . 67
5.1 Changes in soil water content during six rewetting sequences between Day 210 and 245 of 1998 at 7.5, 15, and 30 cm soil depths in crested wheatgrass, Russian wildrye, and needle-and-thread - blue grama grasscommunities grown in columns at the controlled-environment greenhouse at Montana State University, Bozeman, MT. . . . . . . . . . . . . . . . . . . . . . . . . 80

xii
LIST OF FIGURES - (Continued)
Figure Page
5.2 Changes in soil water content during the first two re-wetting sequences (re-wet 1 and 2) between Day 210 and 245 of 1998 at 7.5 and 15 cm soil depths in crested wheatgrass, Russian wildrye, and needle-and-thread - blue grama grass communities grown in columns at the controlled-environment greenhouse at Montana State University, Bozeman, MT . . . . . . . . . . . . . . . . . . . . . . . . . . . . . . . . . . . . . . . . . . . . . . . . 82
5.3 Changes in soil water content during the second two re-wetting sequences (re-wet 3 and 4) between Day 245 and 275 of 1998 at 7.5 and 15 cm soil depths in crested wheatgrass, Russian wildrye, and needle-and-thread - blue grama grass communities grown in columns at the controlled-environment greenhouse at Montana State University, Bozeman, MT . . . . . . . . . . . . . . . . . . . . . . . . . . . . . . . . . . . . . . . . . . . . . . . . 83

xiii
ABSTRACT
The objectives of this research were to evaluate 1) short-term changes in soil andplant N partitioning created by cultivating and re-seeding native grasslands with twocropping systems of wheat and perennial (crested wheatgrass and Russian wildrye)monocultures; 2) differences in the rate of soil water uptake between Mixed Prairiegrasslands, crested wheatgrass and Russian wildrye after a dry-down period; and 3)differences in above ground water use efficiencies, root and crown masses betweenMixed Prairie grasslands, crested wheatgrass and Russian wildrye under two differentsoil water contents. The perennial agronomic species were recommended by Agricultureand Agrifood Canada for seeding in Mixed Prairie and Fescue grassland in southernAlberta, Canada. In the first four years after plow-down, soil nitrate (NO3
-) concentrationwas higher and light fraction N (LFN) was lower in the soil under wheat than nativegrasslands. Although LFN was lower in perennial monocultures than native grasslands,there was little difference in soil nitrate. More N was partitioned into shoot biomass ofwheat, crested wheatgrass and bromegrass that native grasslands and levels increased asannual and long-term growing season precipitation increased. There were no differencesin the rate of soil water uptake after dry-down periods between native Mixed Prairie,crested wheatgrass or Russian wildrye, but both perennial monocultures had higher aboveground water use efficiencies than native Mixed Prairie.

1
1The names of some of the grasses in these communities have been revised, but the communities themselves have not been renamed.
CHAPTER 1
INTRODUCTION
Over 60% of the 114 million acres of the Northern Great Plains occur in Canada
(Padbury et al. 2002), with a majority being found on an eastward sloping plain between
the Rocky Mountains and the Precambrian Shield. The zonal climate of this northern
grassland is marked by low growing season precipitation, high winds, and drought, with
differences in amount, pattern, variability, intensity, and duration of precipitation
determining the size and species composition of each plant association. Although five
associations occur in the Canadian Northern Great Plains, only Mixed Prairie, Fescue
Prairie, and Parkland are found in Alberta (Smoliak et al. 1976).
In the Mixed Prairie association of southcentral and southeastern Alberta, a lack
of relief coupled with a variable dry-subhumid to semi-arid climate and the presence of a
Chernozemic soil allows the co-existence of mid and short-grass species (Clements 1920,
Coupland 1992a). This association can be further divided into five vegetation types1:
Agropyron-Koelaria, Bouteloua-Agropyron, Stipa-Agropyron, Stipa-Bouteloua and
Stipa-Agropyron-Bouteloua. The first two vegetation types are primarily edaphic
climaxes; the Agropyron-Koelaria vegetation type occurs on soils originating from
lacustrine clay deposits and the Bouteloua-Agropyron vegetation type has underlying

2
shale and a Solonetzic character to the soil. The Stipa-Bouteloua and Stipa-Agropyron-
Bouteloua vegetation types occur in loamy soils with differences in soil and species
composition primarily the result of differences in long-term average annual precipitation.
The Stipa-Bouteloua community in southeastern Alberta exists on the Brown subgroup of
the Chernozemic order (Aridic Ustochept) with a long-term average annual precipitation
near 33 cm, while the Stipa-Agropyron-Bouteloua community of southcentral Alberta
occurs on Dark Brown subgroups of the Chernozemic order (Typic Haploboroll) with an
average annual precipitation near 40.2 cm. Both of the above vegetation types are
affected by high evaporation which leads to precipitation-to-evaporation ratios between
0.3 and 0.5. The final vegetation type in the Mixed Prairie is Stipa-Agropyron which is
thought to be a transition between Mixed Prairie and Fescue Prairie (Smoliak et al. 1976).
In Alberta, Fescue Prairie is restricted to the north and northwest fringe of the
Northern Great Plains in the lower southern foothills of the Rocky Mountains (Strong
1992) where the large bunchgrasses Festuca campestris Rydb. (rough Fescue) and
Danthonia parryi Scrib. (Parry’s oatgrass) are dominant (Moss 1944). In this grassland
the climate is sub-humid, and the soils are classified as Orthic Black Chernozemic soils
(Udic Haploboroll). The average annual precipitation is 55 cm, with a precipitation-to-
evaporation ratio approximating 1.0, and less than 170 growing season days (Coupland
1961, Naeth et al. 1991). Although precipitation is higher in this association than in the
Mixed Prairie, the increase in the precipitation-to-evaporation ratio is primarily a result
of lower evaporation due to the higher altitude which results in a lower annual
temperature (Hart et al. 1995).
3
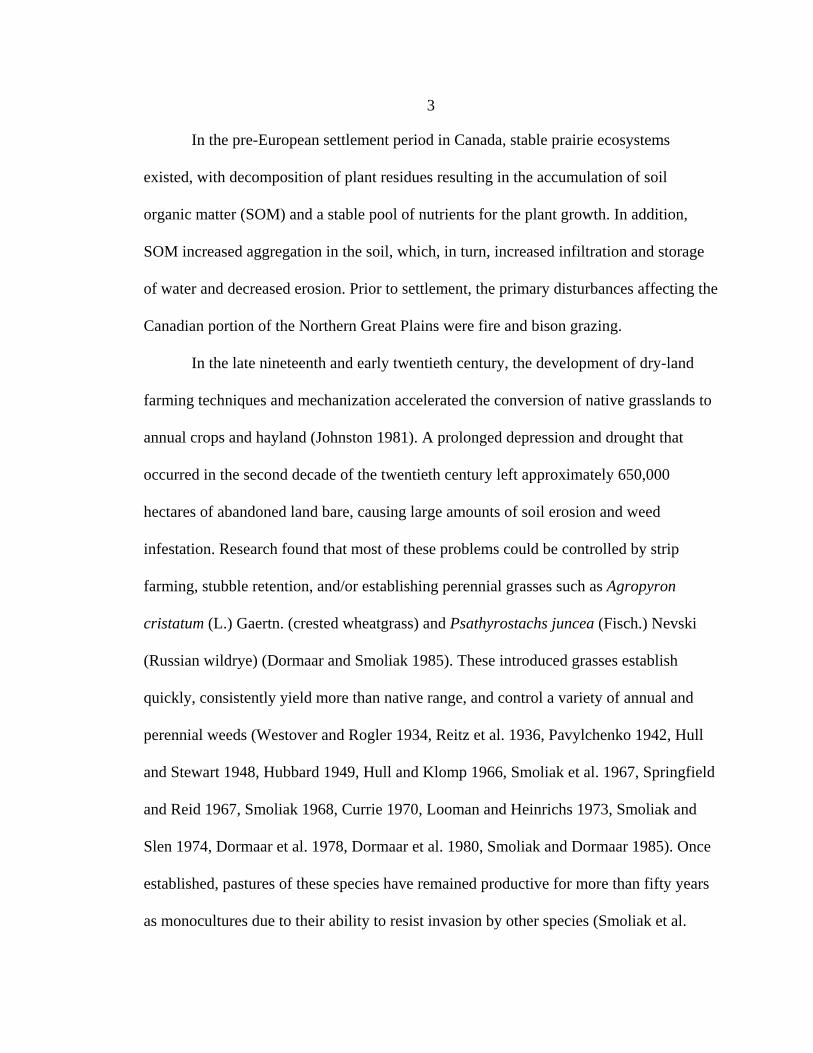
In the pre-European settlement period in Canada, stable prairie ecosystems
existed, with decomposition of plant residues resulting in the accumulation of soil
organic matter (SOM) and a stable pool of nutrients for the plant growth. In addition,
SOM increased aggregation in the soil, which, in turn, increased infiltration and storage
of water and decreased erosion. Prior to settlement, the primary disturbances affecting the
Canadian portion of the Northern Great Plains were fire and bison grazing.
In the late nineteenth and early twentieth century, the development of dry-land
farming techniques and mechanization accelerated the conversion of native grasslands to
annual crops and hayland (Johnston 1981). A prolonged depression and drought that
occurred in the second decade of the twentieth century left approximately 650,000
hectares of abandoned land bare, causing large amounts of soil erosion and weed
infestation. Research found that most of these problems could be controlled by strip
farming, stubble retention, and/or establishing perennial grasses such as Agropyron
cristatum (L.) Gaertn. (crested wheatgrass) and Psathyrostachs juncea (Fisch.) Nevski
(Russian wildrye) (Dormaar and Smoliak 1985). These introduced grasses establish
quickly, consistently yield more than native range, and control a variety of annual and
perennial weeds (Westover and Rogler 1934, Reitz et al. 1936, Pavylchenko 1942, Hull
and Stewart 1948, Hubbard 1949, Hull and Klomp 1966, Smoliak et al. 1967, Springfield
and Reid 1967, Smoliak 1968, Currie 1970, Looman and Heinrichs 1973, Smoliak and
Slen 1974, Dormaar et al. 1978, Dormaar et al. 1980, Smoliak and Dormaar 1985). Once
established, pastures of these species have remained productive for more than fifty years
as monocultures due to their ability to resist invasion by other species (Smoliak et al.
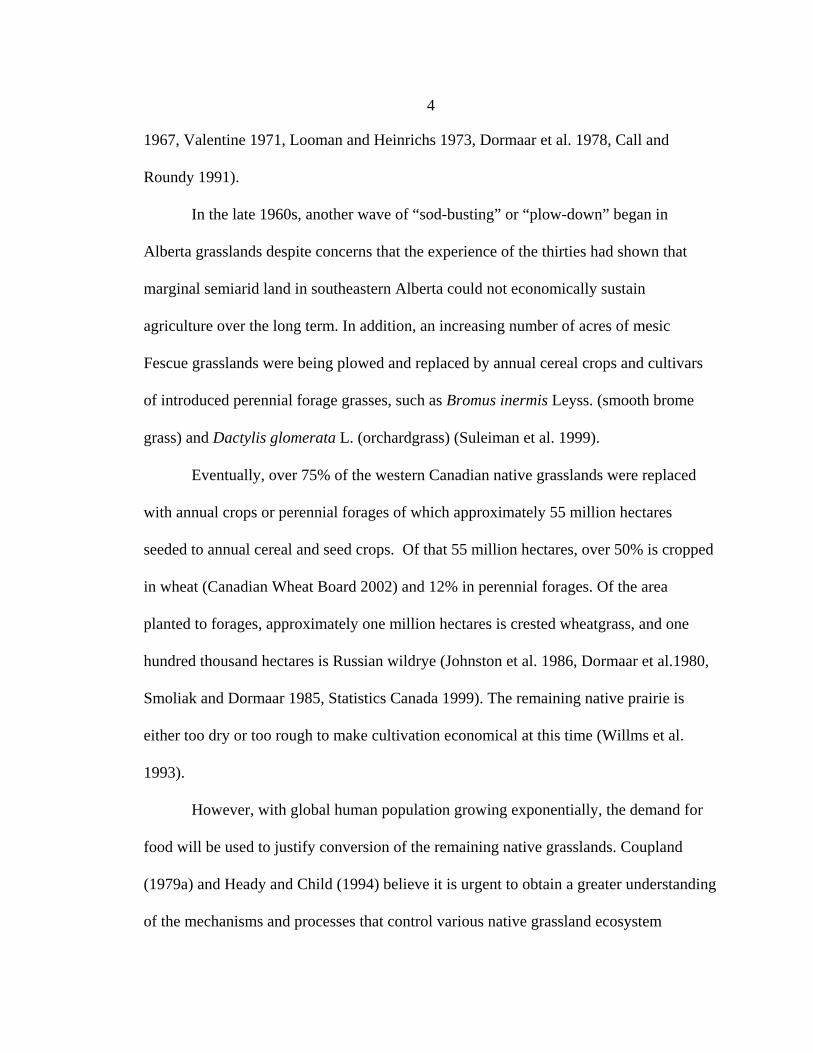
4
1967, Valentine 1971, Looman and Heinrichs 1973, Dormaar et al. 1978, Call and
Roundy 1991).
In the late 1960s, another wave of “sod-busting” or “plow-down” began in
Alberta grasslands despite concerns that the experience of the thirties had shown that
marginal semiarid land in southeastern Alberta could not economically sustain
agriculture over the long term. In addition, an increasing number of acres of mesic
Fescue grasslands were being plowed and replaced by annual cereal crops and cultivars
of introduced perennial forage grasses, such as Bromus inermis Leyss. (smooth brome
grass) and Dactylis glomerata L. (orchardgrass) (Suleiman et al. 1999).
Eventually, over 75% of the western Canadian native grasslands were replaced
with annual crops or perennial forages of which approximately 55 million hectares
seeded to annual cereal and seed crops. Of that 55 million hectares, over 50% is cropped
in wheat (Canadian Wheat Board 2002) and 12% in perennial forages. Of the area
planted to forages, approximately one million hectares is crested wheatgrass, and one
hundred thousand hectares is Russian wildrye (Johnston et al. 1986, Dormaar et al.1980,
Smoliak and Dormaar 1985, Statistics Canada 1999). The remaining native prairie is
either too dry or too rough to make cultivation economical at this time (Willms et al.
1993).
However, with global human population growing exponentially, the demand for
food will be used to justify conversion of the remaining native grasslands. Coupland
(1979a) and Heady and Child (1994) believe it is urgent to obtain a greater understanding
of the mechanisms and processes that control various native grassland ecosystem

5
components, including the capture and flow of energy and nutrient cycles such carbon,
nitrogen, and phosphorous, since they are pivotal in sustaining grassland ecosystem
function.
In the past, as native grasslands were replaced with agronomic systems, over-
simplification of natural systems, poor interpretation of knowledge, and the need for
quick results meant a loss of economic sustainability (Costello 1957, Heady and Child
1994). Although in the short term, replacement generally increases yields of both annual
cereals and forage crops, it is likely due to changes in ammonification, nitrification, and
water use (Johnston et al. 1986). However, more baseline information is needed to better
understand both the changes and the rate of change immediately following cultivation.
This project was initiated to investigate changes in nitrogen partitioning and water
dynamics in the first few years after plowing and seeding native grasslands in southern
Alberta Canada to annual and perennial agronomic species. The objectives of this study
were to determine 1) short-term changes in soil N partitioning created by the cultivating
and seeding native grasslands with selected annual (wheat) and perennial (crested
wheatgrass and Russian wildrye) monocultures; 2) changes in biomass partitioning of N
within these communities; 3) difference in the rate of water uptake between Mixed
Prairie grasslands, crested wheatgrass and Russian wildrye after a period of water stress;
and 4) differences in above ground water use efficiencies, root and crown masses
between Mixed Prairie grasslands, crested wheatgrass and Russian wildrye at two
different soil water content. It is hypothesized that above-ground production of seeded
forages and cereals is greater than native grassland communities in the first few years

6
after “plow-down.” During that period, the quality of the soil is expected to deteriorate
and will ultimately cause the system to be unsustainable. The rate of uptake after a period
of water stress of perennial communities (crested wehatgrass and Russian wildrye) will
be more rapid and water use efficiency will be greater allowing these agronomic
communities to access and assimilate more soil nitrogen.

7
References Cited
Call, C.A. and R.A. Roundy. 1991. Perspectives and processes in revegetation of arid andsemiarid rangelands. Journal of Range Management 44:543-549.
Canadian Wheat Board. 2002. www.cwb.ca.
Clements, F.E. 1920. Plant indicators: the relationship of communities to process andpractice. Carnegie Institute Washington Publication 290. 388 p.
Costello, D.F. 1957. Application of ecology to range management. Ecology 38:49-53.
Coupland, R.T. 1961. A recondieration of grassland classification in the Northern GreatPlains of North America. Journal of Ecology 49:135-167.
Coupland, R.T. 1979a. Background. In: R.T. Coupland (ED.). Grassland ecosystems ofthe world: analysis of grasslands and their uses. Cambridge, Great Britain:Cambridge University Press. p. 3-22.
Coupland, R.T. 1992a. Mixed prairie. In: R.T. Coupland (ED.). Ecosystems of the world8A: natural grasslands - introduction and western hemisphere. New York, NY:Elsevier. 469 p.
Currie, P.O. 1970. Influence of spring, fall and spring-fall grazing on crested wheatgrassrange. Journal of Range Management 23:103-108.
Dormaar, J.F., A. Johnston, and S. Smoliak. 1978. Long term soil changes associatedwith seed stands of crested wheatgrass in Southern Alberta, Canada. In: Proc. 1stInternational Rangelands Congress. Denver, CO: Society for Range Managment.p. 623-625.
Dormaar, J.F., A. Johnston, and S. Smoliak. 1980. Organic solvent-soluble organicmatter from soils underlying range and crested wheatgrass in southeasternAlberta, Canada. Journal of Range Management 33:99-101.
Dormaar, J.F., and S. Smoliak. 1985. Recovery of vegetative cover and soil organicmatter during revegetation of abandoned farmland in a semiarid climate. Journalof Range Management 38:487-491.
Hart, R.H., W.D. Willms, and M.R. George. 1995. Cool-Season Grasses in Rangelands.Chapter 12. In: L.E. Moser (ED.). Cool-season forage grasses. Madison, WI:Agronomy Monographs #24.

8
Heady, H.F., and D. Child. 1994. Rangeland ecology and management. San Fransisco,CA: Westview Press.
Hubbard, W.A. 1949. Results of studies of crested wheatgrass. Science and Agriculture 29:385-395.
Hull, A.C., and G.J. Klomp. 1966. Longevity of crested wheatgrass in the sagebrushgrass type in southern Utah. Journal of Range Management 19:5-11.
Hull, A.C., and G. Stewart. 1948. Replacing cheatgrass by reseeding with perennialgrasses on southern Idaho range. Journal of American Society of Agronomy40:694-703.
Johnston, A. 1981. History of agriculture in the prairie region of western Canada.Director’s Work- Planning Meeting. Agriculture Research Station. Lethbridge.
Johnston, A., Dormaar J.F., and S. Smoliak. 1986. The regrassing of southeasternAlberta. The Palliser Triangle: Interdisciplinary Studies of the Alberta,Saskatchewan and Montana Borderlands. May 15-18, 1986. Medicine Hat, AB:11 p.
Looman, J., and D.H. Heinrichs. 1973. Stability of crested wheatgrass pastures underlong-term pasture use. Canadian Journal of Plant Science 53:501-506.
Moss, E.H. 1944. The prairie and associated vegetation of southwestern Alberta, Canada.Journal of Resources C22:209-227.
Naeth, M.A., A.W. Bailey, D.S. Chanasyk, and D.J. Pluth. 1991. Water holding capacityof litter and soil organic matter in Mixed Prairie and Fescue grassland ecosystemsof Alberta. Journal of Range Management 44(1):13-17.
Padbury, G., S. Waltman, J. Caprio, G. Coen, S. McGinn, D. Mortenson, J. Nielson, andR. Sinclair. 2002. Agroecosystems and Land Resources of the Northern GreatPlains Agronomy Journal 94:251-261.
Pavylchenko, T.K. 1942. The place of crested wheatgrass, Agropyron cristatum L. incontrolling perennial weeds. Science and Agriculture 22:459-460.
Reitz, L.P. M.A. Bell, and H.E. Tower. 1936. Crested wheatgrass in Montana. MontanaState College Agriculture Experimental Station Bulletin 323. 53 p.
Smoliak, S. 1968. Grazing studies on native range, crested wheatgrass and Russianwildrye pastures. Journal of Range Management 21:44-50.

9
Smoliak, S., and J.F. Dormaar. 1985. Production of Russian wildrye and crestedwheatgrass and their effect on prairie soils. Journal of Range Management38(5):403-405.
Smoliak, S., A. Johnston, M.R. Kilcher, and R.W. Lodge. 1976. Management of prairierangeland. Publication 1425. Ottawa, ON: Information Division, Department ofAgriculture. 30 p.
Smoliak, S., A. Johnston, and L.E. Lutwick. 1967. Productivity and durability of crestedwheatgrass in southeastern Alberta. Canadian Journal of Plant Science 47:539-547.
Smoliak, S., and S.B. Slen. 1974. Beef production on native range, crested wheatgrassand Russian wildrye pastures. Journal of Range Management 27:433-436.
Springfield, H.W., and E.H. Reid. 1967. Crested wheatgrass for spring grazing innorthern New Mexico. Journal of Range Management 20:406-408.
Statistics Canada. 1999. Table of seeded acres of cereal and forage crops in Canada in1999. http://cansim2.statca.ca/
Strong, W.L. 1992. Ecoregions and ecodistricts of Alberta. Volume 1. Edmonton, AB:Alberta Forestry, Lands and Wildlife.
Suleiman, A., E.K. Okine, L.A. Goonewardene, P.A. Day, B. Yaremcio, and G. Recinos-Diaz. 1999. Yield and feeding of prairie grasses in east-central Alberta. Journal ofRange Management 52(1): 75-82.
Valentine, J.F. 1971. Range development and improvements. Provo, UT: Brigham YoungUniversity Press. 545 p.
Westover, H.L., and G.A. Rogler. 1934. Crested wheatgrass. U.S.D.A. Leaflet 104.(revised 1947). 8 p.
Willms, W.D., S.M. McGinn, and J.F. Dormaar. 1993. Influence of litter on herbageproduction in the Mixed Prairie. Journal of Range Management 46(4):320-324.
10
CHAPTER 2
LITERATURE REVIEW
Plant Community Dynamics
The process by which assemblages of plant species develop into long-lived stable
communities in specific environments has been debated since Clements (1916) first
developed the climate climax theory. In the last 30 years, a synthesis of ideas relating to
community stability has emerged among such diverse fields as ecophysiology, soil
organic matter dynamics, herbivory, plant competition, and fire ecology, in which a
discussion of vegetation-soil feedbacks in grassland ecology is central.
Tilman (1987a) suggested that a mechanistic approach to grassland ecology
would allow the development of this concept and move away from the rather
deterministic view put forth by Clements. This approach would define species
performance in terms of demography (including patterns of recruitment and mortality),
resource use efficiency, and partitioning, under specific environmental conditions such as
water, nutrient and light availability, herbivory, and disturbance. Within the performance
criteria, linkages between nitrogen cycling, soil organic matter dynamics, and plant
nitrogen use are fundamental (Tilman 1988, Wedin 1999). In most ecosystems, it is
assumed that the dominant plant species control ecosystem processes such as
productivity and nutrient cycling (Schlesinger 1996); however, recent studies have
11
addressed a range of ecosystem characteristics including the diversity of plant species
and functional characteristics of individual species (Tilman et al. 1997, Hooper and
Vitousek 1998, Hector et al. 1999, Knops et al. 2001, Loreau et al. 2001). The functional
characteristics of the component species in any ecosystem are likely to be at least as
important as the number of functional groups present for maintaining critical ecosystem
processes and services (Hooper and Vitousek 1997).
Plant species adapted to temporary, highly variable and uncrowded environments
as occur after disturbance have different life histories than those found in stable, crowded
environments. The former have short life spans (annual or biennial), rapid
photosynthetic, respiratory, transpiratory, growth, and reproductive rates, relatively low
root:shoot ratios (R:S), rapid responses to changes in environmental resources, and high
acclimation and dispersal ability. In most native grassland communities, a majority of the
species are stable assemblages of perennial species. These species are capable of
withstanding competition, possess slow growth and low reproductive rates, and direct
more resources into organs that will guarantee survival over the long term (e.g., higher
R:S) (Bazzaz 1986, Brewer 1988). Once these communities are disturbed, succession
may depart from the expected outcomes proposed by classical Clementsian theory (Ellis
and Swift 1988, Behnke et al. 1993) due to discontinuous irreversible changes associated
with most disturbances (Holechek et al. 1998). Cultivation of native grasslands causes
physical, chemical, and biological changes in the soil, as well as altering the plant
community such that feedbacks between existing soil characteristics and newly
introduced plant species may prevent the redevelopment of the original community when
12
cultivation ceases (Vinton and Burke 1995). Changes in productivity and R:S ratios may
change the quality and quantity of N partitions in the soil.
Cultivation and Nitrogen
Both natural and agricultural ecosystems provide many services and goods that
are essential for food and a range of other products that support our existence (Matson et
al. 1997). A burgeoning global human population has created an increased need for the
production of food, and increasing agricultural intensification is resulting in a reduction
of diversity, with large areas of monoculture cropping made up not only of identical crop
species, but individuals with the same genetic code (Dearden and Mitchell 1998).
Since the beginning of the twentieth century, improved agricultural technologies
such as mechanization, irrigation, molecular genetics, fertilizers, and pesticides have
increased yields dramatically. In these systems, the dominant role taken by farmers in the
modifying of the abiotic environment, selection of organisms planted, and control of
species that reduce production represents a cost to the rest of the ecosystem in terms of
energy, matter, and biological diversity. These changes do not necessarily result in the
impairment of ecosystem services unless diversity-function thresholds are breached by
the elimination of key functional groups, species, or organisms (Swift et al. 2004).
Tillage and seeding of the landscape and changes of native grasslands causes
massive modifications in the structural and functional diversity of communities and
ecosystems. These activities introduce species with differences in lifespan, growth form,
biomass allocation, and tissues chemistry than existed in the original community.

13
Changes also include modification in soil structure, bulk density chemistry, thermal and
hydraulic properties, aggregation, quantity and quality of SOM, N, water retention and
soil microbial and macrobial populations (Griffiths and Burns 1972, Dormaar et al. 1978,
Jenny 1980, Dormaar et al. 1990). All of these changes can have significant impacts on
critical ecosystem processes that promote stability and sustainability.
In the past, dryland agriculture on the Canadian prairies has concentrated on the
production of cereals, oil seeds, and forages. In 2004, cereal species represented the
greatest acreage planted on the Canadian Northern Great Plains, with over 10.3 million
hectares planted to wheat (Statistics Canada 1999). By 1986, 2.5 million hectares of
perennial forage pastures were utilized by the beef industry in the prairie provinces, with
over 1 million in crested wheatgrass and Russian wildrye (Smoliak and Dormaar 1985).
Domestic cereal crops are annual species that have high photosynthetic,
respiration, transpiration, growth and reproductive rates, low root:shoot ratios and highly
viable seeds (Mooney 1972, Newell and Tramer 1978, Bazzaz 1986, Brewer 1988), and
only maintain their dominance through anthrogenic activites such as tillage and
fertilization. These species quickly colonize the new readily-available nitrogen pool
within their rooting zone but may rapidly reduce this N pool. Numerous studies with
wheat have demonstrated reductions in SOM over time, as a function of cropping system,
crop rotation, tillage, and other agronomic factors (Campbell et al. 1990, Janzen et al.
1992). Of particular concern is the loss in labile organic matter, which plays a prominent
role in soil nutrient dynamics and appears to be more susceptible to short-term cropping
practices (Campbell and Souster 1982, Parton et al. 1987, Janzen 1987, Skjemstad et al.

14
1998, Janzen et al. 1992). At some point, without the addition of fertilizer, available soil
N becomes insufficient to support high above-ground biomass production (Redente et al.
1992).
In the last 60 years, perennial grasses have been introduced into the Canadian
northern Great Plains to prevent erosion of abandoned land or to improve land to allow
an increase in beef production (Smoliak et al. 1967). The four prominent species seeded
in these grasslands are crested wheatgrass, Psathyrostachs juncea (Fisch.) Nevski
(Russian wildrye), Dactylis glomerata L. (orchardgrass) and Bromus inermis Leyss.
(smooth bromegrass). The first two species are recommended by Agriculture and
Agrifood Canada for drier Mixed Prairie grasslands and the latter for more moist Mixed
Prairie and Fescue grasslands. Once these grasses are seeded, they tend to become a
permanent part of the landscape (Smoliak et al. 1967).
Crested wheatgrass is tolerant of cold and drought, establishes quickly, is
outstanding in early season production and nutritive value (Knowles and Buglass 1966,
Smoliak at al. 1970, Knowles 1987, Looman and Heinrichs 1973). Redente et al. (1989)
and Christian (1996) reported 1.7 to 3 times greater above-ground biomass with
monocultures of this species than for native grass in Saskatchewan. Although the N
content of the standing crop of crested wheatgrass is higher in the spring, by fall it was
1.01% (Lawrence 1978) due to senescence and N translocation to crowns and roots. The
root mass of crested wheatgrass was between 60 and 71% of the native Stipa-Boutleoua
community (Smoliak et al. 1967, Dormaar et al. 1978, Christian 1996). Russian wildrye,
due to later development, maintains forage quality into the fall. Smoliak and Dormaar
15
(1985) found that over a 25-year period, this species produced 47% more forage than
native grasslands. Smooth bromegrass and orchardgrass are often seeded on soils that are
mildy acidic and/or poorly drained. Bromegrass spreads quickly by rhizomes and
produces higher dry matter yields than orchardgrass. In southwestern Saskatchewan and
nothern Montana, Lawrence (1978), Knowles (1987), and Wickman (1998) found that
varieties of bromegrass have high yields, with between 1.44 and 1.68% N in standing
crop during the fall but protein levels in orchardgrass remain higher (Couleman 1987,
Tannas 1991). Orchardgrass dry matter production is better distributed over the growing
season and is the most competitive of the two species (Couleman 1987, Tannas 1991).
The competitive ability of orchardgrass may be due to its early spring growth and the
presence of many basal leaves (Jung and Baker 1984).
Cultivation and Water Relations
Vast regions of native grasslands experience water stress due to limited
precipitation during the growing season. This lack of moisture may modify nutrient
acquisition, photosynthetic activity and growth, and cause damage in the plant and/or
intensify competition between plants and influence feedback systems that control
ecosystem (Kramer 1980, Swindale and Bidinger 1981, Wedin and Tilman 1990, Brown
1995, Vila and Sardans 1999). The physiological consequences of water deficits differ
with species, type of plant, current environmental conditions. As duration and intensity of
the water deficit persist, changes in root:shoot ratios occur as a result of a slowing in leaf,
shoot and tiller development, and stimulates root growth at the expense of shoots (Sharp

16
and Davies 1979, Brown 1995). Therefore, in grassland research, it is important to study
both plant responses to variations in available water and adaptations to water deficits
(Kramer 1983). Changes in these processes and controlling feedbacks created by tillage
and seeding of annual and perennial monocultures may create the potential for alternate
stable states in vegetation-soil systems (Wedin and Tilman 1990).
A number of researchers contend that the ability of a species to be a successful
competitor is a function of more efficient use of resources such as water (Tilman 1988,
Goldberg 1990, Busch and Smith 1995, Davis et al. 1998, Li 1999, Tsialtas et al. 2001),
while others contend that increased competition is a result of less efficient use by non-
native grasses, resulting in an increase in water uptake and demand, which leaves less for
competing species (Davis et al. 1998, Gordon et al. 1999). Both of these strategies could
inhibit establishment, survival, and/or reproduction of native species (Blicker et al.
2003).
Water use efficiency is defined as either the amount of water consumed by a plant
in transpiration per unit gain in growth or biomass production, or as gain in biomass per
unit of water transpired. Species have variable rates of water use relative to biomass
production, atmospheric conditions (precipitation, vapor pressure deficits between the
plant and air, and wind), stage of plant development, and soil physical and chemical
properties (Stanhill 1986). Water use efficiency is not a fixed characteristic within each
species, but is of interest to plant physiologists, breeders, and range managers because it
is used to define interactions of water use and nutrient gain as they affect plant growth,
survival, and response to stress (Ehleringer et al. 1993, Kramer 1983, Brown 1995,

17
Kramer and Boyer 1995). Measurements of WUE in the field are often hampered by
variability in rainfall, and crop responses to soil type and to agronomic practices (Asseng
et al. 2001). Agronomic practices which change the canopy structure, soil structure, soil
N and energy dynamics, may modify production or water acquisition and WUE
(Claussen 2002, Frank 2003).
Sims and Singh (1978b) suggested that natural communities dominated by cool
season grasses (C3) that possess higher aerial production than those dominated by warm
season (C4) grasses have higher water use efficiencies. However, when C3 species are
compared to C4 species, the latter have higher water use efficiencies due to
photosynthetic and structural differences (Black 1971). In Mixed Prairie and Fescue
Grassland in the northern Great Plains, a large range in WUE exists between
communities due to large variations in precipitation and temperature (Sims and Singh
1978a) which agrees with work done by Vinton and Burke (1995), who suggested these
processes are not primarily limited by plant-mediated characteristics but by the supply of
water itself. Many studies have shown differences in water use efficiency between
species (Johnson et al. 1990, Johnson and Bassett 1991, Read et al.1992, Akhter et al.
2003, Blicker et al. 2003, Xue et al. 2003). An understanding of species and community
differences in soil-water-root relationships will enhance our ability to effectively manage
plant, soil, and water resources, weed infestation, and will allow the design of multi-crop
agro-ecosystems that fill more below-ground niches (Noy-Meir 1973, Grime 1994,
Sheley and Larson 1995, Wraith and Wright 1998).
18
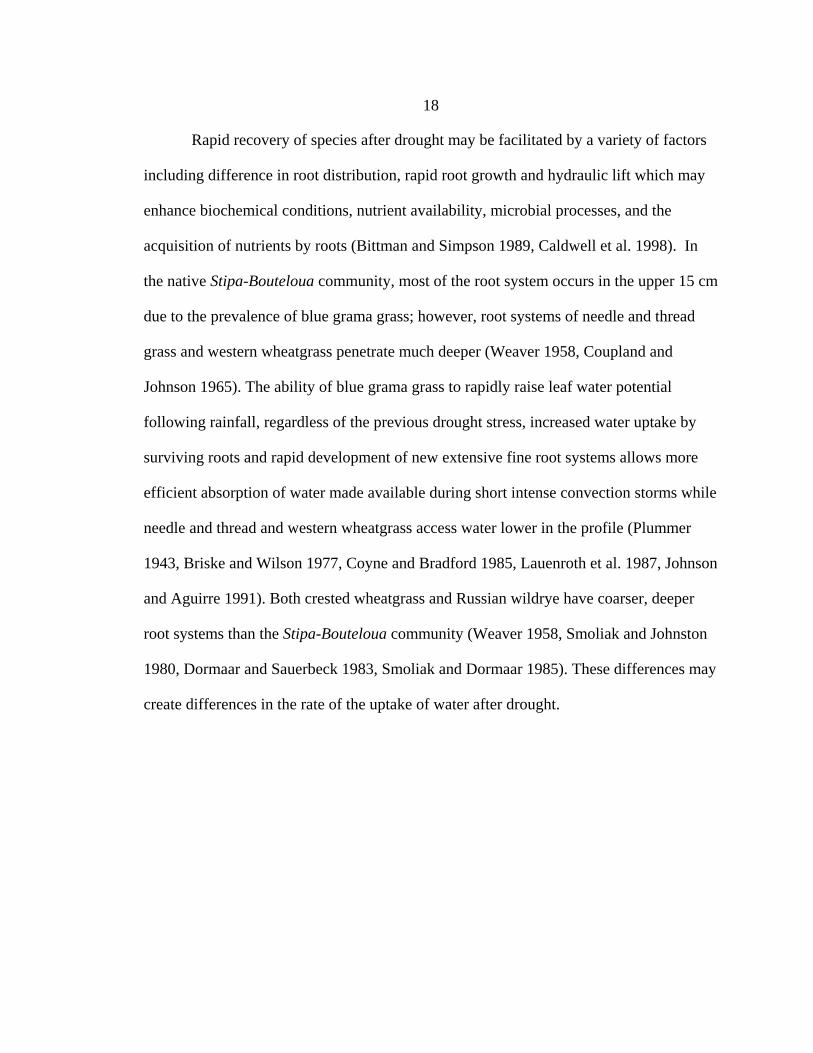
Rapid recovery of species after drought may be facilitated by a variety of factors
including difference in root distribution, rapid root growth and hydraulic lift which may
enhance biochemical conditions, nutrient availability, microbial processes, and the
acquisition of nutrients by roots (Bittman and Simpson 1989, Caldwell et al. 1998). In
the native Stipa-Bouteloua community, most of the root system occurs in the upper 15 cm
due to the prevalence of blue grama grass; however, root systems of needle and thread
grass and western wheatgrass penetrate much deeper (Weaver 1958, Coupland and
Johnson 1965). The ability of blue grama grass to rapidly raise leaf water potential
following rainfall, regardless of the previous drought stress, increased water uptake by
surviving roots and rapid development of new extensive fine root systems allows more
efficient absorption of water made available during short intense convection storms while
needle and thread and western wheatgrass access water lower in the profile (Plummer
1943, Briske and Wilson 1977, Coyne and Bradford 1985, Lauenroth et al. 1987, Johnson
and Aguirre 1991). Both crested wheatgrass and Russian wildrye have coarser, deeper
root systems than the Stipa-Bouteloua community (Weaver 1958, Smoliak and Johnston
1980, Dormaar and Sauerbeck 1983, Smoliak and Dormaar 1985). These differences may
create differences in the rate of the uptake of water after drought.

19
References Cited
Akhter, J., K. Mahmood, M.A. Tasneem, M.H. Naqvi, and K.A. Malik. 2003.Comparative water use efficiency of Sporobolus arabicus and Leptochloa fuseaand its relation with carbon-isotope discrimination under semiarid conditions.Plant and Soil 249:263-269.
Asseng, S., N.C. Turner, and B.A. Keating. 2001. Analysis of water- and nitrogen use efficiency of wheat in a Mediterranean climate. Plant and Soil 233:(1):127-143.
Bazzaz, F.A. 1986. Life histories of colonizing plants: some demographic, genetic and physiological features. In: H.A. Mooney and J.A. Drake (EDS.). Ecological and biological invasions of North America and Hawaii. Ecological Studies 58. New York, NY: Springer and Verlag. p. 96-110.
Behnke, R.H., Jr., I. Scoones, and K. Kerven. 1993. Range ecology at disequilibrium: new models of natural variability and pasoral adaptation in African savannas. London, United Kingdom: Overseas Development Institute.
Bittman, S., and G.M. Simpson. 1989. Drought effects on water relations of three culitvated grasses. Crop Science 29:992-999.
Black, C.C. 1971. Ecological implications of dividing plants into groups with distinct photosynthetic production capacities. Advances in Ecological Research 7:87-114.
Blicker, P.S., B.E. Olson, and J.M. Wraith. 2003. Water use and water use efficiency ofthe invasive Centaurea maculosa and three native grasses. Plant and Soil254:371-381.
Brewer, R. 1988. The science of ecology. New York, NY: Saunders College Publishing.
Briske, D.D., and A.M. Wilson. 1977. Temperature effects on adventitious rootdevelopment in blue grama seedlings. Journal of Range Management 30:276-280.
Brown, R.W. 1995. The water relations of range plants: Adaptations to water deficits. In:D. Bedunah and R. Sosabee (EDS.). Wildland plants: physiological ecology anddevelopmental morphology. Denver, CO: Society of Range Management.
Busch, D.E., and S.D. Smith. 1995. Mechanisms associated with the decline of woodyspecies in riparian ecosystems of the southwestern United States. EcologicalMonographs 65:347-370.
20
Caldwell, M., T. Dawson, and J. Richards. 1998. Hydraulic lift: consequences of water efflux from the roots of plants. Oecologia 113:151-161.
Campbell, C.A., and W. Souster. 1982. Loss of organic matter and potentiallymineralizable nitrogen from Saskatchewan soils due to cropping. CanadianJournal of Soil Science 62:651-656.
Campbell, C.A., R.P. Zentner, H.H. Janzen, and K.E. Bowren. 1990. Crop rotationstudies on Canadian prairies. Res. Branch Agric. Can. Public. 1841 E. Ottawa,ON: Supply and Services Canada.
Christian, J.M. 1996. Revegetation of abandoned cropland in southwestern Saskatchewanusing native species, alien species and natural succession. (M.S. thesis). Regina,SK: University of Regina. 52 p.
Claussen, W. 2002. Growth, water-use efficiency and proline content of hydroponicallygrown tomato plants as affected by nitrogen source and nutrient concentrations.Plant and Soil 247(2):199-209.
Clements, F.E. 1916. Plant succession: an analysis of the development of vegetation.Publication 242. Washington, D.C.: Carnegie Institute.
Couleman, B.E. 1987. Yield and composition of monocultures and mixtures ofbromegrass, orchardgrass and timothy. Canadian Journal of Plant Science 67:203-213.
Coupland, R.T., and R.E. Johnson. 1965. Rooting characteristics of native grassland species in Saskatchewan. Journal of Ecology 53:475-507.
Coyne, P.I., and J.A. Bradford. 1985. Morphology and growth in seedlings of several C4perennial grasses. Journal of Range Management 38:504-512.
Davis, M.A., J.K. Wrage, and P.B. Reich. 1998. Competition between tree seedlings andherbaceous vegetation: support for a theory of resource supply and demand.Journal of Ecology 86:652-661.
Dearden, P., and B. Mitchell. 1998. Environmental change and challenge: a Canadianperspective. Oxford, Great Britain: Oxford University Press.
Dormaar, J.F., A. Johnston, and S. Smoliak. 1978. Long term soils changes associatedwith seed stands of crested wheatgrass in southern Alberta, Canada. In:Proceedings of the First International Rangelands Congress. Denver, CO: Societyfor Range Management.

21
Dormaar, J.F., and D.R. Sauerbeck. 1983. Seasonal effects on photoassimilated carbon-14 in the roots system of blue grama and associated organic matter. Soil Biologyand Biochemistry 15:475-479.
Dormaar, J.F., S. Smoliak, and W.D. Willms. 1990. Soil chemical properties duringsuccession from abandoned farmland to native range. Journal of RangeManagement 41:450-459.
Ehleringer, J.R., A.E. Hall, and G.D. Farquhar (EDS.). 1993. Stable isotopes and plant carbon:water relations. San Diego, CA: Academic Press Inc. 555 p.
Ellis, J.E., and D.M. Swift. 1988. Stability of African pastoral ecosystems: alternateparadigms and implications for development. Journal of Range Management41:450-459.
Frank, A.B. 2003. Evapotranspiration from the northern semiarid grasslands. AgronomyJournal 95:1504-1509.
Goldberg, D.E. 1990. Components for resource competition in plant communities. In:J.B. Grace and D. Tilman (EDS.). Perspectives on plant competition. San Diego,CA: Academic Press.
Gordon, C., S.J. Woodin, C.E. Mullins, and I.J. Alexander. 1999. Effects ofenvironmental change, including drought, on water use by competing Callunavulgaris (heather) and Pteridium aquilinum (brachen). Functional Ecology13(S1):96-106.
Griffiths, E., and R.G. Burns. 1972. Interactions between phenolic substances andmicrobial polysaccharides in soil aggregation. Plant Soil 36: 599-612.
Grime, J. 1994. The role of plasticity in exploring environmental heterogeneity. In: M.Caldwell and R. Pearcy (EDS.). Exploitaton of enviromental heterogeneity byplants. San Diego, CA: Academic Press. p. 1-18.
Hector, A, B. Schmid, C. Bierkuhnlein, M. Caldeira, M.Diemer, P. Dimitrakopoulos, J.Finn, H. Freitas, P.Giller, J. Good, R. Harris, P. Högberg, K. Huss-Danell, J.Joshi, A. Jumpponen, C. Körner, P. W. Leadley, M. Loreau, A. Minns, C.P.H.Mulder, G. O'Donovan, J. Otway, J.S. Pereira, A. Prinz, D.J. Read, M.Scherer-Lorenzen, D. Schulze, D. Siamantziouras, E.M. Spehn, A.C. Terry, A.Y.Troumbis, F.I. Woodward, S. Yachi, and J.H. Lawton. 1999. Plant diversity andproductivity experiments in European grasslands. Science 286(5442):1123-1127.
Holechek, J.L., R.D. Pieper, and C.H. Herbel. 1998. Range management: principles andpractices (3rd ed.). Upper Saddle River, NJ: Prentice Hall.
22
Hooper, D., and P. Vitousek. 1997. The effects of plant composition and diversity onecosystem processes. Science 277:1302-1305.
Hooper, D., and P. Vitousek. 1998. Effects of plant composition on nutrient cycling.Ecological Monographs 68:121-149.
Janzen, H.H. 1987. Soil organic matter characteristics after long-term cropping to variousspring wheat rotations. Canadian Journal of Soil Science 67:845:856.
Janzen, H.H., C.A. Campbell, S.A. Brandt, G.P. Lafond, and L. Townley Smith. 1992.Light fraction organic matter in soils from long-term crop rotations. Soil ScienceSociety of America Journal 56:1799-1806.
Jenny, H. 1980. The soil resource. New York, NY: Springer.
Johnson, D.A., and L. Aguirre. 1991. Effect of water on morphological development in three range grasses: root branching patterns. Journal of Range Management44:355-360.
Johnson, D.A., K.H. Asay, L.L. Tiezen, J.R. Ehleringer, and P.G. Jefferson. 1990.Carbon isotope discrimination potential in screening cool season grasses for waterlimited environments. Crop Science 30:338-343.
Johnson, R.C., and L.M. Bassett. 1991. Carbon-isotope discrimination and water use efficiency in four cool season grasses. Crop Science31:157-162.
Jung, G.A., and B.S. Baker. 1984. Orchardgrass. In: M.E. Heath, R.F. Barnes, and D.S.Metcalf (EDS.). Forages: the science of grassland agriculture. Ames, IA: IowaState University Press.
Knops, J., D. Wedin, and D. Tilman. 2001. Biodiversity and decomposition inexperimental grassland ecosystem. Oecologia 126:429-433.
Knowles, R.P. 1987. Productivity of grass species in the dark brown soil zone ofSaskatchewan. Canadian Journal of Plant Science 67:719-725.
Knowles, R.P., and E. Buglass. 1966. Crested wheatgrass. Canada Department of Agriculture Publication 1295.
Kramer, P.J. 1980. Drought stress and the origin of adaptations. In: N.C. Turner and P.J.Kramer (EDS.). Adaptations of plants to water and high temperature stress. NewYork, NY: John Wiley and Sons. p. 7-20.
Kramer, P.J. 1983. Water relations of plants. New York, NY: Academic Press.

23
Kramer, P.J., and J.S. Boyer. 1995. Water relations of plants and soils. New York, NY: Academic Press.
Lauenroth, W.K., O.E. Sala, D.G. Milchunas, and R.W. Lathrop. 1987. Root dynamics ofBouteloua gracilis during short-term recovery from drought. Functional Ecology 1:117-124.
Lawrence, T. 1978. An evaluation of thirty grass populations as forage crops forsouthwestern Saskatchewan. Canadian Journal of Plant Science 58:107-115.
Li, C. 1999. Carbon-isotope composition, water use efficiency and biomass productivityof Eucalyptus microtheca populations under different water supplies. Plant andSoil 214: 165-171.
Looman, J., and D.H. Heinrichs. 1973. Stability of crested wheatgrass pastures underlong-term pasture use. Canadian Journal of Plant Science 53:501-506.
Loreau, M, S. Naaem, P. Inchausti, J. Bengtsson, J.P. Grime, A. Hector, D.U. Hooper,M.A. Huston, D. Raffaelli, D. Smid, D. Tilman, D.A. Wardie. 2001. Biodiversityand ecosystem functioning: current knowledge and future challenges. Science294:804-808.
Matson, P.A., W.J. Parton, A.G. Power, and M.J. Swift. 1997. Agricultural intensificationand ecosystem properties. Science 277:504-509.
Mooney, H.A. 1972. The carbon balance of plants. Annual Review of Ecology and Systematics 3:315-346.
Newell, S.J., and E.J. Tramer. 1978. Reproductive strategies in herbaceous plantcommunities during succession. Ecology 59:228-234.
Noy-Meir, I. 1973. Desert ecosystems: environment and producers. Annual Review of Ecology and Systematics 4:25-52.
Parton, W.J., D.S. Schimel, C.V. Cole, and D.S. Ojima.1987. Analysis of factorscontrolling soil organic matter levels in Great Plains grasslands. Soil ScienceSociety of America Journal 51:1173-1179.
Plummer, A.P. 1943. The germination and early seedling development of twelve range grasses. American Society of Agronomy Journal 35:19-34.
Read, J.J., D.A. Johnson, K.H. Asay, and L.L. Tieszen. 1992. Carbon isotopediscrimination: relationships to yield, gas exchange and water-use efficiency infield grown crested wheatgrass. Crop Science 32:168-175.

24
Redente, F.F., M.E. Biondini, and J.C. Moore. 1989. Observations of biomass dynamicsof a crested wheatgrass and native shortgrass system in southern Wyoming.Journal of Range Management 42(2): 113-117.
Redente, E.F., J.E. Friedlander, and T. McLendon. 1992. Response of early and late successional species to nitrogen and phosphorous gradients. Plant and Soil140:127-135.
Schlesinger, W.H. 1996. Biogeochemistry: an analysis of global change (2nd ed.). SanDiego, CA: Academic Press.
Sharp, R.F., and W.J. Davies. 1979. Solute regulation and growth of roots and shoots ofwater stressed maize plants. Planta 147:43-49.
Sheley, R.I., and L.L. Larson 1995. Interference between cheatgrass and yellow starthistle at three soil depths. Journal of Range Management 47:470-474.
Sims, P.L., and J.S. Singh. 1978a. The structure and functioning of ten western NorthAmerican grasslands. II. Intraseasonal dynamics in primary producercompartments. Journal of Ecology 66:547-572.
Sims, P.L., and J.S. Singh. 1978b. The structure and functioning of ten western NorthAmerican grasslands. III. Net primary production, turnover and efficiencies ofenergy capture and water use. Journal of Ecology 66:573-597.
Skjemstad, J.O., I. Vallis, and R.J.K. Meyers. 1998. Decomposition of soil organicnitrogen. In: E.F. Henzell (ED.). Advances in nitrogen cycling in agriculturalecosystems. Wallingford, Great Britain: CAB International.
Smoliak, S., and J.F. Dormaar. 1985. Production of Russian wildrye and crestedwheatgrass and their effect on prairie soils. Journal of Range Management38(5):403-405.
Smoliak, S., A. Johnston, and L.E. Lutwick. 1967. Productivity and durability of crestedwheatgrass in southeastern Alberta. Canadian Journal of Plant Science 47:539-547.
Smoliak, S., A. Johnston, and D.B. Wilson. 1970. Seedling growth of crested wheatgrassand Russian wildrye. Canadian Journal of Plant Science 50:559-563.
Smoliak, S., and A. Johnston. 1980. Russian wildrye lengthens the grazing season. Rangelands 2(6):249-250.
Stanhill, G. 1986. Water use efficiency. Advances in Agronomy 39:53-85.

25
Statistics Canada. 1999. Table of seeded acres of cereal and forage crops in Canada in1999. http://cansim2.statca.ca/
Stevenson. F.J. 1986. Cycles of soils: C,N,P,S micronutrients. New York, NY: WileyInterscience.
Swift, M.J., A.N. Izac, and M. van Noordwijk. 2004. Biodiversity and ecosystem servicesin agricultural landscapes - are we asking the right questions? Agriculture,Ecosystems and Environment 104(1):113-134.
Swindale, L.D., and F.R. Bidinger 1981. Introduction: the human consequences ofdrought an crop research priorities and their alleviation. In: L.G. Paleg and D.Aspinall (EDS.). The physiology and biochemistry of drought resistance in plants.Sydney. Australia: Academic Press. p. 1-13.
Tannas, K. 1991. Commons plants of the western Canadian rangelands. Curriculum andInstructional Development Services, Lethbridge, AB: Lethbridge CommunityCollege.
Tilman, D. 1987a. The importance of the mechanisms of interspecific competition. TheAmerican Naturalist 129:769-774.
Tilman, D. 1988. Plant strategies and the dynamics of structure of plant communities.Princeton, NJ: Princeton University Press.
Tilman, D, J. Knops, D.Wedin, P. Reich, M. Ritchie, and E. Siemens. 1997. Theinfluence of functional diversity and composition of ecosystem processes. Science277:1300-1302.
Tsialtas, J.T., L.L. Handley, M.T. Kassioumi, D.D. Veresogiou, and A.A. Gagne. 2001.Interspecific variations in water-use efficiency and its relation to plant speciesabundance in water-limited grasslands. Functional Ecology 15(5):605-615.
Vila, M., and J. Sardans. 1999. Plant competition in Mediterranean-type vegetation.Journal of Vegetation Science 10:281-289.
Vinton, M.A., and I.G. Burke. 1995. Interactions between individual plant species andsoil nutrient status in shortgrass steppe. Ecology 76(4):1116-1133.
Weaver J. E. 1958. Summary and interpretation of underground development in natural grassland communities. Ecological Monographs 28(1):55-78.

26
Wedin, D.A. 1999. Nitrogen availability: plant soil feedbacks and grassland stability. In:D. Eldridge and D. Freudenberger (EDS). 6th International Grassland CongressProc. Volume 1. p. 193-197.
Wedin, D.A., and D. Tilman. 1990. Species effects on nitrogen cycling; a test withperennial grasses. Oecologia 84:433-441.
Wickman, D.M. 1998. The 90th Annual report of investigations and administration at theCentral Agricultural Research Center, Montana Agricultural Experiment Station,Moccassin, MT.
Wraith, J.M., and C.K. Wright. 1998. Soil water and root growth. Horticulture Science33(6):951-959.
Xue, Q., Z. Zhu, J.T. Musick, B.A. Stewart, and D.A. Dusek. 2003. Root growth andwater uptake in winter wheat under deficit irrigation. Plant and Soil 257(1):151-161.

27
CHAPTER 3
NITROGEN PARTITIONING IN NATIVE AND AGRONOMIC COMMUNITIESIN THE NORTHERN GREAT PLAINS
Introduction
Plant species in a native grassland differ in their ability to utilize nutrients, and
these differences impact species composition and nutrient cycling within communities
and ecosystems (Wedin and Tilman 1990, Burke et al. 1997, Wedin 1999). Plasticity in
resource allocation within these species created by differences in growth habit,
production, root: shoot ratios, and nitrogen partitioning allows these species to survive
changes in physical environment and interspecific interactions (Mueller 1941, Weaver
1958, Odum 1968, Hartnett and Keeler 1995, Whitehead 1995).
In the last 100 years, the demand for cereal, oil and feed grains, and forage has
resulted in a large portion of Canadian grasslands being replaced with simplified
agronomic communities modified to maximize the amount of usable product with a large
proportion removed through harvest, grazing or a combination of both. These changes
modify nitrogen cycling within the plant-soil complex and impact sustainability of these
agronomic systems (Spedding 1971, Love 1972, Pate and Farquhar 1988, Dormaar et al.
1995). However, the rate of change in the quantity and quality of the N partitions
immediately after plow-down is not well understood. Therefore, a three-year study was
undertaken to examine changes in N partitioning within common agronomic communities

28
that had been created out of nature rangeland. The purpose was to test the hypothesis that
cultivation and replacement of native grasslands with agronomic monocultures results in
greater N allocation into shoot mass and lower allocation into root mass than in native
grassland communities.
Materials and Methods
Site Description
The study was conducted at three sites in southern Alberta (Onefour, Lethbridge,
and Stavely) distinguished by differences in native community, climate, and soil. The
Onefour site was located in southeast Alberta near Manyberries (49o 07' N, 110o 29' W).
The Orthic Brown Chernozemic soil (Aridic Haploboroll) underlies a Stipa-Bouteloua
community with an average annual precipitation of 332 mm. The Stipa-Agropyron-
Bouteloua site near Lethbridge in south-central Alberta (49o 43' N, 110o 57' W) possesses
an Orthic Dark Brown Chernozemic (Typic Haploboroll) and an average annual
precipitation of 402 mm (Smoliak et al. 1967, Ellert and Janzen 1999). The Fescue
Prairie grassland (Festuca-Danthonia) site was located in the Porcupine Hills west of
Stavely, Alberta (50o 12' N, 113o 57' W). The soil is an Orthic Black Chernozemic (Udic
Haploboroll) with an average annual precipitation of 493 mm (Dormaar and Willms
1993). The vegetation at these three sites has been described in detail by Moss (1944) and
Coupland (1961).
29
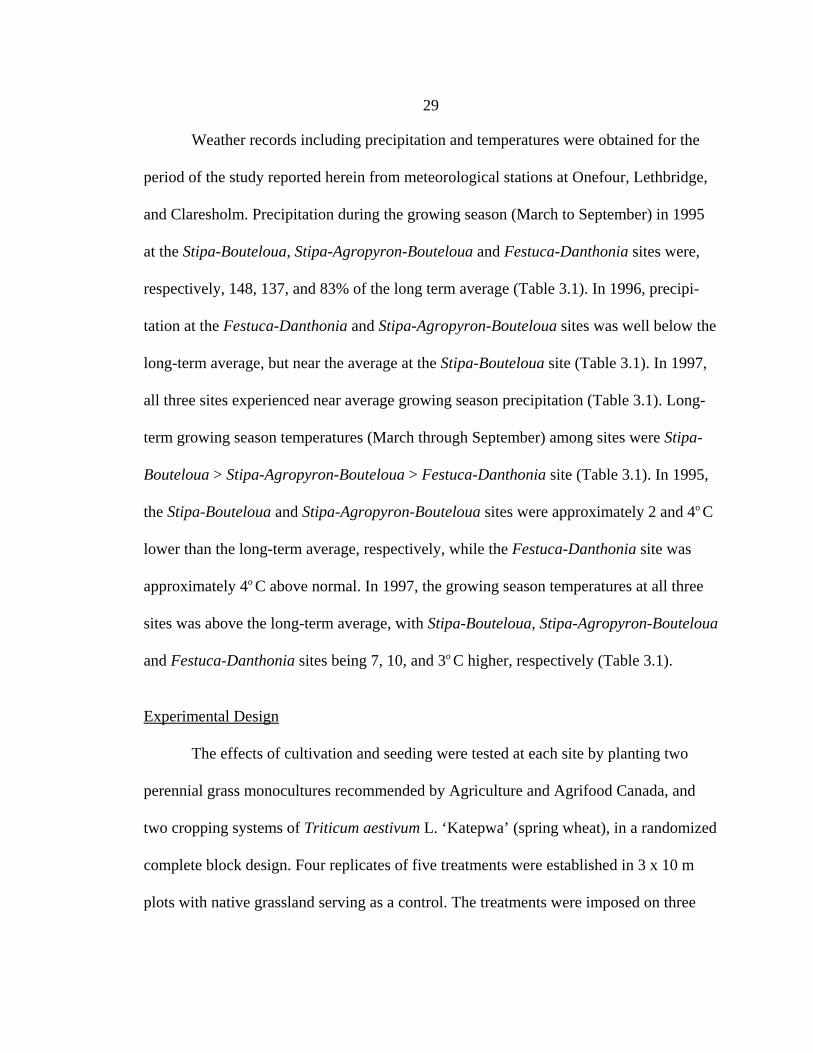
Weather records including precipitation and temperatures were obtained for the
period of the study reported herein from meteorological stations at Onefour, Lethbridge,
and Claresholm. Precipitation during the growing season (March to September) in 1995
at the Stipa-Bouteloua, Stipa-Agropyron-Bouteloua and Festuca-Danthonia sites were,
respectively, 148, 137, and 83% of the long term average (Table 3.1). In 1996, precipi-
tation at the Festuca-Danthonia and Stipa-Agropyron-Bouteloua sites was well below the
long-term average, but near the average at the Stipa-Bouteloua site (Table 3.1). In 1997,
all three sites experienced near average growing season precipitation (Table 3.1). Long-
term growing season temperatures (March through September) among sites were Stipa-
Bouteloua > Stipa-Agropyron-Bouteloua > Festuca-Danthonia site (Table 3.1). In 1995,
the Stipa-Bouteloua and Stipa-Agropyron-Bouteloua sites were approximately 2 and 4o C
lower than the long-term average, respectively, while the Festuca-Danthonia site was
approximately 4o C above normal. In 1997, the growing season temperatures at all three
sites was above the long-term average, with Stipa-Bouteloua, Stipa-Agropyron-Bouteloua
and Festuca-Danthonia sites being 7, 10, and 3o C higher, respectively (Table 3.1).
Experimental Design
The effects of cultivation and seeding were tested at each site by planting two
perennial grass monocultures recommended by Agriculture and Agrifood Canada, and
two cropping systems of Triticum aestivum L. ‘Katepwa’ (spring wheat), in a randomized
complete block design. Four replicates of five treatments were established in 3 x 10 m
plots with native grassland serving as a control. The treatments were imposed on three

30
Table 3.1. Monthly growing season precipitation (mm) and temperatures (ºC) from 1995 to 1997 at three southern Alberta sites.
Precipitation (mm)
Year March April May June July Aug. Sept. Total %1
Stipa-Bouteloua
1995 17 37 41 130 56 50 48 379 148
1996 32 13 64 80 33 4 51 277 109
1997 28 15 84 65 11 23 20 246 96
Ave. 2 22 28 41 64 34 39 27 255 100
Stipa-Agropyron-Bouteloua
1995 10 38 106 138 66 44 19 421 137
1996 21 22 54 18 5 70 6 196 64
1997 14 96 101 32 33 8 10 294 95
Ave. 2 24 31 55 74 42 42 40 308 100
Festuca-Danthonia 3
1995 6 23 72 84 69 39 63 356 83
1996 45 24 72 49 7 4 54 255 60
1997 15 21 138 73 28 77 35 387 91
Ave. 2 24 14 99 113 74 69 34 427 100
Mean Monthly Temperatures (ºC)
Year March April May June July Aug. Sept. Total %1
Stipa-Bouteloua
1995 -1.2 3.6 10.8 15.8 18.0 17.6 13.0 11.1 97.9
1997 -1.5 3.6 11.4 16.6 19.3 19.6 15.7 12.1 106.8
Ave. 2 -2.9 5.2 11.4 15.6 19.6 18.8 12.2 11.3 100.0
Stipa-Agropyron-Bouteloua
1995 -0.3 4.3 10.1 14.6 17.3 15.8 12.5 10.6 96.3
1997 0.7 3.9 11.3 16.0 18.2 18.6 15.9 12.1 109.7
Ave. 2 -1.5 5.6 10.8 14.9 18.0 17.1 12.2 11.0 100.0
Festuca-Danthonia3
1995 -1.4 3.7 9.2 14.1 16.1 15.0 11.9 9.8 104.4
1997 -2.0 2.0 8.8 12.9 15.5 16.3 14.3 9.7 103.2
Ave. 2 -2.1 5.0 8.7 12.8 15.7 15.2 10.4 9.4 100.0 1 % - Sum of precipitation or temperatures from March to September divided by the long-term averages during the same period 2 Averages over a 50-year period - Agriculture and Agrifood Canada 3 Measured at Claresholm which was approximately 30 m southeast of the study site

31
previously uncultivated native grassland sites that had been lightly grazed. The Stipa-
Agropyron-Bouteloua and Festuca-Danthonia sites were established in 1993, while the
Stipa-Bouteloua site was established in 1994. At the time of establishment, all sites were
protected from livestock grazing by fences. The perennial grasses seeded on Mixed
Prairie sites (Stipa-Bouteloua and Stipa-Agropyron-Bouteloua) were Agropyron
cristatum (L.) Gaertn. (crested wheatgrass) and Psathyrostachy juncea (Fisch.) Nevski
(Russian wildrye). On the Fescue prairie site (Festuca-Danthonia), the perennial grasses
seeded were Bromus inermis Leyss. (smooth bromegrass) and Dactylis glomerata L.
(orchardgrass ). At each site, two cropping systems were used with wheat; one treatment
was continuously cropped and the other was left fallowed alternate years. All seeding of
introduced grasses was done in the spring with 15-cm row spacing.
Methods
In 1995 and 1997, standing crop at each site was estimated by harvesting plant
biomass to a 2 cm stubble height in two randomly located 0.25-m2 subplots (0.5 x 0.5 m)
in each treatment and block. Net annual aerial production (shoot) was estimated by
removing standing litter from green standing crop. The plant material was oven-dried
(60o C) and weighed. Root biomass was sampled using three randomly placed cores (2
cm x 91 cm deep) in each treatment, and block using a hydraulic truck-mounted unit. The
samples were frozen until washed on a 2-mm screen over a 0.5-mm screen to remove
soil. The washed root samples were then oven-dried (60o C) and weighed.

32
Shoot and root mass samples were composited by treatment, ground with a
laboratory mill equipped with a 2-mm screen followed by a mill equipped with a 1-mm
screen. Approximately 8 mg subsamples were taken from each composite and analysed
for C and N using an automated dry combustion technique (Carlo Erba TM, Milan, Italy).
The ash content of the root samples was not determined; however, care was taken in the
washing of the roots to reduce differences due to the presence of soil.
Statistical Analyses
The dependent variables were analysed as a split-plot design with site, treatment,
and their interaction as the main plot effects, and time and its interactions with the other
factors as the split-plot effects (Steel and Torrie 1980). For these analyses, the two grass
and two wheat treatments were individually pooled and analysed in a whole model as an
unbalanced 3 (site) x 2 (years) x 3 (treatments) split-plot design, where the treatments
were native grass, agronomic grass, and wheat. This grouping was necessary to avoid the
nesting of treatments within sites. These analyses were performed to determine the
generalized effect of cultivating and seeding to perennial or annual grasses on production
and soil properties over a wide range of conditions. Separate split-plot analyses were also
performed for each site, with treatment as the main plot, and time and the time-by-
treatment interaction as the split-plot effects. Differences of means that were of interest
were evaluated for significance using single degree of freedom contrasts which are
reported in the appendices (Steel and Torrie 1980). All analyses of variance were
performed using the MIXED procedure from SAS (SAS Institute, Inc. 1999). Significant
33
differences between treatment means were determined as P< 0.05.
Results
Year, site, and treatment (with two grass and two wheat treatments pooled)
affected the magnitude of most variables (Table 3.2). Mass variables (biomass and N)
tended to follow the order: Stipa-Bouteloua < Stipa-Agropyron-Bouteloua < Festuca-
Danthonia, while the ratio of root to shoot mass and N concentrations in shoots tended to
follow the opposite order: Stipa-Bouteloua >Stipa-Agropyron-Bouteloua > Festuca-
Danthonia (Table 3.2). The effect of site on treatment for any variable tended to be
primarily on its relative magnitude rather than ranking within the site.
The effect of treatment on each variable was influenced by both site and year and,
in some cases, by their interaction (Table 3.2). Due to the complexity of interpretation,
the data was re-analysed by site to assess the effects of treatment (with two individual
grass and two individual wheat treatments) and year.
Site and Year Effect
Site affected the magnitude of all variables except N concentration in shoot mass
and influenced the effect of native pooled perennial grass and pooled wheat treatments on
all variables (Table 3.2). Nevertheless for any variable the effect of site on treatment
effects tended to be on magnitude rather than ranking treatments within each site. Year-
by-treatment interaction was significant for many variables at each site and there was
little consistency regarding significance among sites. Due to large numbers of significant

34
Table 3.2. Total ANOVA model for total biomass, shoot mass, root mass, root: shoot (R:S), concentration N in shoot mass, concentration N in root mass, shoot mass N, root mass N. total N in biomass and R:S N of native and agronomiccommunities at three southern Alberta sites in 1995 and 1997.
Biomass
(g m-2)
Shoot Mass
(g m-2)
Root Mass
(g m-2)
Root: Shoot Concentration Shoot N(mg g-1)
Concentration Root N(mg g-1)
Shoot N
(g m-2)
Root N
(g m-2)
Total N
(g m-2)
Source ----------------------------------------------------------------------------------------------------------Probabilities-------------------------------------------------------------------------------------------------Year (Y) 0.196 <0.001 <0.001 <0.001 <0.001 <0.001 <0.001 <0.001 0.008Site (S) <0.001 <0.001 <0.001 0.015 0.070 0.031 <0.001 <0.001 <0.001Treatment (T) <0.001 <0.001 <0.001 <0.001 <0.001 <0.001 <0.001 <0.001 <0.001S x Y 0.552 0.003 0.179 0.114 <0.001 <0.001 0.030 0.077 0.085T x Y <0.001 <0.001 0.004 0.010 <0.001 0.006 <0.001 0.018 <0.001T x S <0.001 0.010 0.001 0.003 <0.001 <0.001 <0.001 <0.001 <0.001S x Y x T 0.384 0.005 0.674 0.228 <0.001 0.224 0.003 0.667 0.629Site -------------------------------------------------------------------------------------------------------------Means-----------------------------------------------------------------------------------------------------------Stipa-BoutelouaNative 1015.3 66.9 948.4 15.4 1.1 1.4 0.7 14.1 14.8Perennial Grass1 943.2 183.1 760.1 6.2 1.1 1.4 1.8 11.0 12.8Wheat2 987.8 503.9 483.9 1.2 0.7 1.6 3.8 8.1 12.0Stipa-Bouteloua-AgropyronNative 1135.7 181.2 1033.5 8.3 1.3 1.3 2.1 14.2 16.3Perennial Grass1 1152.9 203.3 1022.2 6.6 0.9 1.2 1.6 12.1 13.7Wheat2 809.7 524.2 306.4 1.1 0.8 1.6 3.8 5.1 8.9Festuca-DanthoniaNative 2153.2 265.0 1888.0 7.3 1.2 1.5 3.0 30.9 34.0Perennial Grass3 1731.1 389.9 1341.2 6.6 1.0 1.3 3.5 17.3 20.8Wheat2 1030.2 556.3 473.8 1.5 0.7 1.4 3.8 6.5 10.4
1 Crested wheatgrass and Russian wildrye.2 Fallow and continuously cropped wheat.3 Smooth bromegrass and orchardgrass.

35
year-by-treatment interactions and their inconsistencies, the means and differences
between means for each year, treatment, and site were determined and are reported in
appendices.
Biomass and Root: Shoot
There were few differences in total biomass between native grasslands and
perennial monocultures except for orchardgrass in 1997 (Figure 3.1). However total
biomass in native grasslands and perennial grasses was greater than wheat at each site
and year except at the Stipa-Bouteloua site in 1995 (Figure 3.1).
Root mass of native grasslands was greater than for wheat at all sites (Figure 3.2).
There were few differences in root mass between native grasslands and perennial species
except at the Stipa-Bouteloua and Festuca-Danthonia sites in 1997, where native
grasslands had a larger root mass than crested wheatgrass, Russian wildrye, and
orchardgrass (Figure 3.2).
In 1995 and 1997, native grasslands yielded less shoot mass than either wheat or
crested wheatgrass at the Stipa-Bouteloua site; however, the magnitude of the difference
was greater in 1995. A similar pattern was evident at the Stipa-Agropyron-Bouteloua
site; however, there was no difference in shoot mass of native grasslands and crested
wheatgrass in 1995 (Figure 3.3). In 1997, the native grassland shoot masses were similar
to those of perennial grasses on all sites (Figure 3.3), while wheat shoot mass was greater
than that of the native grasslands in both Stipa-Bouteloua and Stipa-Agropyron-
Bouteloua sites.

36
Figure 3.1. Total biomass nitrogen of agronomic and native communities at Stipa-Bouteloua, Stipa-Agropyron-Bouteloua, andFestuca-Danthonia sites in southern Alberta in 1995 and 1997. Error bars are standard error of the treatment means (n = 8). Symbols: B - brome grass, O - orchardgrass, CWG - crested wheatgrass, NAT - native grassland, RWR -Russian wildrye, WC - wheat continuous crop, WF - wheat fallow.
Treatment
NAT B O WC WF
Treatment
NAT CWG RWR WC WF
Treatment
NAT CWG RWR WC WF
Tota
l Bio
mas
s N
(g m
-2)
0
10
20
30
40
50
Tota
l Bio
mas
s N
(g m
-2)
0
10
20
30
40
501995 1995 1995
1997 1997 1997
Stipa-Bouteloua Stipa-Agropyron-Bouteloua Festuca-Danthonia

Treatment
NAT B O WC WF
Treatment
NAT CWG RWR WC WF
Treatment
NAT CWG RWR WC WF
Roo
t Mas
s (g
m-2)
0
1000
2000
3000
Roo
t Mas
s (g
m-2)
0
1000
2000
3000
1997
Stipa-Bouteloua Stipa-Agropyron-Bouteloua Festuca-Danthonia
1995 1995 1995
1997 1997
37
Figure 3.2. Root mass of agronomic and native communities at Stipa-Bouteloua, Stipa-Agropyron-Bouteloua, and Festuca-Danthoniasites in southern Alberta in 1995 and 1997. Error bars are standard error of the treatment means (n = 8). Symbols: B -brome grass, O - orchardgrass, CWG - crested wheatgrass, NAT - native grassland, RWR - Russian wildrye, WC - wheatcontinuous crop, WF - wheat fallow.

Treatment
NAT B O WC WF
Treatment
NAT CWG RWR WC WF
Treatment
NAT CWG RWR WC WF
Sho
ot M
ass
(g m
-2)
0
200
400
600
800
1000
1200
1400
Sho
ot M
ass
(g m
-2)
0
200
400
600
800
1000
1200
1400
1997
1995
Stipa-Bouteloua Stipa-Agropyron-Bouteloua Festuca-Danthonia
1995 1995
1997 1997
38
Figure 3.3. Shoot mass of agronomic and native communities at Stipa-Bouteloua, Stipa-Agropyron-Bouteloua and Festuca-Danthonia sites in southern Alberta in 1995 and 1997.Error bars are standard error of the treatment population (n = 8). Symbols: B - brome grass, O - orchardgrass, CWG - crested wheatgrass, NAT - native grassland, RWR - Russian wildrye,WC - wheat continuous crop WF - wheat fallow.
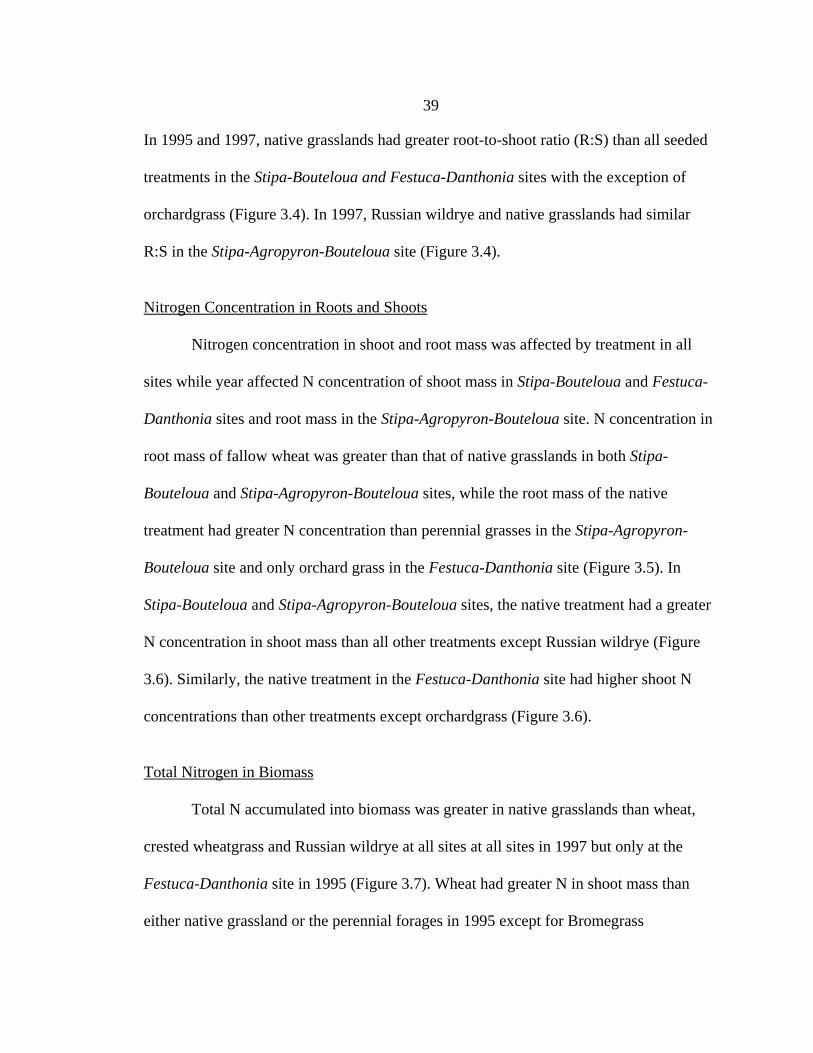
39
In 1995 and 1997, native grasslands had greater root-to-shoot ratio (R:S) than all seeded
treatments in the Stipa-Bouteloua and Festuca-Danthonia sites with the exception of
orchardgrass (Figure 3.4). In 1997, Russian wildrye and native grasslands had similar
R:S in the Stipa-Agropyron-Bouteloua site (Figure 3.4).
Nitrogen Concentration in Roots and Shoots
Nitrogen concentration in shoot and root mass was affected by treatment in all
sites while year affected N concentration of shoot mass in Stipa-Bouteloua and Festuca-
Danthonia sites and root mass in the Stipa-Agropyron-Bouteloua site. N concentration in
root mass of fallow wheat was greater than that of native grasslands in both Stipa-
Bouteloua and Stipa-Agropyron-Bouteloua sites, while the root mass of the native
treatment had greater N concentration than perennial grasses in the Stipa-Agropyron-
Bouteloua site and only orchard grass in the Festuca-Danthonia site (Figure 3.5). In
Stipa-Bouteloua and Stipa-Agropyron-Bouteloua sites, the native treatment had a greater
N concentration in shoot mass than all other treatments except Russian wildrye (Figure
3.6). Similarly, the native treatment in the Festuca-Danthonia site had higher shoot N
concentrations than other treatments except orchardgrass (Figure 3.6).
Total Nitrogen in Biomass
Total N accumulated into biomass was greater in native grasslands than wheat,
crested wheatgrass and Russian wildrye at all sites at all sites in 1997 but only at the
Festuca-Danthonia site in 1995 (Figure 3.7). Wheat had greater N in shoot mass than
either native grassland or the perennial forages in 1995 except for Bromegrass

Treatment
NAT B O WC WF
Treatment
NAT CWG RWR WC WF
TreatmentNAT CWG RWR WC WF
Roo
t:Sho
ot R
atio
0
5
10
15
20
Roo
t:Sho
ot R
atio
0
5
10
15
20
Stipa-Bouteloua
1995
1997 1997
1995
Stipa-Agropyron-Bouteloua
1995
1997
Festuca-Danthonia
40
Figure 3.4. Root-to-shoot ratio (R:S) of agronomic and native communities at Stipa-Bouteloua, Stipa-Agropyron-Bouteloua, andFestuca-Danthonia sites in southern Alberta in 1995 and 1997.Error bars are standard error of the treatment population (n = 8). Symbols: B - brome grass, O - orchardgrass, CWG - crested wheatgrass, NAT - native grassland, RWR - Russianwildrye, WC - wheat continuous crop WF - wheat fallow.

41
Figure 3.5. Nitrogen concentration in root mass of agronomic and native communities at Stipa-Bouteloua, Stipa-Agropyron-Bouteloua and Festuca-Danthonia sites in southern Alberta in 1995 and 1997.Error bars are standard error of thetreatment population (n = 8). Symbols: B - brome grass, O - orchardgrass, CWG - crested wheatgrass, NAT - nativegrassland, RWR - Russian wildrye, WC - wheat continuous crop, WF - wheat fallow.
Treatment
NAT B O WC WF
N C
once
ntra
tion
(mg
kg -1
)
0
1
2
Treatment
NAT CWG RWR WC WF
N C
once
ntra
tion
(mg
kg -1
)
0
1
2
Treatment
NAT CWG RWR WC WF
Stipa-Bouteloua Stipa-Agropyron-Bouteloua
1997
1995
1997
1995
Festuca-Danthonia
1995
1997
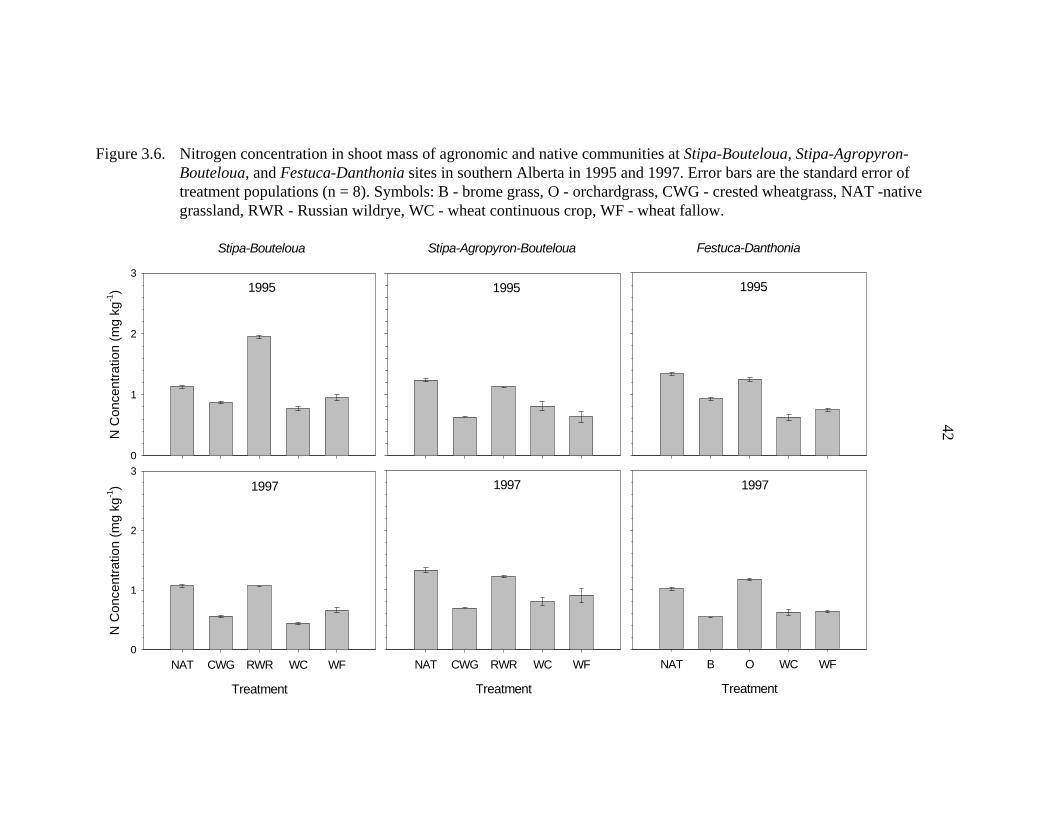
42
Figure 3.6. Nitrogen concentration in shoot mass of agronomic and native communities at Stipa-Bouteloua, Stipa-Agropyron-Bouteloua, and Festuca-Danthonia sites in southern Alberta in 1995 and 1997. Error bars are the standard error oftreatment populations (n = 8). Symbols: B - brome grass, O - orchardgrass, CWG - crested wheatgrass, NAT -nativegrassland, RWR - Russian wildrye, WC - wheat continuous crop, WF - wheat fallow.
Stipa-Bouteloua Stipa-Agropyron-Bouteloua Festuca-Danthonia
1995
N C
once
ntra
tion
(mg
kg-1
)
0
1
2
3
Treatment
NAT CWG RWR WC WF
N C
once
ntra
tion
(mg
kg-1
)
0
1
2
3
Treatment
NAT CWG RWR WC WF
Treatment
NAT B O WC WF
1995 1995
1997 1997 1997

43
Figure 3.7. Total biomass nitrogen of agronomic and native communities at Stipa-Bouteloua, Stipa-Agropyron-Bouteloua, and Festuca-Danthonia sites in southern Alberta in 1995 and 1997. Error bars are standard error of the treatment population (n = 8). Symbols: B - brome grass, O - orchardgrass, CWG - crested wheatgrass, NAT - native grassland, RWR - Russianwildrye, WC - wheat continuous crop, WF - wheat fallow.
Treatment
NAT B O WC WF
Treatment
NAT CWG RWR WC WF
Treatment
NAT CWG RWR WC WF
Tota
l Bio
mas
s N
(g m
-2)
0
10
20
30
40
50
Tota
l Bio
mas
s N
(g m
-2)
0
10
20
30
40
501995 1995 1995
1997 1997 1997
Stipa-Bouteloua Stipa-Agropyron-Bouteloua Festuca-Danthonia

44
(Figure 3.8). In 1997, the same trend was evident in fallow wheat; however, the
magnitude of the difference was smaller. N in the shoot mass of continuous wheat in
1997 was either similar or lower than the other treatments (Figure 3.8). Total N in the
biomass of roots was greater in native grasslands than wheat at all sites and years while
perennial grasses only had lower total root N at the Festuca-Danthonia site in 1997
(Figure 3.9).
Discussion
Cultivating semi-arid and sub-humid native grassland communities and
establishing agronomic cereal and forage monocultures resulted in decreases in R:S and
shifted N distribution from root to shoot mass. The magnitude of the shifts were species-
specific and subject to changes in growing season precipitation and temperature. The
establishment of the agronomic monocultures not only changed plant species
composition but introduced differences in biomass allocation and net primary
productivity. These have significant impacts on ecosystem processes such as soil organic
matter and nutrient dynamics (Tilman and Knops 1997, Hooper and Vitousek 1998,
Craine et al. 2002).
Native communities are useful as benchmarks for measuring changes induced by
anthropogenic disturbances. In these grasslands where moisture availability is variable
and limiting, species diversity, functional differences in N sequestration and partitioning
between species, and niche complementarity may promote long-term stability of the
community type (Tilman et al. 1996, Hooper and Vitousek 1998).

45
Figure 3.8. Total nitrogen in shoot mass of agronomic and native communities at Stipa-Bouteloua, Stipa-Agropyron-Bouteloua, and Festuca-Danthonia sites in southern Alberta in 1995 and 1997. Error bars are standard error of the treatment population (n = 8). Symbols: B - brome grass, O- orchardgrass, CWG - crested wheatgrass, NAT - native grassland, RWR - Russianwildrye, WC - wheat continuous crop, WF - wheat fallow.
T rea tm ent
N A T C W G R W R W C W F
T rea tm ent
N A T C W G R W R W C W F
Tota
l Nitr
ogen
(g m
-2)
0
10
20
30
40
50
Tota
l Nitr
ogen
(g m
-2)
0
10
20
30
40
50
S tipa -B ou te loua S tipa-A gropyron-B oute loua
1995 1995
1997 1997
Festuca-D an thon ia
1995
1997
T rea tm ent
N A T B O W C W FY
Dat
a
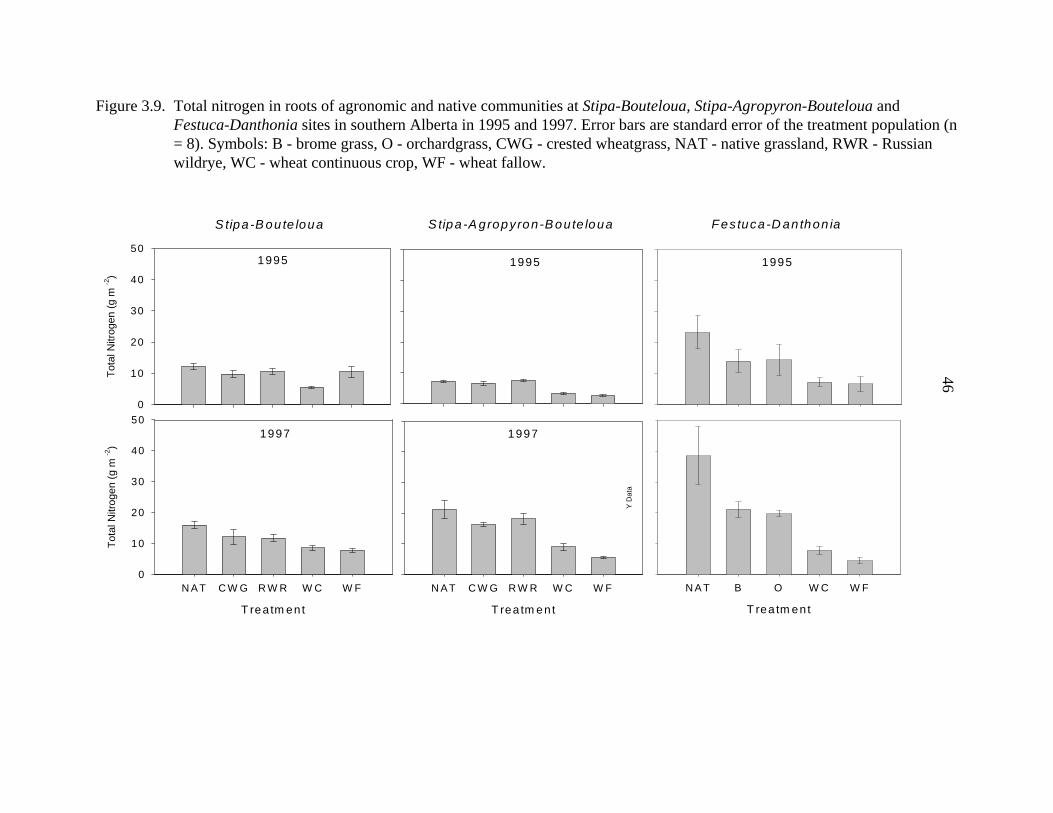
46Figure 3.9. Total nitrogen in roots of agronomic and native communities at Stipa-Bouteloua, Stipa-Agropyron-Bouteloua and
Festuca-Danthonia sites in southern Alberta in 1995 and 1997. Error bars are standard error of the treatment population (n= 8). Symbols: B - brome grass, O - orchardgrass, CWG - crested wheatgrass, NAT - native grassland, RWR - Russianwildrye, WC - wheat continuous crop, WF - wheat fallow.
T rea tm ent
N A T C W G R W R W C W F
T rea tm ent
N A T C W G R W R W C W F
Tota
l Nitr
ogen
(g m
-2)
0
10
20
30
40
50
Tota
l Nitr
ogen
(g m
-2)
0
10
20
30
40
50
S tipa -B ou te loua S tipa-A gropyron-B oute loua
1995 1995
1997 1997
Festuca-D an thon ia
1995
1997
T rea tm ent
N A T B O W C W F
Y D
ata

47
Native Grassland Communities
Total biomass N in native communities increased in periods of lower growing
season precipitation primarily by increasing root mass which enhances the uptake and
storage of nitrogen (Woodmansee et al. 1978). This leads to N conservation and a
reduction in leaching and volatilization losses from the system (Gleeson and Tilman
1990, Vinton and Burke 1995, Tilman et al. 2002). In Mixed Prairie communities (Stipa-
Bouteloua and Stipa-Agropyron- Bouteloua), increased root mass N with decreased
current growing season precipitation was a result of differences in growth form
(rhizomatous vs. bunchgrass) and rooting depth between the predominant species. During
periods of lower annual growing season precipitation, small bunchgrasses such as
Bouteloua gracilis (Wild. ex Kunth) lag ex Griffiths (blue grama) and Koelaria
macrantha (Ledeb.) J.A. Schultes f. (Junegrass), which have large root: shoot ratios,
allocate the majority of their resources to shallow root systems to more efficiently access
soil moisture near the soil surface, whereas Heterostipa comata (Trin. Rupr.) Barkworth
(needle and thread grass), with deeper roots, accesses deeper sources of soil water and N
(Weaver 1958, Vinton and Burke 1995).
With increased long-term growing season precipitation, Agropyron species
become more prominent in the species mix of native communities. During periods of
above-average current growing season precipitation, the rhizomatous wheatgrasses
(Pascopyrum smithii (Rupr. A. Löve) (western wheatgrass), Elymus albicans (Scrib. and
J.G. Sm.) A. Love (northern wheatgrass), with lower R:S ratios allocate much more N to
shoot mass (Vinton and Burke 1995, Christian 1996) as was evident in reductions in both
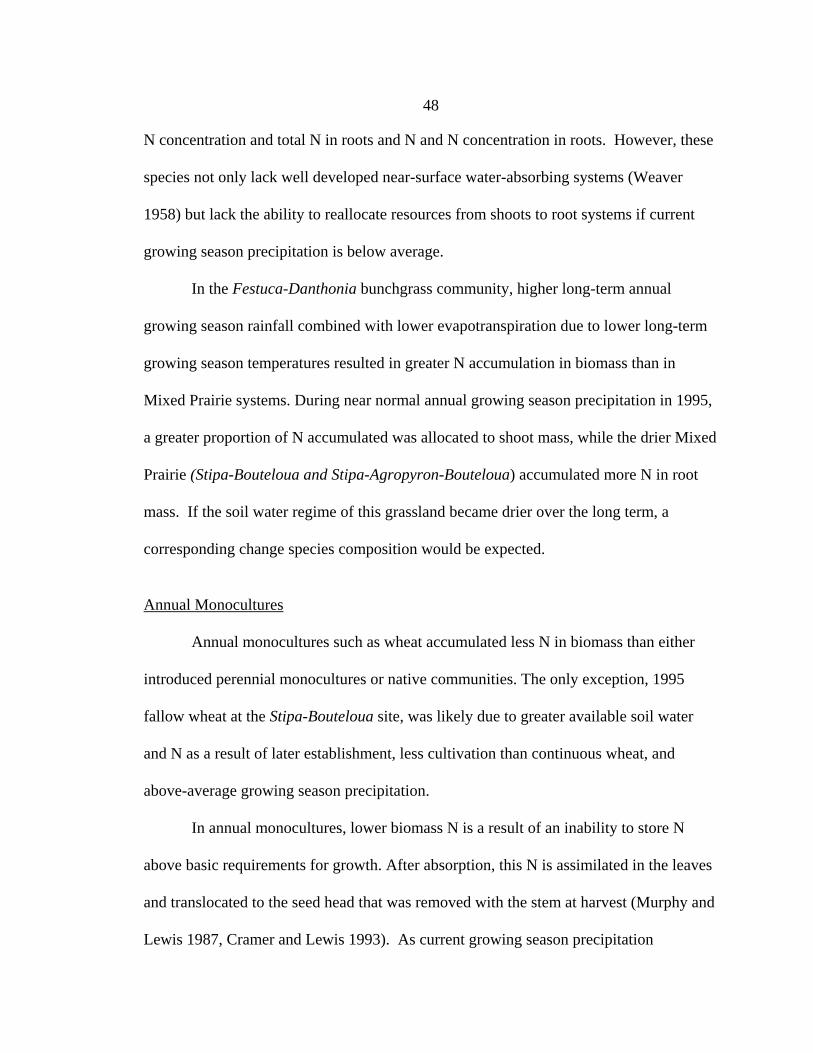
48
N concentration and total N in roots and N and N concentration in roots. However, these
species not only lack well developed near-surface water-absorbing systems (Weaver
1958) but lack the ability to reallocate resources from shoots to root systems if current
growing season precipitation is below average.
In the Festuca-Danthonia bunchgrass community, higher long-term annual
growing season rainfall combined with lower evapotranspiration due to lower long-term
growing season temperatures resulted in greater N accumulation in biomass than in
Mixed Prairie systems. During near normal annual growing season precipitation in 1995,
a greater proportion of N accumulated was allocated to shoot mass, while the drier Mixed
Prairie (Stipa-Bouteloua and Stipa-Agropyron-Bouteloua) accumulated more N in root
mass. If the soil water regime of this grassland became drier over the long term, a
corresponding change species composition would be expected.
Annual Monocultures
Annual monocultures such as wheat accumulated less N in biomass than either
introduced perennial monocultures or native communities. The only exception, 1995
fallow wheat at the Stipa-Bouteloua site, was likely due to greater available soil water
and N as a result of later establishment, less cultivation than continuous wheat, and
above-average growing season precipitation.
In annual monocultures, lower biomass N is a result of an inability to store N
above basic requirements for growth. After absorption, this N is assimilated in the leaves
and translocated to the seed head that was removed with the stem at harvest (Murphy and
Lewis 1987, Cramer and Lewis 1993). As current growing season precipitation
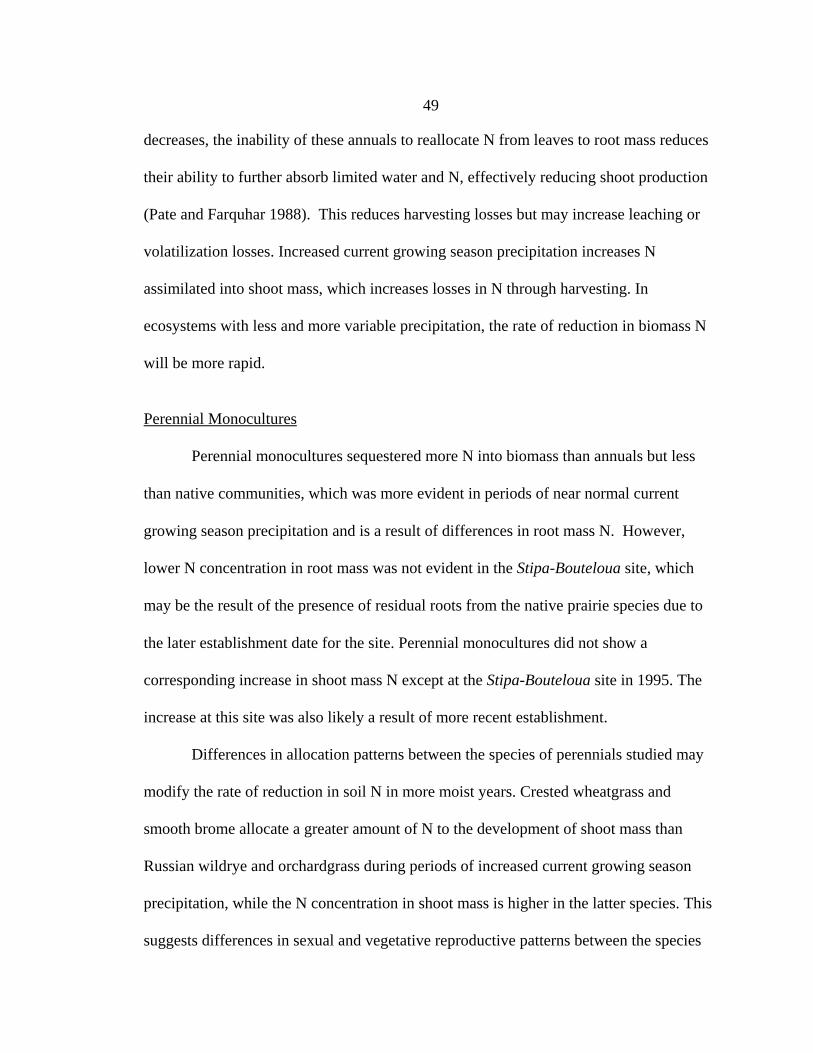
49
decreases, the inability of these annuals to reallocate N from leaves to root mass reduces
their ability to further absorb limited water and N, effectively reducing shoot production
(Pate and Farquhar 1988). This reduces harvesting losses but may increase leaching or
volatilization losses. Increased current growing season precipitation increases N
assimilated into shoot mass, which increases losses in N through harvesting. In
ecosystems with less and more variable precipitation, the rate of reduction in biomass N
will be more rapid.
Perennial Monocultures
Perennial monocultures sequestered more N into biomass than annuals but less
than native communities, which was more evident in periods of near normal current
growing season precipitation and is a result of differences in root mass N. However,
lower N concentration in root mass was not evident in the Stipa-Bouteloua site, which
may be the result of the presence of residual roots from the native prairie species due to
the later establishment date for the site. Perennial monocultures did not show a
corresponding increase in shoot mass N except at the Stipa-Bouteloua site in 1995. The
increase at this site was also likely a result of more recent establishment.
Differences in allocation patterns between the species of perennials studied may
modify the rate of reduction in soil N in more moist years. Crested wheatgrass and
smooth brome allocate a greater amount of N to the development of shoot mass than
Russian wildrye and orchardgrass during periods of increased current growing season
precipitation, while the N concentration in shoot mass is higher in the latter species. This
suggests differences in sexual and vegetative reproductive patterns between the species

50
during moist years, which will increase N loss through harvest. The planting and
harvesting of both crested wheatgrass and bromegrass will causing a greater loss of N
from the system than for either Russian wildrye or orchardgrass.
Summary and Conclusions
This research found that annual and perennial agronomic monocultures did not
accumulate more total biomass than native grasslands in the first four years after
plowdown, but there was a decrease in total N in the biomass of these communities
relative to natives. Annual monocultures fixed a greater amount of N into standing crop
than either perennial monocultures or native grasslands and the differences increased
with an increase in current growing season precipitation. In the last year of the study,
perennial monocultures sequestered less total N into biomass than native grassland
communities which may indicate that either these perennial agronomic monocultures
were less efficient at absorbing available mineral N or that the readily available supply
had declined. However, it should be noted that the crowns were not sampled and that the
perennial bunchgrasses (crested wheatgrass and Russian wildrye) were found to have
larger crown masses which serve as an N sink than the native communities. There were
no differences in total shoot mass N between perennial monocultures and native
grasslands in the last year of the study. Standing crop of the perennial monocultures was
larger but the N concentration in the shoot mass was lower, which agrees with work of
other researchers. Total N in the root masses of the perennial grass communities were
not different than native grassland, but the quantity of roots was lower, further agreeing

51
with earlier work.
In the first few years after plow-down, the shift toward aerial partitioning of N at
the expense of root mass is far larger in annual than perennial monocultures. The effect
of continued cultivation, and the inability of the annual species to absorb nutrients above
basic requirements for growth and harvest could continue to reduce the supply of N in the
soil environment. There were changes in partitioning of N in perennial monocultures
with a shift towards more shoot mass; however these changes were much smaller than
expected and do not seem to support the view put forward by Lesica and Deluca (1996).
On the other hand, spring grazing or harvest is the norm for most perennial monocultures
and in this study the monocultures were harvested in the fall. Consequently, the N
content of the standing crop may have been higher in the spring and losses may be
greater than observed in this study. In this study, by the time the standing crop was
harvested, a great deal of the N in the shoot mass may have been translocated to the
crowns and roots (Lawrence 1978).
Although others have suggested that production is higher in these perennial
monocultures over the long-term, this research indicates that immediately after plow-
down, differences in biomass partitioning of N between the perennial monocultures and
native communities are minimal. Continued grazing of these perennial monocultures
during periods of lower growing season precipitation might decrease their productivity
and economic sustainability.

52
References Cited
Burke, I.C., W.K. Lauenroth, and D.G. Milchunas. 1997. Biogeochemistry of managedgrasslands in central North America. In: E.A. Paul, K. Paustian, E.T. Elliott, andC.V. Cole (EDS.). Soil organic matter in temperate agroecosystems. Boca Raton,FL: CRC Press.
Christian, J. 1996. Revegetating abandoned cropland in southwestern Saskatchewanusing native species, alien species and natural succession. M.S. Thesis. Regina,SK: University of Regina. 52 p.
Coupland, R.T. 1961. A reconsideration of grassland classification in the Northern GreatPlains of North America. Journal of Ecology 49:135-167.
Craine C., D. Tilman, D. Wedin, P. Reich, M. Tjoelker, and J. Knops. 2002. Functionaltraits, productivity and effects on N cycling of 33 grassland species. FunctionalEcology 16:563-574.
Cramer, M., and O. Lewis. 1993. The influence of NO3- and NH4
+ nutrition on the gasexchange characteristics of the roots of wheat (Triticum aestivum) and maize (Zeamays) plants. Annals of Botany 72:37-47.
Dormaar, J.F., and W.D. Willms. 1993. Decomposition of blue grama and rough fescueroots in prairie soils.Journal of Range Management 46:207-213.
Dormaar, J.F., M.A. Naeth, W.D. Willms, and D.S. Chanasyk. 1995. Effect of nativeprairie crested wheatgrass (Agropyron cristatum (L.) Gaertn.) and Russianwildrye (Elymus junceus Fisch.) on soil chemical properties. Journal of RangeManagement 49:258-263.
Ellert. B.H., and H.H. Janzen. 1999. Short term influence of tillage on CO2 fluxes from asemiarid soil on the Canadian prairies. Soil and Tillage Research 50:21-32.
Gleeson, S., and D. Tilman.1990. Allocation and the transient dynamics of succession onpoor soils. Ecology 71(3):1144-1155.
Hartnett, D.C., and K.H. Keeler. 1995. Population processes. Chapter 5. In: A. Joern andK.H. Keeler (EDS.). The changing prairie: North American grasslands. Oxford,Great Britain: Oxford University Press. p. 82-99.
Hooper, D., and P. Vitousek. 1998. Effects of plant composition on nutrient cycling.Ecological Monographs 68:121-149.

53
Lawrence, T. 1978. An evaluation of thirty grass populations as forage crops forsouthwestern Saskatchewan. Canadian Journal of Plant Science 58:107-115.
Lesica, P. And T. H. DeLuca. 1996. Long-term harmful effects of crested wheatgrass onGreat Plains grassland Ecosystems. Journal of Soil and Water Conservation51(5):408 -412.
Love, R.A. 1972. Selection and breeding of grasses for forage and other uses. Chapter 5. In: V.B. Younger and C.M. McKell (EDS.). The biology and utilization ofgrasses. New York, NY: Academic Press.
Moss, E.H. 1944. The prairie and associated vegetation of southwestern Alberta.Canadian Journal of Resources 25(C):209-227.
Mueller, I. 1941. An experimental study of rhizomes of certain prairie plants. EcologicalMonographs 11:164-188.
Murphy, A., and O. Lewis. 1987. Effect of nitrogen feeding source on the supply ofnitrogen from root to shoot and the site of nitrogen assimilation in maize (Zea maysL. cv R201). The New Phytologist 107:327-333.
Odum, H.T. 1968. Work circuits and systems stress. In: H.E. Young (ED.) Primaryproductivity and mineral cycling in natural ecosystems. Orono, ME: University ofMaine Press. p. 81-138.
Pate, J.S., and G.D. Farquhar. 1988. Role of the crop plant in cycling of nitrogen. In: J.R.Wilson (ED.). Advances in nitrogen cycling in agricultural systems. WallingfordOxon, United Kingdom: CAB International. p. 23-45.
SAS Institute, Inc. 1999. SAS/STAT user guide. Version 8. Cary, NC: SAS Institute, Inc.3884 p.
Smoliak. S., A. Johnston, and L.E. Lutwick. 1967. Production and durability of crestedwheatgrass in southeastern Alberta. Canadian Journal of Plant Science 47:539-547.
Spedding, C.R.W. 1971. Grassland ecology. Oxford, Great Britain: Oxford University Press.
Steel, R.G.D., and J.H. Torrie. 1980. Principles and procedures of statistics: a biometricalapproach. New York, NY: McGraw Hill Book Co.
Tilman D., D. Wedin, and J. Knops. 1996. Productivity and sustainability influenced bybiodiversity. Nature (London) 379:718-720.

54
Tilman, D., and J. Knops. 1997. The influence of functional diversity on ecosystemprocesses. Science 277:1300-1302.
Tilman, D., J. Knops, D. Wedin, and P. Reich. 2002. Experimental and observationstudies of diversity, productivity and stability: Chapter 3. In: A. Kinzig, S. Pacala,and D. Tilman (EDS.). The functional consequences of biodiversity: empiricalprogress and theoretical extensions. Monographs of Population Biology 33:9-41.
Vinton, M.A., and I.G. Burke. 1995. Interactions between individual plant species andsoil nutrient status in the shortgrass steppe. Ecology 76(4):1116-1133.
Weaver, J.E. 1958. Summary and interpretation of underground development in naturalgrassland communities. Ecological Monographs 28(1):55-78.
Wedin, D.A. 1999. Nitrogen availability: plant:soil feedbacks and grassland stability. In:Eldridge and Freudenberger (EDS.). Sixth International Grassland CongressProceedings. Vol. 1. p. 193-197.
Wedin, D.A., and D. Tilman. 1990. Species effects on nitrogen cycling: a test withperennial grasses. Oecologia 84:433-441.
Whitehead, D.C. 1995. Grassland nitrogen. Wallingford, United Kingdom: CABInternational.
Woodmansee, R., J. Dodd, R. Bowman, F. Clark, and C. Dickinson. 1978. Nitrogenbudget of a shortgrass prairie ecosystem. Oecologia 34: 361-376.

55
CHAPTER 4
SOIL NITROGEN PARTITIONING IN NORTHERN GREAT PLAINSGRASSLANDS: SHORT-TERM RESPONSE TO
AGRONOMIC TREATMENTS
Introduction
Native grassland soils accumulate large pools of nitrogen (N) that are maintained
by microbial replacement of relatively small losses caused by denitrification,
volatilization, leaching, erosion and herbivory, and by rapid recycling of dead biomass
(Rosswell 1976, Stevenson 1982, Bonde and Rosswell 1987). These soils represent a
benchmark that can be used to determine the impacts of cultivation and seeding on the
quantity and quality of soil N.
Soil N is stored in various fractions that differ in stability, availability and rate of
turnover, but only a small labile N fraction is readily available to plants. This labile N
fraction is most sensitive to changes in management or environmental conditions (McGill
et al. 1988). The light fraction (density < 1.7 g cm-3) is part of this dynamic labile fraction
and consists of partially decomposed plant material found near the soil surface. In soils,
the conversion of the light fraction (LF) to available mineral N (NH4+ and NO3
-) occurs
through biochemical transformations mediated by soil microorganisms and is affected by
temperature, moisture and pH (Stevenson 1986, Whitehead 1995). Changes in LF and
mineral N in agronomic systems are influenced by the climate, soil crop and cropping
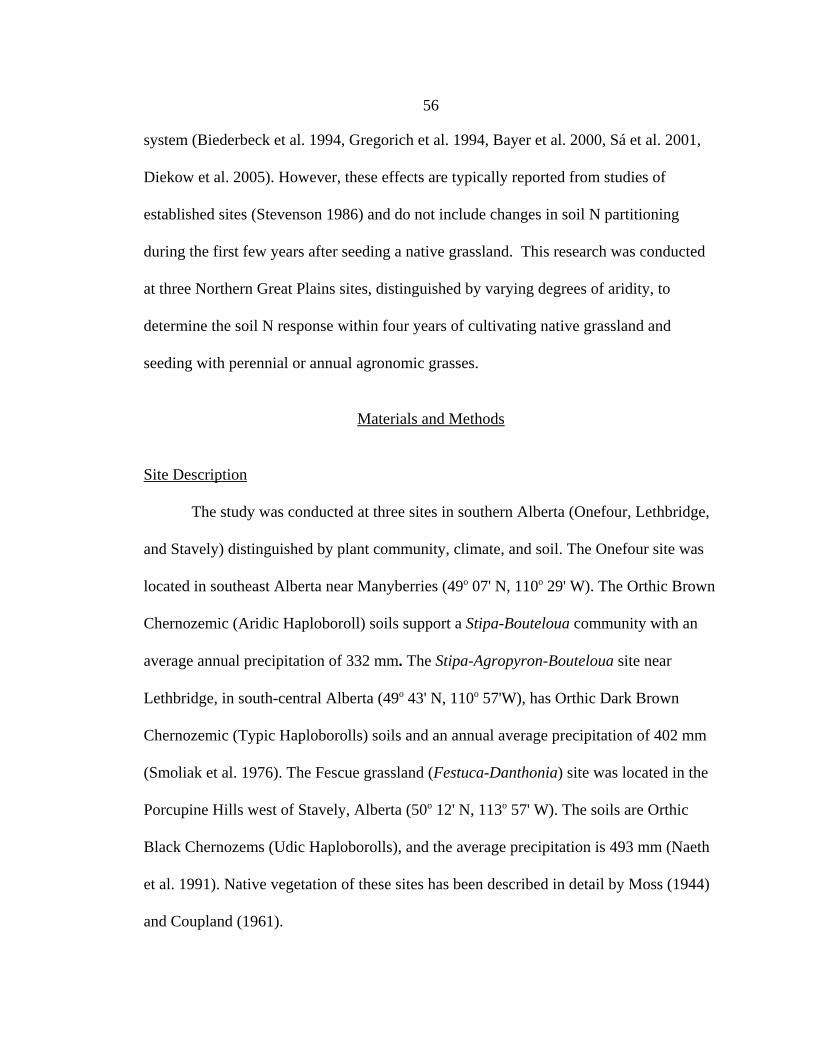
56
system (Biederbeck et al. 1994, Gregorich et al. 1994, Bayer et al. 2000, Sá et al. 2001,
Diekow et al. 2005). However, these effects are typically reported from studies of
established sites (Stevenson 1986) and do not include changes in soil N partitioning
during the first few years after seeding a native grassland. This research was conducted
at three Northern Great Plains sites, distinguished by varying degrees of aridity, to
determine the soil N response within four years of cultivating native grassland and
seeding with perennial or annual agronomic grasses.
Materials and Methods
Site Description
The study was conducted at three sites in southern Alberta (Onefour, Lethbridge,
and Stavely) distinguished by plant community, climate, and soil. The Onefour site was
located in southeast Alberta near Manyberries (49o 07' N, 110o 29' W). The Orthic Brown
Chernozemic (Aridic Haploboroll) soils support a Stipa-Bouteloua community with an
average annual precipitation of 332 mm. The Stipa-Agropyron-Bouteloua site near
Lethbridge, in south-central Alberta (49o 43' N, 110o 57'W), has Orthic Dark Brown
Chernozemic (Typic Haploborolls) soils and an annual average precipitation of 402 mm
(Smoliak et al. 1976). The Fescue grassland (Festuca-Danthonia) site was located in the
Porcupine Hills west of Stavely, Alberta (50o 12' N, 113o 57' W). The soils are Orthic
Black Chernozems (Udic Haploborolls), and the average precipitation is 493 mm (Naeth
et al. 1991). Native vegetation of these sites has been described in detail by Moss (1944)
and Coupland (1961).
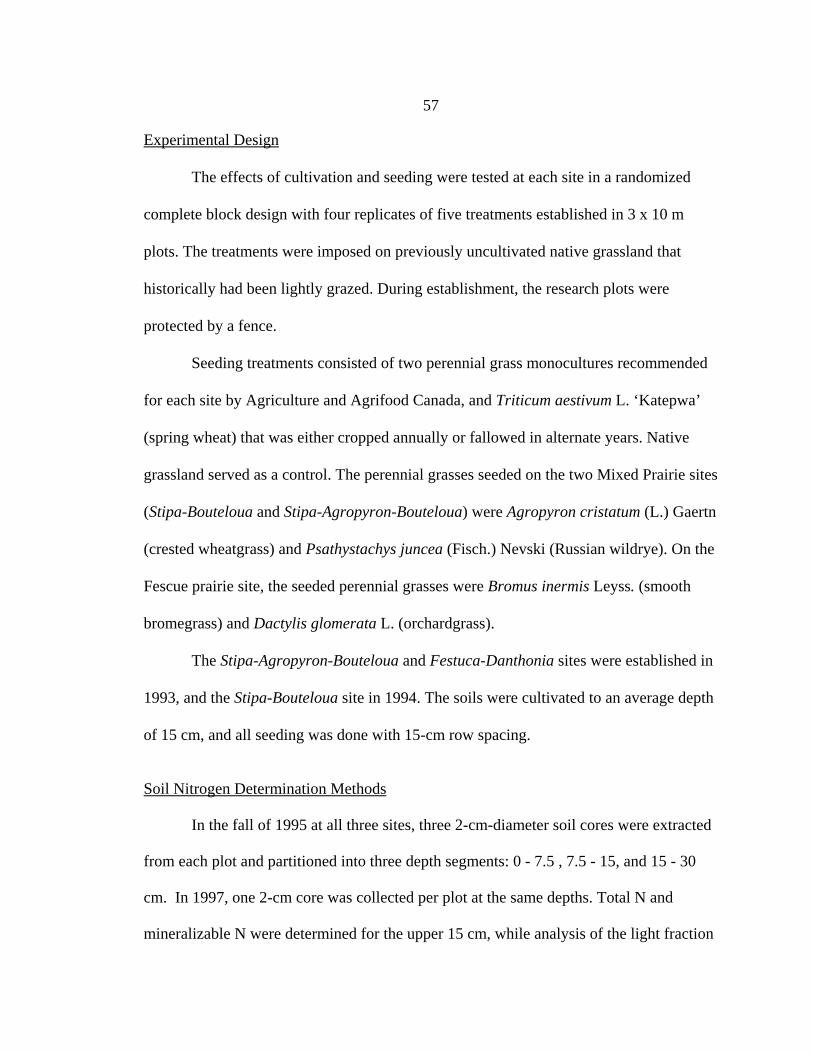
57
Experimental Design
The effects of cultivation and seeding were tested at each site in a randomized
complete block design with four replicates of five treatments established in 3 x 10 m
plots. The treatments were imposed on previously uncultivated native grassland that
historically had been lightly grazed. During establishment, the research plots were
protected by a fence.
Seeding treatments consisted of two perennial grass monocultures recommended
for each site by Agriculture and Agrifood Canada, and Triticum aestivum L. ‘Katepwa’
(spring wheat) that was either cropped annually or fallowed in alternate years. Native
grassland served as a control. The perennial grasses seeded on the two Mixed Prairie sites
(Stipa-Bouteloua and Stipa-Agropyron-Bouteloua) were Agropyron cristatum (L.) Gaertn
(crested wheatgrass) and Psathystachys juncea (Fisch.) Nevski (Russian wildrye). On the
Fescue prairie site, the seeded perennial grasses were Bromus inermis Leyss. (smooth
bromegrass) and Dactylis glomerata L. (orchardgrass).
The Stipa-Agropyron-Bouteloua and Festuca-Danthonia sites were established in
1993, and the Stipa-Bouteloua site in 1994. The soils were cultivated to an average depth
of 15 cm, and all seeding was done with 15-cm row spacing.
Soil Nitrogen Determination Methods
In the fall of 1995 at all three sites, three 2-cm-diameter soil cores were extracted
from each plot and partitioned into three depth segments: 0 - 7.5 , 7.5 - 15, and 15 - 30
cm. In 1997, one 2-cm core was collected per plot at the same depths. Total N and
mineralizable N were determined for the upper 15 cm, while analysis of the light fraction
58
was completed for the upper 7.5 cm.
Aliquots were obtained from each sample and dried at 105o C for 48 hours to
determine soil water content and bulk density. Stones were removed before oven drying
by screening with 2-mm sieves. The samples were then ground in a rotating sieve (2 mm)
and stored at room temperature until the analyses were completed. Another subsample
was further ground (149 :m) and analysed for C and N using an automated combustion
technique (Carlo ErbaTM, Milan, Italy). Percent soil C and N content were converted to
mass equivalent using bulk density.
Mineralizable N was determined by wetting 50 g oven dried soil to 80% of field
capacity wetness, which was determined using a pressure plate apparatus. These samples
were then incubated at 25o C for eight weeks in airtight 1-L glass jars. Evolved CO2 was
trapped in 10 mL of 2M NaOH. Jars were aerated and NaOH traps replaced at one, four,
and eight weeks. A replacement at two weeks was added in 1997. At the completion of
the incubation, the soils were air-dried and analysed for inorganic N using a Technotron
Autoanalyzer II (Tarrytown, NY). Ammonium was determined according to Industrial
Method No. 98-70W after KCl extraction, while nitrate levels were determined according
to Industrial Method No. 199070W/B (Keeney and Nelson 1982).
The LF was determined using a method utilized by Strickland and Sollins (1987)
and Janzen et al. (1992). A 10-g subsample of coarsely ground soil (2 mm) was dispersed
with sodium iodide (NaI) solution with a specific gravity of 1.70 (± 0.02) using a Vitis
homogeniser (Vitis Co., Gardiner, NY). Suspensions were allowed to settle for 48 hours
at room temperature, and the suspended material was removed using a vacuum and
transferred directly to a Millipore filtration unit (Millipore Corp., Medford, MA) with
59
Whatman No. 1 filter. The soil was suspended a second time to ensure complete
recovery. The light fraction was washed, oven-dried (60oC), weighed, ground using a 149
Fm mesh, and analysed for C and N using an automated dry weight combustion
technique (Carlo ErbaTM, Milan, Italy). Due to difference in light fraction sample
preparation between years, 1995 native grassland values were used as a reference to
adjust 1997 results.
Statistical Analyses
Each variable was analysed in a whole model as an unbalanced 3 (sites) x 3
(treatments) x 2 (years) x 4 (replicates) split-split plot design using the GLM Procedure
of SAS (1999). The potential bias resulting from repeated measurements over years was
alleviated using the Box Correction Procedure (Milliken and Johnson 1984). The analysis
was unbalanced because the perennial grass species were pooled, as were the wheat
cropping systems, resulting in twice the number of observations that were present in the
native treatments. The variables were highly responsive to the factors tested, and due to
interactions meaningful interpretation required a more detailed examination of the data.
This was accomplished by analysing the data within sites, and the grass species as
individual treatments, as a 5 (treatments) x 2 (years) x 4 (replicates) split plot design.
Means separation was achieved using single degree of freedom contrasts (Steel and
Torrie 1980). Those contrasts are found in the appendices. Significant difference
between treatment means was evaluated at P < 0.05.

60
Results
Precipitation during the 1995 growing season (March to September) at all three
sites decreased as Stipa-Bouteloua > Stipa-Agropyron-Bouteloua > Festuca-Danthonia
(Table 4.1). In 1996, precipitation at the Festuca-Danthonia and Stipa-Agropyron-
Bouteloua sites was well below the long-term average, but near average at the Stipa-
Bouteloua site (Table 4.1). In 1997, all three sites experienced near average growing
season precipitation (Table 4.1).
The treatment effect on most variables examined in this study was affected by
site, year of sampling, and their interactions (Table 4.2). The soil light fraction, light
fraction N, and the concentrations of soil N and NO3- followed a trend of Stipa-Bouteloua
< Stipa-Agropyron-Bouteloua < Festuca-Danthonia, while the concentrations of
mineralizable N and NH4+ were smallest for the Stipa-Agropyron-Bouteloua site. Site had
little impact on the treatment response of pooled perennial grass and wheat treatments
(Table 4.2). The light fraction of wheat declined between 30 and 38% compared to native
grasslands by 1995 and further declined to 60 to 73% of native values by 1997, except at
the Stipa-Bouteloua site in 1995 (Figure 4.1). The lack of treatment effect at this site was
probably a result of its later establishment date. The light fraction of the perennial grass
treatments was 38 and 50% of native grasslands in 1995 but rebounded to between 50 to
65% of native grasslands in 1997 (Figure 4.1). The drop in the light fraction of wheat and
perennial grasses resulted in a corresponding drop in light fraction N; however, there
were few significant differences between any of the perennial species utilized at any of
the three sites (Figure 4.2).

61
Table 4.1. Monthly precipitation (mm) over the growing season from 1995 to 1997 atthree sites in southern Alberta.
Year March April May June July Aug. Sept. Total %1
Stipa-Bouteloua
1995 17 37 41 130 56 50 48 379 148
1996 32 13 64 80 33 4 51 277 109
1997 28 15 84 65 11 23 20 246 96
Ave. 2 22 28 41 64 34 39 27 255 100
Stipa-Agropyron-Bouteloua
1995 10 38 106 138 66 44 19 421 137
1996 21 22 54 18 5 70 6 196 64
1997 33 14 96 101 32 33 10 319 104
Ave. 2 24 31 55 74 42 42 40 308 100
Festuca-Danthonia 3
1995 6 23 72 84 69 39 63 356 83
1996 45 24 72 49 7 4 54 255 60
1997 15 21 138 73 28 77 35 387 91
Ave.3 24 14 99 113 74 69 34 427 100
1 Percent of 50-year average.2 50-year averages - Agriculture and Agrifood Canada.3 Measured at Claresholm.
At the Stipa-Bouteloua site, cultivating and seeding of agronomic species
reduced mineralizable soil N in 1997 but not in 1995 (Figure 4.3). At the Stipa-
Agropyron-Bouteloua site, mineralizable N increased by cultivating and seeding in 1995,
but by 1997 the effect was evident only in wheat treatments (Figure 4.3) while at the
Festuca-Danthonia site, mineralizable N was not affected (Figure 4.3).
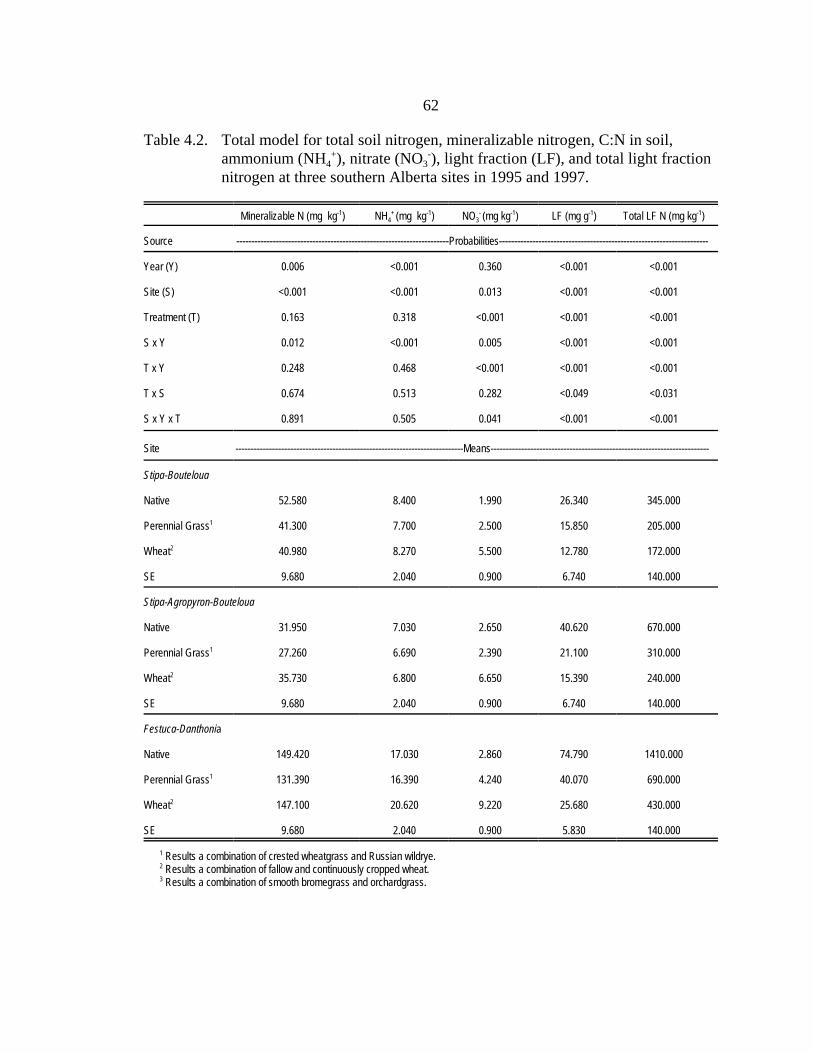
62
Table 4.2. Total model for total soil nitrogen, mineralizable nitrogen, C:N in soil,ammonium (NH4
+), nitrate (NO3-), light fraction (LF), and total light fraction
nitrogen at three southern Alberta sites in 1995 and 1997.
Mineralizable N (mg kg-1) NH4+ (mg kg-1) NO3
- (mg kg-1) LF (mg g-1) Total LF N (mg kg-1)
Source ----------------------------------------------------------------------Probabilities---------------------------------------------------------------------
Year (Y) 0.006 <0.001 0.360 <0.001 <0.001
Site (S) <0.001 <0.001 0.013 <0.001 <0.001
Treatment (T) 0.163 0.318 <0.001 <0.001 <0.001
S x Y 0.012 <0.001 0.005 <0.001 <0.001
T x Y 0.248 0.468 <0.001 <0.001 <0.001
T x S 0.674 0.513 0.282 <0.049 <0.031
S x Y x T 0.891 0.505 0.041 <0.001 <0.001
Site ---------------------------------------------------------------------------Means------------------------------------------------------------------------
Stipa-Bouteloua
Native 52.580 8.400 1.990 26.340 345.000
Perennial Grass1 41.300 7.700 2.500 15.850 205.000
Wheat2 40.980 8.270 5.500 12.780 172.000
SE 9.680 2.040 0.900 6.740 140.000
Stipa-Agropyron-Bouteloua
Native 31.950 7.030 2.650 40.620 670.000
Perennial Grass1 27.260 6.690 2.390 21.100 310.000
Wheat2 35.730 6.800 6.650 15.390 240.000
SE 9.680 2.040 0.900 6.740 140.000
Festuca-Danthonia
Native 149.420 17.030 2.860 74.790 1410.000
Perennial Grass1 131.390 16.390 4.240 40.070 690.000
Wheat2 147.100 20.620 9.220 25.680 430.000
SE 9.680 2.040 0.900 5.830 140.000
1 Results a combination of crested wheatgrass and Russian wildrye.2 Results a combination of fallow and continuously cropped wheat. 3 Results a combination of smooth bromegrass and orchardgrass.

Treatment
NAT B O WC WF
1997
Stipa-Bouteloua Stipa-Agropyron-Bouteloua Festuca-Danthonia
Ligh
t Fra
ctio
n (g
kg-1
)
0
20
40
60
80
100
120
140
160
Treatment
NAT CWG RWR WC WF
Ligh
t Fra
ctio
n (g
kg-1
)
0
20
40
60
80
100
120
140
160
Treatment
NAT CWG RWR WC WF
1995 1995 1995
1997 1997
63
Figure 4.1. Light fraction (LF) concentrations in the upper 7.5 cm of agronomic and native communities in Stipa-Bouteloua, Stipa-Agropyron-Bouteloua, and Festuca-Danthonia sites in 1995 and 1997. Error bars are the standard error of treatment means (n = 8). Symbols: B - brome grass, O - orchardgrass, CWG - crested wheatgrass, NAT - native grassland, RWR - Russian wildrye, WC - wheat continuous crop, WF - wheat fallow.

64
Figure 4.2. Total nitrogen content of the light fraction (LFN) in the upper 7.5 cm of the soil under agronomic and nativecommunities at Stipa-Bouteloua (SB), Stipa-Agropyron-Bouteloua (SAB), and Festuca-Danthonia (FD) sites in 1995and 1997. Error bars are the standard error of treatment means (n = 8). Symbols: B - brome grass, O - orchardgrass, CWG - crested wheatgrass, NAT - native grassland, RWR - Russian wildrye, WC - wheat continuous crop, WF - wheatfallow.
Treatment
NAT B O WC WF
Treatment
NAT CWG RWR WC WF
Treatment
NAT CWG RWR WC WF
Ligh
t Fra
ctio
n N
(mg
kg-1)
0
500
1000
1500
2000
2500
3000
Ligh
t Fra
ctio
n N
(mg
kg-1)
0
500
1000
1500
2000
2500
30001995
1997
1995
1997
1995
1997
Stipa-Bouteloua Stipa-Agropyron-Bouteloua Festuca-Danthonia
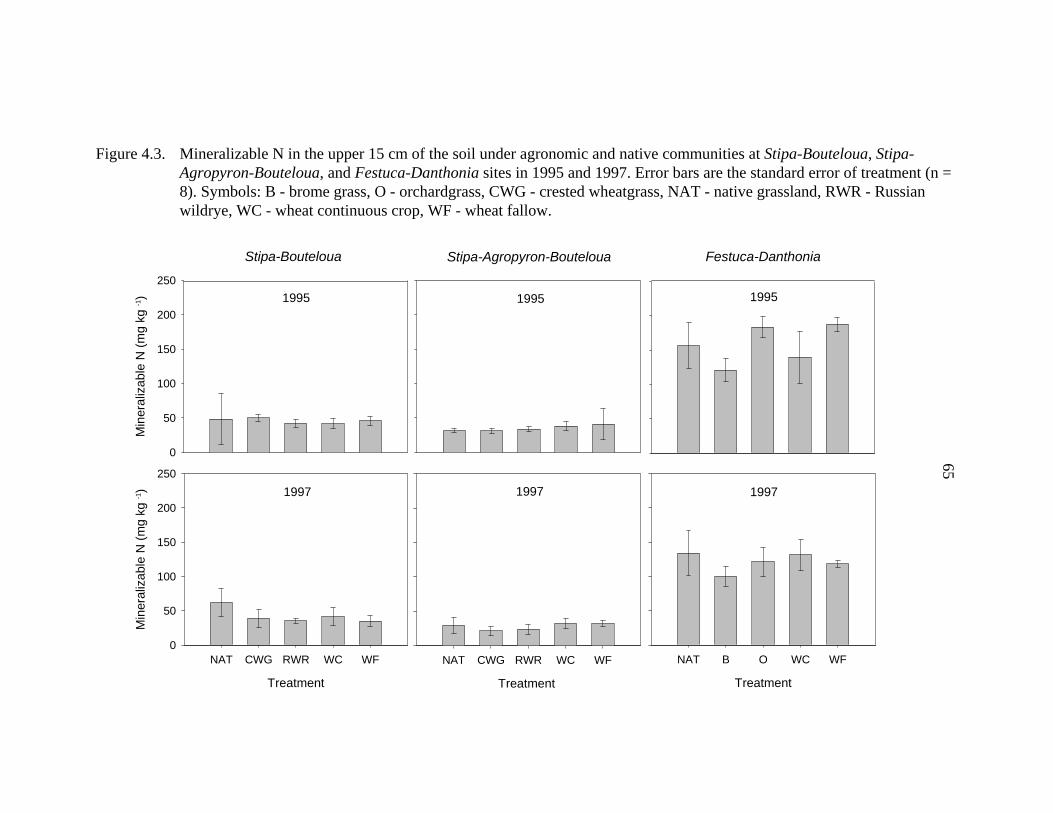
65
Figure 4.3. Mineralizable N in the upper 15 cm of the soil under agronomic and native communities at Stipa-Bouteloua, Stipa-Agropyron-Bouteloua, and Festuca-Danthonia sites in 1995 and 1997. Error bars are the standard error of treatment (n =8). Symbols: B - brome grass, O - orchardgrass, CWG - crested wheatgrass, NAT - native grassland, RWR - Russian wildrye, WC - wheat continuous crop, WF - wheat fallow.
Treatment
NAT B O WC WF
Treatment
NAT CWG RWR WC WF
Treatment
NAT CWG RWR WC WF
Min
eral
izab
le N
(mg
kg -1
)
0
50
100
150
200
250
Min
eral
izab
le N
(mg
kg -1
)
0
50
100
150
200
250
Stipa-Bouteloua
1995
1997
1995
1997
1995
1997
Stipa-Agropyron-Bouteloua Festuca-Danthonia
66
At the Stipa-Bouteloua and Stipa-Agropyron Bouteloua sites, wheat treatments
resulted in greater soil NO3- concentrations than either perennial or native grass
communities in both years (Figure 4.4). In 1995, the results were similar at the Festuca-
Danthonia site but in 1997 NO3 - concentration in wheat was higher than the native
grasslands but not different from perennial grasses (Figure 4.4).
Discussion
Cultivation and seeding had no effect on total N in the first 15 cm soil depth, but
it did influence the light fraction found in the upper 7.5 cm at all sites. Site treatment
responses were different only for the variables derived from the light fraction. However,
magnitudes were different rather than ranking. A greater reduction in light fraction and
light fraction N at the Stipa-Bouteloua site than at Stipa-Agropyron-Bouteloua or
Festuca-Danthonia sites was expected, since the labile pool of nitrogen at this site is
more prone to thermal and physical decomposition through freeze-thaw and wet-dry
cycles than at the other sites (Dormaar 1975, Lutwick and Dormaar 1976). However,
physical changes in the soil environment caused by cultivation may have reduced thermal
and moisture variability in the soil resulting in reduced decomposition or the pool was
less dynamic.
Cultivation and seeding of native grasslands may modify soil N partitions through
the mixing of the soil, incorporation of vegetation, changes in the soil temperature and
moisture regimes, and changing microorganism activity. The direct effect of mixing on
total soil N was negligible, since the plow layer imposed during cultivation was shallower

67
Figure 4.4. Nitrate content in the upper 15 cm of the soil under agronomic and native communities at Stipa-Bouteloua, Stipa-Agropyron-Bouteloua, and Festuca-Danthonia sites in 1995 and 1997. Error bars are the standard error of treatment means (n = 8). Symbols: B - brome grass, O - orchardgrass, CWG - crested wheatgrass, NAT - nativegrassland, RWR -Russian wildrye, WC - wheat continuous crop, WF - wheat fallow.
Treatment
NAT CWG RWR WC WF
1997
Treatment
NAT B O WC WF
Treatment
NAT CWG RWR WC WF
Nitr
ate
(mg
kg -1
)
0
2
4
6
8
10
12
14
161997
1995
Nitr
ate
(mg
kg -1
)
0
2
4
6
8
10
12
14
161995 1995
1997
Stipa-Bouteloua Stipa-Agropyron-Bouteloua Festuca-Danthonia
68
than the Ah horizons at all three sites; however, it may partially explain the reduction in
light fraction and light fraction N in the upper 7.5 cm of the soil because cultivation
exceeded that depth. At these sites, 73 to 91% of the N contained in these native
communities is partitioned into root mass. Cultivation caused the death of this root mass,
which may have modified the quantity and quality of the light fraction.
Cultivation disturbs soil structure and macerates roots which increases microsite
availability for microorganism activity and alters soil microbial communities due to
changes in soil temperature and moisture regimes. (Rovira and Graecen 1957, Kennedy
1999, Calderón et al. 2001). These modifications may have increased mineralization of
the light fraction, reduced light fraction N and increased soil nitrate (NO3-) concentrations
(Entz et al. 2001, Calderón and Jackson 2002).
The increased soil nitrate concentations created by cultivation may be lost from
the system in a variety of ways. Since agronomic species have been modified to
maximize shoot production, a proportion of the absorbed nitrate is assimilated into shoot
biomass, most of which is removed through harvest (McGill et al. 1981). Secondly, since
nitrate is soluble in water as precipitation increases in amount or intensity, losses may
occur through erosion or leaching (Davidson et al. 1990, Bayer et al. 2000, Malhi et al.
2002). Tillage method, timing and frequency of tillage also increase erosion or leaching
losses (Ritter et al. 2005). Lastly, denitrificaton and volatilization causes losses of soil
nitrate from agronomic systems. Increased levels N20 can be attibuted to higher soil
moisture and temperature created by cultivation (Horgan et al. 2002) and losses may
occur from bare soil or through the transpiration stream (Chang et al. 1998, Smart and

69
Bloom 2001). The amount of nitrate in the soil profile can be reduced with no-till and
continuous cropping systems that include perennial plants (Weed and Anwar 1997, Entz
et al. 2001).
Light fraction and light fraction N in the soil of all treatments were generally
lower at the Stipa-Bouteloua site than at the Stipa-Agropyron-Bouteloua and Festuca-
Danthonia sites. This suggests a positive correlation between the quantity of light
fraction and long- term growing season precipitation levels. By 1997, the light fraction
under wheat had declined 73% at the Festuca Danthonia site and 60% the Stipa-
Bouteloua site. With mean growing season precipitation less limiting at the Festuca-
Danthonia site, changes in soil temperature caused by cultivation, removal of the plant
canopy, aggregate disruption and changes in root input may have allowed greater
mineralization of the light fraction. At the drier Stipa-Bouteloua site, however, water may
have been the primary factor limiting microbial populations and mineralization of the
light fraction.
The rate of reduction in the light fraction and light fraction N components
increased with cultivation and planting of annual species. When planting perennial
species, there were no significant losses in light fraction or light fraction N over the
short-term; however, continued harvest may cause reductions in both.
Summary and Conclusions
Four years after converting native prairie grass into agronomic crops, there was
no change in total N, mineralizable N or ammonium in perennial and annual crop species,

70
but there were large changes in the LF and LFN.
The absence of short-term changes in total soil N was expected due to the large
size of the pool in grassland soils. However the lack of difference in mineralizeable N
does not agree with work done in Wyoming that found native grasslands had higher
mineralizable N than selected agronomic treatments. The typical increases in soil
temperature, moisture and oxygen due to cultivation led to increased mineralization. In
the first four years there was a marked increase in nitrate in annual monocultures,
indicating that the rate of mineralization was elevated immediately after plow-down and
cultivation of the native grasslands. This agrees with other studies that found increased
mineralization with cultivation and nitrate concentration which was attributed to
breakdown and mineralization of soil organic matter.
In contrast to patterns recorded under agronomic crops, there were no differences
in nitrate content between native grasslands and perennial monocultures. This response
does not agree with work done on different perennial grass species which were found
have up to tenfold differences in annual net mineralization after only three years, and
which were attributed to differences in nitrogen concentrations in below ground biomass.
However, there were few differences in the nitrate concentration of root tissue between
crested wheatgrass, Russian wildrye and native communities in this study. The lack of
difference in nitrate concentrations could have been due to the short period of time since
plow-down and the effect of the decomposing relic root masses of the native species.
In the last year of the study, light fraction N was lowest in annual monocultures
which agrees with other work done in Canada. Low LFN was thought to be due to a

71
combination of tillage effects and reductions in root mass following plowdown. In this
study perennial agronomic monocultures had a higher LFN than the annual monocultures
and lower than native grasslands with few differences between the various perennial
species. The intermediate position occupied by the perennial monocultures was likely a
result of the single tillage event rather than differences in species root mass.
With adequate moisture and proper management these monocultures will likely
continue to produce greater above ground biomass for a period of time. However it will
be at the expense of N reserves in the soil. At some point, lower N available for growth
will likely limit the amount of useable forage and the economic benefits of maintaining
these monocultures. At that time the accumulated changes to ecological processes and
diversify may limit our ability to reestablish native multi-species communities

72
References Cited
Bayer, C., Mielniczuk, J., Martin-Neto, L. and S.V. Fernandez. 2000. Organic matterstorage in a sandy clay loam Acrisol affected by tillage and cropping systems insouthern Brazil. Soil Tillage Research. 54:101-109.
Biederbeck, V.O., H.H. Janzen, C.A. Campbell, and R.L. Zentner. 1994. Labile soilorganic matter as influenced by cropping practices in an arid environment. SoilBiology and Biochemistry 26(12):1647-1656.
Bonde, T.A., and T. Rosswell. 1987. Seasonal variations of potentially mineralizablenitrogen in four cropping systems. Soil Science Society of America Journal 51:1508-1514.
Calderón, F.J. and L.E. Jackson. 2002. Rototillage, disking and subsequent airrigation:
Effects on soil nitrogen dynamics, microbial biomass and carbon dioxide efflux.Journal of Environmental Quality. 31: 752-758.
Calderón, F.J., L.E. Jackson, K.M. Scow, and D.E. Rolston. 2001. Short-term dynamicsof nitrogen, microbial activity and phospholipid fatty acids after tillage. SoilSociety of American Journal 65:118-126.
Chang,C., H.H. Janzen, C.M. Cho, and E.M. Nakonechny. 1998. Soil Science Society ofAmerican Journal. 62(1): 35-38.
Coupland, R.T. 1961. A reconsideration of grassland classification in the northern greatplains of North America. Journal of Ecology 49:135-167.
Davidson, E.A., J.M. Stark, and M.K. Firestone. 1990. Microbial production andconsumption of nitrate in annual grasslands. Ecology 71:1968-1975.
Diekow, J., Mielniczuk, J., Knicker, H., Bayer, C., Dick, D., and I. Kogel-Knabner. 2005.Carbon and nitrogen stocks in physical fractions of a subtropical Aerisol asinfluenced by long-term no till cropping systems and N fertilization. Plant andSoil 268: 319-328.
Dormaar, J.F. 1975. Susceptibility of organic matter of chernozemic Ah horizons tobiological decomposition. Canadian Journal of Soil Science 55:473-480.
Entz, M.H. Bullied, W.J., Forster, D.A. Gulden, R. And J.K. Vessey. 2001. Extractrion ofSubsoil N by Alfalfa, Alfaalfa-Wheat, and perennial grass systems. AgronomyJournal 93:495-503.

73
Gregorich, E.G., M.R. Carter, D.A. Angers, C.M. Montreal, and B.H. Ellert. 1994.Towards a minimum data set to assess soil organic quality. Canadian Journal ofSoil Science 74:367-385.
Horgan, B.P., B.E. Brandon, and R.L. Mulvaney. 2002. Direct measurement ofdenitrification using 15N labelled fertiliaer applied to turfgrass. Crop Science 1602 - 1610.
Janzen, H.H., C.A. Campbell, S.A. Brandt, G.P. Lafond, and L. Townley Smith. 1992. Light fraction organic matter in soils from long-term crop rotations. Soil Scienceof American Journal 56:1799-1806.
Keeney, D. R., and D. W. Nelson. 1982. In A.L. Page (Ed.) Methods of Soil AnalysisPart 2. American Society of Agronomy. Madison WI, p. 648-693.
Kennedy, A.C. 1999. Microbial diversity in agroecosystem quality, p. 1-17. In: W.W. Collins and C.O. Qualset (Eds.). Biodiversity in agroecosystems. New York: CRCPress.
Lutwick, L.E., and J.F. Dormaar. 1976. Relationships between the nature of soil organic matter and root lignins of grasses in a zonal sequence of Chernozemic soils.Canadian Journal of Soil Science 56:363-371.
Malhi, S.S., S.A. Brandt, D. Ulrich, R. Lemke, and K.S. Gill. 2002. Accumulation andDisturbution of Nitrate-Nitrogen and Extractable Phosporus in the soil profoleunder various croppping systems. Journal of Plant Nutrition 25(11): 2499-2520.
McGill, W.B., C.A. Campbell, J.F. Dormaar, E.A. Paul, and D.W. Anderson. 1981. Soil organic matter losses. Proc. 18th Annual Soil Science Workshop. Edmonton, AB.133 p.
McGill, W.B., J.F. Dormaar, and E. Reinl-Dwyer. 1988. New perspectives on soilorganic matter, quality, quantity and dynamics on the Canadian Prairies. In: Land degradation and conservation tillage. Proc. Annual Canadian Soil ScienceMeeting. Calgary, AB. p. 30-48.
Milliken, G.A., D.E. Johnson. 1984. Analysis of messy data, Volume 1: Designedexperiments. Van Nostrand Reinhold. New York, NY. 473p.
Moss, E.H. 1944. The prairie and associated vegetation of southwestern Alberta. Canadian Journal of Resources 25(C):209-227.
Naeth, M.A., A.W. Bailey, D.S. Chanasyk, and D.J. Pluth. 1991. Water holding capacity

74
of litter and soil organic matter in Mixed Prairie and Fescue grassland ecosystemsof Alberta. Journal of Range Management 44(1):13-17.
Ritter, E., M. Starr, and L. Vesterdal. 2005. Losses of nitrate from gaps of different sizesin a managed beech (Fagus sylvatica) forest. Canadian Journal of ForestryResearch. 35: 308-319.
Rosswell, T. 1976. The internal cycle between microorganisms, vegetation and soil. In: B.H. Stevenson and R. Soderlund (Eds.). Nitrogen, phosphorous and sulphur - global cycles. Stockholm, Sweden: Ecological Bulletin. p. 157-167.
Rovira, A.D., and E.L. Graecen. 1957. The effect of aggregate disruption on the activitiesof microorganisms in the soil. Australian Journal of Agricultural Research 8:659-673.
Sá, J.C., Cerri, Dick, W.A., Lal, R., Venko-Filho, S.P., Piccolo, M.C., and B.E. Feigl. 2001. Organic matter dynamics and carbon sequestraton rates for a tillagechronosequence in a Brazilian Oxisol. Soil Science Society of America Journal65: 1486-1499.
SAS Institute, Inc. 1999. SAS/STAT user guide. Version 8. Cary, NC: SAS Institute Inc. 3884 p.
Smart, D.R. and A.J. Bloom. 2001. Wheat leaves emit nitrous oxide during nitrateassimilations. Proceedings of the National Academy of Sciences. 98(14): 7875 -7878.
Smoliak, S., A. Johnston, M.R. Kilcher, and R.W. Lodge. 1976. Management of prairierangeland. Publication 1425. Ottawa, ON: Information Division, Department ofAgriculture. 30 p.
Steel, R.G.T., and J.H. Torrie. 1980. Principles and procedures of statistics: a biometrical approach. New York, NY: McGraw Hill Book Co.
Stevenson, F.J. 1982. Origin and distribution of nitrogen in soil, p 1-39. In: F.J. Stevenson (ED.). Nitrogen in agricultural soils. New York, NY: Academic Press.
Stevenson, F.J. 1986. Cycles of soils: C, N, P, S, and micronutrients. New York, NY: Wiley Interscience.

75
Strickland, T.C., and P. Sollins. 1987. Improved method for separating light and heavy fraction organic material from soil. Soil Science Society of America Journal 51:1390-1393.
Weed, D.A.J., and Anwar. 1997. Nitrate and water present in and flowig from root zonesoil. Journal of environmental Quality. 25:709-719.
Whitehead, D.C. 1995. Grassland nitrogen, 397 p. Wallingford. UK: CAB International.

76
CHAPTER 5
WATER UPTAKE RESUMPTION FOLLOWING SOIL DROUGHT:A COMPARISON BETWEEN NATIVE AND
AGRONOMIC COMMUNITIES
Introduction
In an environment with low, variable growing season precipitation, high
evapotranspiration and frequent droughts, the Stipa-Bouteloua (needle and thread grass -
blue grama grass) community of the Northern Great Plains of southeastern Alberta,
Canada has evolved a stable assemblage of functionally diverse species that occupy
complementary niches (Tilman et al. 1996, Hooper and Vitousek 1998). In both dominant
species found in this dry mixed grass community {Heterostipa comata (Trin. Rupr.)
Barkworth (needle and thread grass) and Bouteloua gracilis (Wild ex Kunth) lag ex
Griffiths (blue grama grass), a large proportion of assimilated resources are allocated to
root mass to better use limited soil water. Needle and thread grass, a C3 species, has a
broad, deep, well-branched rooting system which effectively uses deeper early-season
soil water, whereas the shallow rooted C4 blue grama grass has a high capacity for fine
root proliferation and rapid water uptake after convection storms later in the growing
season (Smoliak 1956, Weaver 1958, Coupland and Johnson 1965, Sala and Lauenroth
1982, Hook and Lauenroth 1994).

77
Over the last 60 years, millions of hectares of this grassland have been cultivated
and replaced by monocultures of Agropyron cristatum (L.) Gaertn. (crested wheatgrass)
and Psathyrostachs juncea (Fisch.) Nevski (Russian wildrye) (Dormaar 1978, Christian
and Wilson 1999). Both of these C3 bunchgrasses have widespread and deep root systems
that efficiently access limited soil water supplies (Smoliak and Johnston 1980). In
addition, crested wheatgrass roots have been shown to lift absorbed water from deeper
parts of the soil profile and release it into shallower layers (Caldwell et al. 1998). This
hydraulic lift not only maintains shallower roots but enhances soil biochemical
conditions, nutrient availability and acquisition by roots. These characteristics may result
in the creation of a competitive advantage over native communities (Bittman and
Simpson 1989, Caldwell et al. 1998). The potential for hydraulic lift in Russian wildrye
and the dry mixed prairie has not been reported.
In both cultivated and uncultivated semiarid grasslands, temporal and spatial
differences in water availability combined with heterogeneity of soil resources are
important factors in determining the structure and dynamics of plant communities. An
understanding of species and community differences in soil-water-root relationships will
enhance our ability to effectively manage plant, soil, and water resources, allow the
design of multi-crop agro-ecosystems that more fully exploit below-ground niches, and
increase our understanding of invasive plant infestation and management (Noy-Meir
1973, Frank and Bauer 1991, Grime 1994, Sheley and Larson 1995, Wraith and Wright
1998).
78
Drought is a common characteristic of the semi-arid environments in which these
species have evolved. During drought periods, short duration high intensity convection
storms may occur in the summer. The objective of this study was to compare the rate of
water uptake of needle and thread - blue grama grass, crested wheatgrass, and Russian
wildrye communities after simulated drought periods. The information from this research
may provide a greater understanding of functional characteristics which allow long-term
survival of introduced grass monocultures after plowdown and seeding of native
grasslands.
Materials and Methods
Description of Source Material Sites
The needle and thread grass - blue grama grassland community at the Onefour
substation of Agriculture and Agri-Food Canada near Manyberries, Alberta, Canada (49o
07' N, 110o 29' W) has a long-term annual average precipitation of 332 mm, with 247 mm
or 74.3% falling during the March-through-September growing season. During that
period, 54% (133 mm) falls from April to June, and 27% (66 mm) in July and August
(Agriculture and Agri-food Canada). The vegetation of this community has been
described in detail by Moss (1944) and Coupland (1961).
Experimental Design
In 1994, crested wheatgrass and Russian wildrye communities were established in
3 m x 10 m plots at Onefour on previously uncultivated native grassland that had a
history of light grazing. At the time of establishment, the sites were protected by a fence.

79
In July 1997, five 38-cm diameter, 15-cm deep sods were obtained from each of
the three field treatments: crested wheatgrass, Russian wildrye, and native (needle and
thread - blue grama grass) communities. These sods were transported to a controlled-
environment greenhouse at Montana State University (Bozeman, Montana, USA) where
each was transplanted into a 250-L barrel filled with sandy loam soil. Each barrel was
packed in 15-cm increments to a bulk density of 1.26 g cm- 3. Time domain reflectometry
(TDR) probes (30-cm length) (Topp et al. 1980) were placed horizontally at 7.5, 15, and
60 cm depths within each barrel. Each probe was attached to a series of coaxial
multiplexers (SDMX50, Campbell Scientific. Inc., Logan, UT, USA). A Tektronix
1502C (Beaverton, OR, USA) metallic TDR cable tester controlled by a 21X datalogger
(Campbell Scientific, Inc.) allowed for hourly recording of volumetric water content (2)
for the three depths in each column.
Supplemental illumination by 1000 W metal halide lamps created 14-h
daylengths, with 1-h ramp periods in the morning and evening. Air temperatures
fluctuated between 15o C (night) and 20-25o C (day) with an uncontrolled RH of 0.2 to
0.4 (HMP35C, Vaisala. Inc., Woburn, MA, USA) over the period of the study.
The planted columns were allowed to establish for 11 months until the first week
of June 1998, at which time watering ceased. On July 29, when soil water content of the
column at all depths stabilized near -1.5 MPa matric potential equivalent as determined
via a pressure plate apparatus, water was added to each column to bring the soil in the
column to 0.01 MPa wetness to a 30 cm depth. Soil water content was monitored at each
depth hourly for six 7-d periods between calendar day 210 and 295 of 1998. The first

80
Figure 5.1. Changes in soil water content during six rewetting sequences betweenCalendar Day 210 and 245 of 1998, at 7.5, 15, and 30 cm soil depths incrested wheatgrass, Russian wildrye, and needle and thread - blue gramagrass communities grown in columns at the controlled-environmentgreenhouse at Montana State University, Bozeman, MT. Re-wet sequences 1 to 6 progress in order from left to right in each of the graphs
Soi
l Wat
er C
onte
nt (m
3 m-3
soil)
0 .0 5
0 .1 0
0 .1 5
0 .2 0
0 .2 5
0 .3 0
0 .3 5
0 .4 0
D a y o f 1 9 9 8
2 0 0 2 2 0 2 4 0 2 6 0 2 8 0 3 0 0
Soi
l Wat
er C
onte
nt (m
3 m-3
soi
l)
0 .0 6
0 .0 8
0 .1 0
0 .1 2
0 .1 4
0 .1 6
0 .1 8
C re s te d w h e a tg ra s sR u ss ia n w ild ryeN e e d le -a n d -th re a d - b lu e g ra m a g ra ss
D e p th 3 0 c m
Soi
l Wat
er C
onte
nt (m
3 m-3
soi
l)
0 .0 5
0 .1 0
0 .1 5
0 .2 0
0 .2 5
0 .3 0
0 .3 5
D e p th 7 .5 cm
D e p th 1 5 cm

81
re-wet occurred on day 210, the second on day 217, the third on 244, the fourth on 251,
the fifth on 273 and the sixth on 280 (Figure 5.1). On each re-wet, an amount of water
was added to each column to bring them back to 0.01 MPa matric potential equivalent.
For each 7-d period, the slope of the 2 time series was determined by linear regression
(R2>0.85) for 7.5 and 15 cm depths in each column. The rate of soil water uptake
(mm h-1) was also determined for each 7-d period by multiplying the change in 2 by the
estimated depth of the horizontal TDR probe measurement sensitivity (4 cm). Since
relative humidity and wind speed were fairly uniform in the greenhouse, spatial
differences in evaporation were not considered significant for the randomly located
treatment columns.
The soil water data were analyzed separately for the initial (1, 3, and 5) and
second (2, 4, and 6) re-wets using the MIXED procedure from SAS (SAS Institute, Inc.
2005). Community, time, and their interaction were considered in the model as fixed
effects. Re-wet sequences were treated as repeated measures and different variance-
covariance structures were fitted; the one with the lowest AIC value was selected for the
final analysis. The UNIVARIATE procedure was used to test the residuals for normality
and for obvious outliers. Differences among slope means were evaluated for significance
using an LSD test (SAS Institute, Inc. 2005) with significance determined at LSD < 0.05.
Results
Although there appeared to be a greater rate of water uptake at 7.5 cm in the
needle and thread-blue grama grass community (Figure 5.2 and 5.3), there were no

82
Figure 5.2. Mean changes in soil water content during the first two re-wetting sequences(re-wet 1 and 2) between Day 210 and 245 of 1998 at 7.5 and 15 cm soildepths in crested wheatgrass, Russian wildrye, and needle and thread - bluegrama grass communities grown in columns at the controlled-environmentgreenhouse at Montana State University, Bozeman, MT.
Soil
Wat
er C
onte
nt (m
3 m-3
soi
l)
0.05
0.10
0.15
0.20
0.25
0.30
0.35
0.40
Day of 1998
205 210 215 220 225 230 235 240 245
Soi
l Wat
er C
onte
nt (m
3 m-3
of s
oil)
0.05
0.10
0.15
0.20
0.25
0.30
0.35
0.40
Crested wheatgrassRussian wildryeNeedle-and-thread - blue grama grass
7.5 cm depth
15 cm depth

83
Figure 5.3. Mean changes in soil water content during the second two re-wettingsequences (re-wet 3 and 4) between Day 245 and 275 of 1998 at 7.5 and 15cm soil depths in crested wheatgrass, Russian wildrye, and needle and thread- blue grama grass communities grown in columns at the controlled-environment greenhouse at Montana State University, Bozeman, MT.
Soi
l Wat
er C
onte
nt (m
3 m-3
)
0.05
0.10
0.15
0.20
0.25
0.30
0.35
0.40
Day of 1998
240 245 250 255 260 265 270 275
Soi
l Wat
er C
onte
nt (m
3 m-3
soi
l)
0.05
0.10
0.15
0.20
0.25
0.30
0.35
0.40
Crested wheatgrasRussian wildryeNeedle and thread- blue grams grass
15 cm depth
7.5 cm depth
84
significant differences between water uptake rates at 7.5 and 15 cm depths within or
between communities following any of the re-wetting periods. There was a
significant difference between all re-wet sequences, with slopes for re-wets 2 and 3
steeper (more negative) than for re-wet sequences 1, 4, 5 and 6 for all three grass
communities (Table 5.1). The rate of water uptake at 15 cm was approximately three
times the rate at 7.5 cm after the first pulse of water but following subsequent pulses the
rates at 15 cm were either equal to or lower than for 7.5 cm depth (Table 5.2).
Discussion
Water Uptake Following Periods of Drought
Surface soils dry more rapidly and to a greater extent than do deeper layers during
prolonged drought as a result of direct soil evaporation combined with high root density
(Sala et al. 1992, Soon 1988). Grasses concentrate their roots in the upper part of the soil
profile (Weaver 1958, Sims et al. 1978) and as expected there was reduced water uptake
rate for the first re-wet for all three communities when compared with the subsequent re-
wet sequences that followed shorter periods between water addition. This agrees with
previous work that included different species, plant forms and stages of development
(Wraith and Baker 1991, BassiriRad and Caldwell 1992, Wraith et al. 1995). Sala et al.
(1982) suggested that the extent of this after-effect of drought may depend on the
duration and magnitude of the drought.
A lower rate of water absorption immediately after a dry-down period than would
be observed during well-watered periods may be caused by a variety of factors including
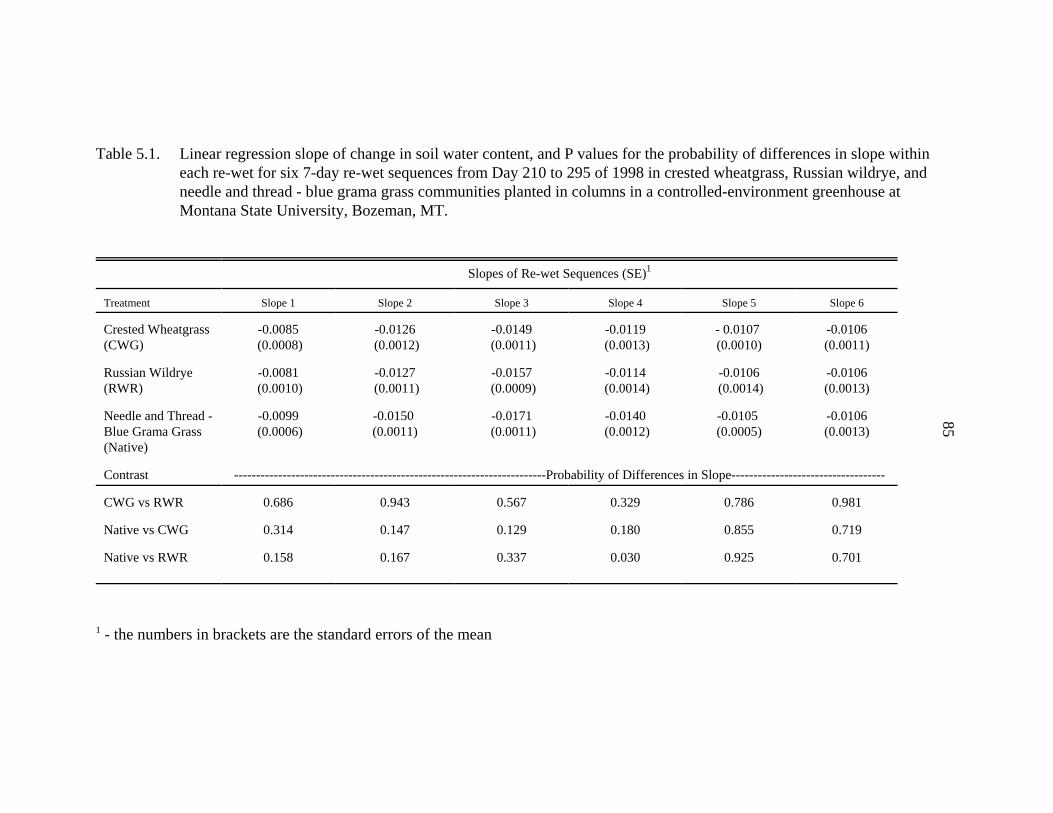
85
Table 5.1. Linear regression slope of change in soil water content, and P values for the probability of differences in slope withineach re-wet for six 7-day re-wet sequences from Day 210 to 295 of 1998 in crested wheatgrass, Russian wildrye, andneedle and thread - blue grama grass communities planted in columns in a controlled-environment greenhouse atMontana State University, Bozeman, MT.
Slopes of Re-wet Sequences (SE)1
Treatment Slope 1 Slope 2 Slope 3 Slope 4 Slope 5 Slope 6
Crested Wheatgrass(CWG)
-0.0085 (0.0008)
-0.0126 (0.0012)
-0.0149 (0.0011)
-0.0119 (0.0013)
- 0.0107 (0.0010)
-0.0106(0.0011)
Russian Wildrye(RWR)
-0.0081 (0.0010)
-0.0127 (0.0011)
-0.0157 (0.0009)
-0.0114 (0.0014)
-0.0106 (0.0014)
-0.0106(0.0013)
Needle and Thread -Blue Grama Grass(Native)
-0.0099 (0.0006)
-0.0150 (0.0011)
-0.0171 (0.0011)
-0.0140 (0.0012)
-0.0105 (0.0005)
-0.0106(0.0013)
Contrast -----------------------------------------------------------------------Probability of Differences in Slope-----------------------------------
CWG vs RWR 0.686 0.943 0.567 0.329 0.786 0.981
Native vs CWG 0.314 0.147 0.129 0.180 0.855 0.719
Native vs RWR 0.158 0.167 0.337 0.030 0.925 0.701
1 - the numbers in brackets are the standard errors of the mean
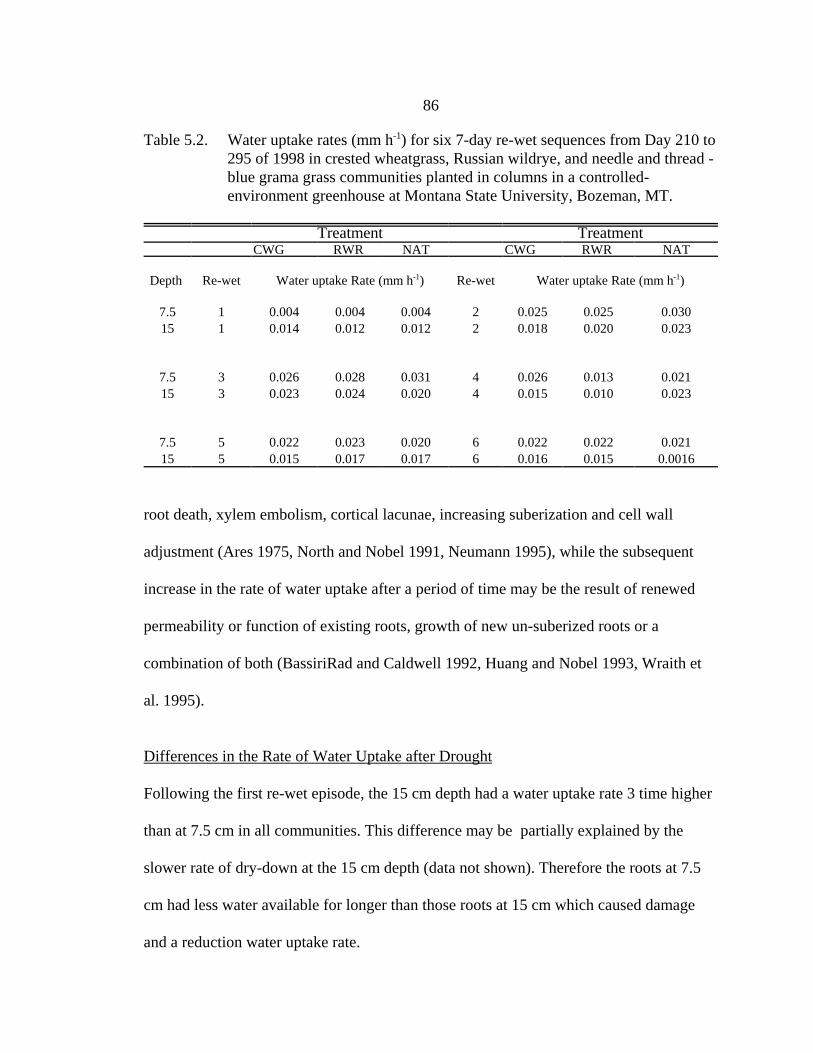
86
Table 5.2. Water uptake rates (mm h-1) for six 7-day re-wet sequences from Day 210 to295 of 1998 in crested wheatgrass, Russian wildrye, and needle and thread -blue grama grass communities planted in columns in a controlled-environment greenhouse at Montana State University, Bozeman, MT.
Treatment TreatmentCWG RWR NAT CWG RWR NAT
Depth Re-wet Water uptake Rate (mm h-1) Re-wet Water uptake Rate (mm h-1)
7.5 1 0.004 0.004 0.004 2 0.025 0.025 0.03015 1 0.014 0.012 0.012 2 0.018 0.020 0.023
7.5 3 0.026 0.028 0.031 4 0.026 0.013 0.02115 3 0.023 0.024 0.020 4 0.015 0.010 0.023
7.5 5 0.022 0.023 0.020 6 0.022 0.022 0.02115 5 0.015 0.017 0.017 6 0.016 0.015 0.0016
root death, xylem embolism, cortical lacunae, increasing suberization and cell wall
adjustment (Ares 1975, North and Nobel 1991, Neumann 1995), while the subsequent
increase in the rate of water uptake after a period of time may be the result of renewed
permeability or function of existing roots, growth of new un-suberized roots or a
combination of both (BassiriRad and Caldwell 1992, Huang and Nobel 1993, Wraith et
al. 1995).
Differences in the Rate of Water Uptake after Drought
Following the first re-wet episode, the 15 cm depth had a water uptake rate 3 time higher
than at 7.5 cm in all communities. This difference may be partially explained by the
slower rate of dry-down at the 15 cm depth (data not shown). Therefore the roots at 7.5
cm had less water available for longer than those roots at 15 cm which caused damage
and a reduction water uptake rate.

87
Differences in expected root distribution between the three grass communities
were anticipated to create differences in near-surface water uptake. A majority of the root
system of the needle and thread - blue grama grass community occurs in the upper 15 cm
due to the prevalence of blue grama grass, while more of the root systems of crested
wheatgrass and Russian wildrye are found at greater depths (Coupland and Johnson
1965, Weaver 1958, Smoliak et al. 1972). Crested wheatgrass has a coarser, deeper root
system with a lower mass of roots in a given soil volume than the needle and thread -
blue grama grass community, while Russian wildrye is similar to crested wheatgrass but
having a greater horizontal spread (Weaver 1958, Smoliak and Johnston 1980, Dormaar
and Sauerbeck 1983, Smoliak and Dormaar 1985). However, in this study, there were no
differences in the rate of water uptake between communities at the two shallow soil
depths studied.
Arid and semiarid plants are adapted to drought through a variety of
physiological, morphological, phenological and life history strategies (Chesson et al.
2004, Schwinning et al. 2005a). The ability of blue grama grass to rapidly increase water
uptake by surviving roots, and development of new extensive fine root systems allows
absorption of water made available by short intense convection storms following drought
(Briske and Wilson 1977, Coyne and Bradford 1985, Johnson and Aguirre 1991). In
crested wheatgrass, potential water stress later in the season is often avoided through
early growth and development followed by senescence, and by hydraulic lift of deeper
sources of soil water and subsequent efflux into surface layers, thus reducing water stress
and root senescence near the soil surface (Caldwell et al. 1998, Hassanyar and Wilson

88
1978, Bittman and Simpson 1987, Bittman and Simpson 1989, Frank and Bauer 1991).
Summary and Conclusions
Crested wheatgrass and Russian wildrye monocultures resist invasion by other
species and have become a permanent part of North American grasslands with frequent
summer drought periods punctuated by short intense convection storms. This suggests
that these agronomic communities may possess adaptations that allow them to quickly
capitalize on water when it becomes available after a dry period. The study was
completed in a controlled environment greenhouse where crested wheatgrass, Russian
wildrye and Stipa-Bouteloua communities were established in large soil columns. Six
dry-down-then-rewetting sequences were initiated and soil water uptake rates were
determined by recording changes in soil water content hourly.
Although a previous study found differences in the rate of water uptake within
different genotypes of barley, the results of this study did not indicate any differences
between the agronomic monocultures and native mixed prairie grassland communities.
This lack of difference indicates that crested wheatgrass, Russian wildrye and native
communities are all well adapted to the semi-arid conditions and quickly absorb water
when it becomes available. Once established, crested wheatgrass and Russian wildrye
monocultures are able to compete as effectively for moisture as native communities
following intense convection storms, reducing colonization by other species and
maintaining a stable steady state community.

89
References Cited
Ares, J. 1975. Dynamics of the root system of blue grama. Journal of Range Management29(3): 208-213.
BassiriRad, H., and M.M. Caldwell. 1992. Temporal changes in root growth and 15Nuptake and water relations of two tussock grass species recovering from waterstress. Physiologia Plantarum 86:525-31.
Bittman, S., and G.M. Simpson. 1987. Soil water deficit effect on yield, leaf area, and netassimilation rate of three forage grasses: crested wheatgrass, smooth bromegrassand altai wildrye. American Society of Agronomy Journal 79:768-774.
Bittman, S., and G.M. Simpson. 1989. Drought effects on water relations of three culitvated grasses. Crop Science 29:992-999.
Briske, D.D., and A.M. Wilson.1977. Temperature effects on adventitious root development in blue grama seedlings. Journal of Range Management 30:276-280.
Caldwell, M., T. Dawson, and J. Richards. 1998. Hydraulic lift: consequences of water efflux from the roots of plants. Oecologia 113:151-161.
Chesson, P., R.L.E. Gebauer, S. Schwinning, N. Huntly, K. Wiegand, M.S.K. Ernest, A.Sher, A. Novoplansky, and J. Weltzin. 2004. Resource pulses, speciesinteractions, and viversity maintenance in arid and sem-arid environments.Oecologia 141: 236 -253.
Christian, J.M., and S.D. Wilson. 1999. Long-term ecosystem impacts of an introduced grass in the Northern Great Plains. Ecology 80(7):2397-2407.
Coupland, R.T. 1961. A reconsideration of grassland classification in the Northern Great Plains of North America. Journal of Ecology 49:135-167.
Coupland, R.T., and R.E. Johnson. 1965. Rooting characteristics of native grassland species in Saskatchewan. Journal of Ecology 53:475-507.
Coyne, P.I., and J.A. Bradford. 1985. Morphology and growth in seedlings of several C4 perennial grasses. Journal of Range Management 38:504-512.
Dormaar, J. F. 1978. Long-term changes associated with seed stands of crested wheatgrass in southeastern Alberta, Canada, p. 623-625. In: Proceedings of theFirst International Rangelands Congress. Denver, CO.
90
Dormaar, J.F., and D.R. Sauerbeck. 1983. Seasonal effects on photoassimilated carbon-14 in the roots system of blue grama and associated organic matter. Soil Biologyand Biochemistry 15:475-479.
Frank, A.B., and A. Bauer. 1991. Rooting activity and water use during vegetative development of crested wheatgrass and western wheatgrass. Agronomy Journal 83:906-910.
Grime, J. 1994. The role of plasticity in exploring environmental heterogeneity, p. 1-18. In: M. Caldwell and R. Pearcy (EDS.). Exploitaton of enviromentalheterogeneity by plants. San Diego, CA: Academic Press.
Hassanyar, A.S., and A.M. Wilson. 1978. Drought tolerance of seminal lateral root apicesin crested wheatgrass and Russian wildrye. Journal of Range Management31:254-258.
Hook, P., and W. Lauenroth. 1994. Root system response of a perennial bunchgrass to neighborhood-scale water heterogeneity. Functional Ecology 8:738-745.
Hooper, D., and P. Vitousek. 1998. Effects of plant composition on nutrient cycling. Ecological Monographs 68:121-149.
Huang, B., and P.S. Nobel. 1993. Hydraulic conductivity and anatomy along lateral rootsof cacti: changes with soil water status. New Phytologist 123:499-507.
Johnson, D.A., and L. Aguirre. 1991. Effect of water on morphological development in three range grasses: root branching patterns. Journal of Range Management44:355-360.
Moss, E.H. 1944. The prairie and associated vegetation of southwestern Alberta. Canadian Journal of Resources 25(C):209-227.
Neumann, P.M. 1995. The resistance of cell walls adjustment in plant resistance to waterdeficits. Crop Science 35(5) 125801267.
North, G.B. and P.S. Nobel. 1991. Changes in hydraulic conductivity and anatomycaused by drying and re-wetting roots of Agave desert (Agavaceae).
Noy-Meir, I. 1973. Desert ecosystems: environment and producers. Annual Review of Ecology and Systematics 4:25-52.
SAS Institute, Inc. 2005. SAS OnlineDoc® 9.1.3. Cary, NC: SAS Institute Inc.

91
Sala, O., and W. Lauenroth. 1982. Small rainfall events an ecological role in semiarid regions. Oecologia (Berlin) 53:301-304.
Sala, O.W., W.K. Lauenroth, W.J. Parton. 1982. Plant recovery following prolongeddrought in a shortgrass steppe. Agricultural Meteorology 27:49-58.
Sala, O.W.. Lauenroth, W.K. and W.J. Parton. 1992. Plant recovery following aprolonged drought in a short grass steppe. Ecology 73: 1175-1181.
Sheley, R., and L. Larson. 1995. Interference between cheatgrass and yellow star thistle seedlings. Journal of Range Management 47:470-474.
Sims, PL., Singh, J.A., and W.K. Lauenroth. 1978. The structure and function of tenwestern North American grasslands. Journal of Ecology 66:251–285.
Smoliak. S. 1956. Influence of climatic conditions on forage production of shortgrass rangeland. Journal of Range Management 9:89-91.
Smoliak S., and J.F. Dormaar. 1985. Productivity of Russian wildrye and crested wheatgrass and their effects on prairie soils. Journal of Range Management 38(5):403-405.
Smoliak, S., J.F. Dormaar, and A. Johnston. 1972. Long-term grazing effects on Stipa-Bouteloua prairie soils. Journal of Range Management 25(4):246-250.
Smoliak, S., and A. Johnston. 1980. Russian wildrye lengthens the grazing season. Rangelands 2(6):249-250.
Soon, W.K. 1988. Root distribution of and water uptake by field grown barley in a blacksoloed. Canadian Journal of Soil Science 68: 425-432.
Tilman, D., D. Walden, and J. Knows. 1996. Productivity and sustainability influencedby biodiversity. Nature (London) 379:718-720.
Topp, G.C., J.L. Davis and A.P. Annan. 1980. Electromagnetic determination of soil water content: measurements in coaxial transmission lines. Water Resource Research 16: 574-502
Weaver J. E. 1958. Summary and interpretation of underground development in natural grassland communities. Ecological Monographs 28(1):55-78.
Wraith, J.M. and J.M. Baker. 1991. High resolution measurement of root water uptakeusing automated time domain reflectometry. Soil Science Society of AmericaJournal 55: 928 - 932.

92
Wraith, J.M., Baker, J.M. and T.K. Blake 1995. Water Uptake resumption following soildrought: a comparison among for barley genotypes. Journal of ExperimentalBotany 46(288): 873-880.
Wraith, J.M., and C.K. Wright. 1998. Soil water and root growth. In Proceedings of the Colloquim on the Soil Environment and Root Growth. 94th ASHS Annual Conference. Hortscience 33(6):951-959.

93
CHAPTER 6
COMPARATIVE WATER USE EFFICIENCY OF SELECTED NATIVE AND AGRONOMIC GRASS COMMUNITIES
Introduction
Water is limiting in grasslands in the Northern Great Plains, and the relationship
between soil water availability, atmospheric evaporative demand, and internal water
status modifies vegetative resource allocation and frequently limits production (Odum
1968, Brown 1977, Whitehead 1995). A number of researchers contend that competition
is intense in these arid and semiarid environments, and the ability of a species to be a
successful competitor is a function of more efficient use of scarce resources such as water
(Tilman 1982, Tilman 1988, Goldberg 1990, Busch and Smith 1995, Davis et al. 1998, Li
1999, Tsialtas et al. 2001). Others contend that increased competition is a result of less
efficient use of resources resulting in increased uptake which leaves less for competing
species (Gordon et al. 1989, Davis et al. 1998, Gordon et al. 1999). Both of these
mechanisms could inhibit the re-establishment of native communities after a disturbance
(Blicker et al. 2003).
Since the early 1900s, over two million hectares of native grassland in Canada
and the United States have been seeded to Agropyron cristatum (L.) Gaertn. (crested
wheatgrass) and Psathyrostachs juncea (Fisch.) Nevski (Russian wildrye) (Woolford
1951, Smoliak and Dormaar 1985). Native plant species have had little success in

94
invading these planted stands, allowing their continued existence as monoculture
alternate stable states (Heinrichs and Bolton 1950, Lawrence and Heinrichs 1977,
Knowles and Kilcher 1983, Redente et al. 1989). The inability of western wheatgrass
species to re-colonize may be a function of differences in water use efficiency (WUE),
which varies among species and is affected by climatic factors and plant and soil
characteristics (Briggs and Schantz 1914, Miller 1938, De Wit 1958, Stone and Stone
1975, Taylor et al. 1983, Frank et al. 1996, Abbate et al. 2004).
Above ground water use efficiency (WUE) research has been focused primarily
on annual crops rather than perennial grass species (Frank and Bauer 1991). This study
was undertaken to examine above ground WUE of two introduced perennial forage
monocultures (crested wheatgrass and Russian wildrye) and a Mixed Prairie (Stipa-
Agropyron-Bouteloua) community in a test of the hypothesis that persistence of these
monocultures is related to higher above ground water use efficiencies than for the native
Mixed Prairie communities.
Materials and Methods
Site Description of Source Plant Material
In 1997, nine plugs (40 cm diameter x 15 cm depth) were randomly selected from
native Mixed Prairie (western wheat - blue grama grass), crested wheatgrass and Russian
wildrye communities at the Animal Diseases Research Institute (ADRI) site near
Lethbridge, in south-central Alberta, Canada (49o 43' N, 110o 57' W). Crested wheatgrass
and Russian wildrye monocultures had been established at the ADRI site in 1993. This

95
site has a long-term annual average precipitation of 402 mm, with 76.5% falling from
April to September (Smoliak et al. 1967, Ellert and Janzen 1999). Soils at this site are
Orthic Dark Brown Chernozems (Typic Haploborolls). The 27 plugs were randomly
transplanted into steel column lysimeters (40 cm diameter x 120 cm depth) under a
rainout shelter at the Agriculture and Agrifood Canada Research Centre, Lethbridge,
Alberta (49o 42' N, 112o 42'W). Each lysimeter had been filled with sandy loam surface
horizon soil to a depth of 105 cm, packed in 15 cm intervals to a bulk density of 1.26 g
cm-3.
Experimental Design
The soil volumetric water content (2) of the sandy loam soil at -15 and -0.03 Mpa
mature potentials was determined using a pressure plate apparatus at the Lethbridge
Research Center. These were: 2 (-1.5 MPa) = 0.07 m3m-3 and 2 (-0.03 MPa) =0.18 m3m-3.
Throughout 1997, the column lysimeters were kept near -0.03 MPa by daily watering to
facilitate the establishment of the communities. In 1998, two water content regimes were
initiated within each with 4 replicates, the first at 2 = 0.07 and the second at 2 = 0.14.
Between May and September of 1998 and 1999, the lysimeters were weighed at two to
three day intervals using a 450 kg CM Loadstar electric winch, a load cell (ML 200), and
a digital weight recorder (DF 2000, Messload Technologies). Water was then added to
each lysimeter to restore treatment 2.

96
At the end of both growing seasons, the above ground biomass within each
lysimeter was harvested at a height of 2.5 cm, dried at 60" C for 48 hours, and weighed.
In the fall of 1999, the top 15 cm of soil was harvested from each lysimeter, as were two
5-cm diameter soil cores spanning 15-90 cm depth. The roots and crowns were double
washed using a 2-mm screen above a 0.5- mm screen to remove soil, dried at 60" C, and
weighed.
Above ground water use efficiency calculated as the total shoot mass produced by
plants (g) per unit of water (kg) used (Kramer and Boyer 1995) was determined for each
plant community for each year. Analysis of variance was performed using the MIXED
procedure of SAS statistical software (SAS Institute, Inc. 1999). Means separation was
achieved using least significant differences (LSD) (Steel and Torrie 1980), with
significance established as P < 0.05.
Weather records including precipitation, temperature, relative humidity, wind
speed, and Class A pan evaporation were obtained for April to August in 1998 and 1999
from a meteorological station adjacent to the rain-out shelter. Long-term weather records
for the site were secured from Lethbridge Research Center Agriculture and Agrifood
Canada.
Results
Environmental Conditions
Between 1998 and 1999 the potential evapotranspiration (PET) from April to
August was different in both pattern and amount. The total 1998 PET was near the long-

97
term average, but the monthly pattern was different, with April and June being much
lower and July and August much higher than average (Table 6.1). In 1999, the PET
pattern was similar to the long-term average, but the total was 26% higher, with monthly
totals being between 1.1 and 1.3 times the long-term averages (Table 6.1). The mean
monthly air temperatures from April to August 1998 were higher than the mean and than
1999 values except in June (Table 6.1). The mean relative humidity was lower than 1998
and 1999 values (Table 6.1). 1998 wind speeds were lower than 1999 and long-term
values during all five months (Table 6.1). Overall, April to September 1999 was cooler
than 1998, but windspeed and Class A Pan evaporation were higher (Table 6.1).
Above Ground Water Use Efficiency
Above ground WUE was not affected by 2 or by year main effects for any of the
grass communities. However, aerial biomass and total water used were affected by both
2 and year (Table 6.2).
Above ground WUE was greater in 1998 than 1999 only in the native Mixed
Prairie (needle and thread - wheatgrass - blue grama grass) community. In both years,
crested wheatgrass had greater above ground WUE than Mixed Prairie and Russian
wildrye (Table 6.3). In 1998, the aerial biomass was greater than for 1999 in all
communities. In 1998, crested wheatgrass aerial biomass was greater than that of Russian
wildrye, whereas there were no differences between communities in 1999 (Table 6.3).
Total water used in 1998 was greater than in 1999 in crested wheatgrass. In 1999, the
native community used more water than did crested wheatgrass (Table 6.3).

98
Table 6.1. Long-term average, 1998, and 1999 mean monthly air temperature, relativehumidity, wind speed, precipitation and Class A Pan Evaporation over thegrowing season at the Lethbridge Research Centre rainout shelter insouthern Alberta.
Year April May June July Aug.
Air Temperature (oC)
1998 7.8 13.6 14.4 20.3 20.1
1999 6.1 10.3 14.6 16.4 18.8
Ave.1 5.6 10.8 14.9 18.0 17.1
Relative Humidity (%)
1998 53.9 47.8 62.1 56.8 42.5
1999 49.5 48.3 54.5 54.0 54.2
Ave.1 44.0 40.0 40.0 38.0 38.0
Wind Speed (km h -1)
1998 13.7 16.0 15.0 12.7 12.5
1999 17.6 18.4 17.0 16.4 13.5
Ave.1 20.3 19.0 17.6 15.2 14.6
Precipitation (mm)
1998 41.9 53.4 148.4 57.4 36.2
1999 41.5 58.3 65.1 64.2 39.3
Ave.1 31.0 55.0 74.0 42.0 42.0
Class A Pan Evaporation (mm)
1998 0.0 213.2 190.5 319.6 309.5
1999 181.3 249.4 264.4 305.7 264.6
Ave.1 121.3 190.6 237.6 228.4 199.7
1 Long term averages - Agriculture and Agrifood Canada.

99
Table 6.2. Table of fixed effects for dry weight, total water used and water use efficiencyfor the lysimeter study of needle and thread - western wheat - blue gramagrass, crested wheatgrass, and Russian wildrye communities in soils with two different water content treatments in 1998 and 1999.
Effect Aerial Biomass Total Water Use Water Use Efficiency
-----------------------------------------------------Probabilities-----------------------------------------------------
Species 0.506 0.141 <0.001
Treatment <0.001 <0.001 0.130
Year <0.001 <0.001 0.064
Species x Treatment 0.414 0.035 0.126
Species x Year 0.024 0.186 0.376
Treatment x Year 0.086 0.119 0.328
Species x Treatment x Year 0.720 0.414 0.221
Table 6.3. Mean dry matter production (g), total water use (kg) and water use efficiency (g kg-1) in native (needle and thread grass - western wheat - blue grama grass),crested wheatgrass, and Russian wildrye communities in 1998 and 1999.
Variable Aerial Biomass (g) Total Water Use (kg) Water Use Efficiency (g kg-1)
Year 1998 1999 1998 1999 1998 1999
Species -------------------------------------------------------------------Means------------------------------------------------------------------
Native (NAT) 72.2 44.1* 60.1 45.2* 1.2 0.9*
Crested Wheatgrass(CWG)
78.3 41.4* 57.0 32.0* 1.5 1.5
Russian Wildrye (RWR) 56.5 41.5* 51.3 43.2 1.1 1.0
Contrasts ---------------------------------------------------------------Probabilities---------------------------------------------------------------
NAT vs CWG 0.572 0.799 0.604 0.030 0.050 <0.001
NAT vs RWR 0.139 0.804 0.140 0.736 0.583 0.564
CWG vs RWR 0.049 0.993 0.335 0.075 0.015 0.002
* Significant difference in treatment between years (P < 0.05).

100
Crown and Root Mass
There were higher root masses in the upper 15 cm of soil for crested wheatgrass
and native communities at 2 = 0.07 than at 2 = 0.14 (Table 6.4). Russian wildrye root
masses from 0 to 15 and 15 to 45 cm soil depths were greater than for the native
community at 2 = 0.07, but at 2 = 0.14 both Russian wildrye and native communities had
smaller root masses than crested wheatgrass (Table 6.4). There were no differences in 45-
90 cm depth and total root mass between soil water contents within communities.
Russian wildrye had a larger total root mass than the native community at 2 = 0.07m3 m-
3, while crested wheatgrass had larger total root mass than the native community at 2 =
0.14m3m-3 (Table 6.4).
Table 6.4. Total root mass and root mass for 0-15 cm, 0-45 cm, and 45-90 cm depths in native (needle and thread grass - wheatgrass - blue grama grass), crested wheatgrass, and Russian wildrye communities grown in a rain-out shelter under two soil moisture regimes at Lethbridge, Alberta, Canada in 1999.
0 - 15 cmDepth
0 - 45 cmSoil Water Content
45 - 90 cm Total (g)
0.07 0.14 0.07 0.14 0.07 0.14 0.07 0.14
Community ------------------------------------------------------------------Mean Root Mass (g) --------------------------------------------
Crested Wheatgrass (CWG) 163.7 216.7* 438.1 520.8 298.2 302.0 736.3 822.8
Native (NAT) 122.3 179.2* 323.0 365.2 260.3 262.0 583.4 627.2
Russian Wildrye (RWR) 174.7 146.6 449.9 419.4 358.1 345.3 807.9 764.7
Contrasts --------------------------------------------------------------Probabilities--------------------------------------------------------------
CWG vs NAT 0.102 0.117 0.038 0.007 0.554 0.533 0.130 0.057
RWR vs NAT 0.042 0.147 0.024 0.281 0.137 0.179 0.031 0.150
CWG vs RWR 0.653 0.008 0.821 0.052 0.353 0.477 0.293 0.533* There is a probability <0.05 between treatments.
The mass of root crowns were larger in Russian wildrye at 2 = 0.14 m3 m-3 than at
2= 0.07 m3 m-3, while differences in soil water content had no effect on the crown mass

101
of crested wheatgrass and native Mixed Prairie (Table 6.5). For 2 = 0.07, both crested
wheatgrass and Russian wildrye had larger crown masses than the native community,
while Russian wildrye had a larger crown mass than the other communities at 2 = 0.14
(Table 6.5).
Table 6.5. Mass of crowns at two different soil water contents (2) in crested wheatgrass,Russian wildrye and native Mixed Prairie (needle and thread grass - westernwheat - blue grama grass) grown in a rain-out shelter at the LethbridgeResearch Centre, Lethbridge, Alberta, Canada in 1998-1999.
Crowns (g m -2 ) (SE)1
2 = 0.07 2 = 0.14
Crested Wheatgrass (CWG) 122.0 (6.7) 109.0 (18.8)
Stipa-Agropyron-Bouteloua (NAT) 62.2 (11.5) 91.3 (14.2)
Russian Wildrye (RWR) 148.3 (1.5) 203.1( 14.4)*
Contrasts ------------------Probabilities ------------------
CWG vs NAT 0.005 0.338
RWR vs NAT <0.001 <0.001
CWG vs RWR 0.182 <0.001
* There is a significant difference (P < 0.05) between different soil water contents 1 The means are followed by the standard error of the mean in brackets
Discussion
The Effect of Water Content on Roots, Crownsand Above Ground Water Use Efficiency
In semi-arid northern grassland communities, most native plants possess
adaptations to water stress, such as phenological modifications, stomatal control,
morphological modifications, root systems that are able to respond to physiological
demands, alternate photosynthetic pathways, osmotic adjustments and dehydration

102
tolerance mechanisms (Brown 1995). In these native communities, partitioning of limited
environmental resources by potentially competing organisms as a result of structural or
functional differences allows coexistence of species and creates long-term stability
(Whittaker 1969, Whittaker et al. 1973).
The two soil water content treatments used did not result in differences in water
use efficiency within the perennial grass communities studied. Previous work with C3
species has shown reductions (Heitholt 1989), increases (Johnson et al. 1990), and lack of
differences (Johnson and Bassett 1991, Xue et al. 2003, Zhang et al. 1998) in above
ground WUE in response to differences in soil water content. Although C4 species such
as Bouteloua gracilis (Wild. ex Kunth) Lag ex Griffiths (blue grama) and Artemisia
frigida Willd. (pasture sagewort) have higher inherent above ground WUE than C3
grasses (Akhter et al. 2003), their small contribution to the aerial biomass of the native
community at ADRI as determined by Willms et al. (1993), would presumably have had
little effect on above ground WUE.
The three grass communities had different root system responses in relation to the
two soil water content treatments. Although there was no overall difference in total root
mass between 2 = 0.07 and 2 = 0.14 in any of the communities, crested wheatgrass and
native communities had smaller root masses between 0-15 cm depths at 2 = 0.07,
whereas there was no difference in Russian wildrye, indicating that near-surface root
mass of crested wheatgrass and native Mixed Prairie communities were negatively
impacted by low season-long soil water content whereas the increased surface root mass
of Russian wildrye may be an adaptation to those conditions. Crested wheatgrass and

103
Russian wildrye were able to maintain crown mass at the lower soil water content.
Carbohydrates may be translocated to the crown for storage to facilitate osmotic
adjustment (Chaves 1991, Frank and Bauer 1991), thus preventing crown senescence and
providing materials for regrowth of roots when conditions become more favourable.
Above Ground WUE
Crested wheatgrass demonstrated a higher above ground WUE than Russian
wildrye or native Mixed Prairie communities due to utilization of less water rather than
production of greater standing crop. Above ground WUE values reported in the present
study are at the lower limit of the ranges (1 to 3 g kg-1) reported by Kramer and Boyer
(1995) and Blicker et al. (2003). There are a number of explanations that may account for
the lower values observed in this study. First, most of the previous studies were
conducted in Utah and the more northerly location of this study may have constrained
aerial production due to lower light intensity, air and soil temperatures. Secondly, most of
the previous studies considered annual agronomic species selected for high above ground
production. Finally, the reduction of fallen and standing litter with harvest may have
increased evapotranspiration (Willms, 1988, Willms 1993).
Crested wheatgrass, a cool season bunchgrass, has greater root mass in the upper
45 cm, which may result in rapid uptake of water from this layer early in the growing
season when temperatures, potential evaporation, and water vapour pressures are lower
than they are later in the season. This results in early development of aerial biomass and
higher above ground WUE (Smika et al. 1965, Bittman 1985, Frank et al. 1996). Later in
the season (July and August), when soil water availability is lower and evaporative

104
demand is higher, leaf rolling and dormancy reduce transpiration losses by this grass
(Bittman and Simpson 1989).
Higher water use efficiency does not necessarily confer high drought resistance
(Johnson and Bassett 1991), but in these perennial grasses this characteristic in concert
with higher soil nitrate concentration immediately after cultivation (Porter, Chapter 4)
may allow establishment and maintenance of these monoculture communities. The
efficient use of water may limit the germination of native grass seeds that are not
numerous in the seed back and have very narrow germinations requirements (Lauenroth
et al. 1994, Coffin et al. 1996, Heidinga and Wilson 2002).
Summary and Conclusions
Crested wheatgrass demonstrated a higher WUE than either Russian wildrye or
native Mixed Prairie communities by utilizing less water to produce a similar quantity of
above ground biomass. WUE values reported in the study are at the lower limit of the
ranges reprted by others. This field research was conducted in southern Alberta, Canada
where lower growing season light intensity, air and soil temperatures in addition to high
winds may have constrained production. In addition, harvesting at the end of each
growing season reduced soil surface litter and may have increased evaporation.
Although above ground biomass was not different between these communities,
there were differences in quantity of crown and root mass at the lower soil water content.
Russian wildrye had a larger total root mass than the native grassland community which
was due to a greater root mass near the soil surface. This suggests that Russian wildrye is

105
able to more effectively explore surface layers for water when it is less available. Both
agronomic species maintained larger crown masses when soil water content was lower.
During that period nutrients may be translocated to the crown to allow faster regrowth of
roots when moisture levels are more favourable. However the root mass in crested
wheatgrass was not larger than the native community, suggesting greater growth of root
mass when soil water content is higher.
These two introduced grass communities seem to have different methods of
adapting to semi-arid conditions. The higher WUE coupled with the larger crown mass of
crested wheatgrass may allow rapid root and shoot growth in the spring, and Russian
wildrye may better utilize moisture near the soil surface throughout the growing season.
In addition to these adaptations, rapid utilization of nitrate released in cultivation and
higher water use efficiencies may sustain these monocultures. Although native species
may have some of the same adaptations, lower water use efficiencies, low soil nitrate
after cultivation and the absence of a high concentration of viable seeds in the seed-bed
of these monocultures, may limit re-colonization.

106
References Cited
Abbate, P., J. Dardanelli, M. Cantarero, M. Muturano, R. Melchiori, and E. Suerro. 2004.Climatic and water availability effects on water use efficiency. Crop Science44:474-483.
Akhter, J., K. Mahmood, M.A. Tasneem, M.H. Naqvi, and K.A. Malik. 2003.Comparative water-use efficiency of Sporobolus arabicus and Leptochloa fuscaand its relation with carbon-isotope discrimination under semi-arid conditions.Plant and Soil 249(2):263-269.
Bittman, S. 1985. Physiological and agronomic responses to drought of three foragegrasses: Crested wheatgrass, smooth bromegrass and Altai wildrye. Ph.D.dissertation, Saskatoon, SK: University of Saskatchewan.
Bittman, S., and G.M. Simpson. 1989. Drought effects on three cultivated grasses. CropScience 29:992-999.
Black, C.C. 1971. Ecological implications of dividing plants into groups with distinctphotosynthetic production capacities. Advances in Ecological Research 7:87-144.
Blicker, P.S., B.E. Olsen, and J.M. Wraith. 2003. Water use and water-use efficiency ofthe invasive Centaurea maculosa and three native grasses. Plant and Soil 254(2):371-381.
Briggs, L.J., and H.L. Schantz. 1914. Relative water requirements of plants. Journal ofAgronomic Research 3:1-63.
Brown, R.W. 1977. Water relations of range plants. In: R.E Sosabee (ED.). RangleandPlant Physiology. Society of Range Managenent. Range Science Series 4. p. 97-140.
Brown, R.W. 1995. The water relations in range plants: adaptations to water deficits. In:D.J. Bedunah and R.E. Sosabee (EDS.). Wildland plants: physiological ecologyand developmental morphology. Denver, CO: Society for Range Management. p.291-413.
Busch, D.E., and S.D. Smith. 1995. Mechanisms associated with decline of weedyspecies in riparian ecosystems of the southwestern United States. EcologicalMonographs 65:327-370.
Caldwell. M, T.E. Dawson, and J.H. Richards. 1998. Hydraulic lift: consequences ofwater efflux from the roots of plants. Oecologia 113:151-161.
107
Claussen, W. 2002. Growth, water-use efficiency and proline concentration ofhydroponically grown plants as affected by nitrogen source and nutrientconcentration. Plant and Soil 27(2):199-209.
Coffin, D.P., Lauenroth, W.K. and I.C. Burke. 1996. Recovery of vegetation in asemiarid grassland. 53 years after disturbance Ecological Applications. 6:538-555.
Davis, M.A., K.J. Wrage, and P.B. Reich. 1998. Competition between tree seedlings andherbaceous vegetation: support for a theory of resource supply and demand.Journal of Ecology 86: 652-661.
De Wit, C.T. 1958. Transpiration and crop yields. In: Institute of biological and chemicalresearch on field crops and herbage. Wageningen, Verlagen, The Netherlands:Landbouwekundige Onderzoekingen, 64(6):1-88.
Ellert, B.H., and H.H. Janzen. 1999. Short-term influence of tillage on CO2 fluxes from asemiarid soil on the Canadian prairies. Soil and Tillage Research 50:21-32.
Frank, A., and A. Bauer. 1991. Rooting activity and water use during the vegetativedevelopment of crested and western wheatgrass. Agronomy Journal 83:906-910.
Frank A.B., S. Bittman, and D. Johnson. 1996. Water relations of cool season grasses. InL.E. Moser, D.R. Buxton, and M.D. Custer (EDS.). Cool season grasses.Madison, WI: American Society of Agronomy..
Goldberg, D.E. 1990. Components of resource competition in plant communities, In: J.BGrace and D. Tilman (EDS.). Perspectives on Plant Competition. San Diego, CA:Academic Press. p. 27-49.
Gordon, C., S.I. Woodin, C.E. Mullins, and I.J. Alexander. 1999. Effects ofenvironmental change, including drought, on water use by competing Callunavulgaris (heather) and Pteridium aquatilinum (brachen). Functional Ecology13(S1):96-106.
Gordon, D.R., J.M. Welker, J.W. Menke, and K.J. Rice. 1989. Competition for soil waterbetween annual plants and blue oak (Quercus douglasii) seedlings. Oecologia 79:533-541.
Heidinga, L.and S. Wilson. 2002. The impact of invading alien grass (Agropyroncristatum) on species turnover in native prairie. Diversity and Distributions. 8:249-258.

108
Heinrichs, D.H., and J.L. Bolton. 1950. Studies on the competition of crested wheatgrasswith perennial native species. Scientific Agriculture 30:428-443.
Heitholt, J.J. 1989. Water-use efficiency and dry matter in nitrogen and water-stressedwinter wheat. Agronomy Journal 81:464:469.
Johnson, D.A., K.H. Asay, L.L. Tieszen, J.R. Ehleringer, and P.G. Jefferson. 1990.Carbon isotope discrimination potential in screening cool season grasses for waterlimited environments. Crop Science 30:338-343.
Johnson, R.C., and L.M. Bassett. 1991. Carbon isotope discrimination and water useefficiency in four cool season grasses. Crop Science 31:157-162.
Knowles, R.P., and M.R. Kilcher. 1983. Crested wheatgrass. Agriculture CanadaContribution 1983-18E.
Kramer, P.J., and J.S. Boyer. 1995. Water relations and plants. New York, NY:Academic Press.
Lauenroth, W.K., Sala, O.E., Coffin, D.P. and T.B. Kirchner. 1994.The importance ofsoil water in the recruitment of Bouteloua gracilis in the shortgrass steppe.Ecological Applications. 4:741-749.
Lawrence, T., and D.H. Heinrichs. 1977. Growing Russian wildrye in western Canada.Canadian Department of Agriculture Publication 10M-1:77.
Li, C. 1999. Carbon isotope composition, water use efficiency and biomass productivityof Eucalyptus microtheca populations under different water supplies. Plant andSoil 214: 165-171.
Miller, E.C. 1938. Plant physiology. New York, NY: McGraw-Hill.
Odum, H.T. 1968. Work circuits and systems stress. In: H.H. Young (ED.). Primaryproductivity and mineral cycling in natural ecosystems. Orono, ME: University ofMaine Press. p. 81-138.
Redente, E.F., M.E. Biondini, and J.C. Moore. 1989. Observations on biomass dynamicsof a crested wheatgrass and native shortgrass ecosystem in southern Wyoming.Journal of Range Management 42(2)113-118.
Redmann, R.E. 1976. Plant-water relationships in a mixed grassland. Oecologia. 23:283-295.

109
SAS Institute, Inc. 1999. SAS/STAT User Guide. Version 8. Cary, NC: SAS InstituteInc. 3884 p.
Smika, D.E, H.J. Haas, and J.F. Power. 1965. Effects of moisture and nitrogen fertilizer on spring, regrowth and water use by native grass. Agronomy Journal 57:483-486.
Smoliak, S., and J.F. Dormaar. 1985. Productivity of Russian wildrye and crested wheatgrass and their effect on prairie soil. Journal of Range Management 38:403-405.
Smoliak, S., A. Johnston, and L.E. Lutwick. 1967. Productivity and durability of crestedwheatgrass in southeastern Alberta. Canadian Journal of Plant Science 47:539-547.
Steel, R.G.D., and J.H. Torrie. 1980. Principles and procedures of statistics: a biometricalapproach. New York, NY: McGraw Hill Book Company.
Stone, J.E., and E.L. Stone 1975. Water conduction in lateral roots of red pine. For:Science 21:53-60.
Taylor, H.M., W.R. Jordan, and T.R. Sinclair. 1983. Limitations to efficient water use incrop production. Madison, WI: American Society of Agronomy.
Tilman, D. 1982. Resource Competition and Community Structure. Princeton, NJ:Princeton University Press.
Tilman, D. 1988. Plant strategies and the dynamics and structure of plant communities.Princeton, NJ: Princeton University Press.
Tsialtas, J,T., L.L. Handley, M.T. Kassioumi, D.S. Veresogiou, and A.A. Gagne. 2001.Interspecific variation in water-use efficiency and its relation to plant speciesabundance in water limited grassland. Functional Ecology 15(5):605-615.
Weaver, J.E. 1958. Summary and interpretation of underground development in naturalgrassland communities. Ecological Monographs 28(1):55-78.
Whittaker, R.H. 1969. Evolution of diversity in plant communities. BrookhavenSymposia. Biology 22:178-195.
Whittaker, R.H., S.I. Levin, and R. Root. 1973. Niche, habitat and ecotype. AmericanNaturalist 107:321-338.

110
Whitehead, D.C. 1995. Grassland nitrogen. Wallingford, United Kingdom: CABInternational. 396 p.
Willms. 1988. Response of rough Fescue (Festuca scabrella) to light, water, temperatureand litter removal under controlled conditions. Canadian Journal of Botany66:429-434.
Willms, W.D., S.M. McGinn, and J.F. Dormaar. 1993. Influence of litter on herbageproduction in the Mixed Prairie. Journal of Range Management 46:320-324.
Woolford, E.J. 1951. Crested wheatgrass grazing values. Missoula, MT: U.S. ForestService Res. Note 91.
Xue Q., Z. Zhu, J.T. Musick, B.A. Stewart, and D.A. Dusek. 2003. Root growth andwater uptake in winter wheat under deficit irrigation. Plant and Soil 257(1):151-161.
Zhang, H., Oweis, T.Y., S. Garabet, and M. Pala. 1998. Water-use efficiency andtranspiration efficiency of wheat under rain-fed conditions and supplementalirrigation in a Mediterranean type environment. Plant and Soil 201(2):295-305.

111
CHAPTER 7
SUMMARY
This project was initiated to investigate changes in nitrogen partitioning and water
dynamics in the first four years after plowing and seeding native grasslands in the
northen Great Plains of southern Alberta, Canada to annual and perennial agronomic
species. The objectives of this research were to evaluate 1) short-term changes in soil N
partitioning created by cultivating and seeding native grasslands with selected annual
(wheat) and perennial (crested wheatgrass and Russian wildrye) monocultures; 2)
changes in partitioning of N within the biomass of these selected species; 3) difference in
the rate of water uptake between Mixed Prairie grasslands, crested wheatgrass and
Russian wildrye after a dry-down period; and 4) differences in above ground water use
efficiency, root and crown masses between Mixed Prairie grasslands, crested wheatgrass
and Russian wildrye under two soil water content levels.
The research for Objectives 1 and 2 relating to short-term changes in soil and
plant N in annual and perennial monocultures was conducted in 1995 and 1997 at three
locations in the northern Great Plains (Onefour, Lethbridge and Stavely, Alberta) with
different soils, climate and native plant communities. Objective 3 relating to rates of
water uptake after a dry-down period by native needle and thread - blue grama grass,
crested wheatgrass and Russian wildrye communities was evaluated in 1998, using
horizontal TDR probes placed at three depths in columns at a controlled environment

112
greenhouse at Montana State University. The fourth study relating to the determination
of above ground water use efficiency, root and crown masses under two soil water
contents was conducted in 1998 and 1999, using weighing column lysimeters under a
rain-out shelter at the Lethbridge Research Centre in Lethbridge, Alberta, Canada. The
column lysimeters contained crested wheatgrass, Russian wildrye and the native Mixed
Prairie (needle and thread-native wheatgrass - blue grama grass) communities. Two
different water contents were imposed on the communities and total water used during
the growing season was recorded for each year of the study. Shoot mass was harvested at
the end of each growing season and root and crown mass was harvested at the end of the
study. Above ground WUE was calculated for the two growing seasons.
N sequestered as biomass, soil N, LF and LFN in native grassland communities
increased with increases in long-term annual precipitation. A large proportion of biomass
N was sequestered by root mass in the perennial monocultures and native grasslands. All
of the native grassland systems studied were dominated by ammonium N sources rather
than nitrate.
In the short-term, cultivation and seeding of native grasslands had no effect on
total soil N, due to a large reservoir of N in soil organic matter. However, these activities
reduced the light fraction and light fraction N in the soil. This was presumably caused by
increased mineralization which produced an increase in the concentration of nitrate
(NO3-) in the soil. After 4 years, losses in the light fraction N in soil under wheat
treatments were greater than 60%, with the largest losses occurring at the site with the
highest long-term annual precipitation. Soil nitrate under wheat remained higher than

113
observed in either perennial monocultures or native grasslands. Losses in the light
fraction and light fraction N were not as great under perennial agronomic monocultures,
but the LF and LFN were smaller in these perennials than in native communities.
Larger losses in light fraction (LF) and LFN under wheat than perennial
monocultures, in the short-term, is a function of the frequency of cultivation and
differences in the size of the root masses. Losses in LF and LFN of annual and perennial
monocultures will continue until new equilibria are established with the reduction being
more rapid with above average precipitation. The new equilibrium under wheat will be
dependent on cropping system but in any case losses will be greater under perennial grass
monocultures.
Annual agronomic monocultures sequester less N into biomass than either native
or cultivated perennial communities, even with increased nitrate available for absorption.
This is likely due to their inability to accommodate N above basic requirements for
growth. Due this inability, some of the increased soil nitrate available due to accelerated
mineralization will be lost through a combination of volatilization, leaching and runoff.
Most of N absorbed is assimilated in leaves, translocated to the seed heads and removed
during harvest. The rate and quantity of losses in soil nitrate under annual monocultures
will be a function of both climate and the variability of soil moisture and temperature
regimes during the growing season. Generally, the warmer and wetter the growing
season, the more rapid the loss.

114
The lower reduction in LF and LF N under perennial monocultures compared to
wheat was likely a product of both higher root mass and only a single cultivation in the
case of the perennials. However, soil nitrate levels were not elevated as was observed in
wheat. The single pulse of nitrate resulting from the single cultivation event and the
perennial bunchgrass form of these species may have facilitated greater absorption of N
and lower soil nitrate concentrations. Orchardgrass in 1995 was an exception to this
pattern, and the difference may have been a result of root death caused by drought the
two previous years.
Although perennial monocultures have been selected for increased aerial
production, in this study only crested wheatgrass and smooth brome grass had
significantly higher shoot masses than native communities. However, lower shoot mass N
concentration in these species resulted in lower total N in shoot mass than native
communities, except with crested wheatgrass at the Stipa-Bouteloua site in 1995. This
was likely a result of a combination of a more recent establishment date and increased
current growing season precipitation. Therefore, although the establishment of perennials
limits the frequency of cultivation, species like crested wheat grass and Russian wildrye
with lower R:S and lower N concentration in root mass will create larger N losses from
the system through harvest. During periods of high current growing season precipitation
the concentration of N in shoot mass was higher in crested wheatgrass and smooth
bromegrass suggesting that during moist years, harvesting of crested wheatgrass and
bromegrass will further increase N losses from the system.

115
In the short-term, cultivation and seeding of native grasslands to annual and
perennial monocultures changes N partitioning in the plant-soil complex. The magnitude
of the change rather the ranking of the change within treatments is determined by
differences in long-term and current precipitation. Perennial monocultures maintained
light fraction N better than annual monocultures. However, it is likely that management
practices will modify the magnitude of the differences between annual and perennial
monocultures. Differences will be smaller with no-till continuous cropping systems in
annuals versus over-harvested or grazed perennial forages.
Differences in root distribution between native communities and agronomic
monocultures were expected to create differences in the rate of water uptake after a period
of soil water depletion. However, after artificially imposed periods of water stress, there
were no differences in the rate of water uptake between Stipa-Bouteloua, crested
wheatgrass, and Russian wildrye. This suggests that these two introduced species which
evolved in ecosystems with similar quantities and variability in water supply are as well
adapted to rapid absorption of water as the native communities. This characteristic is
likely important in maintaining these introduced monocultures as alternate steady state
communities.
Crested wheatgrass possessed a higher water use efficiency than either Russian
wildrye or native (Stipa-Agropyron-Bouteloua) communities due to the utilization of less
water rather than greater production of aerial biomass. The values obtained in this
research were near the lower limit of the ranges reported by other researchers. The
differences reported here may be partially due to the fact that this study was conducted

116
further north, commensurate with lower light intensities and lower air and soil
temperatures, which may have constrained production. In addition, these perennial species
partition more nutrients to crowns and roots therefore reducing above ground WUE.
This research adds to our understanding of the roles that water and nitrogen may
play in the maintenance of alternate steady state communities that are produced after
disturbances such as cultivation. The interrelationship between water and a single pulse
of soil nitrate created by a disturbance such as cultivation may allow crested wheatgrass
and Russian wildrye to absorb and assimilate the excess mineral N. Later in the year
when water is not as available, the N in shoot mass will be translocated out of leaves and
stems and into seed heads, crown and roots. The N translocated into the crown and roots
may allow more rapid re-growth and allow preemption of soil water and N before other
possible colonizing species. This may be one of the reasons that these monocultures
survive over the long term.
Since large volumes of water are used by these monocultures to produce a large
standing crop early in the growing season, it is expected that heavy removal of leaves
through grazing or other means early in the season when the crowns are just beginning to
produce new tillers, and continuing removal over the length of the growing season, will
over time damage roots and crowns. This may provide a window of opportunity for
colonization by other species with highly viable seeds, capable of rapid germination and
establishment, and with high water use efficiencies. But if not properly managed, many
may not be native nor desirable. It may require substantial time and effort to re-establish
multispecies native communities within these monocultures. These activities may include

117
extensive leaf removal, herbicide, water and fertilizer application, and the provision of
highly viable seed.

118
APPENDICES

119
APPENDIX A
NITROGEN PARTITIONING TABLES IN CHAPTER 3

120
Table 3.1. Monthly growing season precipitation (mm) and temperatures (ºC) from 1995 to 1997 at three southern Alberta sites.
Mean Monthly Temperatures (ºC)
Year March April May June July Aug. Sept. Total %1
Stipa-Bouteloua
1995 -1.200 3.600 10.800 15.800 18.000 17.600 13.000 11.100 97.900
1997 -1.500 3.600 11.400 16.600 19.300 19.600 15.700 12.100 106.800
Ave. 2 -2.900 5.200 11.400 15.600 19.600 18.800 12.200 11.300 100.000
Stipa-Agropyron-Bouteloua
1995 -0.300 4.300 10.100 14.600 17.300 15.800 12.500 10.600 96.300
1997 0.700 3.900 11.300 16.000 18.200 18.600 15.900 12.100 109.700
Ave. 2 -1.500 5.600 10.800 14.900 18.000 17.100 12.200 11.000 100.000
Festuca-Danthonia3
1995 -1.400 3.700 9.200 14.100 16.100 15.000 11.900 9.800 104.400
1997 -2.000 2.000 8.800 12.900 15.500 16.300 14.300 9.700 103.200
Ave. 2 -2.100 5.000 8.700 12.800 15.700 15.200 10.400 9.400 100.000
1 % - Sum of precipitation and temperatures from March to September divided by the long-term averages during the same period. 2 Long-term averages - Agriculture and Agri-food Canada. 3 Measured at Claresholm.

121
Table 3.2. Total model for total biomass, shoot mass, root mass, root:shoot (R:S), concentration N in shoot mass, concentration N in root mass, shoot mass N, root mass N. total N in biomass and R:S N of native and agronomiccommunities at three southern Alberta sites in 1995 and 1997.
Biomass
(g m-2)
Shoot Mass
(g m-2)
Root Mass
(g m-2)
Root:Shoot Concentration Shoot N(mg g-1)
Concentration Root N(mg g-1)
Shoot N
(g m-2)
Root N
(g m-2)
Total N
(g m-2)
R:S N
Source ---------------------------------------------------------------------------------------------------Probabilities-------------------------------------------------------------------------------------------------Year (Y) 0.196 <0.001 <0.001 <0.001 <0.001 <0.001 <0.001 <0.001 0.008 0.001Site (S) <0.001 <0.001 <0.001 0.015 0.070 0.031 <0.001 <0.001 <0.001 <0.001Treatment (T) <0.001 <0.001 <0.001 <0.001 <0.001 <0.001 <0.001 <0.001 <0.001 <0.001S x Y 0.552 0.003 0.179 0.114 <0.001 <0.001 0.030 0.077 0.085 0.186T x Y <0.001 <0.001 0.004 0.010 <0.001 0.006 <0.001 0.018 <0.001 0.006T x S <0.001 0.010 0.001 0.003 <0.001 <0.001 <0.001 <0.001 <0.001 0.002S x Y x T 0.384 0.005 0.674 0.228 <0.001 0.224 0.003 0.667 0.629 0.527Site --------------------------------------------------------------------------------------------------------Means----------------------------------------------------------------------------------------------------Stipa-Bouteloua
Native 1015.300 66.900 948.400 15.400 1.100 1.400 0.700 14.100 14.800
Perennial Grass1 943.200 183.100 760.100 6.200 1.100 1.400 1.800 11.000 12.800Wheat2 987.800 503.900 483.900 1.200 0.700 1.600 3.800 8.100 12.000Stipa-Bouteloua-Agropyron
Native 1135.700 181.200 1033.500 8.300 1.300 1.300 2.100 14.200 16.300Perennial Grass1 1152.900 203.300 1022.200 6.600 0.900 1.200 1.600 12.100 13.700Wheat2 809.700 524.200 306.400 1.100 0.800 1.600 3.800 5.100 8.900Festuca-Danthonia
Native 2153.200 265.000 1888.000 7.300 1.200 1.500 3.000 30.900 34.000Perennial Grass3 1731.100 389.900 1341.200 6.600 1.000 1.300 3.500 17.300 20.800Wheat2 1030.200 556.300 473.800 1.500 0.700 1.400 3.800 6.500 10.400
1 Crested wheatgrass and Russian wildrye.2 Fallow and continuously cropped wheat. 3 Smooth bromegrass and orchardgrass.

122
Table 3.3. Partial model of probabilities of differences between sites in total biomass, shoot mass, root mass, R:S, concentration N in shoot mass, concentration N in root mass, shoot mass N, R:S N of native and agronomic communities at three southern Alberta sites in 1995 and 1997.
Biomass
(g m-2)
Shoot Mass
(g m-2)
Root Mass
(g m-2)
Root: Shoot Concentration Shoot N(mg g-1)
Concentration Root N(mg g-1)
Shoot N
(g m-2)
Root N
(g m-2)
Total N
(g m-2)
R:S N
Site ---------------------------------------------------------------------------------------------------Probabilities-----------------------------------------------------------------------------------------------
--
Stipa-Bouteloua
Treatment (T) 0.059 <0.001 <0.001 <0.001 <0.001 0.017 <0.001 <0.001 0.015 <0.001
Year (Y) 0.100 <0.001 0.017 0.004 <0.001 0.834 <0.001 0.063 0.222 <0.001
T x Y <0.001 <0.001 0.670 0.429 <0.001 0.197 <0.001 0.102 0.003 0.386
Stipa-Bouteloua-Agropyron
Treatment (T) <0.001 <0.001 <0.001 <0.001 <0.001 <0.001 <0.001 <0.001 <0.001 0.002
Year (Y) 0.189 <0.001 <0.001 <0.001 0.053 <0.001 <0.001 <0.001 <0.001 <0.001
T x Y <0.001 <0.001 <0.001 0.011 0.388 0.002 <0.001 <0.001 <0.001 0.087
Festuca-Danthonia
Treatment (T) <0.001 <0.001 <0.001 <0.001 <0.001 0.029 <0.001 <0.001 <0.001 <0.001
Year (Y) 0.010 <0.001 0.032 0.089 <0.001 0.159 <0.001 0.051 0.444 0.038
T x Y 0.020 <0.001 0.152 0.677 <0.001 0.127 <0.001 0.294 0.098 0.141

123
Table 3.4. The total biomass and root:shoot mass production (R:S) of agronomic and native communities in three selected sites in southern Alberta in 1995 and 1997.
Site Stipa-Bouteloua Stipa-Agropyron-Bouteloua Festuca-Danthonia
Total Biomass(g m-2)
R:S Total Biomass(g m-2)
R:S Total Biomass(g m-2)
R:S
Year 1995 1997 1995 1997 1995 1997 1995 1997 1995 1997 1995 1997
Treatment --------------------------------------------------------------------------------------------------------Means---------------------------------------------------------------------------------------------------
Native (NAT) 847.100 1183.500 12.800 18.100* 847.200 1424.300 2.400 14.300* 1700.300 2606.000 6.300 8.300
Crested Wheatgrass (CWG) 1071.300 1013.300 1.900 5.800 1050.900 1304.200 1.700 6.400* - - - -
Smooth Brome (B)2 - - - - - - - - 1741.700 2124.500 1.200 4.400
Russian Wildrye (RWR) 793.100 895.100 7.200 10.000 870.300 1386.600* 4.900 13.800* - - - -
Orchardgrass (D)2 - - - - - - - - 1404.900 1653.300 5.100 15.600*
Wheat Continuous (WC)1 1074.500 720.900* 0.600 2.300 866.400 622.800* 0.400 2.500 1017.500 710.300 0.900 3.700
Wheat Fallow (WF)1 1328.200 827.500* 0.800 1.300 1268.200 481.300* 0.200 1.200 1759.200 633.700* 0.600 0.900
Contrast ---------------------------------------------------------------------------------------------------Probabilities-------------------------------------------------------------------------------------------------
NAT vs CWG 0.083 0.183 <0.001 <0.001 0.062 0.276 0.136 <0.001 - - - -
NAT vs B - - - - - - - - 0.910 0.195 0.096 0.189
NAT vs RWR 0.669 0.028 0.018 0.015 0.828 0.722 0.265 0.825 - - - -
NAT vs D - - - - - - - - 0.423 0.014 0.692 0.020
CWG vs RWR 0.034 0.352 0.018 0.064 0.097 0.439 0.150 0.002 - - - -
B vs D - - - - - - 0.362 0.205 0.197 <0.001
NAT vs WC 0.079 <0.001 <0.001 <0.001 <0.001 <0.001 0.356 <0.001 0.070 <0.001 0.075 0.122
NAT vs WF <0.001 0.008 <0.001 <0.001 <0.001 <0.001 0.295 <0.001 0.872 <0.001 0.062 0.017
WC vs WF 0.051 0.400 0.899 0.619 <0.001 0.189 0.898 0.562 0.050 0.835 0.926 0.353 1 - Wheat continuous was planted each year and fallow wheat was planted every alternate year. 2 - NOTE:At the Festuca-Danthonia site, bromegrass and orchardgrass were substituted for crested wheatgrass and Russian wildrye. *.- There is a significant difference in treatment between years (P<0.5).

124
Table 3.5. Biomass of shoot and roots of native and agronomic communities at Stipa-Bouteloua, Stipa-Agropyron-Bouteloua, and Festuca-Danthonia sites in southern Alberta in 1995 and 1997.
Shoot Biomass (g m-2) Root Biomass (g m-2)
Site Stipa-Bouteloua Stipa-Agropyron-Bouteloua
Festuca-Danthonia Stipa-Bouteloua Stipa-Agropyron-Bouteloua
Festuca-Danthonia
Year 1995 1997 1995 1997 1995 1997 1995 1997 1995 1997 1995 1997
Treatment -------------------------------------------------------------------------------------------------------------Means-------------------------------------------------------------------------------------------------------
Native (NAT) 65.500 71.300 223.000 109.200* 248.600 281.700 784.600 1112.200* 594.100 1315.100* 1451.700 2324.300*Bromegrass (B) -- -- -- -- 801.500 389.500* -- -- -- -- 940.200 1735.200*
Crested Wheatgrass (CWG)
394.000 159.300* 392.300 177.800* -- -- 677.400 854.000 658.500 1226.200 -- --
Orchardgrass (D) -- -- -- -- 238.300 130.200 -- -- -- -- 1166.100 1523.100
Russian Wildrye (RWR)
97.400 81.700 150.100 93.200* -- -- 695.700 813.400 720.200 1293.400 -- --
Wheat Continuous (WC)
694.500 226.600* 610.600 182.700* 544.500 166.000* 380.100 494.300 255.700 440.000 473.000 544.300
Wheat Fallow (WF) 682.300 365.600* 1081.700 222.100* 1179.600 335.400* 599.500 461.900 186.500 259.500 579.700 298.300
Contrasts --------------------------------------------------------------------------------------------------------Probabilities--------------------------------------------------------------------------------------------------------
NAT vs CWG <0.001 0.084 0.002 0.189 -- -- 0.036 0.015 0.541 0.052 -- --NAT vs B -- -- -- -- <0.001 0.203 -- -- -- -- 0.167 0.113NAT vs RWR 0.519 0.834 0.163 0.756 -- -- 0.053 0.005 0.236 0.817 -- --NAT vs D -- -- -- -- 0.906 0.078 -- -- -- -- 0.435 0.034CWG vs RWR <0.001 0.126 <0.001 0.108 -- -- 0.856 0.686 0.558 0.083 -- --B vs D -- -- -- -- <0.001 0.005 -- -- -- -- 0.536 0.561NAT vs WC <0.001 0.004 <0.001 0.160 0.002 0.172 <0.001 <0.001 0.003 <0.001 0.011 <0.001NAT vs WF <0.001 <0.001 <0.001 0.035 <0.001 0.519 0.006 <0.001 <0.001 <0.001 0.022 <0.001WC vs WF 0.807 0.008 <0.001 0.447 <0.001 0.051 0.035 0.747 0.511 0.063 0.770 0.500
*.- There is a significant difference in treatment between years (P < 0.5).

125
Table 3.6. Total biomass N of native and agronomic communities at Stipa-Bouteloua, Stipa-Agropyron-Bouteloua, and Festuca-Danthonia sites in southern Alberta in 1995 and 1997.
Total Biomass N (g m-2) R:S N
Site Stipa-Bouteloua Stipa-Agropyron-Bouteloua
Festuca-Danthonia Stipa-Bouteloua Stipa-Agropyron-Bouteloua
Festuca-Danthonia
Year 1995 1997 1995 1997 1995 1997 1995 1997 1995 1997 1995 1997
Treatment -------------------------------------------------------------------------------------------------Means--------------------------------------------------------------------------------------------
Native (NAT) 12.800 16.700* 10.000 22.600* 26.500 41.400* 17.300 24.400 2.700 17.900* 7.700 13.500
Bromegrass (B) -- -- -- -- 21.400 23.300 – – – – 2.000 10.000*
Crested Wheatgrass (CWG) 13.200 13.100 9.100 17.400* -- -- 3.100 15.200* 2.700 13.900* – --
Orchardgrass (D) -- -- -- -- 17.300 21.300 – – – – 5.000 16.900*
Russian Wildrye (RWR) 12.400 12.600 9.200 19.300* -- -- 5.500 13.900* 4.500 16.000* -- --
Wheat Continuous (WC) 10.800 9.500 8.300 10.500 10.600 8.900 1.100 9.100* 0.700 7.200* 2.000 8.300
Wheat Fallow (WF) 17.700 10.100* 9.400 7.500 15.500 9.600 1.600 3.300 0.400 3.200 0.800 2.200
Contrasts --------------------------------------------------------------------------------------------Probabilities------------------------------------------------------------------------------------------
NAT vs CWG 0.848 0.054 0.568 0.005 -- -- <0.001 0.012 0.999 0.230 -- --
NAT vs B -- -- -- -- 0.392 0.005 -- -- -- -- 0.047 0.224
NAT vs RWR 0.826 0.030 0.944 0.292 -- -- 0.003 0.072 0.579 0.565 -- --
NAT vs D -- -- -- -- 0.129 0.002 -- -- -- -- 0.335 0.019
CWG vs RWR 0.671 0.787 0.617 0.058 -- -- 0.499 0.725 0.579 0.524 -- --
B vs D -- -- -- -- 0.492 0.727 -- -- -- -- 0.279 0.002
NAT vs WC 0.279 <0.001 0.311 <0.001 0.011 <0.001 <0.01 <0.001 0.540 0.003 0.049 0.074
NAT vs WF 0.012 0.001 0.725 <0.001 0.070 <0.001 <0.001 <0.001 0.479 <0.001 0.019 <0.001
WC vs WF <0.001 0.758 0.504 0.092 0.414 0.706 0.874 0.119 0.922 0.214 0.670 0.040*.- There is a significant difference in treatment between years (P < 0.5).

126
Table 3.7. Concentration N in net shoot and root mass of native and agronomic communities at Stipa-Bouteloua, Stipa-Agropyron-Bouteloua, and Festuca-Danthonia sites in southern Alberta in 1995 and 1997.
Shoot Biomass Concentration N (mg g-1) Root Biomass Conentration N (mg g-1)
Site Stipa-Bouteloua Stipa-Agropyron-Bouteloua
Festuca-Danthonia Stipa-Bouteloua Stipa-Agropyron-Bouteloua
Festuca-Danthonia
Year 1995 1997 1995 1997 1995 1997 1995 1997 1995 1997 1995 1997
Treatment ----------------------------------------------------------------------------------------------------Means-------------------------------------------------------------------------------------------------
Native (NAT) 1.100 1.100 1.200 1.300 1.300 1.000* 1.400 1.400 1.200 1.500* 1.400 1.600
Bromegrass (B) -- -- -- -- 0.900 0.500* -- -- -- -- 1.400 1.200
Crested Wheatgrass (CWG) 0.900 0.600* 0.600 0.700 -- -- 1.500 1.400 1.000 1.300* -- --
Orchardgrass (D) -- -- -- -- 1.300 1.200 -- -- -- -- 1.200 1.300
Russian Wildrye (RWR) 2.000 1.100* 1.100 1.200 -- -- 1.500 1.400 1.000 1.300* -- --
Wheat Continuous (WC) 0.800 0.400* 0.800 0.800 0.600 0.600 1.500 1.700* 1.300 1.900* 1.500 1.400
Wheat Fallow (WF) 0.900 0.700* 0.600 0.900 0.800 0.800 1.700 1.700 1.400 1.900* 1.200 1.500*
Contrasts ------------------------------------------------------------------------------------------------Probabilities---------------------------------------------------------------------------------------------
NAT vs CWG <0.001 <0.001 <0.001 <0.001 -- -- 0.439 0.666 0.003 0.092 -- --
NAT vs B -- -- -- -- <0.001 <0.001 -- -- -- -- 0.929 0.004
NAT vs RWR <0.001 0.947 0.318 0.329 -- -- 0.181 0.963 0.013 0.033 -- --
NAT vs D -- -- -- -- 0.036 <0.001 -- -- -- -- 0.066 0.012
CWG vs RWR <0.001 <0.001 <0.001 <0.001 -- -- 0.560 0.700 0.548 0.605 -- --
B vs D -- -- -- -- <0.001 <0.001 -- -- -- -- 0.079 0.658
NAT vs WC <0.001 <0.001 <0.001 <0.001 <0.001 <0.001 0.434 0.017 0.186 <0.001 0.834 0.163
NAT vs WF 0.002 <0.001 <0.001 <0.001 <0.001 <0.001 0.004 0.023 0.022 <0.001 0.141 0.320
WC vs WF 0.002 <0.001 0.108 0.288 0.005 0.870 0.026 0.898 0.292 0.340 0.095 0.678*.- There is a significant difference in treatment between years (P<0.5).

127
Table 3.8. Total N in net shoot and root mass of native and agronomic communities at Stipa-Bouteloua, Stipa-Agropyron-Bouteloua, and Festuca-Danthonia sites in southern Alberta in 1995 and 1997.
Shoot Biomass N Root Biomass N
Site Stipa-Bouteloua Stipa-Agropyron-Bouteloua
Festuca-Danthonia Stipa-Bouteloua Stipa-Agropyron-Bouteloua
Festuca-Danthonia
Year 1995 1997 1995 1997 1995 1997 1995 1997 1995 1997 1995 1997
Treatment ----------------------------------------------------------------------------------------------------------Means---------------------------------------------------------------------------------------------------
Native (NAT) 0.700 0.800* 2.800 1.500* 3.300 2.800 12.100 16.000* 7.200 21.200* 23.600 38.600*
Bromegrass (B) -- -- -- -- 9.400 2.100* -- -- -- -- 14.000 21.200
Crested Wheatgrass (CWG) 3.400 0.900* 2.500 1.200* -- -- 9.800 12.200 6.600 16.300* -- --
Orchardgrass (D) -- -- -- -- 3.000 1.500* -- -- -- -- 14.300 19.800
Russian Wildrye (RWR) 1.900 0.900* 1.700 1.100 -- -- 10.500 11.700 7.500 18.100* -- --
Wheat Continuous (WC) 5.300 1.000* 5.000 1.500* 3.400 1.000* 5.500 8.500* 3.300 9.000* 7.100 7.900
Wheat Fallow (WF) 6.500 2.400* 6.900 2.000* 8.800 2.100* 10.500 7.700 2.600 5.500 6.600 7.500
Contrasts ------------------------------------------------------------------------------------------------------Probabilities-----------------------------------------------------------------------------------------------
NAT vs CWG <0.001 0.784 0.534 0.541 -- -- 0.190 0.041 0.716 0.008 -- --
NAT vs B -- -- -- -- <0.001 0.224 -- -- -- -- 0.128 0.006
NAT vs RWR 0.006 0.783 0.026 0.474 -- -- 0.366 0.022 0.874 0.087 -- --
NAT vs D -- -- -- -- 0.614 0.054 -- -- -- -- 0.143 0.003
CWG vs RWR <0.001 0.999 0.096 0.917 -- -- 0.674 0.780 0.602 0.282 -- --
B vs D -- -- -- -- <0.001 0.373 -- -- -- -- 0.954 0.803
NAT vs WC <0.001 0.003 <0.001 0.969 0.884 0.011 <0.001 <0.001 0.030 <0.001 0.011 <0.001
NAT vs WF <0.001 <0.001 <0.001 0.244 <0.001 0.273 0.356 <0.001 0.011 <0.001 0.009 <0.001
WC vs WF 0.007 0.002 <0.001 0.259 <0.001 0.113 0.009 0.652 0.667 0.051 0.930 0.577*.- There is a significant difference in treatment between years (P<0.5).

128
Table 3.9. Carbon to nitrogen ratios (C:N) of shoot and root mass of native and agronomic communities at Stipa-Bouteloua, Stipa-Agropyron-Bouteloua, and Festuca-Danthonia sites in southern Alberta in 1995 and 1997.
Shoot Biomass C:N Root Biomass CN
Site Stipa-Bouteloua Stipa-Agropyron-Bouteloua
Festuca-Danthonia Stipa-Bouteloua Stipa-Agropyron-Bouteloua
Festuca-Danthonia
Year 1995 1997 1995 1997 1995 1997 1995 1997 1995 1997 1995 1997
Treatment ----------------------------------------------------------------------------------------------------------Means---------------------------------------------------------------------------------------------------
Native (NAT) 40.900 43.400 36.900 35.400 33.600 45.200 30.600 32.000 37.300 30.900 25.000 24.900
Bromegrass (B) -- -- -- -- 49.300 84.500 -- -- -- -- 27.700 30.600
Crested Wheatgrass (CWG) 53.700 83.000 71.100 69.400 -- -- 28.200 33.400 45.900 35.000 -- --
Orchardgrass (D) -- -- -- -- 33.600 37.700 -- -- -- -- 31.000 30.300
Russian Wildrye (RWR) 23.500 43.800 38.500 37.400 -- -- 27.800 32.400 42.100 35.900 -- --
Wheat Continuous (WC) 60.100 104.300 27.800 62.800 74.000 77.700 30.500 26.900 34.900 25.800 28.700 26.700
Wheat Fallow (WF) 48.900 70.800 72.800 58.100 62.300 73.400 24.600 27.800 32.900 25.100 29.000 27.900
Contrasts -----------------------------------------------------------------------------------------------------Probabilities------------------------------------------------------------------------------------------------
NAT vs CWG -- <0.001 -- <0.001 -- -- 0.357 0.598 <0.001 0.053 -- --
NAT vs B -- -- -- -- -- <0.001 -- -- -- -- 0.314 0.040
NAT vs RWR -- 0.944 -- 0.772 -- -- 0.300 0.867 0.024 0.019 -- --
NAT vs D -- -- -- -- -- <0.001 -- -- -- -- 0.031 0.050
CWG vs RWR -- <0.001 -- <0.001 -- -- 0.905 0.718 0.070 0.650 -- --
B vs D -- -- -- -- -- <0.001 -- -- -- -- 0.310 0.914
NAT vs WC -- <0.001 -- <0.001 -- <0.001 0.905 0.062 0.250 0.019 0.176 0.509
NAT vs WF -- <0.001 -- 0.003 -- <0.001 0.029 0.120 0.041 0.010 0.144 0.268
WC vs WF -- <0.001 -- 0.521 -- 0.364 0.039 0.736 0.337 0.704 0.910 0.649

129
Table 3.10. Partial model of probabilities of differences between years in total shoot biomass, root, R:S, concentration N in shoot mass, concentration N in root mass, shoot mass N, and root mass N of native and agronomic communities at southern Alberta sites in 1995 and 1997.
Biomass Shoot Mass Root Mass R:S Shoot % N Root % N Shoot N Root N Total N
Stipa-Bouteloua --------------------------------------------------------------------------------------Probabilities-----------------------------------------------------------------------------------------------------------
Treatment
Native 0.012 0.903 0.038 0.013 0.281 0.672 0.943 0.039 0.043
Crested Wheatgrass 0.645 <0.001 0.086 0.053 <0.001 0.425 <0.001 0.183 0.936
Russian Wildrye 0.420 0.753 0.246 0.166 <0.001 0.322 0.015 0.517 0.941
Wheat Continuous 0.008 <0.001 0.250 0.362 <0.001 0.042 <0.001 0.099 0.476
Wheat Fallow <0.001 <0.001 0.177 0.825 <0.001 0.744 <0.001 0.130 <0.001
Stipa-Bouteloua-Agropyron --------------------------------------------------------------------------------------Probabilities-----------------------------------------------------------------------------------------------------------
Treatment
Native <0.001 0.034 <0.001 <0.001 0.412 0.001 0.008 <0.001 <0.001
Crested Wheatgrass 0.223 <0.001 <0.001 0.040 0.729 <0.001 0.008 <0.001 <0.001
Russian Wildrye <0.001 0.274 <0.001 <0.001 0.399 <0.001 0.232 <0.001 <0.001
Wheat Continuous 0.028 <0.001 0.029 0.352 0.892 <0.001 <0.001 0.002 0.205
Wheat Fallow <0.001 <0.001 0.308 0.625 0.010 <0.001 <0.001 0.096 0.271
Festuca-Danthonia ---------------------------------------------------------------------------------------Probabilities----------------------------------------------------------------------------------------------------------
Treatment
Native 0.019 0.602 0.022 0.491 <0.001 0.114 0.409 0.014 0.017
Smooth Brome 0.301 <0.001 0.035 0.292 <0.001 0.388 <0.001 0.228 0.746
Orchardgrass 0.500 0.101 0.330 0.001 0.065 0.114 0.021 0.364 0.509
Wheat Continuous 0.405 <0.001 0.845 0.348 0.851 0.989 <0.001 0.903 0.777
Wheat Fallow 0.004 <0.001 0.442 0.919 0.005 0.042 <0.001 0.728 0.145

130
APPENDIX B
NITROGEN PARTITIONING TABLES IN CHAPTER 4
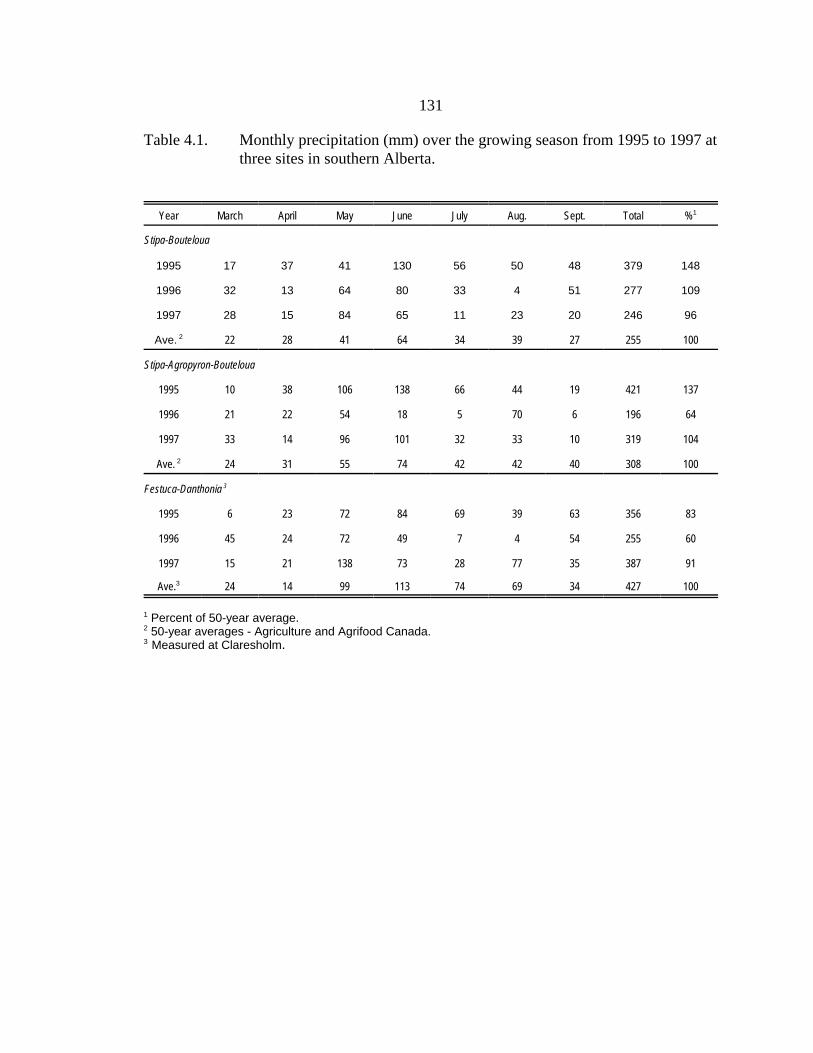
131
Table 4.1. Monthly precipitation (mm) over the growing season from 1995 to 1997 atthree sites in southern Alberta.
Year March April May June July Aug. Sept. Total %1
Stipa-Bouteloua
1995 17 37 41 130 56 50 48 379 148
1996 32 13 64 80 33 4 51 277 109
1997 28 15 84 65 11 23 20 246 96
Ave. 2 22 28 41 64 34 39 27 255 100
Stipa-Agropyron-Bouteloua
1995 10 38 106 138 66 44 19 421 137
1996 21 22 54 18 5 70 6 196 64
1997 33 14 96 101 32 33 10 319 104
Ave. 2 24 31 55 74 42 42 40 308 100
Festuca-Danthonia 3
1995 6 23 72 84 69 39 63 356 83
1996 45 24 72 49 7 4 54 255 60
1997 15 21 138 73 28 77 35 387 91
Ave.3 24 14 99 113 74 69 34 427 100
1 Percent of 50-year average.2 50-year averages - Agriculture and Agrifood Canada.3 Measured at Claresholm.

132
Table 4.2. Total model for total soil nitrogen, mineralizable nitrogen, C:N in soil,ammonium (NH4
+), nitrate (NO3-), light fraction (LF), and total light
fraction nitrogen at three southern Alberta sites in 1995 and 1997.
Mineralizable N (mg kg-1) NH4+ (mg kg-1) NO3
- (mg kg-1) LF (mg g-1) Total LF N (mg kg-1)
Source ----------------------------------------------------------------------Probabilities---------------------------------------------------------------------
Year (Y) 0.006 <0.001 0.360 <0.001 <0.001
Site (S) <0.001 <0.001 0.013 <0.001 <0.001
Treatment (T) 0.163 0.318 <0.001 <0.001 <0.001
S x Y 0.012 <0.001 0.005 <0.001 <0.001
T x Y 0.248 0.468 <0.001 <0.001 <0.001
T x S 0.674 0.513 0.282 <0.049 <0.031
S x Y x T 0.891 0.505 0.041 <0.001 <0.001
Site ---------------------------------------------------------------------------Means------------------------------------------------------------------------
Stipa-Bouteloua
Native 52.580 8.400 1.990 26.340 345.000
Perennial Grass1 41.300 7.700 2.500 15.850 205.000
Wheat2 40.980 8.270 5.500 12.780 172.000
SE 9.680 2.040 0.900 6.740 140.000
Stipa-Agropyron-Bouteloua
Native 31.950 7.030 2.650 40.620 670.000
Perennial Grass1 27.260 6.690 2.390 21.100 310.000
Wheat2 35.730 6.800 6.650 15.390 240.000
SE 9.680 2.040 0.900 6.740 140.000
Festuca-Danthonia
Native 149.420 17.030 2.860 74.790 1410.000
Perennial Grass1 131.390 16.390 4.240 40.070 690.000
Wheat2 147.100 20.620 9.220 25.680 430.000
SE 9.680 2.040 0.900 5.830 140.000
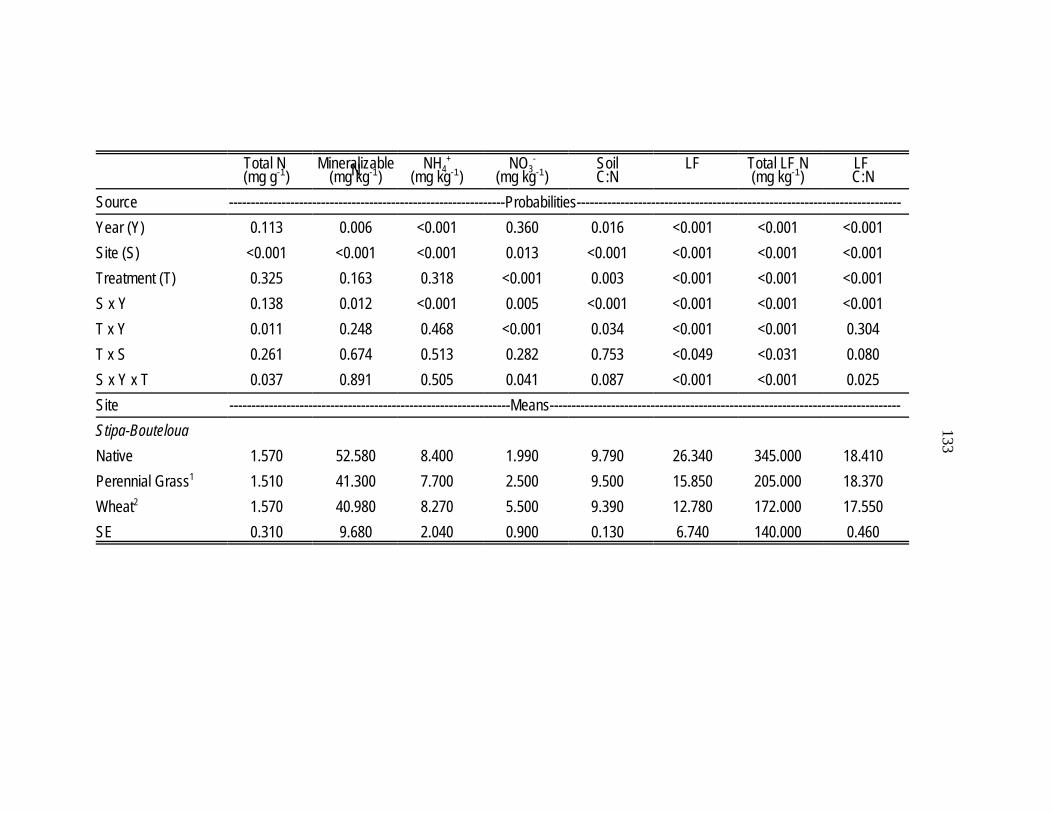
133
Total N (mg g-1)
Mineralizable N (mg kg-1)NH4
+
(mg kg-1)NO3
-
(mg kg-1)SoilC:N
LF Total LF N(mg kg-1)
LF C:N
Source ---------------------------------------------------------------Probabilities--------------------------------------------------------------------------Year (Y) 0.113 0.006 <0.001 0.360 0.016 <0.001 <0.001 <0.001Site (S) <0.001 <0.001 <0.001 0.013 <0.001 <0.001 <0.001 <0.001Treatment (T) 0.325 0.163 0.318 <0.001 0.003 <0.001 <0.001 <0.001S x Y 0.138 0.012 <0.001 0.005 <0.001 <0.001 <0.001 <0.001T x Y 0.011 0.248 0.468 <0.001 0.034 <0.001 <0.001 0.304T x S 0.261 0.674 0.513 0.282 0.753 <0.049 <0.031 0.080S x Y x T 0.037 0.891 0.505 0.041 0.087 <0.001 <0.001 0.025Site ----------------------------------------------------------------Means--------------------------------------------------------------------------------Stipa-BoutelouaNative 1.570 52.580 8.400 1.990 9.790 26.340 345.000 18.410Perennial Grass1 1.510 41.300 7.700 2.500 9.500 15.850 205.000 18.370Wheat2 1.570 40.980 8.270 5.500 9.390 12.780 172.000 17.550SE 0.310 9.680 2.040 0.900 0.130 6.740 140.000 0.460
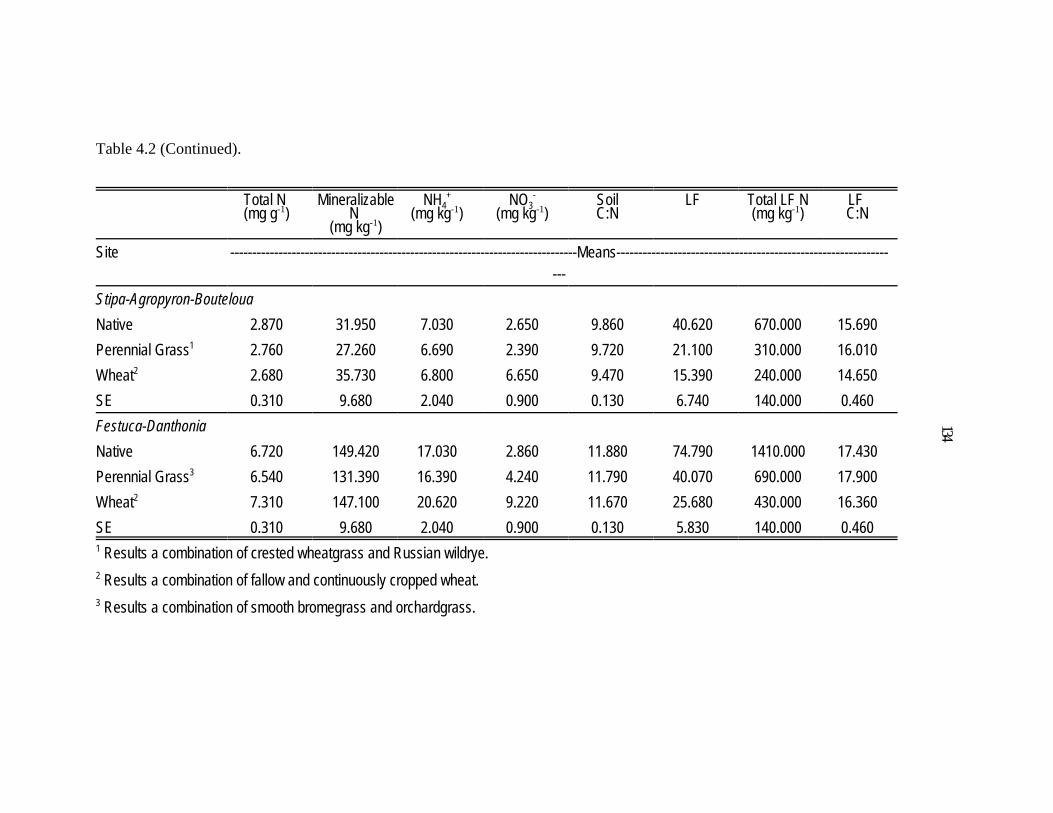
134
Table 4.2 (Continued).
Total N (mg g-1)
MineralizableN
(mg kg-1)NH4
+
(mg kg-1)NO3
-
(mg kg-1)SoilC:N
LF Total LF N(mg kg-1)
LF C:N
Site -------------------------------------------------------------------------------Means-----------------------------------------------------------------
Stipa-Agropyron-BoutelouaNative 2.870 31.950 7.030 2.650 9.860 40.620 670.000 15.690Perennial Grass1 2.760 27.260 6.690 2.390 9.720 21.100 310.000 16.010Wheat2 2.680 35.730 6.800 6.650 9.470 15.390 240.000 14.650SE 0.310 9.680 2.040 0.900 0.130 6.740 140.000 0.460Festuca-DanthoniaNative 6.720 149.420 17.030 2.860 11.880 74.790 1410.000 17.430Perennial Grass3 6.540 131.390 16.390 4.240 11.790 40.070 690.000 17.900Wheat2 7.310 147.100 20.620 9.220 11.670 25.680 430.000 16.360SE 0.310 9.680 2.040 0.900 0.130 5.830 140.000 0.4601 Results a combination of crested wheatgrass and Russian wildrye.2 Results a combination of fallow and continuously cropped wheat.3 Results a combination of smooth bromegrass and orchardgrass.

135
Table 4.3. Partial model by site for total soil nitrogen, mineralizable nitrogen , C:N in soil, Ammonium (NH4+), Nitrate (NO3
-) light fraction (LF), total light fraction nitrogen and C:N of the light fraction at three southern Alberta sites in 1995 and 1997.
Total N(mg g-1)
MineralizableN
(mg kg-1)SoilC:N
NH4+
(mg kg-1)NO3
-
(mg kg-1)LF
(mg kg-1)Total LF N(mg kg-1)
LFC:N
Site ------------------------------------------------------------------------Probabilities-------------------------------------------------------------
Stipa-BoutelouaTreatment (T) 0.636 0.505 0.220 0.460 <0.001 <0.001 <0.001 0.277Year (Y) 0.671 0.510 <0.001 <0.001 0.100 <0.001 0.003 <0.001T x Y 0.098 0.041 0.068 0.687 0.964 0.006 0.079 0.557Stipa-Bouteloua-AgropyronTreatment (T) 0.366 0.030 0.037 0.938 <0.001 <0.001 <0.001 <0.001Year (Y) 0.082 0.001 <0.001 <0.001 0.004 0.540 0.473 0.696T x Y 0.094 0.896 0.064 0.476 <0.001 0.177 0.376 0.068Festuca-DanthoniaTreatment (T) 0.285 0.270 0.171 0.393 0.002 0.002 0.005 0.036Year (Y) 0.018 0.006 <0.001 <0.001 0.711 <0.001 <0.001 0.010T x Y 0.036 0.281 0.404 0.056 0.003 0.003 0.005 0.021

136
Table 4.4. Effects of agronomic and native communities on mineralizable N, ammonium (NH4+), and nitrate (N03
-) in upper 15 cm of soil1 and light fraction, light fraction N, and C:N in upper 7.5 cm in a Stipa-Bouteloua site in southern Alberta in 1995 and 1997.
Mineralizable N(mg kg-1)
NH4+
(mg kg-1)NO3
-
(mg kg-1)LF
(mg kg-1)LF N
(mg kg-1)LF
C:N1995 1997 1995 1997 1995 1997 1995 1997 1995 1997 1995 1997
Treatment ------------------------------------------------------------------------------Means-----------------------------------------------------------------
Native 48.300 62.000 10.000 6.900 2.900 1.500 16.300 38.400 244.000 471.000 19.200 17.600Crested Wheatgrass 49.900 38.700 11.000 7.200 3.600 1.400 13.600 18.100 193.000 215.000 19.700 17.800Russian Wildrye 41.800 35.200 9.700 4.100 3.100 1.700 10.500 20.300 160.000 240.000 19.500 17.100Wheat Continuous 41.500 41.300 10.600 7.500 5.100 4.900 9.600 16.200 135.000 206.000 19.400 16.400Wheat Fallow 46.100 35.000 10.200 4.900 5.300 6.600 10.700 14.700 156.000 190.000 18.500 15.900SE2 8.000 6.600 1.200 1.400 0.740 0.520 1.500 2.400 26.000 35.000 0.700 0.000
Contrast ------------------------------------------------------------------Probabilities3---------------------------------------------------------------------
Native vs PerennialGrass 0.800 0.012 0.632 0.514 0.626 0.877 0.037 <0.001 0.052 <0.001 0.640 0.806
Native vs Wheat 0.634 0.013 0.626 0.711 0.020 <0.001 0.010 <0.001 0.010 <0.001 0.796 0.014Perennial Grass vs
Wheat 0.774 0.863 0.991 0.719 0.015 <0.001 0.169 0.169 0.202 0.169 0.337 0.010
1 Soil samples contain root biomass. 2 Standard error of the sample population. 3 Probabilities of planned contrasts.

137
Table 4.5. Effects of agronomic and native communities on mineralizable N, ammonium (NH4+) and nitrate (N03
-) in upper 15 cm of soil1 and light fraction, light fraction N, and C:N in upper 7.5 cm in a Stipa-Agropyron-Bouteloua site in southern Alberta in 1995 and 1997.
Mineralizable N(mg kg-1)
NH4+
(mg kg-1)NO3
-
(mg kg-1)LF
(mg kg-1)LF N
(mg kg-1)LF
C:N
1995 1997 1995 1997 1995 1997 1995 1997 1995 1997 1995 1997
Treatment -------------------------------------------------------------------------------------------------Means----------------------------------------
Native 31.200 29.100 7.800 6.000 2.800 2.500 32.800 44.000 570.000 702.000 15.400 16.100
Crested Wheatgrass 30.900 21.200 7.200 6.400 2.200 2.600 19.200 21.800 299.000 309.000 15.500 16.500
Russian Wildrye 33.400 23.500 7.400 5.800 2.100 2.600 20.200 23.200 329.000 320.000 15.800 16.200
Wheat Continuous 38.000 31.900 7.400 5.900 3.000 11.900 16.100 14.900 260.000 219.000 15.500 14.200
Wheat Fallow 40.900 31.800 8.300 5.700 4.300 7.600 18.300 12.600 314.000 194.000 14.900 14.100
SE2 2.800 2.700 0.500 0.600 0.400 0.800 2.900 3.100 48.000 51.000 0.340 0.410
Contrast --------------------------------------------------------------------------------------------Probabilities3-------------------------------------
Native vs Perennial Grass 0.778 0.066 0.464 0.865 0.202 0.930 0.003 <0.001 0.001 <0.001 0.462 0.662
Native vs Wheat 0.036 0.406 0.864 0.788 0.110 <0.001 0.001 <0.001 <0.001 <0.001 0.670 0.002
Perennial Grass vs Wheat 0.015 0.004 0.242 0.593 0.002 <0.001 0.344 0.015 0.537 0.058 0.139 <0.001
1 Soil samples contain root biomass.
2 Standard error of the sample population. 3 Probabilities of planned contrasts.
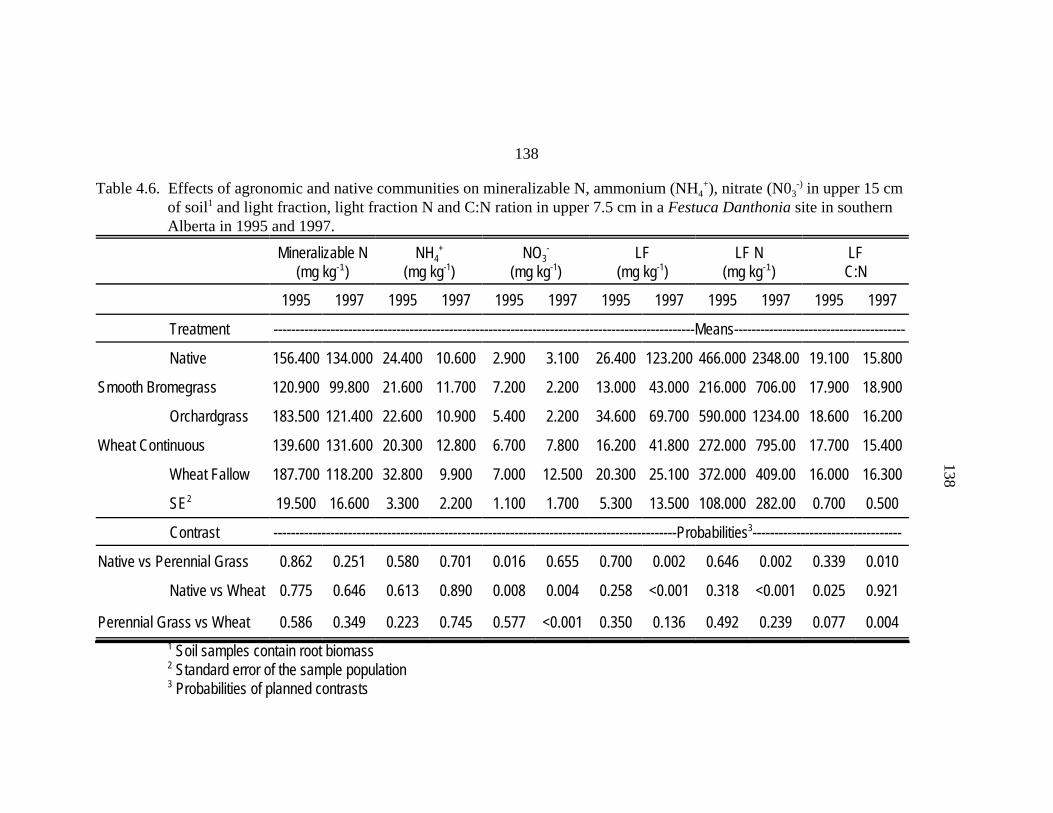
138
138
Table 4.6. Effects of agronomic and native communities on mineralizable N, ammonium (NH4+), nitrate (N03
-) in upper 15 cm of soil1 and light fraction, light fraction N and C:N ration in upper 7.5 cm in a Festuca Danthonia site in southern Alberta in 1995 and 1997.
Mineralizable N(mg kg-1)
NH4+
(mg kg-1)NO3
-
(mg kg-1)LF
(mg kg-1)LF N
(mg kg-1)LF
C:N
1995 1997 1995 1997 1995 1997 1995 1997 1995 1997 1995 1997
Treatment ------------------------------------------------------------------------------------------------Means---------------------------------------
Native 156.400 134.000 24.400 10.600 2.900 3.100 26.400 123.200 466.000 2348.00 19.100 15.800
Smooth Bromegrass 120.900 99.800 21.600 11.700 7.200 2.200 13.000 43.000 216.000 706.00 17.900 18.900
Orchardgrass 183.500 121.400 22.600 10.900 5.400 2.200 34.600 69.700 590.000 1234.00 18.600 16.200
Wheat Continuous 139.600 131.600 20.300 12.800 6.700 7.800 16.200 41.800 272.000 795.00 17.700 15.400
Wheat Fallow 187.700 118.200 32.800 9.900 7.000 12.500 20.300 25.100 372.000 409.00 16.000 16.300
SE2 19.500 16.600 3.300 2.200 1.100 1.700 5.300 13.500 108.000 282.00 0.700 0.500
Contrast --------------------------------------------------------------------------------------------Probabilities3----------------------------------
Native vs Perennial Grass 0.862 0.251 0.580 0.701 0.016 0.655 0.700 0.002 0.646 0.002 0.339 0.010
Native vs Wheat 0.775 0.646 0.613 0.890 0.008 0.004 0.258 <0.001 0.318 <0.001 0.025 0.921
Perennial Grass vs Wheat 0.586 0.349 0.223 0.745 0.577 <0.001 0.350 0.136 0.492 0.239 0.077 0.0041 Soil samples contain root biomass 2 Standard error of the sample population 3 Probabilities of planned contrasts