Comparative Genomics of Plant Chromosomes - The Plant Cell
19
The Plant Cell, Vol. 12, 1523–1539, September 2000, www.plantcell.org © 2000 American Society of Plant Physiologists GENOMICS ARTICLE Comparative Genomics of Plant Chromosomes Andrew H. Paterson, a,b,8 John E. Bowers, a Mark D. Burow, a,b Xavier Draye, b,1 Christine G. Elsik, c Chun-Xiao Jiang, b,2 Catherine Susan Katsar, b,3 Tien-Hung Lan, b,4 Yann-Rong Lin, b,5 Reiguang Ming, b,6 and Robert J. Wright b,7 a Applied Genetic Technology Center, Departments of Crop and Soil Science, Botany, and Genetics, University of Georgia, Athens, Georgia 30602 b Department of Soil and Crop Science, Texas A & M University, College Station, Texas 77843 c Department of Forestry, Texas A & M University, College Station, Texas 77843 FOUNDATIONS OF COMPARATIVE GENOMICS Comparative genomics, the study of the similarities and dif- ferences in structure and function of hereditary information across taxa, uses molecular tools to investigate many no- tions that long preceded identification of DNA as the heredi- tary molecule. Vavilov’s (1922) law of homologous series in variation was an early suggestion of the similarities in the ge- netic blueprints of many (plant) species. Genetic analysis based on morphological and isoenzyme markers hinted at par- allel arrangements of genes along the chromosomes of various taxa. These hints were later borne out at the DNA level, in seminal investigations of nightshades (Tanksley et al., 1988; Bonierbale et al., 1988) and grasses (Hulbert et al., 1990). Over the past two decades, multiple investigations of many additional taxa have delivered two broad messages: (1) In most plants, the evolution of the small but essential portion of the genome that actually encodes the organism’s genes has proceeded relatively slowly; as a result, taxa that have been reproductively isolated for millions of years have retained recognizable intragenic DNA sequences as well as similar arrangements of genes along the chromosomes. (2) A wide range of factors, such as ancient chromosomal or segmental duplications, mobility of DNA sequences, gene deletion, and localized rearrangements, has been superim- posed on the relatively slow tempo of chromosomal evolu- tion and causes many deviations from colinearity. COMPARATIVE MAPS IN CROP TAXA The Brassicaceae The Brassicaceae comprise 360 genera, organized into 13 tribes (Shultz, 1936; Al-Shehbaz, 1973). The most economi- cally important species are in the genus Brassica (tribe Brassiceae), six species of which are cultivated worldwide. Three of these species are considered diploid (B. rapa, A ge- nome, 2n 5 2x 5 20; B. nigra, B genome, 2n 5 2x 5 16; B. oleracea, C genome, 2n 5 2x 5 18), and three are amphip- loid derivatives of the diploids (B. juncea, AB, 2n 5 4x 5 36; B. napus, AC, 2n 5 4x 5 38; B. carinata, BC, 2n 5 4x 5 34). At least 15 molecular genetic maps have been constructed for Brassica that include all of the major cultivated species (Slocum et al., 1990; Landry et al., 1991, 1992; Song et al., 1991; Chyi et al., 1992; Kianian and Quiros, 1992; Figdore et al., 1993; Ferreira et al., 1994; Teutonico and Osborn, 1994; Uzunova et al., 1995; Lagercrantz and Lydiate, 1996; Truco et al., 1996; Lan et al., 2000a, 2000b; T.-H. Lan and A.H. Paterson, manuscript submitted). These maps include at least 935 different publicly available probes, with many shared by multiple maps. Within a species, the maps show almost complete colinearity (see Lydiate et al., 1993), except for small inversions that differ among some B. oleracea mor- photypes (Kianian and Quiros, 1992; Lan et al., 2000a). Comparison of B. rapa with B. oleracea and B. napus sup- ports the close evolutionary relationship between the two diploids but indicates that deletions and insertions may have occurred after divergence of the two species (Hoenecke and Chyi, 1991). The genome of the synthetic B. napus is 1 Current address: Université Catholique de Louvain, Louvain-la- Neuve, Belgium. 2 Current address: Garst Seeds, Slater, IA 50244. 3 Current address: USDA-ARS, Manhattan, KS 66502. 4 Current address: Novartis Agricultural Discovery Institute, La Jolla, CA 92037. 5 Current address: Department of Biology, Fu-Jen Catholic Univer- sity, Taipei, Taiwan, R.O.C. 6 Current address: Hawaiian Agricultural Research Center, Aiea, HI 96701. 7 Current address: Aventis Seeds, Gent, Belgium. 8 To whom correspondence should be addressed. E-mail paterson @uga.edu; fax 706-583-0160.
Transcript of Comparative Genomics of Plant Chromosomes - The Plant Cell
The Plant Cell, Vol. 12, 1523–1539, September 2000, www.plantcell.org © 2000 American Society of Plant Physiologists
GENOMICS ARTICLE
Comparative Genomics of Plant Chromosomes
Andrew H. Paterson,
a,b,8
John E. Bowers,
a
Mark D. Burow,
a,b
Xavier Draye,
b,1
Christine G. Elsik,
c
Chun-Xiao Jiang,
b,2
Catherine Susan Katsar,
b,3
Tien-Hung Lan,
b,4
Yann-Rong Lin,
b,5
Reiguang Ming,
b,6
and Robert J. Wright
b,7
a
Applied Genetic Technology Center, Departments of Crop and Soil Science, Botany, and Genetics, University of Georgia, Athens, Georgia 30602
b
Department of Soil and Crop Science, Texas A & M University, College Station, Texas 77843
c
Department of Forestry, Texas A & M University, College Station, Texas 77843
FOUNDATIONS OF COMPARATIVE GENOMICS
Comparative genomics, the study of the similarities and dif-ferences in structure and function of hereditary informationacross taxa, uses molecular tools to investigate many no-tions that long preceded identification of DNA as the heredi-tary molecule. Vavilov’s (1922) law of homologous series invariation was an early suggestion of the similarities in the ge-netic blueprints of many (plant) species. Genetic analysisbased on morphological and isoenzyme markers hinted at par-allel arrangements of genes along the chromosomes of varioustaxa. These hints were later borne out at the DNA level, inseminal investigations of nightshades (Tanksley et al., 1988;Bonierbale et al., 1988) and grasses (Hulbert et al., 1990).
Over the past two decades, multiple investigations ofmany additional taxa have delivered two broad messages:(1) In most plants, the evolution of the small but essentialportion of the genome that actually encodes the organism’sgenes has proceeded relatively slowly; as a result, taxa thathave been reproductively isolated for millions of years haveretained recognizable intragenic DNA sequences as well assimilar arrangements of genes along the chromosomes. (2)A wide range of factors, such as ancient chromosomal orsegmental duplications, mobility of DNA sequences, genedeletion, and localized rearrangements, has been superim-
posed on the relatively slow tempo of chromosomal evolu-tion and causes many deviations from colinearity.
COMPARATIVE MAPS IN CROP TAXA
The Brassicaceae
The Brassicaceae comprise 360 genera, organized into 13tribes (Shultz, 1936; Al-Shehbaz, 1973). The most economi-cally important species are in the genus Brassica (tribeBrassiceae), six species of which are cultivated worldwide.
Three of these species are considered diploid (
B. rapa
, A ge-
nome, 2
n
5
2
x
5
20;
B. nigra
, B genome, 2
n
5
2
x
5
16;
B.oleracea
, C genome, 2
n
5
2
x
5
18), and three are amphip-loid derivatives of the diploids (
B. juncea
, AB, 2
n
5
4
x
5
36;
B. napus
, AC, 2
n
5
4
x
5
38;
B. carinata
, BC, 2
n
5
4
x
5
34).At least 15 molecular genetic maps have been constructedfor Brassica that include all of the major cultivated species(Slocum et al., 1990; Landry et al., 1991, 1992; Song et al.,1991; Chyi et al., 1992; Kianian and Quiros, 1992; Figdore etal., 1993; Ferreira et al., 1994; Teutonico and Osborn, 1994;Uzunova et al., 1995; Lagercrantz and Lydiate, 1996; Trucoet al., 1996; Lan et al., 2000a, 2000b; T.-H. Lan and A.H.Paterson, manuscript submitted). These maps include atleast 935 different publicly available probes, with manyshared by multiple maps. Within a species, the maps showalmost complete colinearity (see Lydiate et al., 1993), exceptfor small inversions that differ among some
B. oleracea
mor-photypes (Kianian and Quiros, 1992; Lan et al., 2000a).Comparison of
B. rapa
with
B. oleracea
and
B. napus
sup-ports the close evolutionary relationship between the twodiploids but indicates that deletions and insertions may haveoccurred after divergence of the two species (Hoeneckeand Chyi, 1991). The genome of the synthetic
B. napus
is
1
Current address: Université Catholique de Louvain, Louvain-la-Neuve, Belgium.
2
Current address: Garst Seeds, Slater, IA 50244.
3
Current address: USDA-ARS, Manhattan, KS 66502.
4
Current address: Novartis Agricultural Discovery Institute, La Jolla,CA 92037.
5
Current address: Department of Biology, Fu-Jen Catholic Univer-sity, Taipei, Taiwan, R.O.C.
6
Current address: Hawaiian Agricultural Research Center, Aiea, HI96701.
7
Current address: Aventis Seeds, Gent, Belgium.
8
To whom correspondence should be addressed. E-mail [email protected]; fax 706-583-0160.

1524 The Plant Cell
essentially unrearranged with respect to its
B. oleracea
and
B. rapa
progenitors (Lydiate et al., 1993), although the evolu-tion of wild
B. napus
(Cheung and Landry, 1996) has beenaccompanied by more complicated rearrangements. Exten-sive segmental duplications are found in both diploid andamphidiploid maps, supporting the hypothesis that diploid
Brassica
spp are derived from an ancestor with a lower orig-inal basic chromosome number; however, no duplications ofwhole linkage groups have been found. At least 22 chromo-somal rearrangements differentiate
B. oleracea
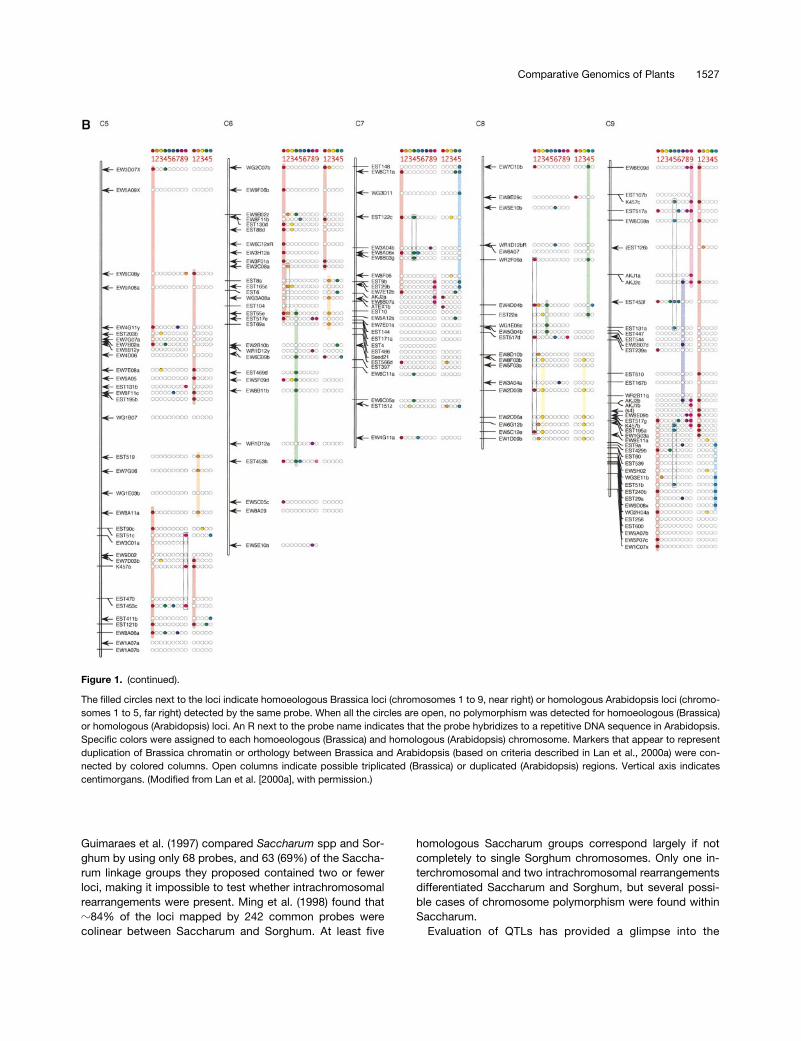
homeologsfrom one another (Lan et al., 2000a) (see Figure 1).
The Poaceae
Most of the world’s food and feed crops are members of thefamily Poaceae, including rice, wheat, maize, sorghum, sug-arcane, barley, oat, rye, millet, and others. Conservationacross large chromosomal tracts, spanning
z
65 millionyears of evolution
(Figure 2), is a recurring message frommany investigations of diverse Poaceae (see Bennetzen andFreeling, 1993). Pioneering efforts in the comparative map-ping of maize and sorghum (Hulbert et al., 1990) have beensupported by more detailed studies (Whitkus et al., 1992;Berhan et al., 1993; Binelli et al., 1993; Chittenden et al.,1994; Pereira et al., 1994) and supplemented by the com-parative organization of maize and rice (Ahn and Tanksley,1993), wheat and rice (Kurata et al., 1994), and maize,wheat, and rice (Ahn et al., 1993). A host of investigationsadditionally encompasses many other cultivated Poaceae,with particular emphasis on the interrelationships among thehomeologous chromosome sets of the Triticeae and theirrelatives (see Naranjo et al., 1987; Chao et al., 1989; Liu andTsunewaki, 1991; Devos et al., 1992a, 1992b, 1993, 1995; Liuet al., 1992; Xie et al., 1993; Namuth et al., 1994; Hohmann etal., 1995; Marino et al., 1996; Mickelson-Young et al., 1995;Nelson et al., 1995a, 1995b, 1995c; Van Deynze et al., 1995).Curiously, even in the relatively “conservative” Poaceae, cer-tain lineages appear to be rapidly evolving. The genomes ofrye and wheat appear to differ by
z
13 chromosomal rear-rangements after only
z
6 million years of divergence (Devos etal., 1992a, 1992b), a rate of reshuffling more than twice the av-erage calculated for nine taxa (Paterson et al., 1996) and ex-ceeded only by the Brassica–Arabidopsis lineage.
The Fabaceae
The Fabaceae are the third largest family of flowering plants,and like the Poaceae, they contribute substantially to thesustenance of humans. The Fabaceae include major le-gumes and oilseeds such as soybean (
Glycine max
, 2
n
5
4
x
5
40), peanut (
Arachis hypogaea
, 2
n
5
4
x
5
40), mung bean(
Vigna radiata
, 2
n
5
2
x
5
22), chickpea (
Cicer arietinum
, 2
n
5
2
x
5
16), and lentil (
Lens culinaris
, 2
n
5
2
x
5
14), as well asvegetable crops such as common bean (
Phaseolus vulgaris
,
2
n
5
2
x
5
22) and pea (
Pisum sativum
, 2
n
5
2
x
5
14) andforages such as alfalfa (
Medicago sativa
, 2
n
5
4
x
5
32). TheFabaceae are distinguished from other major crops in that
z
90% of legume species interact symbiotically with Rhizo-bium to fix nitrogen and thus supply themselves with an oth-erwise costly fertilizer element. Detailed genetic maps havebeen assembled in at least eight genera of the Fabaceae(Arachis, Glycine, Lens, Medicago, Phaseolus, Pisum, Vicia,and Vigna). A pioneering report established common geneorder across at least 40% of the lentil and pea genomes(Weeden et al., 1992) and further suggested, based onisoenzyme loci, conservation with many chromosomal re-gions in Vicia
(Torres et al., 1993). Not surprisingly, mungbean and cowpea, both species of the genus Vicia, also ex-hibit a high degree of linkage conservation (Menacio-Hauteaet al., 1993). Arachis adds a unique dimension to legume ge-nomics in that genetic maps of both diploid (Halward et al.,1993) and tetraploid (M.D. Burow, J. Starr, C. Simpson, andA.H. Paterson, unpublished data) genomes are available.Further, the tetraploid map involves the use of a syntheticpolyploid derived from three species that are thought to bequite distant from the cultigen, thereby introducing novel ge-netic variation that has proven successful for the first traittargeted (see Burow et al., 1996). Recent work on the small-genome taxon
Medicago trunculata
promises to provide afacile model and nodal point for comparative genomics oflegumes (Cook, 1999).
The Solanaceae
The Solanaceae include several economically importantplant species, such as tomato (
Solanum lycopersicum
[for-merly
Lycopersicon esculentum
], 2
n
5
2
x
5
24), pepper(
Capsicum annuum
, 2
n
5
2x 5 24), potato (S. tuberosum,2n 5 2x 5 24), eggplant (S. melongena, 2n 5 2x 5 24), andtobacco (Nicotiana tabacum, 2n 5 4x 5 48). The genomesof potato and tomato differ by only five chromosomal rear-rangements (Bonierbale et al., 1988; Tanksley et al., 1992),all of which involve a single break at or near a centromere,resulting in paracentric inversions of the short arms of chro-mosomes 5, 9, 11, and 12 and of the long arm of chromo-some 10. These findings further reinforce the relatively highpropensity (or tolerance) of plants for intrachromosomal re-arrangement. In contrast, the genomes of tomato and pep-per are more extensively rearranged, with z30 chromosomebreaks since divergence from a common ancestor (Prince etal., 1993; Livingstone et al., 1999).
POLYPLOIDY: COMPARATIVE GENOMICS WITHINA NUCLEUS
The joining of two divergent genomes into a common nu-cleus, thereby establishing polyploidy, is arguably the single
Comparative Genomics of Plants 1525
observed for other traits, including disease resistance(Wright et al., 1998), plant morphology (Jiang et al., 2000),and adaptations to arid conditions (Y. Saranga, M. Menz, C.Jiang, R. Wright, D. Yakir, and A.H. Paterson, unpublisheddata). An intriguing and perhaps significant observation isthat many families of dispersed repetitive DNA elements,largely confined to A-genome diploid cottons, have spreadto the D subgenome of tetraploid cottons (Hanson et al.,1998; Zhao et al., 1998). Together, these repetitive DNAfamilies represent a potentially powerful mutagen, with anestimated 1.4 million copies present in the tetraploid ge-nome (Zhao et al., 1998). Whether such repetitive DNA is re-sponsible for generating the D-subgenome alleles thatcontribute to the transgressive variation of tetraploid cottonsrelative to their diploid progenitors remains to be deter-mined.
Sugarcane: Genetic Buffering by Autopolyploidy
In autopolyploidy, multiple sets of chromosomes in a com-mon nucleus retain the possibility of multipartner (poly-somic) pairing of individual chromosomes at meiosis. Manyevolutionary models consider autopolyploidy to be a tran-sient phase, with selection gradually leading to reestablish-ment of disomic pairing relationships (allopolyploidy). Theextent of diploidization of chromosomes, as reflected bybivalent inheritance, is considered one indicator of the antiq-uity of autopolyploid formation. Comparative genetic meth-ods permit the extent of preferential chromosome pairing tobe estimated directly (Al-Janabi et al., 1994).
The consequences of autopolyploid formation in plantsare exemplified by comparing the genus Saccharum (sugar-cane) with the closely related genus Sorghum. In as few as 5million years since Saccharum and Sorghum diverged froma common ancestor (Al-Janabi et al., 1994; Sobral et al.,1994), Saccharum spp have reached gametic chromosomenumbers ranging from 18 to 85 or more versus 10 for Sor-ghum spp. The high numbers of chromosome duplicationand autogamous chromosome pairing in sugarcane pre-clude genetic mapping based on codominant “alleles.” DNAmarkers showing simplex (single-dose) segregation (Wu etal., 1992) have been used to construct genetic linkage mapsof at least five sugarcane populations (Al-Janabi et al., 1993;da Silva et al., 1993, 1995; Grivet et al., 1996; Mudge et al.,1996; Ming et al., 1998). The sugarcane maps range from160 (Mudge et al., 1996) to 2460 loci (Ming et al., 1998) andcollectively are estimated to cover z70% of the genome(Ming et al., 1998).
The close relationship, high degree of colinearity, andcross-hybridization of DNA probes in Saccharum spp com-pel the use of the small genome of Sorghum to guide molec-ular mapping and positional cloning. Dufour et al. (1997)evaluated the colinearity of sugarcane and sorghum ge-nomes based on 84 anchor probes distributed at intervals ofz20 centimorgans (cM) across the Sorghum genome.
most important genetic mechanism in plant evolution andone that has affected the genomes of most angiosperms(Stebbins, 1966; Masterson, 1994). Polyploid formation isassociated with extensive chromosome restructuring (Ahnand Tanksley, 1993; Reinisch et al., 1994; Song et al.,1995a, 1995b; Lagercrantz and Lydiate, 1996; Brubaker etal., 1999) and possibly with retrotransposon amplification(Matzke and Matzke, 1998; Zhao et al., 1998). Polyploidiza-tion may also allow further mechanisms of genome restruc-turing that result in additional gene duplications. Forexample, among 10 groups of maize Myb genes that arelikely to have undergone duplication at the time of maizetetraploidization, five groups contain three or more mem-bers, indicating recent amplification above the number re-sulting directly from genome duplication (Rabinowicz et al.,1999).
Geneticists have long debated whether the prevalence ofpolyploidy in plants simply reflects promiscuity or confers aninherent selective advantage. Polyploidy appears to contrib-ute substantially to the productivity of many crop plants(e.g., see Simmonds, 1976), including cotton, wheat, oat,soybean, peanut, canola, tobacco, coffee, and banana. Re-markably, little is known about how divergent genomes co-evolve within a common nucleus so as to function inconcert. Both cotton, an allopolyploid, and sugarcane, anautopolyploid, exemplify successful polyploids, and some oftheir unique features are currently being revealed by com-parative genomics.
Cotton: Permanent Hybridity by Allopolyploidy
In allopolyploidy, multiple genomes that previously had ex-isted separately from one another coexist within a commonnucleus, with strict one-to-one (disomic) pairing of chromo-somes at meiosis. The predominant cultivated cottons, Gos-sypium hirsutum and G. barbadense, are allotetraploids,thought to have been formed z1 to 2 million years ago bytransoceanic migration of an Old World (A-genome) progen-itor followed by hybridization with a New World (D-genome)progenitor (Wendel, 1989). The tetraploid chromosomeshave been aligned with their diploid progenitors (Brubaker etal., 1999).
Both A-genome diploid and AD-tetraploid Gossypiumtaxa have been domesticated; however, intense directionalselection by humans has consistently produced AD-tetra-ploid cottons with yield or quality (or both) superior to that ofA-genome diploid cultivars.
Curiously, the superior genetic potential of tetraploid cot-ton over its A-genome progenitor is apparently attributableto contributions from the D subgenome, from the diploid an-cestor that does not produce spinnable fiber. Most quantita-tive trait loci (QTLs) that account for genetic variation in fibertraits of modern G. barbadense and G. hirsutum map to theD subgenome (Jiang et al., 1998). A tendency toward rela-tively high polymorphism of the D subgenome has also been

1526 The Plant Cell
Figure 1. Composite Restriction Fragment Length Polymorphism Linkage Map of Brassica oleracea, and Its Alignment to the Map of Arabidopsis thaliana.
Comparative Genomics of Plants 1527
Figure 1. (continued).
The filled circles next to the loci indicate homoeologous Brassica loci (chromosomes 1 to 9, near right) or homologous Arabidopsis loci (chromo-somes 1 to 5, far right) detected by the same probe. When all the circles are open, no polymorphism was detected for homoeologous (Brassica)or homologous (Arabidopsis) loci. An R next to the probe name indicates that the probe hybridizes to a repetitive DNA sequence in Arabidopsis.Specific colors were assigned to each homoeologous (Brassica) and homologous (Arabidopsis) chromosome. Markers that appear to representduplication of Brassica chromatin or orthology between Brassica and Arabidopsis (based on criteria described in Lan et al., 2000a) were con-nected by colored columns. Open columns indicate possible triplicated (Brassica) or duplicated (Arabidopsis) regions. Vertical axis indicatescentimorgans. (Modified from Lan et al. [2000a], with permission.)
Guimaraes et al. (1997) compared Saccharum spp and Sor-ghum by using only 68 probes, and 63 (69%) of the Saccha-rum linkage groups they proposed contained two or fewerloci, making it impossible to test whether intrachromosomalrearrangements were present. Ming et al. (1998) found thatz84% of the loci mapped by 242 common probes werecolinear between Saccharum and Sorghum. At least five
homologous Saccharum groups correspond largely if notcompletely to single Sorghum chromosomes. Only one in-terchromosomal and two intrachromosomal rearrangementsdifferentiated Saccharum and Sorghum, but several possi-ble cases of chromosome polymorphism were found withinSaccharum.
Evaluation of QTLs has provided a glimpse into the

1528 The Plant Cell
Figure 2. Comparative Mapping of Cereal Chromosomes.
Comparative Genomics of Plants 1529
molecular basis of phenotypic buffering that may contributeto the success of autopolyploid crops. The autopolyploidyof sugarcane is apparent in the high degree of observed du-plication of QTLs. For example, 36 QTLs for sugar content,mapped in four different Saccharum genotypes, correspondto only seven distinct regions of the genome, suggestingthat the 36 QTLs may be accounted for by many fewergenes (R. Ming, S.-C. Liu, J.E. Irvine, and A.H. Paterson, un-published data). In several cases, two or more loci detectedby the same DNA probe were each associated with variationin the same trait. Such associations may reflect either themultiplex segregation of individual QTLs or the coincidenceof different QTL alleles at nearby loci; in either case, theconsequences of multiple copies of a genomic region, eachassociated with common phenotypic effects, are apparent.In virtually all such cases, additional doses of QTLs are as-sociated with diminishing returns, similar to the less-than-additive epistatic interactions of unlinked QTLs in diploid to-mato (Eshed and Zamir, 1996). Epistasis in sugarcane iscomplicated by the possibility of nonlinear interactions be-tween different alleles at homologous sites in addition tononlinear interactions between unrelated loci (Eshed andZamir, 1996).
Many Modern Diploids Appear to Be Ancient Polyploids
Contemporary polyploids provide further insight into in-stances of gene and genome duplication that have contrib-uted to the evolution of genomes (Figures 2 and 3C)perceived today to be diploid. Indeed, most flowering plantgenomes are thought to have gone through one or more cy-cles of polyploid formation (Stebbins, 1966; Masterson,1994). A surprising discovery based on its near-completesequencing is that much of the Arabidopsis genome ap-pears to be duplicated (Figures 4A and 4B), supporting priorsuggestions of segmental duplications (Kowalski et al.,1994; Paterson et al., 1996; Lan et al., 2000a) based on map-ping restriction fragment length polymorphisms (RFLPs).Similar genetic mapping evidence of ancient duplication ex-
ists for sorghum (Chittenden et al., 1994; Pereira et al.,1994; Paterson et al., 1996) and rice (Kishimoto et al., 1994;Nagamura et al., 1995).
An important question concerns the fate of genes afterduplication. For example, the data depicted in Figure 4 sug-gest that approximately two-thirds of the Arabidopsis ge-nome has been duplicated; however, only z19% of the totalnumber of expressed sequence tags (ESTs) studied fell intothe linked groups that suggest duplication. The vast majorityof genes showed either no duplication or no discernible pat-tern in the arrangements of duplicated copies. If indeedthere was a genome-wide duplication in an Arabidopsis pro-genitor, the vast majority of duplicated genes have beenlost, moved to new locations, or diverged so greatly thatthey are no longer recognizable. Isoenzyme and molecularstudies have provided evidence for gene silencing in poly-ploid angiosperms and ferns (Soltis and Soltis, 1993). Only asmall proportion of the triplicated isoenzyme genes inhexaploid wheat have been lost (Hart, 1983); however, for-mation of hexaploid wheat is very recent. Duplicate isoen-zyme loci have been reported in maize (Wendel et al., 1986,1989) and sorghum (Morden et al., 1989), but many isoen-zyme systems also occur in numbers typical of diploidplants (Wendel et al., 1986; Morden et al., 1989), which sug-gests gene loss. Molecular evidence suggests that bothgene silencing and functional divergence have occurred inthe leghemoglobin gene family in the polyploid angiospermsoybean (G. max; Lee and Verma, 1984). Gene loss, to-gether with localized rearrangements, may contribute to de-viations from synteny that are found both in genetic mapsand in localized comparisons of bacterial artificial chromo-some (BAC) sequences.
Consequences of Polyploidy for Physical Mapping
The combination of polyploidy and heterozygosity that is in-herent to crops such as cotton and sugarcane but rare inmodel organisms such as Caenorhabditis, Arabidopsis, and
Figure 2. (continued).
The genetic maps of relevant regions of the genomes of rice, wheat, barley, and maize are aligned to the map of sorghum. DNA marker loci indi-cated by a line (at left of the gene name) were directly mapped in the cited populations, whereas those indicated by an arrow were mapped inother populations and the appropriate locations were inferred on the basis of map positions of flanking markers. Approximate locations of cen-tromeres (ovals within linkage groups), telomeres (circles at ends of linkage groups), and breakpoints of chromosomal rearrangements (doublesquiggles) distinguishing taxa have been indicated. For DNA marker loci that conflict with the most-parsimonious interpretation of chromosomalcorrespondence between taxa, alternative map positions have been indicated in parentheses, adjacent to the appropriate locus in sorghum. Forcases in which the exact determination of marker order in local regions could not be inferred, the order most parsimonious with that in other spe-cies was assumed. Because the populations used to map “anchor loci” were small (56 to 90 individuals), local reversals in order of closely linkedmarkers (.3 cM) do not provide conclusive evidence of chromosomal rearrangement between taxa. Dark lines connecting selected probes onsorghum linkage groups D and I represent evidence of segmental duplication of this chromosomal region, as previously described (Chittendenet al., 1994). (Excerpted with permission from Paterson et al. [1995]. Copyright 1995, American Association for the Advancement of Science.)
1530 The Plant Cell
mouse poses a new challenge to genomics. Traditionaldot-blot hybridization or polymerase chain reaction–basedassays for identifying BAC clones corresponding to amapped DNA landmark usually do not provide sufficient in-formation to distinguish between allelic and nonallelic loci.Use of DNA fingerprint data to assemble locus-specificcontigs for duplicated chromosomal regions requires ameans for distinguishing not only between the genomicDNA of the underlying clones but also between distinct locithat have arisen subsequent to the establishment of poly-ploidy. To assemble a contig that truly represents a continu-ous sequence within a polyploid genome, it is necessary toascertain that the component BAC (or other) clones are de-rived from the same genetic locus. Individual BACs can beassigned to their source loci within the polyploid genome bydetecting sequence variation among homologous and ho-meologous DNA sequences (i.e., alloalleles; Reinisch et al.,1994); such detection is not possible by traditional dot-blotor polymerase chain reaction–based screening methods. Inthe BAC-RF method (Lin et al., 2000), DNA probes hybridizeto both restriction digestions of BAC DNA and dot blots. Re-striction digestion of pools of BAC DNA indicates the size ofthe hybridizing fragment or fragments, which can be com-pared with the sizes of alleles that have been geneticallymapped to their chromosomal locations. Dot blots yieldqualitative data about which BACs hybridize to whichprobes. BAC pools confer advantages similar to those real-ized by use of radiation hybrid cell lines (Goss and Harris,1975; Cox et al., 1990), obviating the need for DNA polymor-phism to map loci to their chromosomal locations at fine-scale resolution. BAC-RF will facilitate contig assembly formany polyploid crops and similarly provides a facile meansto identify and isolate individual members of multigene or re-petitive DNA families.
ANGIOSPERM CHROMOSOME EVOLUTION
As exemplified above, closely related genera often retainsimilar gene order along large segments of their genetic
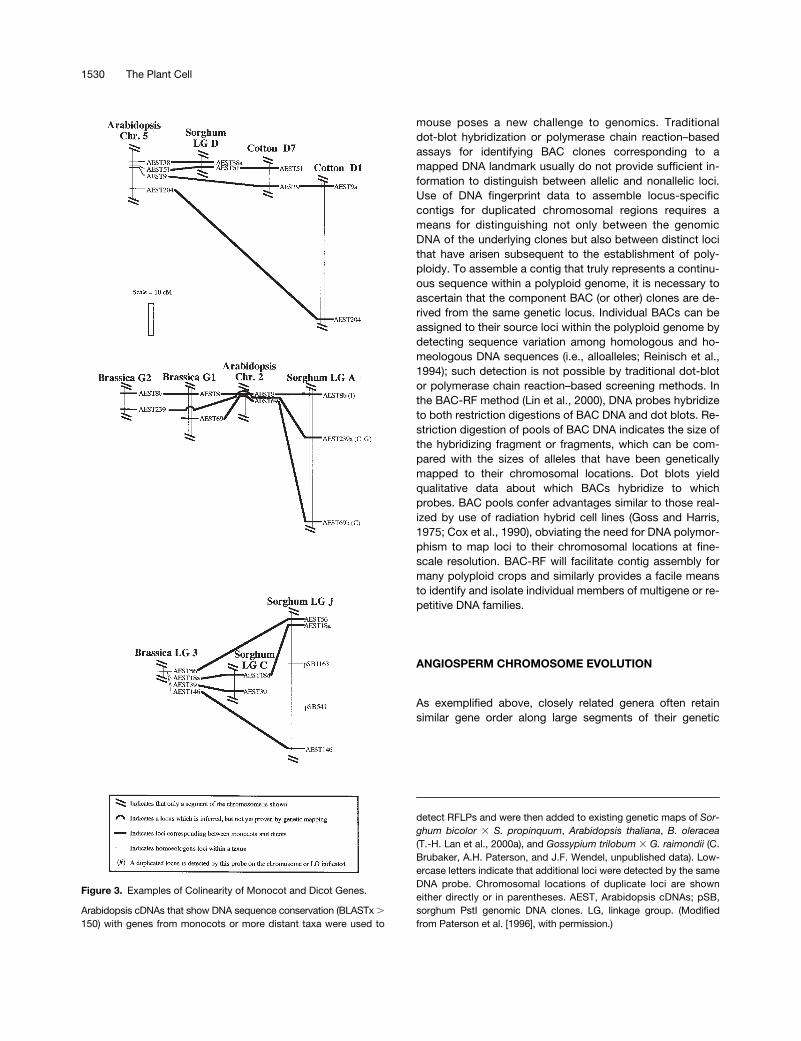
Figure 3. Examples of Colinearity of Monocot and Dicot Genes.
Arabidopsis cDNAs that show DNA sequence conservation (BLASTx .150) with genes from monocots or more distant taxa were used to
detect RFLPs and were then added to existing genetic maps of Sor-ghum bicolor 3 S. propinquum, Arabidopsis thaliana, B. oleracea(T.-H. Lan et al., 2000a), and Gossypium trilobum 3 G. raimondii (C.Brubaker, A.H. Paterson, and J.F. Wendel, unpublished data). Low-ercase letters indicate that additional loci were detected by the sameDNA probe. Chromosomal locations of duplicate loci are showneither directly or in parentheses. AEST, Arabidopsis cDNAs; pSB,sorghum PstI genomic DNA clones. LG, linkage group. (Modifiedfrom Paterson et al. [1996], with permission.)

Comparative Genomics of Plants 1531
maps, punctuated by structural mutations such as inver-sions and translocations. Several examples point to the pos-sibility that conservation of gene order might extrapolate tomore distantly related taxa. The two major subclasses offlowering plants, monocots and dicots, are thought to havediverged from a common ancestor z130 to 240 millionyears ago (Wolfe et al., 1989; Crane et al., 1995). The possi-bility that discernible parallels in gene order may have per-sisted over this time is supported in a general sense by theobservation that nine pairs of taxa for which both compara-tive genetic maps and plausible estimates of divergencetime are available show an average of 0.14 (60.06) struc-tural differences per chromosome per million years of diver-gence (Paterson et al., 1996); in monocots and dicots, thisrate of divergence would suggest that 43 to 58% of thechromosomal tracts that span <3 cM would remain uninter-rupted by this type of major structural rearrangement. Theextent of parallel arrangement of common DNA probesmapped in sorghum, cotton, Arabidopsis, and Brassica isnot explicable by chance (Paterson et al., 1996; see Figure 3for examples). However, conservation of order among syn-tenic but widely dispersed markers may not represent colin-earity of all genes between the markers (see Paterson et al.,1996), and determination of the shortest conserved evolu-tionary unit sequence (SCEUS) depends on the density ofcomparative markers (O’Brien et al., 1993). Indeed, recentstudies suggest that many localized rearrangements can beaccounted for by smaller scale events superimposed onchromosome-level events.
Local Genomic Colinearity
Comparisons of recombination-based genetic maps are lim-ited in sensitivity, partly by the number of orthologousprobes available and partly by population sizes relative tothe frequency of recombination. Most RFLP maps containonly a few hundred comparable markers at most, confininganalysis of colinearity to 5- to 10-cM segments. Further-more, many mapped populations are based on ,100 indi-viduals, which means that unambiguous resolution of theorders of genes is limited to those that are at least 1 cMapart. This low sensitivity could miss many small deletions,duplications, and inversions. In contrast, comparative re-striction mapping or sequence analysis of orthologous ge-nomic segments of 100 kb or so cloned into BAC or yeastartificial chromosome vectors can provide highly detailedcomparisons, albeit for only a small portion of any genome.
Comparative studies of the restriction maps of yeast artifi-cial chromosome or BAC clones (Dunford et al., 1995; Kilianet al., 1995) and genomic sequence comparisons (Chen etal., 1998; Tikhonov et al., 1999) continue to support the no-tion of colinear gene orders; intergenic sequences, however,are highly variable. In particular, the large maize genomecontains substantial amounts of intergenic DNA, most ofwhich consists of retrotransposons inserted within each
other (SanMiguel et al., 1996; Chen et al., 1997, 1998;Tikhonov et al., 1999). These intergenic retrotransposonsshow a preference for insertion between genes and havebeen amplified within the last 2 to 6 million years to make up.50% of the total maize nuclear genome (SanMiguel et al.,1996, 1998; SanMiguel and Bennetzen, 1998). Hence, inter-genic retrotransposons largely account for the greater phys-ical distance between genes in large-genome grasses incomparison to small-genome grasses (Chen et al., 1997;Tikhonov et al., 1999). Clearly, these mobile DNAs are usu-ally able to insert into genomic regions without affecting lo-cal gene content or order.
Some exceptions to colinearity have also been observedwith genes in otherwise orthologous regions. For instance,orthologous regions of the maize, sorghum, and rice ge-nomes all exhibit tight genetic and physical linkage of sh2and a1 homologs, but these two loci are not linked in Arabi-dopsis (Bennetzen et al., 1998). Even in maize and sorghum,two closely related species that descended from a commonancestor z15 to 20 million years ago (Gaut and Doebley,1997), some exceptions to colinearity were observed inadh1 homologous regions (Tikhonov et al., 1999).
Sequence-Based Comparisons
Comparisons of DNA sequences from taxa whose genomeshave been only partially sequenced provide mixed results insupporting or refuting the value of gene order in one taxonfor predicting gene order in other taxa (Gale and Devos,1998). Occasional artifacts may result from “best availablematches” between genes that are in fact not orthologousbut merely similar, perhaps reflecting the suggestion thatthe “universe of exons” may be as few as 5000, arranged invarious combinations and permutations into a much largeruniverse of genes (Dorit et al., 1990). A modal SCEUS lengthof 3 cM between monocots and dicots has been estimated(Paterson et al., 1996), but variable rates of chromosomestructural divergence are evident in different lineages, con-tributing to a coefficient of variation of z40% (0.06/0.14).Given these considerations, along with well-establishedvariation in the relationship between genetic (cM) and physi-cal (kb) distances, the observation that sampling of differentgenomic regions from different taxa would show differentdegrees of structural conservation is not startling.
A recent comparison of rice ESTs with the Arabidopsisgenomic sequence suggests that identification of orthologsby using BLASTN may not always be reliable when dealingwith divergent, incompletely sequenced genomes (Devos etal., 1999). That BLASTN encounters difficulties in identifyingorthologs is not surprising, given that the BLASTN algorithmimposes a tradeoff between speed and accuracy (Altschul etal., 1990) and does not recognize moderately distant nucle-otide homologies efficiently. Indeed, Karlin and Altschul(1990) have shown, using default scoring matrices, thatBLASTN targets matches of .98% sequence similarity.
1532 The Plant Cell
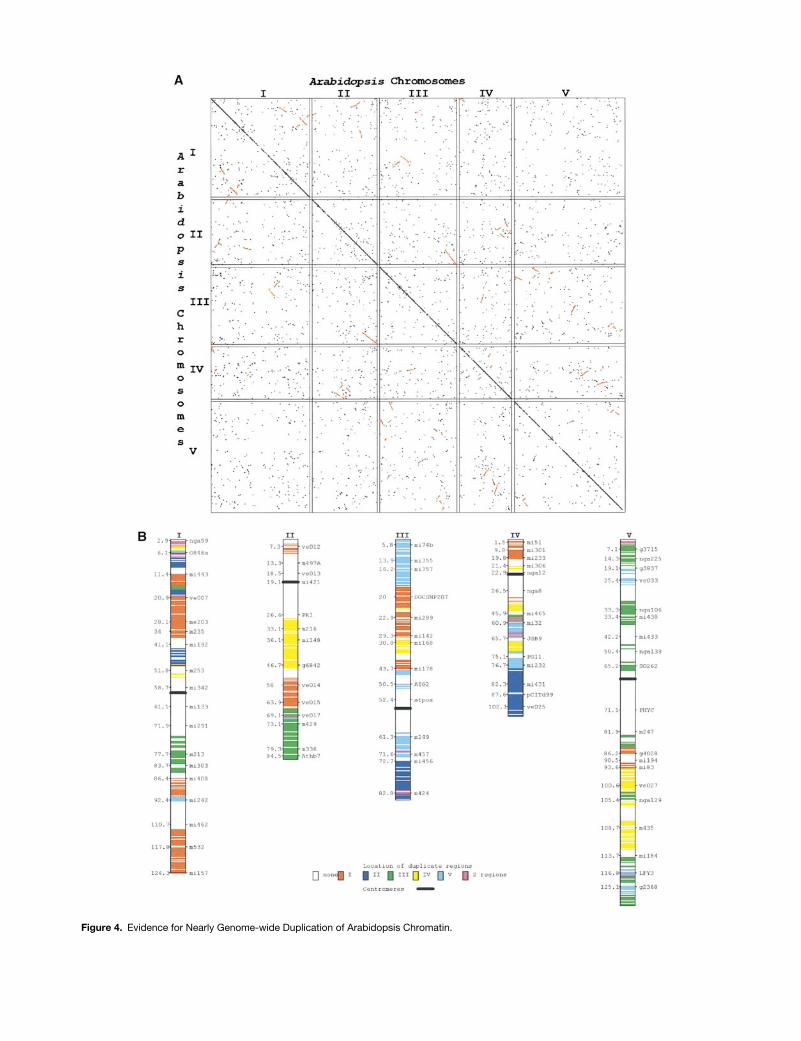
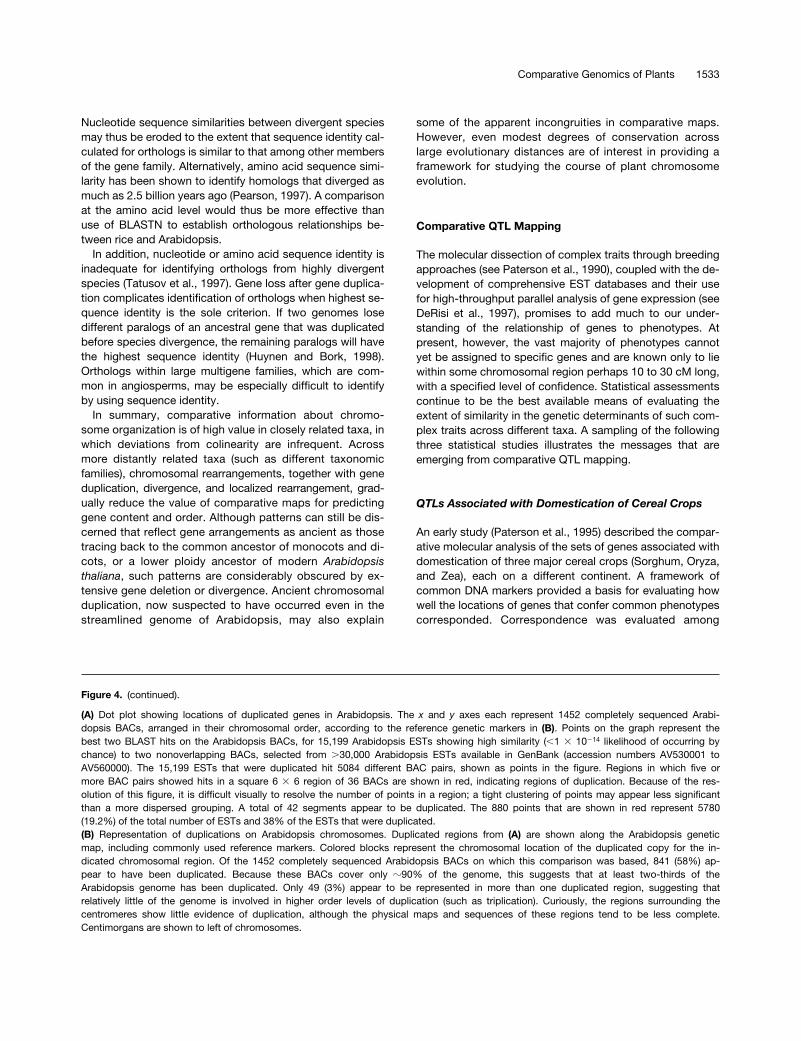
Figure 4. Evidence for Nearly Genome-wide Duplication of Arabidopsis Chromatin.
Comparative Genomics of Plants 1533
Nucleotide sequence similarities between divergent speciesmay thus be eroded to the extent that sequence identity cal-culated for orthologs is similar to that among other membersof the gene family. Alternatively, amino acid sequence simi-larity has been shown to identify homologs that diverged asmuch as 2.5 billion years ago (Pearson, 1997). A comparisonat the amino acid level would thus be more effective thanuse of BLASTN to establish orthologous relationships be-tween rice and Arabidopsis.
In addition, nucleotide or amino acid sequence identity isinadequate for identifying orthologs from highly divergentspecies (Tatusov et al., 1997). Gene loss after gene duplica-tion complicates identification of orthologs when highest se-quence identity is the sole criterion. If two genomes losedifferent paralogs of an ancestral gene that was duplicatedbefore species divergence, the remaining paralogs will havethe highest sequence identity (Huynen and Bork, 1998).Orthologs within large multigene families, which are com-mon in angiosperms, may be especially difficult to identifyby using sequence identity.
In summary, comparative information about chromo-some organization is of high value in closely related taxa, inwhich deviations from colinearity are infrequent. Acrossmore distantly related taxa (such as different taxonomicfamilies), chromosomal rearrangements, together with geneduplication, divergence, and localized rearrangement, grad-ually reduce the value of comparative maps for predictinggene content and order. Although patterns can still be dis-cerned that reflect gene arrangements as ancient as thosetracing back to the common ancestor of monocots and di-cots, or a lower ploidy ancestor of modern Arabidopsisthaliana, such patterns are considerably obscured by ex-tensive gene deletion or divergence. Ancient chromosomalduplication, now suspected to have occurred even in thestreamlined genome of Arabidopsis, may also explain
some of the apparent incongruities in comparative maps.However, even modest degrees of conservation acrosslarge evolutionary distances are of interest in providing aframework for studying the course of plant chromosomeevolution.
Comparative QTL Mapping
The molecular dissection of complex traits through breedingapproaches (see Paterson et al., 1990), coupled with the de-velopment of comprehensive EST databases and their usefor high-throughput parallel analysis of gene expression (seeDeRisi et al., 1997), promises to add much to our under-standing of the relationship of genes to phenotypes. Atpresent, however, the vast majority of phenotypes cannotyet be assigned to specific genes and are known only to liewithin some chromosomal region perhaps 10 to 30 cM long,with a specified level of confidence. Statistical assessmentscontinue to be the best available means of evaluating theextent of similarity in the genetic determinants of such com-plex traits across different taxa. A sampling of the followingthree statistical studies illustrates the messages that areemerging from comparative QTL mapping.
QTLs Associated with Domestication of Cereal Crops
An early study (Paterson et al., 1995) described the compar-ative molecular analysis of the sets of genes associated withdomestication of three major cereal crops (Sorghum, Oryza,and Zea), each on a different continent. A framework ofcommon DNA markers provided a basis for evaluating howwell the locations of genes that confer common phenotypescorresponded. Correspondence was evaluated among
Figure 4. (continued).
(A) Dot plot showing locations of duplicated genes in Arabidopsis. The x and y axes each represent 1452 completely sequenced Arabi-dopsis BACs, arranged in their chromosomal order, according to the reference genetic markers in (B). Points on the graph represent thebest two BLAST hits on the Arabidopsis BACs, for 15,199 Arabidopsis ESTs showing high similarity (,1 3 10214 likelihood of occurring bychance) to two nonoverlapping BACs, selected from .30,000 Arabidopsis ESTs available in GenBank (accession numbers AV530001 toAV560000). The 15,199 ESTs that were duplicated hit 5084 different BAC pairs, shown as points in the figure. Regions in which five ormore BAC pairs showed hits in a square 6 3 6 region of 36 BACs are shown in red, indicating regions of duplication. Because of the res-olution of this figure, it is difficult visually to resolve the number of points in a region; a tight clustering of points may appear less significantthan a more dispersed grouping. A total of 42 segments appear to be duplicated. The 880 points that are shown in red represent 5780(19.2%) of the total number of ESTs and 38% of the ESTs that were duplicated.(B) Representation of duplications on Arabidopsis chromosomes. Duplicated regions from (A) are shown along the Arabidopsis geneticmap, including commonly used reference markers. Colored blocks represent the chromosomal location of the duplicated copy for the in-dicated chromosomal region. Of the 1452 completely sequenced Arabidopsis BACs on which this comparison was based, 841 (58%) ap-pear to have been duplicated. Because these BACs cover only z90% of the genome, this suggests that at least two-thirds of theArabidopsis genome has been duplicated. Only 49 (3%) appear to be represented in more than one duplicated region, suggesting thatrelatively little of the genome is involved in higher order levels of duplication (such as triplication). Curiously, the regions surrounding thecentromeres show little evidence of duplication, although the physical maps and sequences of these regions tend to be less complete.Centimorgans are shown to left of chromosomes.
1534 The Plant Cell
genes/QTLs associated with temperate (day-neutral) flower-ing, restricted seed dispersal, and increased seed size incrosses between divergent Sorghum, Oryza, and Zea taxa.Genes/QTLs were found to correspond far more often thanwould be expected to occur by chance, suggesting that cor-responding genes may be involved in evolution of thesephenotypes. Convergent domestication of sorghum, rice,and maize, as reflected by mutations at corresponding ge-netic loci, suggests that a few genes with large effects maymostly determine the phenotypes studied.
Correspondence in location of QTLs in different taxa doesnot prove identity between the underlying genes, but it doessuggest the identity of some of them. Map-based cloning ofQTLs, a heretofore refractory objective, appears more trac-table in view of these results. Specifically, “parallel walks” tocorresponding genes in different species may obviate someobstacles often associated with positional cloning.
In all three taxa used in these studies, the crosses studiedwere highly divergent. In both Sorghum and Zea, a culti-vated type was crossed to a wild relative; in Oryza, diver-gent subspecies were crossed to one another. Hence, thegenes that were mapped are likely to reflect fundamentalchanges in the early stages of domestication, and the re-sults may not therefore be predictive of the levels and pat-terns of conservation of subtle differences among elitecultivars.
Comparative Analysis of Pest Resistance Genes
The greenbug, Schizaphis graminum (Rondani), survives ona wide range of grass species. The parthenogenetic natureof this aphid’s reproduction leads to rapid propagation ofvirulent biotypes: in only 30 years, S. graminum has givenrise to eight new biotypes that have overcome both hostplant resistance and susceptibility to organophosphateinsecticides. Sorghum, wheat, and barley each containgreenbug resistance genes at comparable chromosomal lo-cations—specifically, among sorghum linkage groups D, F,I, and J, and Triticeae homologous groups 1, 6, and 7 (C.S.Katsar, G. Peterson, Y. Lin, G.L. Teetes, and A.H. Paterson,unpublished data). Crop rotation has long been a key com-ponent of integrated pest management, with the tacit as-sumption that different crops offer different obstacles to thepest. The sorghum–wheat rotation commonly used in theSouthern Plains of the United States, however, may be inad-equate to disrupt the life cycle of this pest, and correspon-dence among resistance loci across various taxa suggeststhe need for more effective “gene rotation” strategies. Thus,positional and functional information about resistance genesin different crops is vital to ensure that crop rotation truly ac-complishes the goal of challenging pests with a series ofdiverse resistance genes/mechanisms. Further, many ofsorghum’s greenbug resistance genes seem to fall withinduplicated chromosomal regions, heightening the possibilityof further redundancy of resistance mechanisms.
Diversity in QTLs Suggests That Brassica Is a Rapidly Evolving Genus
Comparing three morphologically diverse B. oleracea geno-types, each crossed to a common rapid-cycling genotype,we studied the extent to which apparently similar pheno-types were under common genetic control in the Brassicagenus. Although this experiment was designed to investi-gate the comparative evolution of the inflorescence, otheraspects of plant morphology were also studied to provide amore detailed understanding of the suite of changes neededto transform a small, ephemeral plant into, for example, cau-liflower. For example, we inferred that the 47 QTLs found toaffect measures of plant size and shape in the three differentcrosses reflected variation in z35 different genetic loci, illus-trating that most QTLs differed between populations (T.-H.Lan and A.H. Paterson, manuscript submitted). This picturetends to contradict the pattern found in the grasses, whichshowed highly similar genetic controls of a trait in differentgenotypes. However, diversity of QTLs is reinforced by QTLdata for other traits in Brassica (Lan and Paterson, 2000b);previously published data (Kowalski et al., 1994) also sug-gest that the Brassica genome may be relatively rapidlyevolving at the structural level.
SYNTHESIS
Approximately a decade ago, the suggestion that diverseplant species might resemble each other in terms of genecontent (Tanksley et al., 1988) and order (Bonierbale et al.,1988; Hulbert et al., 1990) came as something of a surprise,especially in view of the tremendous developmental, bio-chemical, and morphological diversity that has arisen overthe 130- to 240-million-year history of angiosperm evolution.Today, comparative genetic maps allow model species toguide inquiry and provide insights into the genomes andevolution of multiple experimental species. Widespread useof heterologous DNA markers has accelerated genomeanalysis in many crops.
Nevertheless, present-day comparative genomic mapsmust be interpreted with caution. Most comparative geneticmaps continue to be based on a relative paucity of DNAmarkers, and virtually all are dependent on the availability ofDNA polymorphism, which means that only a subset of locican be mapped. In addition, regardless of how much ge-nomic colinearity may exist between two species, the veryfact of speciation means that a certain degree of nonco-linearity is likely (see, e.g., Dubcovsky and Dvorak, 1995;Leister et al., 1998).
Much current activity is centered on aligning the physicalmaps and genomic sequences from models such as Arabi-dopsis with genetic maps of major crops, potentially to aidin the cloning of agriculturally important genes or QTLs.Thousands of genetically mapped mutants of Arabidopsis,
Comparative Genomics of Plants 1535
maize, rice, and other taxa might similarly be united into acentral tool for the comparative study of plant development.However, although chromosomal parallels appear to havepersisted among distantly related plants, they are consider-ably obscured by extensive gene deletion or divergence.Ancient chromosomal duplication, now evident even in thestreamlined genome of Arabidopsis, may also cause appar-ent incongruities that can be resolved only when compara-tive maps become very detailed.
Colinear RFLP maps and a close phylogenetic relation-ship are good indicators of local colinearity, but only de-tailed analysis of the targeted local region can revealmicrocolinearity. Next-generation “gene maps” (Deloukas etal., 1998), and ultimately additional genomic sequences, willempower comparative studies at a level of resolution that farexceeds present capabilities. Fine-scale scans of genomesfor features that implicate particular regions in the geneticcontrol of key phenotypes are on the horizon and will revealheretofore unappreciated evolutionary trends (G. Wang etal., 1995; Aaltonen et al., 1997; Peltonen and Uusitalo, 1997;Cohen, 1999; R. Wang et al., 1999). Predicted SCEUSlengths will prove useful in identifying unusual features ofparticular genomes. “Gene blocks” that are conserved be-cause of advantages of particular structural features or genearrangements (“position effects”; see Lewis, 1950) that im-pact expression and function will be of special interest.Methods for parallel “expression profiling” of thousands ofgenes simultaneously (DeRisi et al., 1997) will be indispens-able to analyses of chromosome function on a global scale.Taxa such as Brassica and Secale, which show particularlyhigh rates of chromosome structural rearrangement (seePaterson et al., 1996), might be fertile systems for investi-gating the structural mutation process. New methods alsopromise to reveal more detail about the arrangements of re-petitive DNA elements on a genome-wide scale (Lin et al.,2000; Zhang et al., 2000). An especially intriguing issue ishow and why parallel gene order is preserved along thechromosomes of taxa that have been reproductively iso-lated for millions of years despite rapidly changing arrange-ments of intergenic DNA.
Plant biology is entering a golden age in which high-throughput genomic enterprises, such as those providingthe complete sequences for Oryza and Arabidopsis, willprovide powerful new approaches to solving puzzles thathave perplexed botanists for centuries. The extent of paral-lelism in gene orders is only one example of the kinds oflearning opportunities that will reward public investment incomprehensive plant genomics programs. It is particularlyexciting that such programs are beginning to expand be-yond selected models to include the food, feed, and fibercrops that sustain humanity. Crops are domesticated be-cause they exhibit one or more extraordinary features, suchas the large carbohydrate-rich seeds of the cultivated cere-als, the remarkably long and strong single-celled fibers ofcotton, the curd-like semi-sterile inflorescence of cauli-flower, and the bulbous berry of tomato. Each crop is intrin-
sically an elegant “model” that offers unique opportunities tomake new advances in (comparative) plant biology. As suchadvances are made, crop improvement will be equippedwith an unprecedented set of tools for further adaptation ofplants to better meet human needs.
Received March 7, 2000; accepted August 14, 2000.
REFERENCES
Aaltonen, J., Horelli-Kuitunen, N., Fan, J., Björses, P., Perheentupa,J., Myers, R., Palotie, A., and Peltonen, L. (1997). High-resolu-tion physical and transcriptional mapping of the autoimmunepolyendocrinopathy-candidiasis-ectodermal dystrophy locus onchromosome 21q22.3 by FISH. Genome Res. 7, 820–829.
Ahn, S., and Tanksley, S.D. (1993). Comparative linkage mapsof rice and maize genomes. Proc. Natl. Acad. Sci. USA 90,7980–7984.
Ahn, S., Anderson, J.A., Sorrells, M.E., and Tanksley, S.D.(1993). Homoeologous relationships of rice, wheat, and maizechromosomes. Mol. Gen. Genet. 241, 483–490.
Al-Janabi, S.M., Honeycutt, R.J., McClelland, M., and Sobral,B.W.S. (1993). A genetic linkage map of Saccharum sponta-neum L. ‘SES 208.’ Genetics 134, 1249–1260.
Al-Janabi, S.M., Honeycutt, R.J., Peterson, C., and Sobral, B.W.S.(1994). Phylogenetic analysis of organellar DNA sequences in theAndropogoneae: Saccharum. Theor. Appl. Genet. 88, 933–944.
Al-Shehbaz, I.A. (1973). The biosystematics of the genus Thelypo-dium (Cruciferae). Contrib. Gray Herb. Harv. Univ. 204, 3–148.
Altschul, S.F., Gish, W., Miller, W., Myers, E.W., and Lipman,D.J. (1990). Basic local alignment search tool. J. Mol. Biol.215, 403–410.
Bennetzen, J.L., and Freeling, M. (1993). Grasses as a singlegenetic system: Genome composition, collinearity and com-patibility. Trends Genet. 9, 259–261.
Bennetzen, J.L., SanMiguel, P., Chen, M., Tikhonov, A.,Francki, M., and Avramova, Z. (1998). Grass genomes. Proc.Natl. Acad. Sci. USA 95, 1975–1978.
Berhan, A.M., Hulbert, S.H., Butler, L.G., and Bennetzen, J.L.(1993). Structure and evolution of the genomes of Sorghumbicolor and Zea mays. Theor. Appl. Genet. 86, 598–604.
Binelli, G., Gianfrancesci, L., Pè, M.E., Taramino, G., Busso,C., Stenhouse, J., and Ottaviano, E. (1993). Similarity ofmaize and sorghum genomes as revealed by maize RFLPprobes. Theor. Appl. Genet. 84, 10–16.
Bonierbale, M.D., Plaisted, R.L., and Tanksley, S.D. (1988).RFLP maps based on a common set of clones reveal modesof chromosomal evolution in potato and tomato. Genetics 120,1095–1103.
Brubaker, C.L., Paterson, A.H., and Wendel, J.F. (1999). Com-parative genetic mapping of allotetraploid cotton and its diploidprogenitors. Genome 42, 184–203.
Burow, M.D., Simpson, C.E., Paterson, A.H., and Starr, J.L.
1536 The Plant Cell
(1996). Tagging of a gene for resistance to Meloidogyne arenariain peanut. Mol. Breeding 2, 369–379.
Chao, S., Sharp, P.J., Worland, A.J., Warham, E.J., Koebner,R.M.D., and Gale, M.D. (1989). RFLP-based genetic maps ofwheat homoeologous group 7 chromosomes. Theor. Appl. Genet.78, 495–504.
Chen, M., SanMiguel, P., de Oliveira, A.C., Woo, S.-S., Zhang, H.,Wing, R.A., and Bennetzen, J.L. (1997). Microcolinearity in thesh2-homologous regions of the maize, rice and sorghumgenomes. Proc. Natl. Acad. Sci. USA 94, 3431–3435.
Chen, M., SanMiguel, P., and Bennetzen, J.L. (1998). Sequenceorganization and conservation in sh2/a1-homologous regions ofsorghum and rice. Genetics 148, 435–443.
Cheung, W.Y., and Landry, B.S. (1996). Current status of genomemapping in the Cruciferae. In Genome Mapping in Plants, A.H.Paterson, ed (Landes Bioscience Press, Austin TX), pp. 193–210.
Chittenden, L.M., Schertz, K.F., Lin, Y.-R., Wing, R.A., and Paterson,A.H. (1994). A detailed RFLP map of Sorghum bicolor 3 S. pro-pinquum suitable for high-density mapping suggests ancestralduplication of chromosomes or chromosomal segments. Theor.Appl. Genet. 87, 925–933.
Chyi, Y.-S., Hoenecke, M.E., and Sernyk, J.L. (1992). A geneticlinkage map of restriction fragment length polymorphism loci forBrassica rapa (syn. campestris). Genome 35, 746–757.
Cohen, D. (1999). Plenary speech, International Plant and AnimalGenome Conference VII, San Diego, CA, 18 January 1999.
Cook, D.R. (1999). Medicago truncatula—A model in the making!Curr. Opin. Plant Biol. 2, 301–304.
Cox, D., Burmeister, M., Price, E., Kim, S., and Myers, R. (1990).Radiation hybrid mapping: A somatic cell genetic method for con-structing high-resolution maps of mammalian chromosomes. Sci-ence 250, 245–250.
Crane, P.R., Friis, E.M., and Raunsgaard-Pedersen, K. (1995).The origin and early diversification of angiosperms. Nature 374,27–33.
da Silva, J., Sorrells, M.E., Burnquist, W., and Tanksley, S.D.(1993). RFLP linkage map and genome analysis of Saccharumspontaneum. Genome 36, 782–791.
da Silva, J., Honeycutt, R.J., Burnquist, W., Al-Janabi, S.M.,Sorrells, M.E., Tanksley, S.D., and Sobral, B.W.S. (1995). Sac-charum spontaneum L. ‘SES 208’ genetic linkage map combiningRFLP- and PCR-based markers. Mol. Breeding 1, 165–179.
Deloukas, P. (1998). A physical map of 30,000 human genes. Sci-ence 282, 744–746.
DeRisi, J.L., Iyer, V.R., and Brown, P.O. (1997). Exploring the met-abolic and genetic control of gene expression on a genomic scale.Science 278, 680–686.
Devos, K., Atkinson, M.D., Chinoy, C.N., Liu, C.J., and Gale, M.D.(1992a). Chromosomal rearrangements in rye genome relative tothat of wheat. Theor. Appl. Genet. 85, 673–680.
Devos, K.M., Atkinson, M.D., Chinoy, C.N., Liu, C.J., and Gale,M.D. (1992b). RFLP-based genetic map of the homoeologousgroup 3 chromosomes of wheat and rye. Theor. Appl. Genet. 83,931–939.
Devos, K.M., Atkinson, M.D., Chinoy, C.N., Liu, C.J., and Gale,M.D. (1993). RFLP-based genetic map of the homoeologousgroup 2 chromosomes of wheat, rye, and barley. Theor. Appl.Genet. 85, 784–792.
Devos, K.M., Dubcovsky., J., Dvorak, J., Chinoy, C.N., and Gale,M.D. (1995). Structural evolution of wheat chromosomes 4A, 5A,and 7B and its impact on recombination. Theor. Appl. Genet.91, 282–288.
Devos, K.M., Beales, J., Nagamura, Y., and Sasaki, T. (1999).Arabidopsis—Rice: Will colinearity allow gene prediction acrossthe eudicot–monocot divide? Genome Res. 9, 825–829.
Dorit, R.L., Schoenbach, L., and Gilbert, W. (1990). How big isthe universe of exons? Science 250, 1377–1382.
Dubcovsky, J., and Dvorak, J. (1995). Ribosomal RNA multi-gene loci: Nomads of the Triticeae genomes. Genetics 140,1367–1377.
Dufour, P., Deu, M., Grivet, L., D’Hont, A., Paulet, F., andGlaszmann, J.C. (1997). Construction of a composite sor-ghum genome map and comparison with sugarcane, a relatedcomplex polyploid. Theor. Appl. Genet. 94, 409–418.
Dunford, R.P., Kurata, N., Laurie, D.A., Money, T.A., Minobe,Y., and Moore, G. (1995). Conservation of fine scale DNAmarker order in the genomes of rice and the Triticeae. NucleicAcids Res. 23, 2724–2728.
Eshed, Y., and Zamir, D. (1996). Less-than-additive epistaticinteractions of quantitative trait loci in tomato. Genetics 143,1807–1817.
Ferreira, M.E., Satagopan, J., Yandell, B.S., and Osborn, T.C.(1994). RFLP mapping of Brassica napus using doubled haploidlines. Theor. Appl. Genet. 89, 615–621.
Figdore, S.S., Ferreira, M.E., Slocum, M.K., and Osborn, T.C.(1993). Association of RFLP markers with trait loci affectingclubroot resistance and morphological characters in Brassicaoleracea. Euphytica 69, 33–44.
Gale, M.D., and Devos, K.M. (1998). Plant comparative geneticsafter 10 years. Science 282, 656–659.
Gaut, B.S., and Doebley, J.F. (1997). DNA sequence evidencefor the segmental allotetraploid origin of maize. Proc. Natl.Acad. Sci. USA 94, 6809–6814.
Goss, S., and Harris, H. (1975). New method for mappinggenes in human chromosomes. Nature 255, 680–684.
Grivet, L., D’Hont, A., Roques, D., Feldmann, P., Lanaud, C.,and Glaszmann, J.C. (1996). RFLP mapping in cultivated sug-arcane (Saccharum spp.): Genome organization in a highlypolyploid and aneuploid interspecific hybrid. Genetics 142,987–1000.
Guimaraes, C.T., Sills, G.R., and Sobral, B.W.S. (1997). Com-parative mapping of Andropogoneae: Saccharum L. (sugar-cane) and its relation to sorghum and maize. Proc. Natl. Acad.Sci. USA 94, 14261–14266.
Halward, T., Stalker, H.T., and Kochert, G. (1993). Develop-ment of an RFLP linkage map in diploid peanut species. Theor.Appl. Genet. 87, 379–384.
Hanson, R.E., Zhao, X., Paterson, A.H., Islam-Faridi, M.N.,Zwick, M.S., Crane, C.F., McKnight, T.D., Stelly, D.M., andPrice, H.J. (1998). Concerted evolution of 20 interspersedrepetitive elements in a polyploid. Am. J. Bot. 85, 1364–1368.

Comparative Genomics of Plants 1537
Hart, G.E. (1983). Genetics and evolution of multilocus isozymes inhexaploid wheat. Isozymes Curr. Top. Biol. Med. Res. 10, 365–380.
Hoenecke, M., and Chyi, Y.-S. (1991). Comparison of Brassicanapus and B. rapa genomes based on restriction fragmentlength polymorphism mapping. In Proceedings of the EighthInternational Rapeseed Congress GCIRC, Saskatoon, D.I.McGregor, ed pp. 1102–1107.
Hohmann, U., Graner, A., and Endo, T.R. (1995). Comparison ofwheat physical maps with barley linkage maps for group 7chromosomes. Theor. Appl. Genet. 91, 618–626.
Hulbert, S.H., Richter, T.E., Axtell, J.D., and Bennetzen, J.L.(1990). Genetic mapping and characterization of sorghum andrelated crops by means of maize DNA probes. Proc. Natl.Acad. Sci. USA 87, 4251–4255.
Huynen, M.A., and Bork, P. (1998). Measuring genome evolu-tion. Proc. Natl. Acad. Sci. USA 95, 5849–5856.
Jiang, C., Wright, R., El-Zik, K., and Paterson, A.H. (1998).Polyploid formation created unique avenues for response toselection in Gossypium (cotton). Proc. Natl. Acad. Sci. USA95, 4419–4424.
Jiang, C., Wright, R., Woo, S.-S., Delmonte, T.A., and Paterson,A.H. (2000). QTL analysis of leaf morphology in tetraploid Gossyp-ium (cotton). Theor. Appl. Genet. 100, 409–418.
Karlin, S., and Altschul, S.F. (1990). Methods for assessing thestatistical significance of molecular sequence features byusing general scoring schemes. Proc. Natl. Acad. Sci. USA87, 2264–2268.
Kianian, S.F., and Quiros, C.F. (1992). Generation of a Brassicaoleracea composite RFLP map: Linkage arrangements amongvarious populations and evolutionary implications. Theor. Appl.Genet. 84, 544–554.
Kilian, A., Kudrna, D.A., Kleinhofs, A., Yano, M., Kurata, N.,Steffenson, B., and Sasaki, T. (1995). Rice–barley syntenyand its application to saturation mapping of the barley Rpg1region. Nucleic Acids Res. 23, 2729–2733.
Kishimoto, N., Higo, H., Abe, K., Arai, S., Saito, A., and Higo,K. (1994). Identification of the duplicated segments in ricechromosomes 1 and 5 by linkage analysis of cDNA markers ofknown functions. Theor. Appl. Genet. 88, 722–726.
Kowalski, S.P., Lan, T.-H., Feldmann, K.A., and Paterson, A.H.(1994). Comparative mapping of Arabidopsis thaliana and Bras-sica oleracea chromosomes reveals islands of conserved orga-nization. Genetics 138, 499–510.
Kurata, N., Moore, G., Nagamura, Y., Foote, T., Yano, M.,Minobe, Y., and Gale, M. (1994). Conversation of genomestructure between rice and wheat. Bio/Technology 12, 276–278.
Lagercrantz, U., and Lydiate, D. (1996). Comparative genomemapping in Brassica. Genetics 144, 1903–1910.
Lan, T.H., Delmonte, T.A., Reischmann, K.P., Hyman, J., Kowalski,S., McFerson, J., Kresovich, S., and Paterson, A.H. (2000a).EST-enriched comparative map of Brassica oleracea and Arabi-dopsis thaliana. Genome Res. 10, 776–788.
Lan, T.H., Kowalski, S., Delmonte, T., and Paterson, A.H.(2000b). Comparative evolution of QTLs sculpting the curd ofBrassica oleracea. Genetics, in press.
Landry, B.S., Hubert, N., Etoh, T., Harada, J., and Lincoln, S.E.(1991). A genetic map for Brassica napus based on restrictionfragment length polymorphisms detected with expressed DNAsequences. Genome 34, 543–552.
Landry, B.S., Hubert, N., Crete, R., Chang, M.S., Lincoln, S.E.,and Etoh, T. (1992). A genetic map of Brassica oleracea based onRFLP markers detected with expressed DNA sequences andmapping resistance genes to race 2 of Plasmodiophora brassicae(Woronin). Genome 35, 409–419.
Lee, J.S., and Verma, D.P. (1984). Structure and chromosomalarrangement of leghemoglobin genes in kidney bean suggestdivergence in soybean leghemoglobin gene loci followingtetraploidization. EMBO J. 3, 2745–2752.
Leister, D., Kurth, J., Laurie, D.A., Yano, M., Sasaki, T.,Devos, K., Graner, A., and Schulze-Leifert, P. (1998). Rapidreorganization of resistance gene homologues in cereal chro-mosomes. Proc. Natl. Acad. Sci. USA 95, 370–375.
Lewis, E.B. (1950). The phenomenon of position effect. Adv.Genet. 3, 73–115.
Lin, Y., Draye, X., Qian, X., Ren, S., Zhu, L., and Paterson,A.H. (2000). Fine-scale mapping and sequence-ready contigassem-bly in highly-duplicated genomes, using the BAC-RFmethod. Nucleic Acids Res. 28, e23. http://www3.oup.co.uk/nar/methods/Volume_28/Issue_07/gnd023_gml.abs.html.
Liu, C.J., Atkinson, M.D., Chinoy, C.N., and Gale, M.D. (1992).Nonhomoeologous translocations between group 4, 5, and 7 chro-mosomes within wheat and rye. Theor. Appl. Genet. 83, 305–312.
Liu, Y.G., and Tsunewaki, K. (1991). Restriction fragment lengthpolymorphism (RFLP) analysis in wheat. II. Linkage maps ofthe RFLP sites in common wheat. Jpn. J. Genet. 66, 617–633.
Livingstone, K.D., Lackney, V.K., Blauth, J.R., van Wijk, R.,and Jahn, M.K. (1999). Genome mapping in Capsicum andthe evolution of genome structure in the Solanaceae. Genetics152, 1183–1202.
Lydiate, D., Sharpe, A., Lagercrantz, U., and Parkin, I. (1993).Mapping the Brassica genome. Outlook Agric. 2, 85–92.
Marino, C.L., Nelson, J.C., Lu, Y.H., Sorrells, M.E., Leroy, P.,Tuleen, N.A., Lopes, C.R., and Hart, G.E. (1996). RFLP-based link-age maps of the homoeologous group 6 chromosomes of hexaploidwheat (Triticum aestivum L. em. Thell). Genome 39, 359–366.
Masterson, J. (1994). Stomatal size in fossil plants: Evidence forpolyploidy in majority of angiosperms. Science 264, 421–424.
Matzke, M.A., and Matzke, A.J.M. (1998). Polyploidy and trans-posons. Trends Ecol. Evol. 13, 241.
Menacio-Hautea, D., Fatokum, C.A., Kumar, L., Danesh, D.,and Young, N.D. (1993). Comparative genome analysis ofmungbean (Vigna radiata L. Wilczek) and cowpea (V. unguicu-lata) using RFLP analysis. Theor. Appl. Genet. 86, 797–810.
Mickelson-Young, L., Endo, T.R., and Gill, B.S. (1995). A cyto-genetic ladder-map of the wheat homoeologous group-4 chro-mosomes. Theor. Appl. Genet. 90, 1007–1011.
Ming, R., et al. (1998). Alignment of the Sorghum and Saccharumchromosomes: Comparative genome organization and evolu-tion of a polysomic polyploid genus and its diploid cousin.Genetics 150, 1663–1682.
Morden, C.W., Doebley, J.F., and Schertz, K.F. (1989). Allozyme
1538 The Plant Cell
variation in old world races of Sorghum bicolor (Poaceae). Am. J.Bot. 76, 247–255.
Mudge, J., Anderson, W.R., Kehrer, R.L., and Fairbanks, D.J.(1996). A RAPD genetic map of Saccharum officinarum. Crop Sci.36, 1362–1366.
Nagamura, Y., et al. (1995). Conservation of duplicated segmentsbetween rice chromosomes 11 and 12. Breeding Sci. 45, 373–376.
Namuth, D.M., Lapitan, N.L.V., Gill, K.S., and Gill, B.S. (1994).Comparative RFLP mapping of Hordeum vulgare and Triticumtauschii. Theor. Appl. Genet. 89, 865–872.
Naranjo, T., Roca, A., Goicoechea, P.G., and Giraldez, R. (1987). Armhomoeology of wheat and rye chromosomes. Genome 29, 873–882.
Nelson, J.C., Van Deynze, A.E., Autrique, E., Sorrells, M.E., Lu, Y.H.,Merlino, M., Atkinson, M., and Leroy, P. (1995a). Molecular map-ping of wheat. Homoeologous group 2. Genome 38, 116–124.
Nelson, J.C., Van Deynze, A.E., Autrique, E., Sorrells, M.E., Lu,Y.H., Negre, S., Bernard, M., and Leroy, P. (1995b). Molecularmapping of wheat. Homoeologous group 3. Genome 38, 125–133.
Nelson, J.C., Sorrells, M.E., Van Deynze, A.E., Lu, Y.H., Atkinson,M., Bernard, M., Leroy, P., Faris, J.D., and Anderson, J.A. (1995c).Molecular mapping of wheat. Major genes and rearrangements inhomoeologous groups 4, 5, and 7. Genetics 141, 721–731.
O’Brien, S.J., Womack, J.E., Lyons, L.A., Moore, K.J., Jenkins,N.A., and Copeland, N.G. (1993). Anchored reference loci for com-parative genome mapping in mammals. Nat. Genet. 3, 103–112.
Paterson, A.H., DeVerna, J., Lanini, B., and Tanksley, S.D. (1990).Fine mapping of quantitative trait loci using selected overlappingrecombinant chromosomes, from an interspecies cross of tomato.Genetics 124, 735–742.
Paterson, A.H., Lin, Y.R., Li, Z., Schertz, K.F., Doebley, J.F., Pinson,S.R.M., Liu, S.C., Stansel, J.W., and Irvine, J.E. (1995). Conver-gent domestication of cereal crops by independent mutations atcorresponding genetic loci. Science 269, 1714–1718.
Paterson, A.H., et al. (1996). Toward a unified map of higher plantchromosomes, transcending the monocot–dicot divergence. Nat.Genet. 14, 380–382.
Pearson, W.R. (1997). Identifying distantly related protein se-quences. Comput. Appl. Biol. Sci. 13, 325–332.
Peltonen, L., and Uusitalo, A. (1997). Rare disease genes: Lessonsand challenges. Genome Res. 7, 765–767.
Pereira, M.G., Lee, M., Bramel-Cox, P., Woodman, W., Doebley,J., and Whitkus, R. (1994). Construction of an RFLP map in sor-ghum and comparative mapping in maize. Genome 37, 236–243.
Prince, J., Pochard, P.E., and Tanksley, S.D. (1993). Constructionof a molecular linkage map of pepper, and a comparison of syn-teny with tomato. Genome 36, 404–417.
Rabinowicz, P.D., Braun, E.L., Wolfe, A.D., Bowen, B., andGrotewald, E. (1999). Maize R2R3 Myb genes. Sequence analysisreveals amplification in the higher plants. Genetics 153, 427–444.
Reinisch, A.R., Dong, J.-M., Brubaker, C., Stelly, D., Wendel, J.,and Paterson, A.H. (1994). An RFLP map of cotton (Gossypiumhirsutum 3 G. barbadense): Chromosome organization and evolu-tion in a disomic polyploid genome. Genetics 138, 829–847.
SanMiguel, P., and Bennetzen, J.L. (1998). Evidence that a recentincrease in maize genome size was caused by the massive ampli-fication of intergene retrotransposons. Ann. Bot. 82, 37–44.
SanMiguel, P., Tikhonov, A., Jin, Y.-K., Motchoulskaia, N.,Zakharov, D., Melake-Berhan, A., Springer, P.S., Edwards,K.J., Lee, M., Avramova, Z., and Bennetzen, J.L. (1996). Nestedretrotransposons in the intergenic regions of the maize genome.Science 274, 765–768.
SanMiguel, P., Gaut, B., and Bennetzen, J.L. (1998). The paleontol-ogy of intergene retrotransposons in maize. Nat. Genet. 20, 43–45.
Shultz, O.E. (1936). In Die Natürlichen Pflanzenfamilien, A. Englerand H. Harms, eds Vol. 17b, pp. 227–658.
Simmonds, N.W. (1976). Evolution of Crop Plants. Essex: LongmanScientific and Technical.
Slocum, M.K., Figdore, S.S., Kennard, W.C., Suzuki, J.Y., andOsborn, T.C. (1990). Linkage arrangement of restriction fragmentlength polymorphism loci in Brassica oleracea. Theor. Appl.Genet. 80, 57–64.
Sobral, B.W.S., Braga, D.P.V., LaHood, E.S., and Keim, P. (1994).Phylogenetic analysis of chloroplast restriction enzyme site muta-tions in the Saccharinae Griseb. Subtribe of the AndropogoneaeDumort. Tribe. Theor. Appl. Genet. 87, 843–853.
Soltis, D.E., and Soltis, P.S. (1993). Molecular data and thedynamic nature of polyploidy. Crit. Rev. Plant Sci. 12, 243–273.
Song, K.M., Suzuki, J.Y., Slocum, M.K., Williams, P.H., andOsborn, T.C. (1991). A linkage map of Brassica rapa (syn.campestris) based on restriction fragment length polymorphismloci. Theor. Appl. Genet. 82, 296–304.
Song, K., Lu, P., Tang, K., and Osborn, T.C. (1995a). Rapidgenome change in synthetic polyploids of Brassica and its impli-cations for polyploid evolution. Proc. Natl. Acad. Sci. USA 92,7719–7723.
Song, K., Slocum, M.K., and Osborn, T.C. (1995b). Molecularmarker analysis of genes encoding morphological variation inBrassica rapa (syn. campestris). Theor. Appl. Genet. 90, 1–10.
Stebbins, G.L. (1966). Chromosomal variation and evolution; poly-ploidy and chromosome size and number shed light on evolution-ary processes in higher plants. Science 152, 1463–1469.
Tanksley, S.D., Bernatzky, R., Lapitan, N.L., and Prince, J.P.(1988). Conservation of gene repertoire but not gene order in pep-per and tomato. PNAS-USA 85, 6419–6423.
Tanksley, S.D., et al. (1992). High density molecular linkage mapsof the tomato and potato genomes. Genetics 132, 1141–1160.
Tatusov, R.L., Koonin, E.V., and Lipman, D.J. (1997). A genomicperspective on protein families. Science 278, 631–637.
Teutonico, R.A., and Osborn, T.C. (1994). Mapping of RFLP andqualitative trait loci in Brassica rapa, and comparison to linkagemaps of B. napus, B. oleracea, and Arabidopsis thaliana. Theor.Appl. Genet. 89, 885–894.
Tikhonov, A.P., SanMiguel, P.J., Nakajima, Y., Gorenstein, N.D.,Bennetzen, J.L., and Avramova, Z. (1999). Colinearity and itsexceptions in orthologous adh regions of maize and sorghum.Proc. Natl. Acad. Sci. USA 96, 7409–7414.
Torres, A.M., Weeden, N.F., and Martin, A. (1993). Linkage amongisozyme, RFLP, and RAPD markers in Vicia faba. Theor. Appl.Genet. 85, 937–945.
Truco, M.J., Hu, J., Sadowski, J., and Quiros, C.F. (1996). Inter-and intra-genomic homology of the Brassica genomes: Implica-
Comparative Genomics of Plants 1539
tions for their origin and evolution. Theor. Appl. Genet. 93, 1225–1233.
Uzunova, M., Ecke, W., Weissleder, K., and Robbelen, G. (1995).Mapping of the genome of rapeseed (Brassica napus L.). I. Con-struction of an RFLP linkage map and localization of QTLs forseed glucosinolate content. Theor. Appl. Genet. 90, 194–204.
Van Deynze, A.E., Dubcovsky, J., Gill, K.S., Nelson, J.C. Sorrells,M.E., Dvorak, J., Gill, B.S., Lagudah, E.S., McCouch, S.R., andAppels, R. (1995). Molecular-genetic maps for chromosome 1 inTriticeae species and their relation to chromosomes in rice andoats. Genome 38, 47–59.
Vavilov, N.I. (1922). The law of homologous series in variation. J.Genet. 12, 1.
Wang, G., Dong, J., and Paterson, A.H. (1995). The distribution ofGossypium hirsutum chromatin in G. barbadense germplasm:Molecular analysis of introgressive plant breeding. Theor. Appl.Genet. 91, 1153–1161.
Wang, R.-L., Stec, A., Hey, J., Lukens, L., and Doebley, J. (1999).The limits of selection during maize domestication. Nature 398,236–239.
Weeden, N.L., Muehlbauer, F.J., and Ladizinsky, G. (1992). Exten-sive conservation of linkage relationships between pea and lentilgenetic maps. J. Hered. 83, 123–129.
Wendel, J.F. (1989). New World cottons contain Old World cyto-plasm. Proc. Natl. Acad. Sci. USA 86, 4132–4136.
Wendel, J.F., Stuber, C.W., Edwards, M.D., and Goodman, M.M.(1986). Duplicated chromosome segments in maize (Zea mays L.):Further evidence from hexokinase isozymes. Theor. Appl. Genet.72, 178–185.
Wendel, J.F., Stuber, C.W., Goodman, M.M., and Beckett, J.B.(1989). Duplicated plastic and triplicated cytosolic isozymes of tri-osephosphate isomerase in maize (Zea mays L.). J. Hered. 80,218–228.
Whitkus, R., Doebley, J., and Lee, M. (1992). Comparative genomemapping of sorghum and maize. Genetics 132, 119–130.
Wolfe, K.H., Gouy, M., Yang, Y.W., Sharp, P.M., and Li, W.H.(1989). Date of the monocot–dicot divergence estimated fromchloroplast DNA sequence data. Proc. Natl. Acad. Sci. USA 86,6201–6205.
Wright, R., Thaxton, P., Paterson, A.H., and El-Zik, K. (1998).Polyploid formation in Gossypium has created novel avenues forresponse to selection for disease resistance. Genetics 149, 1987–1996.
Wu, K.K., Burnquist, W., Sorrells, M.E., Tew, T.L., Moore, P.H.,and Tanksley, S.D. (1992). The detection and estimation of link-age in polyploids using single-dose restriction fragments. Theor.Appl. Genet. 83, 294–300.
Xie, D.X., Devos, K.M., Moore, G., and Gale, M.D. (1993). RFLP-based genetic maps of the homoeologous group 5 chromosomes ofbread wheat (Triticum aestivum L.). Theor. Appl. Genet. 87, 70–74.
Zhao, X., Si, Y., Hanson, R., Price, H.J., Stelly, D., Wendel, J., andPaterson, A.H. (1998). Dispersed repetitive DNA has spread tonew genomes since polyploid formation in cotton. Genome Res.8, 479–492.
Zhang, Q., Arbuckle, J., and Wessler, S.R. (2000). Recent, exten-sive and preferential insertion of members of the MITE familyHeartbreaker (Hbr) into genic regions of maize. Proc. Natl. Acad.Sci. USA, in press.

1540 The Plant Cell

DOI 10.1105/tpc.12.9.1523 2000;12;1523-1539Plant Cell
Jiang, Catherine Susan Katsar, Tien-Hung Lan, Yann-Rong Lin, Reiguang Ming and Robert J. WrightAndrew H. Paterson, John E. Bowers, Mark D. Burow, Xavier Draye, Christine G. Elsik, Chun-Xiao
Comparative Genomics of Plant Chromosomes
This information is current as of November 16, 2018
References /content/12/9/1523.full.html#ref-list-1
This article cites 113 articles, 46 of which can be accessed free at:
Permissions https://www.copyright.com/ccc/openurl.do?sid=pd_hw1532298X&issn=1532298X&WT.mc_id=pd_hw1532298X
eTOCs http://www.plantcell.org/cgi/alerts/ctmain
Sign up for eTOCs at:
CiteTrack Alerts http://www.plantcell.org/cgi/alerts/ctmain
Sign up for CiteTrack Alerts at:
Subscription Information http://www.aspb.org/publications/subscriptions.cfm
is available at:Plant Physiology and The Plant CellSubscription Information for
ADVANCING THE SCIENCE OF PLANT BIOLOGY © American Society of Plant Biologists