US Corporate Agribusiness and Farms: A Comparative Analysis of Agricultural Policy

1
Comparative Financial Performance of
Agricultural Cooperatives and Investor-Owned Firms
This study researches the validity of claims that cooperatives are destroying value by comparing
the financial performance of agricultural cooperatives with investor-owned firms in four
sectors—dairy, farm supply, fruit and vegetable, and grain. Traditional financial ratios
measuring profitability, liquidity, leverage and asset efficiency were analyzed for 1991 through
2002. Overall, the financial performances of agricultural cooperatives and their investor-owned
counterparts were comparable. Consistent with theoretical expectations, cooperatives
demonstrated lower rates of asset efficiency, except in the dairy sector. Cooperatives in all four
sectors were less leveraged, while results regarding the relative profitability and liquidity of
cooperatives were not conclusive.

1
Comparative Financial Performance of
Agricultural Cooperatives and Investor-Owned Firms
Introduction
Reports regarding the financial difficulties experienced by agricultural cooperatives in the US
have been much more common recently than news of cooperatives’ successes. In particular, the
bankruptcy of Farmland Industries, the nation’s largest agricultural cooperative, has received
considerable media attention. In California, news about cooperatives has centered on Tri Valley
Growers’ bankruptcy and the dissolutions of the Rice Growers Association of California and
Blue Anchor.
An international management consulting firm, McKinsey & Company, issued a report in
2002 alleging that agricultural cooperatives “destroy value” because few cooperatives “…have
changed the way they operate…” (Dempsey, Kumar, Loyd and Merkel). Several financial ratios
for cooperatives (revenue growth, return on assets and operating margins) were calculated which
indicated weak performance in the cooperative sector. Another performance measure, ”valued
created,” was also analyzed; it was based on “return on invested capital,” which was calculated
by dividing total net operating profits by the total dollar value of capital invested. Distribution of
the report led to discussions among top management of agricultural cooperatives and academics
regarding rates of return generated by agricultural cooperatives.
Such news creates doubt about the viability of the cooperative form of business in
agriculture, causing members to question their cooperative’s performance and/or become
reluctant to proceed in organizing a future venture under the cooperative structure. Furthermore,
2
it raises concerns among cooperatives’ lenders. Are such doubts justified? What is the future for
agricultural cooperatives in California?
One approach to evaluating this issue objectively is to compare the financial performance
of agricultural cooperatives with that of investor owned firms (IOFs) in similar industries. To
develop this research, findings from previous studies are reviewed and the implications of the
cooperative principles on cooperative behavior are discussed.
Previous Studies
As noted in a comprehensive review by Sexton and Iskow, there are two categories of empirical
studies regarding the efficiency of cooperatives—those based on concepts of economic
efficiency and those involving financial ratios. Among the economic efficiency studies, Porter
and Scully utilized a production function approach to conclude that dairy cooperatives were less
efficient than their IOF counterparts. Sexton, Wilson and Wann tested the allocative efficiency
of cotton ginning cooperatives and rejected the argument that cooperatives tend to underutilize
capital. Akridge and Hertel tested costs differences between grain and farm supply cooperatives
and IOFs using a generalized translog multiproduct cost function. They found that the
cooperatives had a small efficiency advantage but it was statistically insignificant. Sexton and
Iskow noted that these studies failed to consider the field services, market information, lobbying
and ancillary services often provided by cooperatives; such ancillary services will increase a
cooperative’s production costs, leading to the incorrect conclusion that cooperatives are
inefficient.
Three extensive studies of the comparative financial performance of agricultural
cooperatives and IOFs were conducted during the late 1970s and 1980s. Schrader, et al.

3
summarized the findings of their study related to Midwestern cooperatives conducted between
1979 and 1983 using financial reports and opinion surveys; their results were mixed. They found
that IOFs and cooperatives operating cheese plants, grain elevators and farm supply firms had
similar rates on return on assets. However, large, diversified agribusiness IOFs had significantly
higher rates of return on assets than did comparable cooperatives. With regard to capital
structure, Schrader, et al. found that IOFs operating cheese plants, grain elevators and farm
supply firms were more highly leveraged than comparable cooperatives. However, large,
diversified agribusiness IOFs had significantly less leverage than did comparable cooperatives.
In the grain elevator, farm supply and cheese plant sectors, they determined that cooperatives
were less efficient with their assets (had lower asset turnover ratios) than their IOF counterparts;
however large, diversified agribusiness cooperatives were more efficient than comparable IOFs.
Lerman and Parliament analyzed financial data from 1976 through 1987 in their study
comparing the financial performance of 18 regional cooperatives with that of comparable IOFs.
Their study was limited to firms with average asset size between $10 million and $100 million.
They determined that in both the fruit and vegetable processing and dairy sectors, cooperatives
and IOFs were leveraged similarly and generated similar rates of return to equity. Both the
liquidity and asset efficiency of fruit and vegetable processing IOFs were greater than that of
cooperatives, but these results were reversed in the dairy sector. Thus, their findings were
mixed, similar to those reported by Schrader, et al.
Parliament, Lerman and Fulton compared the financial performance of the two types of
dairy firms between 1976 and 1987. They concluded that the cooperatives performed
significantly better than the IOFs with respect to leverage, liquidity and asset efficiency.
However, the differences between the two types of firms regarding rates of return to equity were

4
not statistically significant. They also reviewed a broad range of nonmarket benefits that
cooperatives can provide to their members.
Sexton and Iskow pointed out how such analyses of financial ratios, although popular, is
not based on economic theory. Furthermore, they noted that cooperatives represent the vertical
integration of the producers’ firms; thus, it is inappropriate to evaluate “..performance of the
joint entity by examining data for only a portion of the entity…”(p.22). In particular, different
outcomes regarding profitability measures can be obtained likely by merely shifting income from
one entity to the other. A cooperative could be less profitable than an IOF and still be desirable
to a member—as long as the member’s discounted stream of returns from the cooperative were
greater than those from marketing the commodity directly or through an IOF.
These criticisms are all valid; however, the theoretically sound approaches are
impractical to use because of data limitations. Furthermore, critical stakeholders associated with
cooperatives—members, management and lenders—are more concerned with financial ratios
than they are about measures of economic efficiency. Thus, this study will be based on financial
ratios; hypotheses regarding the relative financial performance of cooperatives and IOFs are
developed in the following section using the theory of cooperative behavior.
Implications of Cooperative Behavior on Financial Performance
Cooperatives operate differently from IOFs because of the three basic cooperative principles that
define the essence of a cooperative enterprise: user-owned, user-benefit and user-control. These
principles have been incorporated into government regulations, and the federal and state tax
codes. This legal integration of the cooperative principles has significantly affected the
organizational behavior of agricultural cooperatives in the US. Hypotheses regarding their
5
impact on key indicators of financial performance—profitability, liquidity, leverage and asset
efficiency—are developed below using analyses from previous studies.
In their review, Sexton and Iskow summarized various studies that evaluate how the
cooperative structure can affect relative financial performance. They cite several studies that
hypothesized how cooperatives are inefficient relative to IOFs because of the principal-agent
problem (such as Porter and Scully). Porter and Scully also argue that the horizon problem has
caused cooperatives to focus on short-term earnings at the expense of long-term opportunities.
Cooperatives’ profitability is also impaired when they lack sufficient patronage to achieve the
cost-minimizing scale of operation. Furthermore, Gruber, Rogers and Sexton determined that
cooperatives are more likely than IOFs to participate in commodity-oriented markets with
considerable product homogeneity and low margins. Conversely, Sexton and Iskow also
described how cooperatives can achieve cost savings by internalizing transactions through
vertical integration and having better information flows than their IOF counterparts.
In presenting their hypotheses regarding the comparative financial performance of
cooperatives and IOFs, Lerman and Parliament stated that the differences are due to divergences
in “objectives and strategy” between the two types of firms. They discuss how cooperatives are
not considered to be rate-of-return maximizers; their members traditionally expect to receive
their returns in the form of improved market access or lower input prices, rather than a direct
return on their equity investment in their cooperative. These service benefits reduce
cooperatives’ rates of return by lowering revenues and increasing costs. It is expected that the
net effect of these considerations on cooperatives’ relative profitability is negative.
Due to the user-financed principle, most cooperatives obtain most of their equity capital
through capital retains imposed on member-producers. Lerman and Parliament hypothesized

6
that the illiquid nature of cooperatives’ equity constrains their ability to raise capital from their
members; consequently, cooperatives need to rely more heavily on debt financing than IOFs.
Furthermore, they assert that the cooperative structure encourages moral hazard behavior,
resulting in higher debt and more risk taking than their IOF counterparts.
This hypothesis is contrary to the well-known Modigliani-Miller theory of capital
structure which argues that the US tax laws foster the high use of debt financing by shareholder
corporations (Ross, Westerfield and Jaffe). Since cooperatives have the ability to pass through
earnings on their patronage income without taxation to their members, they do not have the same
incentive as shareholder corporations to maximize their use of debt financing. When these tax
considerations are combined with cooperatives’ restricted access to equity capital, the net effect
on the relative use of leverage by the two types of firms becomes unclear.
With regard to asset efficiency, Lerman and Parliament assert that moral hazard
considerations suggest that cooperatives are less discriminating in undertaking investments than
IOFs, increasing their relative leverage (and decreasing their relative liquidity). They may also
not acknowledge the opportunity cost of member equity. Such behavior could also lead them to
carry higher inventory levels relative to their sales, further impairing their overall asset
efficiency.
As discussed above, there are numerous behavioral differences between cooperatives and
IOFs that are attributable to the cooperative principles. These differences have implications on
cooperatives’ financial performance--particularly their profitability, capital structure, liquidity
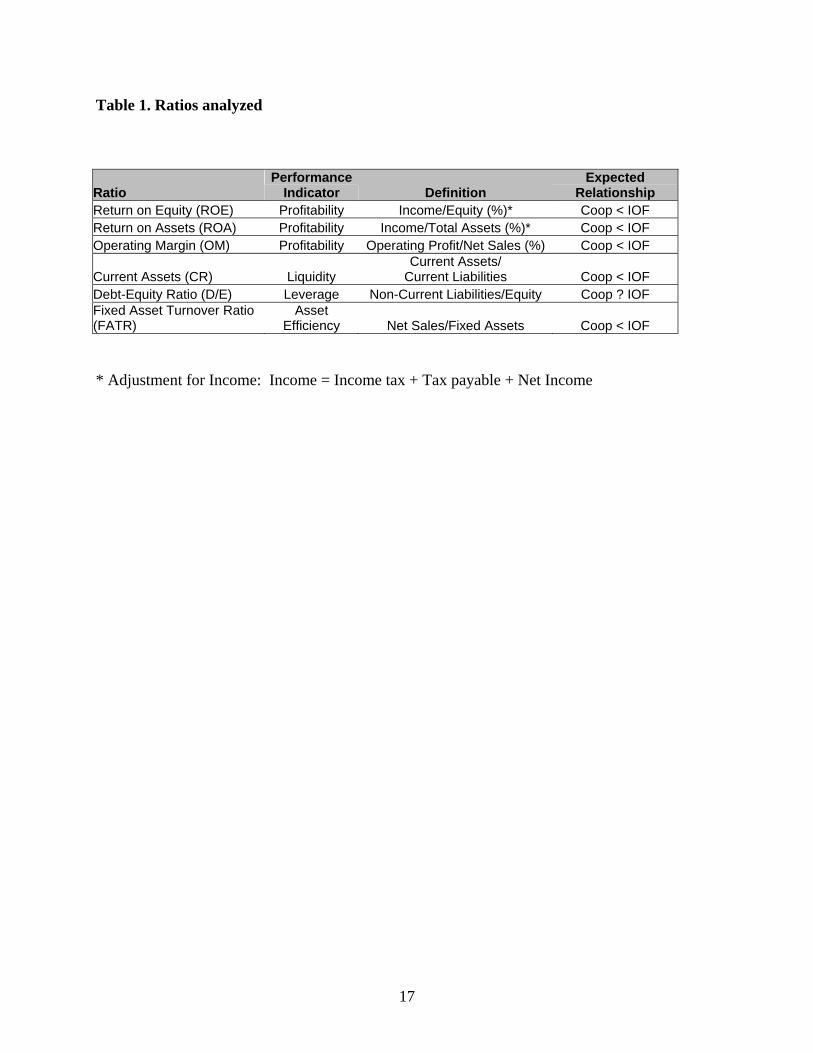
and asset efficiency. The financial ratios used in this study are displayed in Table 1, along with
the expected relationships of these ratios between cooperatives and IOFs.

7
Description of the Data
Key financial ratios of West Coast agricultural cooperatives are compared to those of similar
IOFs in select sectors, using data reported in the firms’ annual reports over the 12-year period,
1991 through 2002. The data for the research included a sample of 41 cooperatives in California,
Oregon and Washington. Listed below is the sectoral mix of cooperatives:
• 5 cooperatives from the dairy sector
• 14 cooperatives from the farm supply sector
• 11 cooperatives from the fruit and vegetable sector
• 11 cooperatives from the grain sector
Financial statements of cooperatives were provided by CoBank, the largest lender to
agricultural cooperatives in the US. Financial ratios were calculated from their qualified annual
reports for the period 1991-2002. For each observation year, the aggregates of two variables
comprising each ratio were calculated; then these aggregates were used to compute the ratios for
each year for each sector. For example, the current ratio for dairy sector was calculated by
adding the current assets of all five cooperatives in the sector and dividing this sum by the sum
of current liabilities for these five cooperatives. Hence, 24 time series (six ratios for each sector)
of 12 aggregated ratio observations were derived.
Financial data for comparable IOFs were difficult to obtain. Data for publicly traded
companies are readily available from their required report filings and services that compile
databases from these reports; however, such companies proved to be much larger (as measured
by sales) than the cooperatives in the data set. Previous experience indicated that making direct
requests for time series of financial data from nonpublic companies would be unsuccessful.
Instead, published financial data for IOFs were obtained from Risk Management Association

8
(RMA) Annual Statement Studies, which report a selection of median financial ratios as well as
aggregated financial variables for a wide range of industries. The data are reported by the
association’s bank members; the vast majority of the data set is for nonpublic companies.
Clearly, it is a major shortcoming that these IOF data represent aggregated observations of
companies within a SIC code rather than the individual company data; however, no other sources
for such data were found. Given the nature of the RMA data, the data for the individual
cooperatives were aggregated similarly to maintain their comparability. This aggregation
method effectively weighted the sample by firm size.
Financial ratios were calculated from these aggregate financial variables for IOFs, rather than
using the median financial ratios provided by RMA, to match the ratios calculated for the
cooperatives. IOFs with operations comparable to the cooperatives were represented by the
following SICs:
• Dairy:
o 2021: Manufacturers-Dairy Products/Manufacturing Creamery Butter
o 2022: Manufacturing-Natural, Processed & Imitation Cheese
o 2026: Manufacturing-Fluid Milk
• Farm Supply:
o 5191: Wholesalers Farm Supplies
• Fruits & Vegetables:
o 2033: Manufacturers-Canned & Dried Fruits & Vegetables/Manufacturers -
Canned Fruits, Vegetables, Preserves, Jams & Jellies
o 2037: Manufacturers-Frozen Fruits, Fruit Juices & Vegetables
o 5148: Wholesalers - Fresh Fruits & Vegetables

9
• Grain:
o 2041: Manufacturers-Flour & Other Grain Mill Products
o 5153: Wholesalers-Grain & Field Beans
Over the range of years covered by the study, the number of IOFs included in the RMA
database ranged from:
20 to 162 for dairy sector
297 to 1024 for farm supply sector
27 to 268 for fruits & vegetables sector
28 to 291 for grain sector
In addition to being comparable in operations, the IOFs were comparable to the
cooperatives with respect to their average total assets (Table 2).
Model and Results
To detect significant differences between the financial performance of cooperatives and IOFs,
the time series of aggregated financial ratios in each sector were analyzed using simple linear
regression.
Model: Rijt - Rc
jt = b0j + b1jTt
Rijt = IOF financial ratio
Rcjt = Cooperative financial ratio
b0j = Intercept coefficient
b1j = Slope coefficient
Tt = Time in years (0, 1….11)

10
H0: b0j = 0
H1: b1j = 0
Significance level = 0.05
This approach differs considerably from the tests for significant differences utilized in the
Lerman-Parliament (Kruskal-Wallis) and Parliament-Lerman-Fulton (Wilcoxon rank-sums)
studies. Their tests did not capture the time series nature of their data. This regression model is
structured as a paired differences tests; it estimates whether there is a linear pattern in how
differences in financial performance between the two types of firms change over time. The
time trend specifically tests the claim made by McKinsey & Company that there has been recent
deterioration in cooperatives’ performance. If this were to be the case, the intercept coefficient
could be zero but the slope coefficient for each financial indicator would be positive, with the
exception of the debt-equity ratio (where cooperatives’ recent deterioration would be signaled by
a negative coefficient). If, instead, the differences in profitability between the two types of firms
remained constant over the entire time series, then the R2 would be zero but the estimated
intercept coefficient would be highly significant. Different combinations of significant
coefficients are interpreted in Table 3.
The regression results were tested for autocorrelation using the Durbin Watson test
(DW). While the DW test requires a minimum of 15 observations, the test was conducted on
only 12 observations using the values for 15 observations from the DW table as an
approximation. Autocorrelation was corrected for using the Cochrane-Orcutt iterative method.
The regression results are presented in Table 4. The proportion of variation in the
difference in ratios between IOFs and cooperatives that is explained by the estimated equations

11
ranges from .00 to .67. It is also informative to review the graphs for each ratio within each
sector; these are included at the end of this report.
Interpretation of Regression Results
The significance and signs of the estimated coefficients are displayed below for each ratio. The
poor fit of the estimated equations is attributable partly to the small number of observations.
Profitability
DAIRY FRUIT and VEG GRAIN FARM
SUPPLY constant time constant time constant time constant time
ROE no + yes - no - no + yes - no + no + no +ROA no + no - no - no + yes - no + no - no +OM yes + no + yes - no + yes - yes + no + no +
Profitability results for the dairy sector were mixed (Figures 1, 2 and 3). While cooperatives’
ROEs were increasing significantly relative to those of their IOF counterparts over time (with a
similar result regarding their ROAs that was weakly significant), cooperatives’ operating
margins remained .81 percentage points lower than the IOFs during the entire period of analysis.
As previously noted, cooperatives’ lower operating margins may be due to their general tendency
to market a larger proportion of generic, undifferentiated products.
All three profitability measures for fruit and vegetable cooperatives (Figures1, 2 and 3)
indicate cyclical returns that are not experienced by their stable IOF counterparts. The cyclical
earnings could be attributable to cooperatives’ tendency to concentrate on generic, low value-
added products whose profitability is more vulnerable to international market conditions than
that of more differentiated products. Over the time period, however, cooperatives averaged

12
higher margins than the IOFs, as indicated by the statistically significant negative coefficient for
the intercept.
The estimation results for all three profitability measures indicated that while grain
cooperatives had higher profitability initially than their IOF counterparts, they have been losing
this advantage. As indicated in Figures 1, 2 and 3, the profitability measures for grain
cooperatives and IOFs were essentially equal in 2002.
For the farm supply sector, both the regression results and graphs (Figures 1, 2 and 3)
indicate that the profitability of farm supply cooperatives and IOFs are comparable.
Liquidity
DAIRY FRUIT and VEG GRAIN FARM SUPPLY constant time constant time constant time constant time
CR no + no + yes + no - yes + yes - yes - yes +
The liquidity of both types of firms has remained relatively stable over time (Figure 4).
The negative significant constant coefficient for the fruit and vegetable sector, along with the
graph in Figure 4, indicate that the liquidity of IOFs has been a steady .2 points higher than that
of their cooperative counterparts throughout the time period. Meanwhile, grain cooperatives
have improved their liquidity relative to IOFs. Conversely, the estimated coefficients for the
farm supply sector indicate that the liquidity of cooperatives was declined relative to that of
IOFs.
Debt/Equity
DAIRY FRUIT and VEG GRAIN FARM SUPPLY constant time constant time constant time constant time
D/E yes + no - yes + no + yes + no + yes + no -

13
In each sector, cooperatives consistently maintained significantly lower leverage than
their IOF counterparts (Figure 5). There were no significant changes in these differences over
time. These leverage results are the most consistent findings in this study. As previously noted,
this could be attributable to the debt financing incentives created by the corporate income tax
code; this incentive is much weaker for cooperatives because patronage income is generally
passed through to members without taxation.
Fixed Asset Turnover Ratio
DAIRY FRUIT and VEG GRAIN FARM SUPPLY constant time constant time constant time constant time
FATR yes - yes + yes + no + yes + yes - yes + no -
In three of the four sectors, cooperatives started with significantly lower asset efficiency
than their IOF counterparts; however, grain cooperatives improved their asset utilization over
time. The fruit and vegetable cooperatives’ significantly lower asset utilization is very
noticeable (Figure 6); the cooperatives averaged $6 less in sales per dollar of fixed assets than
their IOF counterparts. Dairy cooperatives initially had higher asset efficiency than the IOFs, but
their relative advantage declined over time.
Summary and Conclusions
This twelve-year review of the comparative financial performance of cooperatives and IOFs
covered four major agricultural sectors. It was expected that cooperatives would be less
profitable than IOFs in the same sector. The only consistent finding regarding profitability was
that all three of the profitability ratios of grain cooperatives were higher than those of their IOF

14
counterparts; however, the grain cooperatives’ relative advantage decreased over time. For the
other three sectors, relative performance varied with the specific profitability measure.
In two of the four sectors, cooperatives had less liquidity than their IOF competitors; this
was expected because cooperatives are under pressure to redeem member equity. Farm supply
cooperatives initially had higher liquidity than the IOFs, but this advantage diminished over
time. Conversely, the relative liquidity of grain cooperatives improved over time.
Cooperatives consistently maintained lower leverage levels than their IOF counterparts.
These results are similar to those of Schrader, etal., and contrary to those of Lerman and
Parliament who had found similar levels of leverage for both types of fruit and vegetable firms
and dairy firms. It appears that the effects from US tax laws fostering the high use of debt
financing by shareholder corporations outweigh the effects from cooperatives’ constrained
access to equity capital. Another explanation for cooperatives’ lower leverage levels could relate
to the fact that it is more difficult for cooperatives than IOFs to spread their risks by diversifying
into other business activities; thus, cooperatives’ management may be more risk averse and
pursue more conservative business strategies than their IOF competitors. Cooperatives’ lower
leverage levels warrant further research.
The regression results and visual observation indicate that cooperatives had lower asset
efficiency than their IOF counterparts in three of the four sectors evaluated (grain, fruit and
vegetable and farm supply). This is consistent with the theory of cooperative behavior;
cooperatives are expected to provide a home for their members’ product and need to maintain
excess capacity. It is not surprising that this hypothesis did not hold for dairy cooperatives, since
dairy producers tend to have consistent production volumes and market their production through
only one source—reducing their cooperative’s need for excess capacity.

15
Overall, cooperatives had the strongest relative financial performance in the grain sector.
They had less leverage than their IOF counterparts, and their relative performance was
improving with regard to liquidity and asset utilization. Grain cooperatives and IOFs have
recently been comparable with regard to profitability, although cooperatives were stronger
initially.
Among the four sectors included in this analysis, cooperatives in the fruit and vegetable
sector displayed a general weakness. Cooperatives’ tendency to market a high proportion of
undifferentiated, low value-added products could explain both the fruit and vegetable
cooperatives’ sharply lower asset utilization rates and cyclical profitability. If the IOFs market a
higher proportion of value-added products, they are more likely to maintain year-round
utilization of their processing equipment and generate returns that are less susceptible to the
highly competitive international market for undifferentiated canned fruits and vegetables. This
sector warrants further analysis; cooperatives’ long-term viability may depend on their ability to
reduce their costs substantially as processors of undifferentiated products or to enhance their
capabilities as marketers of more value-added products.
Initially, cooperatives had significantly higher performance levels for eight of the 24
ratios evaluated, while IOFs had significantly higher performance levels for six ratios. There
was no consistent evidence of declining relative performance over time by cooperatives; of the
six time trend coefficients that were statistically significant, three indicated cooperatives were
getting stronger while the other three signaled a relative weakening by cooperatives.
In conclusion, there were no consistent differences between the financial performance of
cooperatives and IOFs, except for cooperatives’ lower levels of leverage. When these regression
results are compared against the hypotheses developed from the theory of cooperative behavior,

16
the overall findings are as inconclusive as they were in the previous studies conducted by
Lerman and Parliament, and Schrader, etal. None of the hypotheses was consistently accepted or
rejected using regression analysis for any of the ratios analyzed.
Claims that cooperatives are destroying value do not stand up to this analysis of recent
trends in financial performance of agricultural cooperatives on the West Coast. These findings
should alleviate some of the concerns expressed by producers and lenders regarding the viability
of agricultural cooperatives. These results, when combined with the fact that cooperatives
ensure secure markets for their members’ products, demonstrate that cooperatives continue to
promote the economic welfare of agricultural producers.
17
Table 1. Ratios analyzed
Ratio Performance
Indicator Definition Expected
Relationship Return on Equity (ROE) Profitability Income/Equity (%)* Coop < IOF Return on Assets (ROA) Profitability Income/Total Assets (%)* Coop < IOF Operating Margin (OM) Profitability Operating Profit/Net Sales (%) Coop < IOF
Current Assets (CR) Liquidity Current Assets/
Current Liabilities
Coop < IOF Debt-Equity Ratio (D/E) Leverage Non-Current Liabilities/Equity Coop ? IOF Fixed Asset Turnover Ratio (FATR)
Asset Efficiency Net Sales/Fixed Assets Coop < IOF
* Adjustment for Income: Income = Income tax + Tax payable + Net Income

18
Table 2. Size characteristics of IOFs and cooperatives
Sector IOF Average Asset Range
During 12 Year Period Coop Average Asset Range
During 12 Year Period Dairy $18m – $36m $26m - $71m Farm Supply $7m – $15m $5m - $11m Fruits & Vegetables $13m – $22m $14m - $23m Grain $6m – $15m $14 - $19m

19
Table 3. Interpretation of Results for Coefficients
Intercept
Significant Slope
Significant
Interpretation No No No significant difference was observed between the performances of IOFs &
cooperatives over the duration of the time series No Yes No significant difference was observed initially between the performance of
IOFs & cooperatives; however, the relative performance of cooperatives declined relative to IOFs over time
Yes No The performance of cooperatives was worse than that of IOFs by a constant amount over the duration of the time series
Yes Yes The performance of cooperatives was initially worse than that of IOFs, and it deteriorated further over time
Note: The above interpretation is applicable for positive values of significant coefficients for Return on Equity,
Return on Assets, Operating Margin, Current Ratio and Fixed Asset Turnover Ratio and negative values of
significant coefficients for the Debt-Equity ratio. The interpretation would have to be reversed for negative values of
significant coefficients for Return on Equity, Return on Assets, Operating Margin, Current Ratio and Fixed Asset
Turnover Ratio and positive values of significant coefficients for the Debt-Equity ratio.

20
Table 4. Regression Results
Constant Time Sector Ratio Coefficient p-value Coefficient p-value R-square Durbin Watson
Dairy ROE 3.50 0.25 -1.84 0.00 0.64 1.54 ROA 1.78 0.06 -0.28 0.06 0.32 1.77 OM 0.81 0.01 0.06 0.18 0.17 1.58 CR 0.05 0.48 0.02 0.08 0.28 2.08 D/E1 0.20 0.05 -0.01 0.65 0.17 2.72 FATR1 -4.94 0.01 0.53 0.05 0.55 1.59
F&V ROE -1.75 0.72 0.75 0.32 0.10 1.73 ROA -0.31 0.85 0.20 0.43 0.07 1.63 OM -5.48 0.02 0.49 0.15 0.19 1.62 CR 0.21 0.02 -0.42 0.74 0.01 2.19 D/E1 0.29 0.02 -0.01 0.41 0.56 1.31 FATR1 6.28 0.00 0.02 0.83 0.16 1.93
Grain ROE -6.75 0.02 0.51 0.19 0.17 2.53 ROA -3.77 0.00 0.21 0.15 0.20 2.57 OM -1.83 0.00 0.15 0.05 0.34 2.43 CR 0.30 0.00 -0.04 0.00 0.67 1.48 D/E 0.16 0.00 0.01 0.26 0.12 2.02 FATR 4.73 0.00 -0.40 0.00 0.66 1.43
ROE 1.68 0.36 0.08 0.78 0.01 2.01 Farm Supply ROA -1.58 0.13 0.15 0.32 0.10 2.15
OM 0.25 0.43 0.00 0.93 0.00 1.58 CR -0.22 0.00 0.02 0.04 0.35 1.53 D/E 0.24 0.00 -0.01 0.09 0.26 1.60 FATR1 3.03 0.01 -0.04 0.81 0.34 1.75
*Significance level = 5% Durbin Watson Approximated to 15 observations 1Corrected for autocorrelation using Cochrane-Orcutt Iterative method, with Durbin-H statistic reported instead of Durbin-Watson statistic

21
Figure 1. Rate of return on equity
____________ IOFs __ . __ . __ . Cooperatives
05
101520253035404550
1991 1993 1995 1997 1999 2001YEAR
ROE (% )
05
101520253035404550
1991 1993 1995 1997 1999 2001YEAR
ROE (% )
05
101520253035404550
1991 1993 1995 1997 1999 2001YEAR
ROE (% )
05
101520253035404550
1991 1993 1995 1997 1999 2001YEAR
ROE (% )
Dairy Grain Fruit & Vegetable Farm Supply

22
Figure 2. Rate of return on assets
____________ IOFs __ . __ . __ . Cooperatives
02468
1012
1991 1993 1995 1997 1999 2001
YEAR
ROA (% )
02468
1012
1991 1993 1995 1997 1999 2001
YEAR
ROA (% )
02468
1012
1991 1993 1995 1997 1999 2001YEAR
ROA (% )
02468
1012
1991 1993 1995 1997 1999 2001YEAR
ROA (% )
Dairy Grain Fruit & Vegetable Farm Supply

23
Figure 3. Operating margin
____________ IOFs __ . __ . __ . Cooperatives
02468
101214
1991 1993 1995 1997 1999 2001YEAR
OM (% )
02468
101214
1991 1993 1995 1997 1999 2001YEAR
OM (% )
02468
101214
1991 1993 1995 1997 1999 2001YEAR
OM (% )
02468
101214
1991 1993 1995 1997 1999 2001YEAR
OM (% )
Dairy Grain Fruit & Vegetable Farm Supply

24
Figure 4. Current ratio
____________ IOFs __ . __ . __ . Cooperatives
0.00.20.40.60.81.01.21.41.61.82.0
1991 1993 1995 1997 1999 2001YEAR
CR
0.00.20.40.60.81.01.21.41.61.82.0
1991 1993 1995 1997 1999 2001YEAR
CR
0.00.20.40.60.81.01.21.41.61.82.0
1991 1993 1995 1997 1999 2001YEAR
CR
0.00.20.40.60.81.01.21.41.61.82.0
1991 1993 1995 1997 1999 2001YEAR
CR
Dairy Grain Fruit & Vegetable Farm Supply

25
Figure 5. Debt-equity ratio
____________ IOFs __ . __ . __ . Cooperatives
0.00.10.20.30.40.50.60.70.8
1991 1993 1995 1997 1999 2001
YEAR
D/E
0.00.10.20.30.40.50.60.70.8
1991 1993 1995 1997 1999 2001YEAR
D/E
0.00.10.20.30.40.50.60.70.8
1991 1993 1995 1997 1999 2001YEAR
D/E
0.00.10.20.30.40.50.60.70.8
1991 1993 1995 1997 1999 2001YEAR
D/E
Dairy Grain Fruit & Vegetable Farm Supply

26
Figure 6. Fixed asset turnover ratio
____________ IOFs __ . __ . __ . Cooperatives
02468
10121416
1991 1993 1995 1997 1999 2001YEAR
FATR
02468
10121416
1991 1993 1995 1997 1999 2001YEAR
FATR
02468
10121416
1991 1993 1995 1997 1999 2001YEAR
FATR
02468
10121416
1991 1993 1995 1997 1999 2001YEAR
FATR
Dairy Grain Fruit & Vegetable Farm Supply

27
References Akridge, J.T. and T.W. Hertel. “Cooperative and Investor-Oriented Firm Efficiency: A
Multiproduct Analysis.” Journal of Agricultural Cooperation. 7(1992):1-14.
Dempsey, Jack J., Ashish A. Kumar, Bernard Loyd and Loula S. Merkel. “A Value Culture for
Agriculture.” McKinsey Quarterly, 3(2002).
Gruber, Jennifer E., Richard T. Rogers and Richard J. Sexton. “Do Agricultural Marketing
Cooperatives Advertise Less Intensively Than Investor-Owned Food-Processing Firms?”
Journal of Cooperatives. 15(2000):31-46.
Lerman, Zvi and Claudia Parliament. “Comparative Performance of Cooperatives and Investor-
Owned Firms in US Food Industries.” Agribusiness. 6:6(November 1990):527-540.
Parliament, Claudia, Zvi Lerman and Joan Fulton. “Performance of Cooperatives and Investor-
Owned Firms in the Dairy Industry.” Journal of Agricultural Cooperation, 5(1990), 1-16.
Porter, P.K. and G.W. Scully. “Economic Efficiency in Cooperatives.” Journal of Law and
Economics 30(1987):489-512.
Risk Management Association. Annual Statement Studies. Philadelphia, PA. Various issues.
Ross, Stephen A., Randolph W. Westerfield and Jeffrey Jaffe. Corporate Finance. Boston, MA:
McGraw-Hill/Irwin, 2002,
Schrader, Lee F., E.M. Babb, R.D. Boynton and M.G. Lang. “Cooperative and Proprietary
Agribusiness: Comparison of Performance.” Agri. Exp. Stat. Bull. 982, Purdue University,
April 1985.
Sexton, Richard J. and Julie Iskow (1993). “What Do We Know About the Economic Efficiency
of Cooperatives: An Evaluative Survey.” Journal of Agricultural Cooperation 8:15-27.

28
Sexton, Richard J., B.M. Wilson and J.J. Wann (1989). “Some Tests of the Economic Theory of
Cooperatives: Methodology and Application to Cotton Ginning.” Western Journal of
Agricultural Economics 14:55-66.