Comparative Evidence on Corporate Earnings Management
23
Journal of Financial Economics 69 (2003) 505–527 Earnings management and investor protection: an international comparison $ Christian Leuz a, *, Dhananjay Nanda b , Peter D. Wysocki c a The Wharton School of the University of Pennsylvania, Philadelphia, PA 19104, USA b The Fuqua School of Business, Duke University, Durham, NC 27708, USA c MIT Sloan School of Management, Cambridge, MA 02142, USA Received 4 September 2001; received in revised form 23 July 2002; accepted 21 March 2003 Abstract This paper examines systematic differences in earnings management across 31 countries. We propose an explanation for these differences based on the notion that insiders, in an attempt to protect their private control benefits, use earnings management to conceal firm performance from outsiders. Thus, earnings management is expected to decrease in investor protection because strong protection limits insiders’ ability to acquire private control benefits, which reduces their incentives to mask firm performance. Our findings are consistent with this prediction and suggest an endogenous link between corporate governance and the quality of reported earnings. r 2003 Elsevier B.V. All rights reserved. JEL classification: G34; G38; M41 Keywords: Corporate governance; Earnings management; Investor protection; Law; Private control benefits $ This paper was previously circulated and presented under the title ‘‘Earnings Management Around the World’’ at the 2000 European Accounting Association meetings in Munich. It has also benefited from presentations at the Duke/UNC Fall Camp, the EAA meetings in Athens, the European Finance Association meeting in Berlin, the Financial Economics and Accounting conference at the University of Michigan, Goethe University Frankfurt, MIT, London Business School, New York University, University of Vasa, University of Virginia, the Wharton School, and the College of William and Mary. We are grateful to Stan Baiman, Sudipta Basu, Phil Berger, Larry Brown, Willem Buijink, Elroy Dimson, Simeon Djankov, Richard Frankel, Wayne Guay, Juha Kinnunen, David Larcker, Christian Laux, Martien Lubberink, Peter Pope, Bill Schwert, Weiling Song, Ross Watts, and especially Bob Holthausen and an anonymous referee for helpful comments. *Corresponding author. Tel.: + 1-215-898-2610; fax: + 1-215-573-2054. E-mail address: [email protected] (C. Leuz). 0304-405X/03/$ - see front matter r 2003 Elsevier B.V. All rights reserved. doi:10.1016/S0304-405X(03)00121-1
-
Upload
shahid-mahmood -
Category
Documents
-
view
5 -
download
2
Transcript of Comparative Evidence on Corporate Earnings Management

Journal of Financial Economics 69 (2003) 505–527
Earnings management and investor protection:an international comparison$
Christian Leuza,*, Dhananjay Nandab, Peter D. Wysockic
aThe Wharton School of the University of Pennsylvania, Philadelphia, PA 19104, USAbThe Fuqua School of Business, Duke University, Durham, NC 27708, USA
cMIT Sloan School of Management, Cambridge, MA 02142, USA
Received 4 September 2001; received in revised form 23 July 2002; accepted 21 March 2003
Abstract
This paper examines systematic differences in earnings management across 31 countries. We
propose an explanation for these differences based on the notion that insiders, in an attempt to
protect their private control benefits, use earnings management to conceal firm performance
from outsiders. Thus, earnings management is expected to decrease in investor protection
because strong protection limits insiders’ ability to acquire private control benefits, which
reduces their incentives to mask firm performance. Our findings are consistent with this
prediction and suggest an endogenous link between corporate governance and the quality of
reported earnings.
r 2003 Elsevier B.V. All rights reserved.
JEL classification: G34; G38; M41
Keywords: Corporate governance; Earnings management; Investor protection; Law; Private control
benefits
$This paper was previously circulated and presented under the title ‘‘Earnings Management Around the
World’’ at the 2000 European Accounting Association meetings in Munich. It has also benefited from
presentations at the Duke/UNC Fall Camp, the EAA meetings in Athens, the European Finance
Association meeting in Berlin, the Financial Economics and Accounting conference at the University of
Michigan, Goethe University Frankfurt, MIT, London Business School, New York University, University
of Vasa, University of Virginia, the Wharton School, and the College of William and Mary. We are
grateful to Stan Baiman, Sudipta Basu, Phil Berger, Larry Brown, Willem Buijink, Elroy Dimson, Simeon
Djankov, Richard Frankel, Wayne Guay, Juha Kinnunen, David Larcker, Christian Laux, Martien
Lubberink, Peter Pope, Bill Schwert, Weiling Song, Ross Watts, and especially Bob Holthausen and an
anonymous referee for helpful comments.
*Corresponding author. Tel.: + 1-215-898-2610; fax: + 1-215-573-2054.
E-mail address: [email protected] (C. Leuz).
0304-405X/03/$ - see front matter r 2003 Elsevier B.V. All rights reserved.
doi:10.1016/S0304-405X(03)00121-1
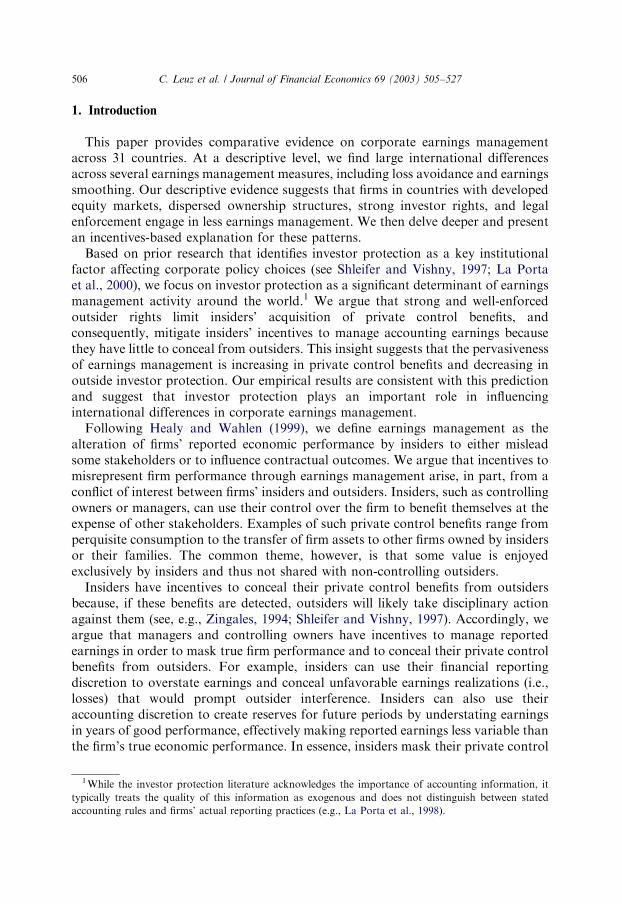
1. Introduction
This paper provides comparative evidence on corporate earnings managementacross 31 countries. At a descriptive level, we find large international differencesacross several earnings management measures, including loss avoidance and earningssmoothing. Our descriptive evidence suggests that firms in countries with developedequity markets, dispersed ownership structures, strong investor rights, and legalenforcement engage in less earnings management. We then delve deeper and presentan incentives-based explanation for these patterns.Based on prior research that identifies investor protection as a key institutional
factor affecting corporate policy choices (see Shleifer and Vishny, 1997; La Portaet al., 2000), we focus on investor protection as a significant determinant of earningsmanagement activity around the world.1 We argue that strong and well-enforcedoutsider rights limit insiders’ acquisition of private control benefits, andconsequently, mitigate insiders’ incentives to manage accounting earnings becausethey have little to conceal from outsiders. This insight suggests that the pervasivenessof earnings management is increasing in private control benefits and decreasing inoutside investor protection. Our empirical results are consistent with this predictionand suggest that investor protection plays an important role in influencinginternational differences in corporate earnings management.Following Healy and Wahlen (1999), we define earnings management as the
alteration of firms’ reported economic performance by insiders to either misleadsome stakeholders or to influence contractual outcomes. We argue that incentives tomisrepresent firm performance through earnings management arise, in part, from aconflict of interest between firms’ insiders and outsiders. Insiders, such as controllingowners or managers, can use their control over the firm to benefit themselves at theexpense of other stakeholders. Examples of such private control benefits range fromperquisite consumption to the transfer of firm assets to other firms owned by insidersor their families. The common theme, however, is that some value is enjoyedexclusively by insiders and thus not shared with non-controlling outsiders.Insiders have incentives to conceal their private control benefits from outsiders
because, if these benefits are detected, outsiders will likely take disciplinary actionagainst them (see, e.g., Zingales, 1994; Shleifer and Vishny, 1997). Accordingly, weargue that managers and controlling owners have incentives to manage reportedearnings in order to mask true firm performance and to conceal their private controlbenefits from outsiders. For example, insiders can use their financial reportingdiscretion to overstate earnings and conceal unfavorable earnings realizations (i.e.,losses) that would prompt outsider interference. Insiders can also use theiraccounting discretion to create reserves for future periods by understating earningsin years of good performance, effectively making reported earnings less variable thanthe firm’s true economic performance. In essence, insiders mask their private control
1While the investor protection literature acknowledges the importance of accounting information, it
typically treats the quality of this information as exogenous and does not distinguish between stated
accounting rules and firms’ actual reporting practices (e.g., La Porta et al., 1998).
C. Leuz et al. / Journal of Financial Economics 69 (2003) 505–527506

benefits and hence reduce the likelihood of outside intervention by managing thelevel and variability of reported earnings.Legal systems protect investors by conferring on them rights to discipline insiders
(e.g., to replace managers), as well as by enforcing contracts designed to limitinsiders’ private control benefits (e.g., La Porta et al., 1998; Nenova, 2000; Claessenset al., 2002; Dyck and Zingales, 2002).2 As a result, legal systems that effectivelyprotect outside investors reduce insiders’ need to conceal their activities. Wetherefore propose that earnings management is more pervasive in countries wherethe legal protection of outside investors is weak, because in these countries insidersenjoy greater private control benefits and hence have stronger incentives to obfuscatefirm performance.Our analysis is based on financial accounting data from 1990 to 1999 for over
8,000 firms from 31 countries. To measure the pervasiveness of earnings manage-ment in a country, we create four proxies that capture the extent to which corporateinsiders use their accounting discretion to mask their firm’s economic performance.As it is difficult to specify ex ante which techniques firms use to obfuscate firmperformance, our earnings management proxies are designed to capture a variety ofearnings management practices such as earnings smoothing and accrual manipula-tions.We begin with a descriptive country cluster analysis, which groups countries with
similar legal and institutional characteristics. Three distinct country clusters areidentified: (1) outsider economies with large stock markets, dispersed ownership,strong investor rights, and strong legal enforcement (e.g., United Kingdom andUnited States); (2) insider economies with less-developed stock markets, concen-trated ownership, weak investor rights, but strong legal enforcement (e.g. Germanyand Sweden); and, (3) insider economies with weak legal enforcement (e.g., Italy andIndia). These clusters closely parallel simple code-law and common-law as well asregional characterizations used in prior work (e.g., La Porta et al., 1997; Ball et al.,2000). We find significant differences in earnings management across these threeinstitutional clusters. Outsider economies with strong enforcement display the lowestlevel of earnings management and insider economies with weak enforcement thehighest level of earnings management. That is, earnings management appears to belower in economies with large stock markets, dispersed ownership, strong investorrights, and strong legal enforcement.To examine more explicitly whether differences in earnings management are
related to private control benefits and investor protection, we undertake a multipleregression analysis. We measure outside investor protection by both the extent ofminority shareholder rights as well as the quality of legal enforcement. Our resultsshow that earnings management is negatively related to outsider rights and legalenforcement. These results remain significant after we control for the endogeneity of
2Outsiders are also expected to price protect themselves, leading to more internal financing, smaller
arm’s length financial markets and higher cost of outside capital (see, for example, La Porta et al., 1997).
Bhattacharya et al. (2002) replicate our earnings management measures and provide evidence that firms’
earnings management activities appear to be priced in capital markets.
C. Leuz et al. / Journal of Financial Economics 69 (2003) 505–527 507

investor protection as well as for differences in economic development, macro-economic stability, industry composition, and firm characteristics. We also providedirect evidence that earnings management is positively associated with the level ofprivate control benefits enjoyed by insiders. While these results highlight insiders’incentives to manage earnings as a way to conceal their private control benefits, weacknowledge that accounting rules may limit insiders’ ability to manage earnings.We therefore attempt to control for cross-country differences in accounting rulesthat potentially affect insiders’ ability to manage earnings and find that our resultsare robust to the inclusion of this control. Finally, we demonstrate that our resultsare not sensitive to the inclusion or exclusion of any particular country (in particular,the U.S.) in our sample.This study builds on recent advances in the corporate governance literature on the
role of legal protection for financial market development, ownership structure, andprivate control benefits (e.g., Shleifer and Vishny, 1997; La Porta et al., 2000). Weextend this literature by presenting evidence that the level of outside investorprotection endogenously determines the quality of financial information reported tooutsiders. These results add to our understanding of how legal protection influencesthe agency conflict between outside investors and controlling insiders. Weak legalprotection appears to result in poor-quality financial reporting, which likelyundermines the development of arm’s length financial markets.Our work also contributes to a growing literature on international differences in
firms’ financial reporting. Prior research has analyzed the relation between earningsand stock prices around the world, only implicitly accounting for internationaldifferences in institutional factors (e.g., Alford et al., 1993; Joos and Lang, 1994;Land and Lang, 2002). Our results suggest that a country’s legal and institutionalenvironment influences the properties of reported earnings. In this regard, our studycomplements recent work by Ali and Hwang (2000), Ball et al. (2000), Fan andWong (2001), and Hung (2001), which documents that various institutional factorsexplain differences in the price-earnings association across countries.3 However, theprice-earnings relation of a country reflects both its prevailing pricing mechanismand earnings quality. Consequently, it is important to understand the effect ofinstitutional factors on reported earnings when examining the relation between stockprices and managed earnings.Our empirical findings are subject to several caveats. First, earnings management
is difficult to measure, especially as it manifests itself in different forms. We attemptto address this issue by computing several proxies for earnings management and weobtain consistent results across all measures. However, our findings are contingenton the ability of these measures to appropriately and consistently capture earningsmanagement activities around the world. Second, we acknowledge that otherinstitutional factors correlated with investor protection may also affect insiders’earnings management incentives. Since institutional factors are often complemen-tary, it is difficult to fully control for the potential impact of other factors and to
3See also Basu et al. (1998) and Hope (2003) relating the properties of analyst forecasts to institutional
factors.
C. Leuz et al. / Journal of Financial Economics 69 (2003) 505–527508

disentangle them from the direct effect of investor protection. Moreover, theexistence of complementarities raises concerns about endogeneity bias. We attemptto address these concerns with two-stage least squares (2SLS) estimation. However,as the relations among the institutional factors are difficult to model, weacknowledge that other endogenous interactions may still exist. Finally, we notethat, holding private control benefits constant, strong investor protection potentiallyencourages earnings management because insiders have greater incentives to hidetheir control benefits when faced with higher penalties. While we acknowledge thepotential existence of such a penalty effect, the empirical evidence suggests that it isdominated by international differences in private control benefits, and thus thenegative relation between investor protection and earnings management prevails.The remainder of the paper is organized as follows. Section 2 describes the
construction of our earnings management measures. In Section 3, we describe thesample and provide descriptive statistics. Empirical tests and results are presented inSection 4. Section 5 concludes.
2. Earnings management measures
This section describes the earnings management measures used in our empiricalanalysis. Drawing on the existing earnings management literature (see Healy andWahlen, 1999; Dechow and Skinner, 2000), we develop four different country-levelmeasures of earnings management that capture various dimensions along whichinsiders can exercise their discretion to manage reported earnings. The four measurescapture outcomes of insiders’ earnings management activities and avoid the problemthat stated accounting rules can be (and often are) circumvented by insiders andhence do not reflect firms’ actual reporting practices (see also Ball et al., 2003).
2.1. Smoothing reported operating earnings using accruals
Insiders can conceal changes in their firm’s economic performance using both realoperating decisions and financial reporting choices. Focusing on insiders’ reportingchoices, our first earnings management measure captures the degree to which insiders‘‘smooth’’, i.e., reduce the variability of reported earnings by altering the accountingcomponent of earnings, namely accruals. The measure is a country’s median ratio ofthe firm-level standard deviation of operating earnings divided by the firm-levelstandard deviation of cash flow from operations. Scaling by the cash flow fromoperations controls for differences in the variability of economic performance acrossfirms. Low values of this measure indicate that, ceteris paribus, insiders exerciseaccounting discretion to smooth reported earnings.Cash flow from operations is computed indirectly by subtracting the accrual
component from earnings because direct information on firms’ cash flows is notwidely available in many countries. Following Dechow et al. (1995), we compute theaccrual component of earnings as
Accrualsit ¼ ðDCAit � DCashitÞ � ðDCLit � DSTDit � DTPitÞ � Depit; ð1Þ
C. Leuz et al. / Journal of Financial Economics 69 (2003) 505–527 509

where DCAit=change in total current assets, DCashit=change in cash/cashequivalents, DCLit=change in total current liabilities, DSTDit=change in short-term debt included in current liabilities, DTPit=change in income taxes payable, andDepit=depreciation and amortization expense for firm i in year t. Changes in short-term debt are excluded from accruals because they relate to financing transactions asopposed to operating activities. If a firm does not report information on taxespayable or short-term debt, then the change in both variables is assumed to be zero.
2.2. Smoothing and the correlation between changes in accounting accruals and
operating cash flows
Insiders can also use their accounting discretion to conceal economic shocks to thefirm’s operating cash flow. For example, they may accelerate the reporting of futurerevenues or delay the reporting of current costs to hide poor current performance.Conversely, insiders underreport strong current performance to create reserves forthe future. In either case, accounting accruals buffer cash flow shocks and result in anegative correlation between changes in accruals and operating cash flows. Anegative correlation is a natural result of accrual accounting (see, e.g., Dechow,1994). However, larger magnitudes of this correlation indicate, ceteris paribus,smoothing of reported earnings that does not reflect a firm’s underlying economicperformance (see Skinner and Myers, 1999).4 Consequently, the contemporaneouscorrelation between changes in accounting accruals and changes in operating cashflows is our second measure of earnings smoothing. The accrual and operating cashflow components of earnings are computed as in equation (1) and the correlation iscomputed over the pooled set of firms in each country.
2.3. Discretion in reported earnings: The magnitude of accruals
Apart from dampening fluctuations in firm performance, insiders can use theirreporting discretion to misstate their firm’s economic performance. For instance,insiders can overstate reported earnings to achieve certain earnings targets or reportextraordinary performance in specific instances, such as an equity issuance (see, e.g.,Dechow and Skinner, 2000). Accordingly, our third earnings management measureuses the magnitude of accruals as a proxy for the extent to which insiders exercisediscretion in reporting earnings. It is computed as a country’s median of the absolutevalue of firms’ accruals scaled by the absolute value of firms’ cash flow fromoperations. The scaling controls for differences in firm size and performance. Itshould be noted that managers can sometimes use discretionary accruals to increasethe informativeness of financial reports. In fact, the evidence for the U.S. suggeststhat, on average, managers use their discretion in a way that increases theinformativeness of earnings (e.g., Watts and Zimmerman, 1986). These findings,
4As accounting systems likely underreact to economic shocks, insiders using accruals to signal firm
performance induce on average a less negative (and in specific cases even positive) correlation with cash
flows.
C. Leuz et al. / Journal of Financial Economics 69 (2003) 505–527510

however, may be the result of effective outside investor protection and therefore maynot extend to countries with weak investor protection.
2.4. Discretion in reported earnings: Small loss avoidance
Degeorge et al. (1999) and Burgstahler and Dichev (1997) present evidence thatU.S. managers use accounting discretion to avoid reporting small losses. While onemay argue that managers have incentives to avoid losses of any magnitude, they onlyhave limited reporting discretion and are consequently unable to report profits in thepresence of large losses. Small losses, however, are more likely to lie within thebounds of insiders’ reporting discretion. Thus, in each country, the ratio of smallreported profits to small reported losses reflects the extent to which insiders manageearnings to avoid reporting losses.Following Burgstahler and Dichev (1997), the ratio of ‘‘small profits’’ to ‘‘small
losses’’ is computed, for each country, using after-tax earnings scaled by total assets.Small losses are defined to be in the range [�0.01, 0.00) and small profits are definedto be in the range [0.00, 0.01]. In order to reliably compute this ratio, we require atleast five observations of small losses for a country to be included in the sample.
2.5. Aggregate measure of earnings management
Finally, to mitigate potential measurement error, we construct an overallsummary measure of earnings management for each country. For each of the fourearnings management measures, countries are ranked such that a higher scoresuggests a higher level of earnings management. The aggregate earnings managementscore is computed by averaging the country rankings for the four individual earningsmanagement measures.
3. Sample selection and descriptive statistics
Our data are obtained from the Worldscope Database, which contains up to tenyears of historical financial data from annual reports of publicly traded companiesaround the world. Banks and financial institutions are excluded from the empiricalanalysis. To be included in the sample, a country must have at least 300 firm-yearobservations for a number of accounting variables, including total assets, sales, netincome, and operating income. Each firm must have income statement and balancesheet information for at least three consecutive years. Finally, Argentina, Brazil, andMexico experienced hyperinflation over the sample period and are excluded from themain sample because high inflation may unduly affect our earnings managementmeasures. However, the results are qualitatively unchanged if these countries remainin the sample. The final sample consists of 70,955 firm-year observations, across 31countries and 8,616 non-financial firms for the fiscal years 1990 to 1999.Table 1 presents the number of firm-year observations per country as well as
descriptive statistics for the sample firms and countries. There is significant variation
C. Leuz et al. / Journal of Financial Economics 69 (2003) 505–527 511

Table 1
Descriptive statistics of sample firms and countries
The full sample consists of 70,955 firm-year observations for the fiscal years 1990 to 1999 across 31
countries and 8,616 non-financial firms. Financial accounting information is obtained from the November
2000 version of the Worldscope Database. To be included in our sample, countries must have at least 300
firm-year observations for a number of accounting variables, including total assets, sales, net income, and
operating income. For each firm, we require income statement and balance sheet information for at least
three consecutive years. We discard three countries (Chile, New Zealand, Turkey) because of an
insufficient number of observations to compute the loss avoidance measure, and three countries
(Argentina, Brazil, Mexico) due to hyperinflation. Firm size is measured as total US$ sales (in thousands).
Capital intensity is measured as the ratio of long-term assets over total assets. The fraction of
manufacturing firms is the percentage of firm-year observations with SIC 2000 to 3999. Average per capita
GDP in constant 1995 US$ is computed from 1990 to 1999. Inflation is measured as the average
percentage change in consumer prices from 1990 to 1998. Volatility of GDP growth is measured as the
standard deviation of the growth rate in real per capita GDP from 1990 to 1998.
Country # Firm-years
Medianfirm sizein US$
Mediancapitalintensity
Fractionof mfg.firms
Per-capitaGDP inUS$
Inflation(%)
Volatilityof GDP
growth (%)
AUSTRALIA 1,483 233,344 0.425 0.319 20,642 2.62 2.01AUSTRIA 564 213,101 0.313 0.710 29,287 2.62 1.22BELGIUM 727 277,510 0.280 0.563 27,357 2.26 1.45CANADA 3,322 271,287 0.465 0.381 19,687 2.25 1.92DENMARK 1,235 119,113 0.344 0.573 34,163 2.07 1.23FINLAND 854 308,974 0.345 0.618 26,296 2.25 4.69FRANCE 4,404 178,163 0.187 0.548 26,960 2.04 1.42GERMANY 4,440 336,894 0.282 0.637 30,166 2.51 1.46GREECE 858 38,305 0.295 0.568 11,393 12.06 1.48HONG KONG 1,483 167,754 0.376 0.513 21,610 4.10 3.89INDIA 2,064 63,027 0.409 0.859 374 10.09 2.32INDONESIA 787 75,502 0.361 0.694 961 13.86 7.26IRELAND 436 124,021 0.386 0.438 18,707 2.38 3.03ITALY 1,213 350,380 0.280 0.721 19,025 4.40 1.25JAPAN 16,475 463,191 0.289 0.583 41,200 1.38 2.29KOREA (SOUTH) 1,692 452,349 0.382 0.724 10,250 6.28 4.64MALAYSIA 2,036 81,407 0.403 0.557 4,043 3.97 4.35NETHERLANDS 1,561 349,909 0.333 0.503 27,037 2.48 1.07NORWAY 988 104,483 0.356 0.410 33,189 2.46 1.28PAKISTAN 508 24,907 0.432 0.913 488 10.34 2.25PHILIPPINES 429 60,814 0.460 0.500 1,093 9.80 2.42PORTUGAL 460 97,229 0.412 0.545 10,942 6.40 1.68SINGAPORE 1,100 104,187 0.377 0.472 22,721 2.15 2.66SOUTH AFRICA 1,043 380,644 0.327 0.445 3,914 10.41 1.92SPAIN 1,082 333,207 0.424 0.492 15,092 4.43 1.64SWEDEN 1,384 261,343 0.295 0.505 27,350 3.59 2.29SWITZERLAND 1,320 377,488 0.394 0.626 44,485 2.51 1.65TAIWAN 1,001 208,798 0.357 0.809 11,893 3.37 0.80THAILAND 1,529 55,344 0.433 0.578 2,570 5.50 3.28UNITED KINGDOM 10,685 109,337 0.335 0.430 19,126 3.95 2.03UNITED STATES 3,792 3,597,429 0.333 0.556 27,836 3.09 1.64
Mean 2,289 316,756 0.358 0.574 19,028 4.76 2.34Median 1,235 208,798 0.357 0.557 19,687 3.37 1.92Min 429 24,907 0.187 0.319 374 1.38 0.80Max 16,475 3,597,429 0.465 0.913 44,485 13.86 7.26
C. Leuz et al. / Journal of Financial Economics 69 (2003) 505–527512

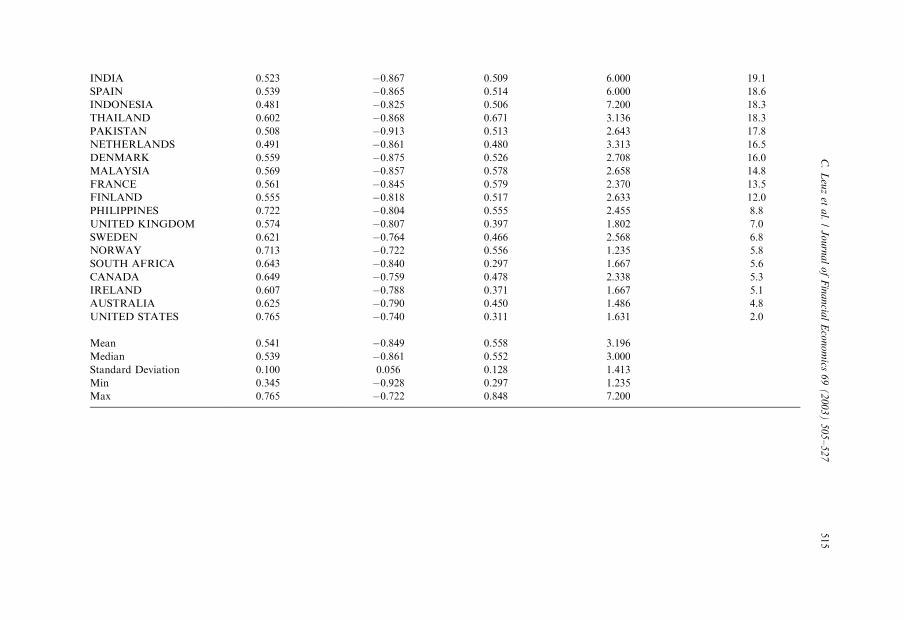
in the number of firm-year observations across countries due to differences incapital market development, country size, and the availability of complete financialaccounting data. Note that the U.S. version of the Worldscope Database includesonly U.S. firms belonging to the S&P 500 index. However, our results are notsensitive to the inclusion of the U.S. (or any particular country). To allow fordirect firm size comparisons across countries, the median firm’s sales in US$ isreported for each country. Based on the large differences in the median firmsize across countries, we scale all financial variables by the lagged value of totalassets. Scaling by other variables such as lagged sales or market value of equitydoes not affect the results. Table 1 also shows a substantial cross-countryvariation in capital intensity, the fraction of manufacturing firms, per capitaGDP, inflation and volatility of growth. We address the potentially confoundingeffects of cross-country differences in these variables in subsequent multipleregressions.Panel A of Table 2 provides descriptive statistics for the four individual earnings
management measures as well as the aggregate earnings management score. Thecountries are sorted in descending order based on their aggregate score. The fourindividual earnings management measures exhibit striking differences acrosscountries, but similar patterns in terms of their relative magnitudes. The statisticsof the first measure (EM1) show that earnings are smoother in Continental Europeand Asia than in Anglo-American countries, after controlling for the volatility ofcash flows. Similarly, large negative correlations between changes in firms’ accrualsand cash flows (EM2) indicate that earnings smoothing is more pervasive in, forinstance, Greece and Japan than in Canada and the U.S. With regard to accountingdiscretion, the third measure (EM3) shows that the magnitude of firms’ accruals,relative to the magnitude of their operating cash flows, is small in the U.K. and theU.S. compared to Austria, Germany, and South Korea. Similarly, the fourthmeasure (EM4) reveals that European and Asian firms exhibit a greater degree ofloss avoidance than Anglo-American firms.5
The earnings management measures are highly correlated and the rankingscorresponding to the four individual measures and the aggregate earnings manage-ment score are similar. Factor analysis suggests that a single factor represents thefour individual measures. Thus, it seems appropriate to combine the four measuresinto a single summary measure of earnings management. Our results hold for thesmoothing and discretion measures separately, as well as for the single factoridentified by factor analysis. The last column of Table 2 Panel A presents a countryranking based on this aggregate earnings management score, showing high ranks forcountries such as Austria, Italy, and South Korea, and low ranks for countries suchas Australia, the U.K. and the U.S.
5Our loss avoidance results may appear to contradict the finding of Brown and Higgins (2001) that
earnings surprise management is more pronounced in the US than in other countries. However, the two
findings are compatible. Brown and Higgins (2002) show that US firms engage in more expectations
management, i.e., downward guidance of analysts, to meet or beat analysts’ earnings forecasts, rather than
earnings management.
C. Leuz et al. / Journal of Financial Economics 69 (2003) 505–527 513

Table 2
The variables are computed from 70,955 firm-year observations for fiscal years 1990 to 1999 across 31 countries and 8,616 non-financial firms. Data are
obtained from the Worldscope Database (November 2000). EM1 is the country’s median ratio of the firm-level standard deviations of operating income and
operating cash flow (both scaled by lagged total assets). The cash flow from operations is equal to operating income minus accruals, where accruals are
calculated as: (Dtotal current assets – Dcash)�(Dtotal current liabilities � Dshort-term debt �Dtaxes payable) � depreciation expense. EM2 is the country’s
Spearman correlation between the change in accruals and the change in cash flow from operations (both scaled by lagged total assets). EM3 is the country’s
median ratio of the absolute value of accruals and the absolute value of the cash flow from operations. EM4 is the number of ‘‘small profits’’ divided by the
number of ‘‘small losses’’ for each country. A firm-year observation is classified as a small profit if net earnings (scaled by lagged total assets) are in the range
[0,0.01]. A firm-year observation is classified as a small loss if net earnings (scaled by lagged total assets) are in the range [�0.01,0). Net earnings are bottom-line reported income after interest, taxes, special items, extraordinary items, reserves, and any other item. The aggregate earnings management score is the
average rank across all four measures, EM1-EM4. The sign in the column heading indicates whether higher scores for the respective EM measure imply more
earnings management (+) or less earnings management (�).
Panel A: Country scores for earnings management measures (Sorted by aggregate earnings management)
Earnings smoothing measures Earnings discretion measures
EM1s(OpInc)/s(CFO) (–)
EM2 r(DAcc,DCFO) (–)
EM3 |Acc|/|
CFO| (+)
EM4 # of SmProfit/
# of SmLoss (+)
Aggregate earnings
management score
AUSTRIA 0.345 �0.921 0.783 3.563 28.3
GREECE 0.415 �0.928 0.721 4.077 28.3
KOREA (SOUTH) 0.399 �0.922 0.685 3.295 26.8
PORTUGAL 0.402 �0.911 0.745 3.000 25.1
ITALY 0.488 �0.912 0.630 4.154 24.8
TAIWAN 0.431 �0.898 0.646 2.765 22.5
SWITZERLAND 0.473 �0.873 0.547 5.591 22.0
SINGAPORE 0.455 �0.882 0.627 3.000 21.6
GERMANY 0.510 �0.867 0.848 3.006 21.5
JAPAN 0.560 �0.905 0.567 3.996 20.5
BELGIUM 0.526 �0.831 0.677 3.571 19.5
HONG KONG 0.451 �0.850 0.552 3.545 19.5
C.
Leu
zet
al.
/J
ou
rna
lo
fF
ina
ncia
lE
con
om
ics6
9(
20
03
)5
05
–5
27
514
INDIA 0.523 �0.867 0.509 6.000 19.1
SPAIN 0.539 �0.865 0.514 6.000 18.6
INDONESIA 0.481 �0.825 0.506 7.200 18.3
THAILAND 0.602 �0.868 0.671 3.136 18.3
PAKISTAN 0.508 �0.913 0.513 2.643 17.8
NETHERLANDS 0.491 �0.861 0.480 3.313 16.5
DENMARK 0.559 �0.875 0.526 2.708 16.0
MALAYSIA 0.569 �0.857 0.578 2.658 14.8
FRANCE 0.561 �0.845 0.579 2.370 13.5
FINLAND 0.555 �0.818 0.517 2.633 12.0
PHILIPPINES 0.722 �0.804 0.555 2.455 8.8
UNITED KINGDOM 0.574 �0.807 0.397 1.802 7.0
SWEDEN 0.621 �0.764 0.466 2.568 6.8
NORWAY 0.713 �0.722 0.556 1.235 5.8
SOUTH AFRICA 0.643 �0.840 0.297 1.667 5.6
CANADA 0.649 �0.759 0.478 2.338 5.3
IRELAND 0.607 �0.788 0.371 1.667 5.1
AUSTRALIA 0.625 �0.790 0.450 1.486 4.8
UNITED STATES 0.765 �0.740 0.311 1.631 2.0
Mean 0.541 �0.849 0.558 3.196
Median 0.539 �0.861 0.552 3.000
Standard Deviation 0.100 0.056 0.128 1.413
Min 0.345 �0.928 0.297 1.235
Max 0.765 �0.722 0.848 7.200
C.
Leu
zet
al.
/J
ou
rna
lo
fF
ina
ncia
lE
con
om
ics6
9(
20
03
)5
05
–5
27
515

Panel B: Institutional characteristics of the sample countries (Sorted by aggregate earnings management)Countries are sorted based on the aggregate earnings management score tabulated in Panel A of Table 2. The classification of the Legal Origin and the LegalTradition are based on La Porta et al., (1998). CD (CM) indicates a code-law (common-law) country. The Outside Investor Rights variable is the anti-directorrights index created by La Porta et al. (1998); it is an aggregate measure of minority shareholder rights and ranges from zero to five. Legal Enforcement ismeasured as the mean score across three legal variables used in La Porta et al. (1998): (1) the efficiency of the judicial system, (2) an assessment of rule of law,and (3) the corruption index. All three variables range from zero to ten. The Importance of Equity Market is measured by the mean rank across three variablesused in La Porta et al. (1997): (1) the ratio of the aggregate stock market capitalization held by minorities to gross national product, (2) the number of listeddomestic firms relative to the population, and (3) the number of IPOs relative to the population. Each variable is ranked such that higher scores indicate agreater importance of the stock market. Ownership Concentration is measured as the median percentage of common shares owned by the largest three share-holders in the ten largest privately owned non-financial firms (La Porta et al., 1998). The Disclosure Index measures the inclusion or omission of 90 items in the1990 annual reports (La Porta et al., 1998); it is not available (NA) for three countries in our sample.
Country LegalOrigin
LegalTradition
OutsideInvestorRights
LegalEnforcement
Important ofEquity Market
OwnershipConcentration
DisclosureIndex
AUSTRIA German CD 2 9.4 7.0 0.51 54GREECE French CD 2 6.8 11.5 0.68 55KOREA (SOUTH) German CD 2 5.6 11.7 0.20 62PORTUGAL French CD 3 7.2 11.8 0.59 36ITALY French CD 1 7.1 6.5 0.60 62TAIWAN German CD 3 7.4 13.3 0.14 65SWITZERLAND German CD 2 10.0 24.8 0.48 68SINGAPORE English CM 4 8.9 28.8 0.53 78GERMANY German CD 1 9.1 5.0 0.50 62JAPAN German CD 4 9.2 16.8 0.13 65BELGIUM French CD 0 9.4 11.3 0.62 61HONG KONG English CM 5 8.9 28.8 0.54 69INDIA English CM 5 5.6 14.0 0.43 57SPAIN French CD 4 7.1 7.2 0.50 64INDONESIA French CD 2 2.9 4.7 0.62 NATHAILAND English CM 2 4.9 14.3 0.48 64PAKISTAN English CM 5 3.7 7.5 0.41 NANETHERLANDS French CD 2 10.0 19.3 0.31 64DENMARK Scandinavian CD 2 10.0 20.0 0.40 62MALAYSIA English CM 4 7.7 25.3 0.52 76FRANCE French CD 3 8.7 9.3 0.24 69FINLAND Scandinavian CD 3 10.0 13.7 0.34 77PHILIPPINES French CD 3 3.5 5.7 0.51 65UNITED KINGDOM English CM 5 9.2 25.0 0.15 78
C.
Leu
zet
al.
/J
ou
rna
lo
fF
ina
ncia
lE
con
om
ics6
9(
20
03
)5
05
–5
27
516

SWEDEN Scandinavian CD 3 10.0 16.7 0.28 83NORWAY Scandinavian CD 4 10.0 20.3 0.31 74SOUTH AFRICA English CM 5 6.4 16.3 0.52 70CANADA English CM 5 9.8 23.3 0.24 74IRELAND English CM 4 8.4 17.3 0.36 NAAUSTRALIA English CM 4 9.5 24.0 0.28 75UNITED STATES English CM 5 9.5 23.3 0.12 71
Panel C: Correlation between earnings management and institutional characteristicsThe table presents Spearman correlations and significance levels (in parentheses) between the following measures. The aggregate earnings management score isthe average rank of all four earnings management measures, EM1–EM4. Outside Investor Rights is the anti-director rights index from La Porta et al. (1998). Itis an aggregate measure of (minority) shareholder rights and ranges from zero to six. Legal Enforcement is measured as the mean score across three legalvariables used in La Porta et al. (1998): (1) the efficiency of the judicial system, (2) an assessment of rule of law, and (3) the corruption index. All three variablesrange from zero to ten. The Importance of the Equity Market is measured by the mean rank across three variables used in La Porta et al. (1997): (1) the ratio ofthe aggregate stock market capitalization held by minorities to gross national product, (2) the number of listed domestic firms relative to the population, and(3) the number of IPOs relative to the population. Each variable is ranked such that higher scores indicate a greater importance of the stock market. OwnershipConcentration is measured as the median percentage of common shares owned by the largest three shareholders in the ten largest privately owned non-financialfirms (La Porta et al., 1998). The Disclosure Index measures the inclusion or omission of 90 items in the 1990 annual reports (La Porta et al., 1998).
Outside InvestorRights
LegalEnforcement
Importance ofEquity Market
OwnershipConcentration
DisclosureIndex
Aggregate Earnings Management �0.538 �0.291 �0.418 0.434 �0.686(0.002) (0.112) (0.019) (0.015) (0.000)
Outside Investor Rights �0.026 0.515 �0.344 0.568(0.888) (0.003) (0.058) (0.002)
Legal Enforcement 0.522 �0.396 0.393(0.003) (0.028) (0.038)
Importance of Stock Market �0.315 0.647(0.084) (0.000)
Ownership Concentration �0.398(0.036)
C.
Leu
zet
al.
/J
ou
rna
lo
fF
ina
ncia
lE
con
om
ics6
9(
20
03
)5
05
–5
27
517

Panel B of Table 2 provides descriptive statistics on the institutional characte-ristics of each country in the sample and is sorted based on countries’ aggregateearnings management scores presented in Panel A. The institutional variables aredrawn from La Porta et al. (1997, 1998). The Legal Origin and Legal Traditionassignments are presented in columns 2 and 3 of Panel B. The proxy for OutsideInvestor Rights is an anti-director rights index that captures the voting rights ofminority shareholders. The Legal Enforcement measure for each country is theaverage score across three variables: (1) an index of the legal system’s efficiency;(2) an index of the rule of law; and, (3) the level of corruption. The Importanceof Equity Markets is measured by a country’s average rank based on: (1) theratio of the aggregate stock market held by minorities to gross national product;(2) the number of listed domestic stocks relative to the population; and, (3) thenumber of IPOs relative to the population. Ownership Concentration is measuredas the median percentage of common shares owned by the largest three share-holders, in the ten largest privately owned non-financial firms. Finally, theDisclosure Index measures the inclusion or omission of 90 accounting items infirms’ 1990 annual reports, and hence captures firms’ disclosure policies at thecountry level.Simple correlations among institutional variables and the aggregate earnings
management score for each country are presented in Panel C of Table 2. Consistentwith our hypothesis, there is a strong negative correlation between the aggregateearnings management measure and both the outside investor rights and enforcementproxies. However, there are also significant correlations between the earningsmanagement measure and other institutional factors, suggesting that earningsmanagement is more pervasive in countries characterized by less developed stockmarkets, more concentrated ownership and lower disclosure levels. The lattercorrelation suggests that firms engaging in earnings management also provide fewerdisclosures. This finding questions the use of disclosure indices as exogenousvariables in prior research.
4. Empirical results
4.1. Descriptive cluster analysis
To provide descriptive evidence on the systematic patterns in earnings manage-ment across groups of countries with similar institutional characteristics, we beginwith a cluster analysis. Our aim is to first identify country clusters with similarinstitutional features such as the level of investor protection, stock marketdevelopment, and ownership concentration, and then to examine whether earningsmanagement varies across these clusters. This approach, while descriptive in nature,captures interactions among institutional factors and documents systematic patternsin earnings management without relying on specific hypotheses.The cluster analysis is based on nine institutional variables from La Porta et al.
(1997, 1998). We use those variables prior to the aggregation presented in
C. Leuz et al. / Journal of Financial Economics 69 (2003) 505–527518

Table 2 because it is preferable for cluster analysis to have a large set of variables.However, the results are similar if only the five variables from Table 2 are used.The variables are standardized to z-scores, and a k-means cluster analysis withthree distinct country clusters is conducted. Panel A of Table 3 reports the meansof each institutional variable for each of the three clusters. The first cluster ischaracterized by large stock markets, low ownership concentration, extensiveoutsider rights, high disclosure, and strong legal enforcement. The second andthird clusters show markedly smaller stock markets, higher ownership concen-tration, weaker investor protection, lower disclosure levels, and weaker enforcement.Based on institutional characteristics, we refer to countries in the first cluster as‘‘outsider economies.’’ The countries in the second and third clusters are referredto as ‘‘insider economies,’’ with the distinction that countries in the secondcluster have significantly better legal enforcement than countries in the thirdcluster. While cluster 2 seems ‘‘in-between’’ cluster 1 and 3, a comparison of theEuclidean distances between the cluster centers supports our interpretationthat clusters 2 and 3 are closer to each other than clusters 1 and 2. Overall, theresults in Table 3, Panel A are consistent with the existence of institutionalcomplementarities.Table 3, Panel B shows the cluster membership of the sample countries. Groupings
are consistent with the common- and code-law as well as regional distinctionsused in prior research to classify countries (see, e.g., Ball et al., 2000; Ball et al.,2003). As indicated in Panel B, all countries in the first cluster with the exception ofNorway have a common-law tradition. The three Southeast Asian countries(Hong Kong, Malaysia, and Singapore) in this cluster were formerly under Britishrule and have inherited parts of the Anglo-Saxon institutional framework. The factthat the three East Asian countries have by far the worst earnings managementratings in this group is consistent with Ball et al. (2003) who argue that, despite thecommon-law influence, reported earnings do not exhibit common-law properties(i.e., asymmetric timeliness). Fan and Wong (2001) present similar findings. In thesecond cluster, all countries except Ireland and South Africa have a code-lawtradition. This cluster contains most of the Northern European and Scandinaviancountries. The third cluster consists of several Asian and Southern Europeancountries with both common- and code-law traditions. Thus, the cluster approachsuggests that the common- and code-law distinction matters only when legalenforcement is relatively high, as in the first and second clusters. In the third cluster,for which the quality of legal enforcement is low, legal tradition seems unrelated tocluster membership.Panel C of Table 3 shows that differences between the clusters’ average earnings
management scores are statistically significant. Outsider economies (cluster 1) exhibitlower levels of earnings management than insider economies (clusters 2 and 3). Thus,even after controlling for interactions among various institutional factors, earningsmanagement appears to be lower in economies with strong investor protection, largestock markets and dispersed ownership. The third cluster exhibits significantly higherearnings management than the second cluster, highlighting the salient importance oflegal enforcement.
C. Leuz et al. / Journal of Financial Economics 69 (2003) 505–527 519

Table 3
Earnings management and institutional clusters
The table presents results from a k-means cluster analysis using three distinct clusters and nine
institutional variables from La Porta et al., (1997, 1998). See Panel B of Table 2 for details. The variables
are standardized to z-scores. Panel A reports the means of the institutional variables by cluster. Panel B
reports the cluster membership for the 31 sample countries based on the cluster analysis performed on the
variables in panel A. Countries in each cluster are sorted by the aggregate earnings management score
from Panel A in Table 2. CD (CM) indicates a code-law (common-law) tradition. This variable is not used
in the cluster analysis. Panel C reports the mean aggregate earnings management score for each cluster.
The last row reports one-sided p-values for differences in the means of the aggregate earnings management
across clusters using a t-test.
Panel A: Mean values of institutional characteristics by cluster
Institutional Variables Cluster 1 Cluster 2 Cluster 3
Stock Market Capitalization 0.82 0.46 0.21
Listed Firms 49.56 18.58 9.50
IPOs 4.04 0.55 0.37
Ownership Concentration 0.34 0.37 0.50
Anti-Director Rights 4.50 2.62 2.90
Disclosure Index 74.38 66.67 58.13
Efficiency of Judicial System 9.78 9.04 5.50
Rule of law 9.02 9.07 5.65
Corruption Index 8.80 9.09 5.13
Outsider features 2 Insider Features
Panel B: Cluster membership of countries
Institutional variables Cluster 1 Cluster 2 Cluster 3
Countries Sorted by Aggregate Earnings Singapore (CM) Austria (CD) Greece (CD)
Management Score Hong Kong (CM) Taiwan (CD) Korea (CD)
Malaysia (CM) Switzerland (CD) Portugal (CD)
UK (CM) Germany (CD) Italy (CD)
Norway (CD) Japan (CD) India (CM)
Canada (CM) Belgium (CD) Spain (CD)
Australia (CM) Netherlands (CD) Indonesia (CD)
USA (CM) Denmark (CD) Thailand (CM)
France (CD) Pakistan (CM)
Finland (CD) Philippines (CD)
Sweden (CD)
South Africa (CM)
Ireland (CM)
Panel C: Pervasiveness of earnings management by cluster
Cluster 1 Cluster 2 Cluster 3
Mean Aggregate Earnings Management Score 10.1 16.1 20.6
Tests of EM differences between clusters C1 vs. C2 C2 vs. C3 C1 vs. C3
(p-values) (0.044) (0.059) (0.003)
C. Leuz et al. / Journal of Financial Economics 69 (2003) 505–527520

4.2. The role of investor protection: multiple regression analysis
The previous analyses suggest that the pervasiveness of earnings management issystematically related to a country’s institutional characteristics. A key question,however, is: Which institutional factors are primary determinants of earningsmanagement and which are correlated outcomes? We posit that better investorprotection results in less earnings management because insiders enjoy fewer privatecontrol benefits and hence have lower incentives to conceal firm performance fromoutside investors. This hypothesis ties in closely with findings in Nenova (2000)and Dyck and Zingales (2002), suggesting that private control benefits decreasein the level of investor protection. The notion of investor protection as a keyprimitive is also reinforced by recent work relating to capital market development(e.g., Beck et al., 2003), corporate policy choices around the world (e.g., La Portaet al., 2000), and cross-listing in the U.S. (e.g., Doidge et al., 2003; Lang et al., 2003).Consistent with this literature, we view low earnings management, large equitymarkets, and dispersed ownership patterns as complements and joint outcomesof strong investor protection. This view is in contrast to La Porta et al. (1997,1999) who treat the level of disclosure as an exogenous factor in explainingfinancing and ownership patterns. Our results suggest, however, that the qualityof reported earnings and financial disclosure is endogenous and hence a jointoutcome.Our multiple regressions examine the relation between earnings management and
investor protection. Column 1 of Table 4 reports a rank regression using theaggregate earnings management measure as the dependent variable. Results showthat outside investor protection explains a substantial portion (39%) of the variationin earnings management. Outsider rights and legal enforcement both exhibit asignificant negative association with earnings management. Ordinary least squares(OLS) regressions of the aggregate earnings management score on the unrankedvariables yield similar results in this and in subsequent regressions.The multiple regressions assume, however, that outside investor rights and legal
enforcement are exogenous variables. If, on the other hand, outsider protection andearnings management are simultaneously determined, our results suffer from anendogeneity bias. We address this concern by using countries’ legal origins andwealth as instruments for the investor protection variables as suggested by Levine(1999). While related to the level of investor protection (see La Porta et al., 1998), acountry’s legal origin can be considered as predetermined and exogenous to ouranalysis because the origins of most legal systems are several centuries old and manycountries obtained their legal system through occupation and colonization. We usethree dummy variables, indicating English, French, German, and Scandinavian legalorigins, as instrumental variables. In addition, we use a country’s average per capitaGDP — measured prior to our sample period, 1980 to 1989 — as an instrumentbecause an effective legal infrastructure is costly to create and maintain, and hence acountry’s wealth potentially influences the level of legal enforcement.Column 2 of Table 4 reports results of a 2SLS regression using ranked variables.
The regression results support our hypothesis that the pervasiveness of earnings
C. Leuz et al. / Journal of Financial Economics 69 (2003) 505–527 521

management decreases in the level of investor protection, and suggest that thisrelation is not driven by the potential endogeneity of investor protection.Finally, we attempt to provide more direct evidence on the hypothesis that
insiders’ private control benefits are positively related to earnings management. Inthe previous regressions, we employ an indirect approach by using the investorprotection variables. An alternative approach is to directly estimate the relationbetween earnings management and private control benefits, explicitly accounting forthe effect of investor protection on the level of private control benefits. We use acountry’s average block premium estimated by Dyck and Zingales (2002) as a proxyfor the level of private control benefits. We estimate a 2SLS regression of theaggregate earnings management score on the control benefits proxy using the level ofoutsider rights and legal enforcement as instruments. The results presented incolumn 3 of Table 4 show that earnings management and private control benefitsexhibit a significantly positive association as predicted by our hypothesis. Similarresults are obtained if the legal origins and per capita GDP are used as instruments(as in column 2).
Table 4
Earnings management, outside investor protection and private control benefits
The table presents coefficients and two-sided p-values (in parentheses) from rank regressions with the
Aggregate Earnings Management Measure as the dependent variable, which is created by averaging the
ranks of all four earnings management measures, EM1–EM4 (see Table 2). Outside Investor Rights are
measured by the anti-director rights index from La Porta et al., (1998), which ranges from zero to five.
Legal Enforcement is measured as the average score across three legal variables used in La Porta et al.,
(1998): (1) the efficiency of the judicial system, (2) an assessment of rule of law, and (3) the corruption
index. All three variables range from zero to ten. Private Control Benefits are measured at the country level
as the average block premium estimated by Dyck and Zingales (2002) based on transfers of controlling
blocks of shares. The first column presents a simple rank regression. The second regression is estimated
using two-stage least squares. Instrumental variables are the rank of the country’s real per capita GDP
averaged from 1980 to 1989, and three binary variables indicating an English, German, French, or
Scandinavian legal origin based on the classification in La Porta et al., (1998). The third regression is also
estimated using two-stage least squares. The instrumental variables are the Outsider Rights Index and the
Legal Enforcement.
Aggregate Earnings
Management Measure
Aggregate Earnings
Management Measure
Aggregate Earnings
Management Measure
- 2SLS - - 2SLS -
Constant 28.605 31.421 3.128
(o0.001) (o0.001) (0.463)
Outside Investor Rights �0.499 �0.641 —
(o0.001) (0.001)
Legal Enforcement �0.289 �0.322 —
(0.025) (0.025)
Private Control Benefits — — 0.931
(0.004)
Adjusted R2 0.389 0.359 0.272
Number of Observations 31 31 26
C. Leuz et al. / Journal of Financial Economics 69 (2003) 505–527522

4.3. Robustness Checks
Prior work shows that per capita GDP explains differences in financing,ownership, and payout policies across countries. Consequently, we re-estimate ourprimary regressions using contemporaneous per capita GDP as an additionalexplanatory variable (not reported). While GDP is marginally significant in thisregression (p=0.140), the negative relation between investor protection and earningsmanagement is robust to the inclusion of this proxy.Another potential concern is that our results are driven by economic heterogeneity
across countries. Although we control for economic differences across firms byscaling our earnings management measures by firms’ operating cash flows, variationin industry composition and firm size across countries can potentially affect ourresults. Since Table 1 shows that the fraction of manufacturing firms and medianfirm size vary considerably across countries, the regressions are re-estimated usingtwo subsamples comprised exclusively of manufacturing firms (SIC 2000-3999) andmedium-size firms from each country, respectively. The medium-size firm subsamplealso eliminates many multinationals operating in several institutional settings. Theregression results for these subsamples (not reported) are essentially the same asthose presented in Table 4, alleviating concerns that international differences in firmsize and industry composition drive our findings.Finally, we are concerned that differences in firm characteristics and macro-
economic stability affect our inferences. For instance, larger firms have smootherearnings, and operating leverage is positively related to earnings volatility. Similarly,inflation rates and growth rate volatility influence the variability of accountingearnings. Consequently, we re-estimate the regressions using median firm size,median capital intensity, a country’s average yearly inflation rate, and the standarddeviation of the real GDP growth rate as additional controls. The results (notreported) are consistent with our original findings in Table 4. In particular, outsideinvestor rights and legal enforcement continue to have a significantly negativerelation with earnings management.
4.4. The role of other institutional factors
While the robustness checks in the previous section suggest that our findings arenot driven by economic heterogeneity across countries, we must still address theconcern that other institutional variables, which are correlated with investorprotection, are responsible for our main findings. In particular, we are concernedabout the influence of accounting rules and firms’ ownership structures on earningsmanagement.First, accounting rules can both limit a manager’s ability to distort reported
earnings, and affect the properties of reported earnings. But the extent to whichaccounting rules influence reported earnings and curb earnings management dependson how well these rules are enforced. Moreover, accounting rules likely reflect theinfluence of a country’s legal and institutional framework and are thereforeendogenous in our analysis. Countries with strong outsider protection are expected
C. Leuz et al. / Journal of Financial Economics 69 (2003) 505–527 523

to enact and enforce accounting and securities laws that limit the manipulation ofaccounting information reported to outsiders. Consistent with this view, Enriques(2000) argues that U.K. and the U.S. laws on director self-dealing are stricter and aremore reliant on disclosure than those in Germany or Italy. Similarly, d’ Arcy (2000)shows that Anglo-American countries have stricter accounting rules with respect toexplicit accounting choices than Continental European countries with less effectiveinvestor protection.Ultimately, however, it is an empirical matter whether our results are robust
to the inclusion of controls for countries’ stated accounting rules. To address thisissue, we re-estimate the main regression and include an accrual rules indexconstructed by Hung (2001) as a control variable. This index captures the use ofaccrual rules to accelerate the recognition of economic transactions (e.g., R&Dactivities or pension plans) in accounting, and it proxies for the extent to which acountry’s stated accounting rules are intended to produce timely and informativereported earnings.The results presented in Table 5, column 1, show that the coefficients on the
accounting rules variable and the outsider rights and legal enforcement variablesare significant. However, as shown in column 2, the coefficient on theaccounting rules variable is insignificant in the 2SLS regression specification,whereas the investor protection variables remain significant. These results supportour view that accounting rules are endogenous and suggest that investor protectionis a more fundamental determinant of earnings management across countries.A related concern is that the use of earnings for tax and financial accountingpurposes may introduce earnings management and in particular smoothingincentives unrelated to investor protection. We therefore re-run the main regressionincluding a proxy for the degree of a country’s tax-book conformity (e.g., Alfordet al., 1993; Hung, 2001). In this regression (not reported), the tax variable is notsignificant while the results for the investor protection variables are similar to thosereported in Table 4.Finally, we examine the incremental impact of ownership concentration
on insiders’ earnings management incentives since prior research highlights therelation between firms’ ownership structures and the properties of reportedearnings (e.g., Fan and Wong, 2001; Ball et al., 2003). We re-estimate ourmain regressions using a proxy for ownership concentration constructed byLa Porta et al. (1998) as an additional control variable. Neither the rank regressionnor the 2SLS regression presented in columns 3 and 4 of Table 5 indicate anyincremental explanatory power of the ownership variable. Thus, while differencesin ownership concentration may be related to cross-sectional variation in earningsmanagement within a country, our country-level tests suggest that average ownershippatterns are not a primary determinant of systematic earnings management across
countries.In summary, the regression results are consistent with the hypothesis that weak
outsider protection and private control benefits create incentives to manage earnings.We acknowledge, however, that institutional factors are complementary and hencedifficult to isolate.
C. Leuz et al. / Journal of Financial Economics 69 (2003) 505–527524
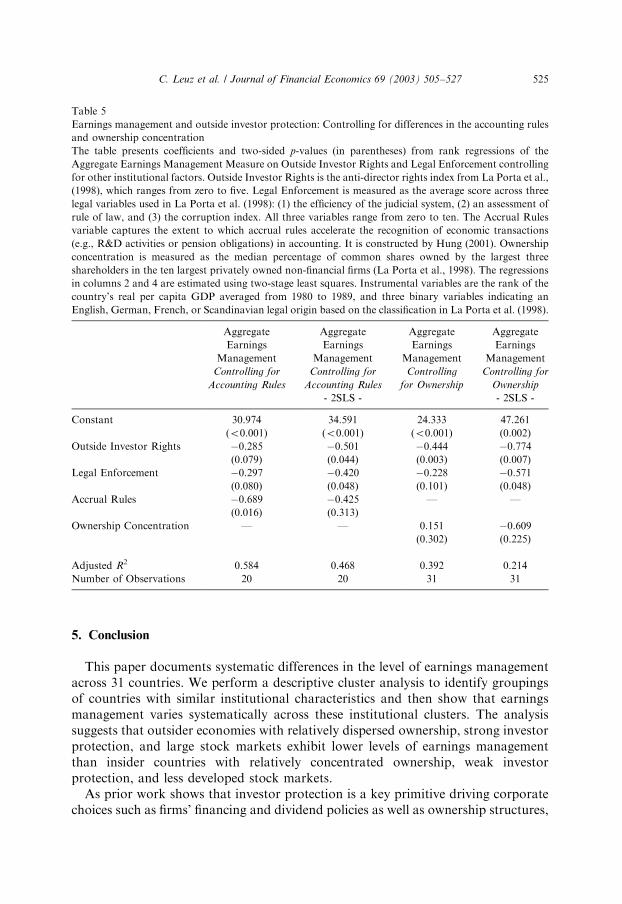
5. Conclusion
This paper documents systematic differences in the level of earnings managementacross 31 countries. We perform a descriptive cluster analysis to identify groupingsof countries with similar institutional characteristics and then show that earningsmanagement varies systematically across these institutional clusters. The analysissuggests that outsider economies with relatively dispersed ownership, strong investorprotection, and large stock markets exhibit lower levels of earnings managementthan insider countries with relatively concentrated ownership, weak investorprotection, and less developed stock markets.As prior work shows that investor protection is a key primitive driving corporate
choices such as firms’ financing and dividend policies as well as ownership structures,
Table 5
Earnings management and outside investor protection: Controlling for differences in the accounting rules
and ownership concentration
The table presents coefficients and two-sided p-values (in parentheses) from rank regressions of the
Aggregate Earnings Management Measure on Outside Investor Rights and Legal Enforcement controlling
for other institutional factors. Outside Investor Rights is the anti-director rights index from La Porta et al.,
(1998), which ranges from zero to five. Legal Enforcement is measured as the average score across three
legal variables used in La Porta et al. (1998): (1) the efficiency of the judicial system, (2) an assessment of
rule of law, and (3) the corruption index. All three variables range from zero to ten. The Accrual Rules
variable captures the extent to which accrual rules accelerate the recognition of economic transactions
(e.g., R&D activities or pension obligations) in accounting. It is constructed by Hung (2001). Ownership
concentration is measured as the median percentage of common shares owned by the largest three
shareholders in the ten largest privately owned non-financial firms (La Porta et al., 1998). The regressions
in columns 2 and 4 are estimated using two-stage least squares. Instrumental variables are the rank of the
country’s real per capita GDP averaged from 1980 to 1989, and three binary variables indicating an
English, German, French, or Scandinavian legal origin based on the classification in La Porta et al. (1998).
Aggregate
Earnings
Management
Controlling for
Accounting Rules
Aggregate
Earnings
Management
Controlling for
Accounting Rules
Aggregate
Earnings
Management
Controlling
for Ownership
Aggregate
Earnings
Management
Controlling for
Ownership
- 2SLS - - 2SLS -
Constant 30.974 34.591 24.333 47.261
(o0.001) (o0.001) (o0.001) (0.002)
Outside Investor Rights �0.285 �0.501 �0.444 �0.774(0.079) (0.044) (0.003) (0.007)
Legal Enforcement �0.297 �0.420 �0.228 �0.571(0.080) (0.048) (0.101) (0.048)
Accrual Rules �0.689 �0.425 — —
(0.016) (0.313)
Ownership Concentration — — 0.151 �0.609(0.302) (0.225)
Adjusted R2 0.584 0.468 0.392 0.214
Number of Observations 20 20 31 31
C. Leuz et al. / Journal of Financial Economics 69 (2003) 505–527 525

we explore the relation of legal investor protection and firms’ earnings managementpractices. The analysis is based on the notion that insiders, i.e., managers andcontrolling shareholders, have incentives to acquire private control benefits.However, the ability of insiders to divert resources for their own benefit is limitedby legal systems that protect the rights of outside investors. As outsiders can onlytake disciplinary actions against insiders if outsiders detect the private benefits,insiders have an incentive to manipulate accounting reports in order to conceal theirdiversion activities. Thus, we expect that earnings management decreases in legalprotection because, when investor protection is strong, insiders enjoy fewer privatecontrol benefits and consequently incentives to mask firm performance aremoderated.Consistent with this hypothesis, the regression results show that earnings
management is negatively associated with the quality of minority shareholder rightsand legal enforcement. The findings highlight an important link between investorprotection and the quality of accounting earnings reported to market participants,and complement both finance research that treats the quality of corporate reportingas exogenous and accounting research that documents systematic patterns in therelation between stock returns and accounting numbers.Our findings are robust to the inclusion of controls for country wealth,
economic heterogeneity across countries, and international differences in accountingrules and ownership concentration. They should nevertheless be interpretedcautiously as earnings management is difficult to measure and the theoreticalrelations among institutional factors are not yet well understood and hence difficultto disentangle.
References
Alford, A., Jones, J., Leftwich, R., Zmijewski, M., 1993. The relative informativesness of accounting
disclosures in different countries. Journal of Accounting Research 31 (Suppl.), 183–221.
Ali, A., Hwang, L., 2000. Country-specific factors related to financial reporting and the value relevance of
accounting data. Journal of Accounting Research 38, 1–23.
Ball, R., Kothari, S., Robin, A., 2000. The effect of international institutional factors on properties of
accounting earnings. Journal of Accounting and Economics 29, 1–52.
Ball, R., Robin, A., Wu, J., 2003. Incentives versus standards: properties of accounting income in four
East Asian countries. Journal of Accounting and Economics, forthcoming.
Basu, S., Hwang, L., Jan, C., 1998. International variation in accounting measurement rules and analysts’
earnings forecast errors. Journal of Business, Finance and Accounting 25, 1207–1247.
Beck, T., Demirg .uc-Kunt, A., Levine, R., 2003. Law, politics, and finance. Journal of Financial
Economics, forthcoming.
Bhattacharya, U., Daouk, H., Welker, M., 2002. The world price of earnings opacity. Unpublished
working paper, Indiana University.
Brown, L., Higgins, H., 2001. Managing earnings surprises in the U.S. versus 12 other countries. Journal
of Accounting and Public Policy 20, 373–398.
Brown, L., Higgins, H., 2002. Managers’ guidance of analysts: international evidence. Unpublished
working paper, Georgia State University and Worcester Polytechnic Institute.
Burgstahler, D., Dichev, I., 1997. Earnings management to avoid earnings decreases and losses. Journal of
Accounting and Economics 24, 99–129.
C. Leuz et al. / Journal of Financial Economics 69 (2003) 505–527526

Claessens, S., Djankov, S., Fan, J., Lang, L., 2002. Disentangling the incentive and entrenchment effects of
large shareholdings. Journal of Finance 57, 2741–2772.
d’Arcy, A., 2000. The degree of determination of national accounting systems — an empirical
investigation. Schmalenbach Business Review 52, 45–67.
Dechow, P., 1994. Accounting earnings and cashflows as measures of firm performance: the role of
accounting accruals. Journal of Accounting and Economics 18, 3–42.
Dechow, P., Skinner, D., 2000. Earnings management: reconciling the views of accounting academics,
practitioners, and regulators. Accounting Horizons 14, 235–250.
Dechow, P., Sloan, R., Sweeney, A., 1995. Detecting earnings management. The Accounting Review 70,
193–225.
Degeorge, F., Patel, J., Zeckhauser, R., 1999. Earnings manipulation to exceed thresholds. Journal of
Business 72, 1–33.
Doidge, C., Karolyi, A., Stulz, R., 2003. Why are firms listed in the U.S. worth more? Journal of Financial
Economics, forthcoming.
Dyck, A., Zingales, L., 2002. Private benefits of control: an international comparison. Unpublished NBER
working paper (8711).
Enriques, L., 2000. The law on company directors’ self-dealing: a comparative analysis. International and
Comparative Corporate Law Journal 2, 297–314.
Fan, J., Wong, T., 2001. Corporate ownership structure and the informativeness of accounting earnings in
east asia. Journal of Accounting and Economics 33, 401–426.
Healy, P., Wahlen, J., 1999. A review of the earnings management literature and its implications for
standard setting. Accounting Horizons 13, 365–383.
Hope, O., 2003. Disclosure practices, enforcement of accounting standards, and analysts’ forecasts: an
international study. Journal of Accounting Research 41, 235–272.
Hung, M., 2001. Accounting standards and value relevance of financial statements: an international
analysis. Journal of Accounting and Economics 30, 401–420.
Joos, P., Lang, M., 1994. The effects of accounting diversity: evidence from the European Union. Journal
of Accounting Research 34(Suppl.), 141–168.
La Porta, R., Lopez-de-Silanes, F., Shleifer, A., Vishny, R., 1997. Legal determinants of external finance.
Journal of Finance 52, 1131–1150.
La Porta, R., Lopez-de-Silanes, F., Shleifer, A., Vishny, R., 1998. Law and finance. Journal of Political
Economy 106, 1113–1155.
La Porta, R., Lopez-de-Silanes, F., Shleifer, A., Vishny, R., 1999. Corporate ownership around the world.
Journal of Finance 54, 471–517.
La Porta, R., Lopez-de-Silanes, F., Shleifer, A., Vishny, R., 2000. Investor protection and corporate
governance. Journal of Financial Economics 58, 3–27.
Land, J., Lang, M., 2002. Empirical evidence on the evolution of global accounting. Accounting Review
77(Suppl.), 115–133.
Lang, M., Raedy, J., Yetman, M., 2003. How representative are cross-listed firms? An analysis of firm
performance and accounting quality. Journal of Accounting Research 41, 363–386.
Levine, R., 1999. Law, finance and economic growth. Journal of Financial Intermediation 8, 8–35.
Nenova, T., 2000. The value of corporate votes and control benefits: a cross-country analysis.
Unpublished working paper, Harvard University.
Shleifer, A., Vishny, R., 1997. A survey of corporate governance. Journal of Finance 52, 737–783.
Skinner, D., Myers, L., 1999. Earnings momentum and earnings management. Unpublished working
paper, University of Michigan and University of Illinois.
Watts, R., Zimmerman, J., 1986. Positive Accounting Theory. Prentice-Hall, Englewood Cliffs, NJ.
Zingales, L., 1994. The value of the voting right: a study of the Milan stock exchange experience. Review
of Financial Studies 7, 125–148.
C. Leuz et al. / Journal of Financial Economics 69 (2003) 505–527 527