
COMPARATIVE EVALUATION STUDY OF ON-LINE CAMERA-BASED WEB INSPECTION SYSTEMS · COMPARATIVE...
64
COMPARATIVE EVALUATION STUDY OF ON-LINE CAMERA-BASED WEB INSPECTION SYSTEMS COMMISSIONED BY THE AMERICAN FOREST AND PAPER ASSOCIATION MEASUREMENT TECHNOLOGY COMMITTEE (AF&PA/MTC) in COOPERATION WITH THE INSTITUTE OF PAPER SCIENCE AND TECHNOLOGY This report may contain privileged and confidential information and is the property of the IPST, AFPA and R.K.B. OPTO-ELECTRONICS, INC. The individual or entity named above intends it only for use. If you are not the intended recipient you must not peruse, use, disseminate, distribute or copy this proposal and/or its attachments. Any unauthorized use of this information will be construed as a violation to the directives as outlined in the “Economic Espionage Act of 1996,” title 18, United States Code, sections 1831 and 1832. The obligations of any person or organization as prescribed by RKB’s confidentiality provisions and as described by law will survive termination of this information, contract, projects, discussion and/or any agreement in force. Any violation herein constitutes a breach of these terms and a United States Court of competent jurisdiction will hold law enforceable.
Transcript of COMPARATIVE EVALUATION STUDY OF ON-LINE CAMERA-BASED WEB INSPECTION SYSTEMS · COMPARATIVE...

COMPARATIVE EVALUATION STUDY OF
ON-LINE CAMERA-BASED WEB INSPECTION SYSTEMS
COMMISSIONED BY THE AMERICAN FOREST AND PAPER ASSOCIATION
MEASUREMENT TECHNOLOGY COMMITTEE (AF&PA/MTC)
in COOPERATION WITH THE
INSTITUTE OF PAPER SCIENCE AND TECHNOLOGY This report may contain privileged and confidential information and is the property of the IPST, AFPA and R.K.B. OPTO-ELECTRONICS, INC. The individual or entity named above intends it only for use. If you are not the intended recipient you must not peruse, use, disseminate, distribute or copy this proposal and/or its attachments. Any unauthorized use of this information will be construed as a violation to the directives as outlined in the “Economic Espionage Act of 1996,” title 18, United States Code, sections 1831 and 1832. The obligations of any person or organization as prescribed by RKB’s confidentiality provisions and as described by law will survive termination of this information, contract, projects, discussion and/or any agreement in force. Any violation herein constitutes a breach of these terms and a United States Court of competent jurisdiction will hold law enforceable.

IPST & RKB; 02/26/02 Page 1 of 63 ©Copyright 2002; RKB
AF&PA/MTC Comparative Evaluation Study of On-line Camera-based Web Inspection Systems
Evaluation of the R.K.B.® OPTO-ELECTRONICS, INC.
MODEL 3030® OPTOMIZER® Camera-based Video Web Inspection System for Holes, Flaws, Coating Streaks and/or Scratches
1. STUDY SCOPE 2. WHAT IS THE AF&PA 3. WHAT IS THE IPST
4. COMPANIES INVOLVED IN THE STUDY
5. COMPANIES THAT HAVE CONCLUDED and/or BACKED OUT OF THE STUDY 6. R.K.B. OPTO-ELECTRONICS, INC. (RKB) COMPANY PROFILE 7. SYSTEM RECOMMENDATION FROM RKB FOR STUDY
8. INSPECTION METHODOLOGY RELATIVE TO UNDERSTANDING CAMERA RESOLUTION
9. R.K.B. OPTO-ELECTRONICS, INC. INSPECTION METHODOLOGY 10. PAPER MILL EVALUATION STUDY CONDITIONS 11. R.K.B. OPTO-ELECTRONICS, INC. TRIAL EQUIPMENT 12. IPST PAPER MILL TRIALS and RESULTS 13. TRIAL RESULTS SUMMARY 14. RECOMMENDATIONS 15. COSTS
16. APPENDIX

IPST & RKB; 02/26/02 Page 2 of 63 ©Copyright 2002; RKB
1.0 STUDY SCOPE:
For many years the American Forest and Paper Association (AF&PA) Measurement Technology Committee (MTC) has been sponsoring instrumentation research studies of various kinds at the Institute of Paper Science and Technology (IPST). At a recent meeting of the AF&PA Measurement Technology Committee, IPST was asked to initiate a study concerned with the comparative evaluation of on-line camera-based web inspection systems.
This study involves only commercially available instruments, which will be provided by the manufacturers
on a demonstration basis. It is assumed that the manufacturers will incur all expenses relative to shipment, on-site installation, and operation during testing. Upon completion of the work, manufacturers will have the opportunity to review and comment the results pertaining to their respective instruments. Then, a final report will be issued and distributing to all paper companies supporting the Measurement Technology Committee. The distribution list will also include manufacturers participating in the study.
It must be made clear that the study will not attempt to rank the inspection systems. The report will include a
description of the experimental methodology, nonproprietary technical descriptions of all instruments (hardware, software, operation), results in tabular and/or graphical forms, and discussion on pluses and minuses per instrument basis. Results from different instruments may be reported together (e.g., bar chart illustrating hole detection performance) to facilitate comparison.
The Measurement Technology Committee has specified that the evaluation program must be conducted using a 24 to 30 inch (60 to 76 cm) web handling system capable of machine speeds up to 5000 fpm (1524 m/min). At this maximum speed, inspection systems must be capable of detecting a 1-mm (0.0394-inch) diameter hole. Also, all systems must be equipped with a minimum of two cameras.
The evaluations will be conducted per agreement between the IPST and Appleton Papers, at the pilot coater
machine located at Appleton Papers, Appleton, Wisconsin, USA. The evaluation plan assumes that a typical system can be tested within a period of five workdays. The MTC will provide various paper grades to be evaluation and will consist of Newsprint, Uncoated printing paper, Coated paper, Coated board and linerboard. It is assumed that all supplied paper will have present typical grade-related defects. Moreover, the IPST will prepare, by way of splicing, lengths of paper containing calibrated holes.
The following paper/paperboard grades to be supplied by MTC paper companies will be tested:
Newsprint Uncoated (printing) paper Coated paper Coated board Linerboard
It is assumed that the supplied webs will have typical grade-related defects. Moreover, IPST will prepare a
special web with simulated and calibrated defects (e.g., holes of known diameters and spots of known diameters). It is possible that two or three additional grades of interest to particular companies may be tested and analyzed by IPST in parallel to the main evaluation program.
The following list of defects is proposed for investigation
Blur defects Burst Coating scratches Coating voids Dirt Gels Holes Oil spots Scale

IPST & RKB; 02/26/02 Page 3 of 63 ©Copyright 2002; RKB
Smear defects Spots (light, gray and dark) Streaks Wrinkles
Whenever possible, the study will consider these issues:
Defect localization and classification schemes (MTC high priority) MD and CD detection capabilities (MTC high priority) Effect of machine speed variations Effect of vibrations Effect of dust Effect of lamp aging Efficiency of alarm system Efficiency of web markers Ease of use of equipment Quality of operating manuals
2.0 WHAT IS THE AF&PA:
AF&PA is the national trade association of the forest, paper and wood products industry. We represent member companies engaged in growing, harvesting and processing wood and wood fiber, manufacturing pulp, paper and paperboard products form both virgin and recycled fiber, and producing engineered and traditional wood products.
AF&PA members include manufacturers of over 80 percent of the paper, wood and forest products produced
in the United States. For interests as varied as those of small non-industrial private landowners, large multi-product producers and family-run mills, AF&PA acts as the clearinghouse for statistical information, as the leading force in technical, regulatory and policy issues, and as the national voice for the forestry, wood and paper industries.
AF&PA desires to have a diverse membership which represents 100 percent of the US forest and paper
industry. We are constantly working to return value to our members through innovative and effective programs that sustain and advance the industry's domestic and global competitiveness. We are committed to improving the environment as well as being a part of creating a better tomorrow.
2.0.1 HISTORY OF THE AF&PA:
The American Forest & Paper Association (AF&PA) is both one of the youngest and one of the
oldest major trade groups in the nation. AF&PA was founded January 1, 1993, evolving from predecessor groups dating as far back as the mid-1800's. Immediately prior to the founding of AF&PA, the forest products industry was represented by two organizations—the National Forest Products Association (NFPA) and the American Paper Institute (API)—each independent institutions with some common membership.
NFPA and API represented distinct sectors of the industry, with the former being the agent for the
forest and building products industries while the latter stood for the pulp, paper, and paperboard manufacturers. API is AF&PA's older direct predecessor, first formed as the American Paper Makers Association in 1878. Five years later, it was reorganized and renamed the American Paper Manufacturers Association. A wood pulp division was added in 1887, and 1897, the organization was again renamed—this time as the American Paper and Pulp Association (APPA), a name that lasted 66 years.

IPST & RKB; 02/26/02 Page 4 of 63 ©Copyright 2002; RKB
In 1964, APPA merged with the National Paperboard Association (founded in 1932) to form the Pulp, Paper, and Paperboard Institute. This incarnation proved fairly short-lived as the group was reorganized into API in 1966 through the consolidation of fifteen specialized pulp, paper, and paperboard associations (including most of the former federated associations of APPA). One of the groups absorbed then—the Writing Paper Manufacturers Association—was founded in 1861 and is AF&PA's oldest ancestor. NFPA's lineage dates back to 1902, when regional associations, led by the Southern Lumber Manufacturers Association and the Mississippi Valley Lumbermen's Association, founded the National Lumber Manufacturers Association. It operated under this name until 1965, when, reflecting the increasingly integrated character of major forest industry firms, it took on the NFPA moniker. However, NFPA remained a federation of associations until 1975, when a bylaw revision made it possible for individual companies to join directly.
The American Wood Council, a previously independent trade association established by the wood
products industry to provide generic promotion activities, was merged in NFPA's buildings and engineering function in 1991. Also supplementing the work of NFPA and API were the American Forest Council (AFC) and the American Forest Resources Alliance (AFRA), which were supported jointly by both industry sectors. At the same time of the NFPA/API merger, AF&PA absorbed parts of AFC. In addition, for some years before the merger, NFPA and API worked together in a joint environmental program.
In the early 1990's, the mutual interests of the wood and paper elements of the forest products
industry brought them to a decision to merge their distinct organizations. This decision was precipitated by the rising costs of environmental regulation, the growing pressures on the supply of virgin and recovered fiber, and the challenges to free trade in forest products. These developments signaled the need for a strong, united voice to fully and effectively represent the interests of the forest, pulp, paper, and wood products industry in public policy forums. It was decided that a single organization could speak more forcefully and more authoritatively, and do so more economically.
From its first day of operation, AF&PA have met the expectations of its founders. The association's
inclusive "big tent" philosophy has successfully united the various sectors of the forest products industry, providing an effective and influential presence in the public policy arena on all matters of industry concern. AF&PA's voice is heard by the Administration, Congress, federal regulatory agencies and within the halls of state legislatures. In addition, AF&PA has taken its leadership beyond the boundaries of the U.S. in its efforts to bring the world's forest products industries together and remove artificial barriers to competition.
While successfully representing the forest products industry in all forums, AF&PA continues to be a
work in progress. The Association is still evolving—improving its organization to be an effective advocate for member interests, and broadening its services to provide programs that support the industry in numerous ways.
AF&PA have in its short existence emerged as the leading voice for the forest products industry.
When any matter of major concern relating to the industry surfaces at the state, national, or international level, AF&PA is an active presence on behalf of industry interests and its advice and counsel is both sought and respected. Through its effective advocacy and superior membership services, AF&PA is rapidly gaining recognition as one of the nation's most powerful and effective trade associations.

IPST & RKB; 02/26/02 Page 5 of 63 ©Copyright 2002; RKB
3.0 WHAT IS THE IPST:
The Institute of Paper Science and Technology (IPST) was founded in 1929, the Institute was created to provide research and discover technologies that would strengthen paper products and increase production rates. IPST also became instrumental in moving the paper industry from an art to a science. Scientists with expertise in physics, engineering, biology, and chemistry researched major industry issues, and for the first time explained how paper was made. The IPST, a small private Georgia research institution, has been recognized as the fifth-most innovative institution in the nation, placing it higher than the Massachusetts Institute of Technology, Stanford University and Princeton University. The IPST is a unique organization whose charitable, educational and scientific purpose evolves from the singular relationship between the Institute and the pulp and paper industry which as existed since 1929. IPST is the largest academic center for pulp and paper research in the United States. In addition to conducting research for the state and federal governments, IPST has 52 member companies, 10 with Georgia operations. In 1989 IPST moved its institution from Appleton, Wis., to Atlanta, bringing a faculty of 34 and a research budget of $13 million. There are now 200 employees, 51 of them on the research staff, and a research budget of $15 million. The purpose of the IPST is fulfilled through four missions, which are, academic, research, technology transfer and information services.
3.0.1 HISTORY OF THE IPST:
In 1929, the Institute began with 19 member companies, based primarily in Wisconsin and the
Northeast. Today, the Institute boasts over 50 member companies with operations all over the world. Institute members manufacture over 60 percent of all of the paper made in North America.
The Institute was the first graduate school and cooperative research facility dedicated to a single
industry. From the very beginning, the Institute's curriculum supported a multidisciplinary approach to education to mold students into "scientific generalists". The term "scientific generalist" is defined as someone who is capable of integrating a collection of disciplines and focusing them upon problem solving, not only in scientific and technological fields but also in other areas. In 1995, the National Academy of Sciences, the National Academy of Engineering, and the Institute of Medicine validated this approach to graduate education. In a document entitled Reshaping the Graduate Education of Scientists and Engineers, they concluded that graduate programs that provide students with a wider variety of skills produce more versatile scientists and engineers. They finally understand what the Institute has known since 1929.
The Institute of Paper Chemistry was created with a threefold mission: to offer education at the
graduate level applicable to the pulp and paper industry, to conduct research aimed at solving industry problems using the best scientific minds and state-of-the-art equipment, and to provide information through the creation of an industry-specific scientific library. Now known as the Institute of Paper Science and Technology, its missions have stood the test of time. The Institute is still focused on its academic, research, and information missions and has recently added a new mission of technology transfer. The Institute recognizes that new technologies must be applied to commercial operations as rapidly as possible to provide the greatest degree of value to industry.
The first Executives' Conference was held in the spring of 1936. Only about forty executives came
to the first conference, but they left with enthusiasm and the conference became an annual event. Today the Institute has hosted over sixty Executive Conferences, which now attract over 100 guests each year.
The first Bush Trip was in September of 1935. That year sixteen first-year students started classes
by visiting a logging camp to obtain firsthand knowledge of logging operations, wood measuring, the studying of wood costs from the stump to the car, and general conservation policies. This year the students went through Alabama beginning in Mobile, through Pine Hill, and ending in Courtland. International Paper gave the group a tour of their Mobile facility, which makes uncoated free sheet and bleached kraft papers. Next, they made their way to Pine Hill to the Macmillan Bloedel packaging facility, which offered tours of the woodyard and the pulp- and paper-mill operations where unbleached kraft linerboard is manufactured. The last stop was in Courtland at Champion International to see matte- and gloss-coated offset printing papers. At each location, alumni and friends of IPST were gracious in giving tours and answering students' questions.

IPST & RKB; 02/26/02 Page 6 of 63 ©Copyright 2002; RKB
The Institute was originally situated in a series of rooms located on the second floor of Lawrence College's gymnasium. It was thought that these quarters might suffice for two years, however, students were attracted more quickly than anticipated, and through the generosity of individuals, as well as supplier companies, the library mushroomed and equipment began to arrive at the front door. After only a few months the newly born institution was rapidly outgrowing its facility. From its humble beginnings the Institute has now grown into its present location in midtown Atlanta. The Institute currently has two research facilities which house over 75 separate laboratories.
4.0 COMPANIES INVOLVED IN THE STUDY:
R.K.B. OPTO-ELECTRONICS, INC. ABB Honeywell-Measurex Cognex Focus Automation (Toshiba)
5.0 COMPANIES THAT HAVE CONCLUDED and/or BACKED OUT OF THE STUDY:
5.0.1 CONCLUDED STUDY
R.K.B. OPTO-ELECTRONICS, INC.
5.0.2 BACKED OUT OF STUDY
ABB Honeywell-Measurex Cognex Focus Automation (Toshiba)
To date it is reported by confirmed sources within the knowledge of the study that all other companies have
either backed out of the study or are no longer in business supplying web inspection equipment and/or related products.
6.0 R.K.B. OPTO-ELECTRONICS, INC. (RKB) COMPANY PROFILE:
R.K.B. OPTO-ELECTRONICS, INC., (RKB as it is more widely known) was founded with a commitment to innovation in the creation of new approaches for on-line web inspection techniques that are successful, proven and reliable. Located in Syracuse, New York, RKB designs, manufactures and implements the most diverse and innovative online web inspection solutions for the detection of various defect faults commonly found in much web-based process manufacturing environments. RKB alone has installed more than 1300 web inspection solutions worldwide ranging from splice detection solutions to full sheet defect fault monitoring systems. RKB has more than fifty years experience specific to paper, paperboard and conversion web inspection applications. The cornerstone of our success is our technological expertise headed by the industries leading web inspection expert William Dobbie. Under the guidance of Mr. Dobbie, RKB developed and patented many of the common techniques in use today such as ultraviolet hole detection, infrared, photo transistor-based flaw detection and recently developed a revolutionary technique for the detection of very subtle coating streaks and scratches in all forms of coated material. This new patented coating streak detection system now makes possible the reliable detection of very small scratches (down to 5µm) at any known production speed. Certainly a phenomenon unattainable until now!

IPST & RKB; 02/26/02 Page 7 of 63 ©Copyright 2002; RKB
RKB is currently developing a new splice detection solution that will revolutionize the detection capability and eliminate all forms of interference such as web flutter that can cause false splice indications if not properly corrected. This new splice detection solution will eliminate the need for our customers to take extra precautions and extra expense when installing our leading edge, state of the art splice detection solutions. Many of the employees have been with RKB firm for more than 18 years with key personnel celebrating more than 20 years with RKB. RKB’s technological expertise coupled with it’s leading market position and support disciplines provide all customers with leading edge technology that is unequaled in our industry. We are committed to our industry and to the manufacturers of paper and paperboard who depend on us to ensure that quality is maintained at the highest possible level. We rely on openness and cooperation, enabling us to become an integral part and valuable link in the overall process of papermaking.
In 1992, RKB was awarded from the United States Patent and Trademark Office a patent for it’s innovative design making way for RKB to release its new coated web based material detection technology to the paper, paperboard, and allied trade industries. Since 1992, RKB has successfully implemented its new coating streak and scratch detection technology in both the United States and European Markets.
Today, RKB continues to develop new technology and has over 800 installations worldwide in over 46 countries.
6.0.1 HISTORY OF RKB:
RKB was the first commercial on-line web inspection supplier in the world. With more than fifty
years experience in web inspection techniques and solutions, RKB has significantly extended the benefits of automatic optical web inspection. Early RKB systems were based on patented ultraviolet, photomultiplier and infrared, phototransistor technology. Originally based in Canada, RKB developed and patented many of the void and defect fault technologies currently used by many well-known multinational companies. Many installations are still on-line performing with unprecedented reliability today! In 1960, Leigh Controls Ltd., a namesake, acquired RKB (known at that time as Nash and Harrison). Under the guidance of Leigh Management, RKB developed and patented the first camera-based system called the Vidicon 7000. The Vidicon 7000 was designed to detect defect faults in various microfilm processes.
In the late 1970's, RKB relocated to the United States to improve its logistics and purchasing power
where it remains today. In 1980, the web inspection industries most experienced engineer purchased Leigh and changed the name to R.K.B. OPTO-ELECTRONICS, INC. As the leading industry expert in web inspection, William Dobbie, President and CEO improved existing technologies, introduced CCD line scanning technology and developed and patented the most innovative, state-of-the-art solution for the on-line detection of very subtle streaks and scratches. Using the most advanced digital technology available, RKB’s streak detection systems can monitor and detect streaks and scratches down to sizes that no other company can achieve no matter what process speed your manufacturing at. Called the OPTOMIZER®, it is the latest breakthrough in the art of defect fault detection. This advanced scanner truly represents a quantum leap forward in the technology!
7.0 SYSTEM RECOMMENDATION FROM RKB FOR STUDY:
The main proposed system recommended by RKB for demonstration will be its Model 3030® CCD Camera-based Video Web Inspection System (commonly called the OPTOMIZER®). The Model 3030 uses line-scanning and specialized streak detection technology as the sensing platform. The reason for this recommendation is due to the overall specifications of the project, defect types, product types and various operational machine speeds. The Model 3030 is an extra fast system, providing superior resolution to detect the smallest defects at high line speeds. Since RKB will be dealing with high-speeds and a variety of grades and weights, a specialty of RKB, the overall system solution can be implemented more effectively than just competitive line-scanning techniques.

IPST & RKB; 02/26/02 Page 8 of 63 ©Copyright 2002; RKB
The inspection solution(s) consist of a control station, operator station, sensing station, lighting station and an encoder/interface unit. The enclosures are built to NEMA 4 and NEMA 12 standards and are designed to withstand hostile manufacturing environments. The system control station houses all electronic processing hardware, I/O hardware, troubleshooting equipment, system power and speed monitoring units. The operator station houses all PC-based operational equipment that has a WindowsNT® graphical user interface. The inspection station, designed to span the entire web width generally located prior to the take up roll, houses all of the proprietary Opto-Tek I™ & patented Opto-Tek II™ camera technology and distribution hardware. The lighting station houses the equipment energy sources used to enhance the material web for defect detection. Due to the sensitive nature of this project and competitiveness of the inspection industry, overall system geometry related arrangements and equipment references will not be made available. However, the proposed solution will be sufficient to capture the smallest autonomous defect fault allowable at the prescribed application.
The Model 3030 Video Web Inspection System is designed on open standards making it easy to link to other
process control equipment. The Model 3030 comes equipped with a full data acquisition program called the Quality Assurance Management System (QAMS®). QAMS, based in the WindowsNT® environment, is fully DDE compliant, allowing a variety of options for data storage and usage. QAMS uses OLE and TCP/IP technology to easily interface with a variety of industry-standard statistical process control packages, factory networks, PLC’s and controllers. The QAMS is linked to web movement with a sophisticated encoder interface. Real-time ejection or marking of defects can be accomplished with finite precision.
The Model 3030 uses industry-standard TCP/IP, RS-232 and RS-422 communication links. The chassis
allows integration of a variety of third party hardware. The system has the most desired scalable architecture available and can accommodate single or double sided inspection, be configured with multiple cameras with no theoretical limit, powerful to handle any process speed currently in use, advanced processing power and field upgradable design. The QAMS provides live display of web defects under inspection, object oriented software based in Visual C++, multi-tasking, TCP/IP DDE OLE communications, WindowsNT operating system, real time defect, trend and profile information, and can be tailored suited to accommodate the users reporting process or environment. QAMS will advise production of repeating faults, type of fault and probable location so immediate action can be scheduled to eliminate the fault-causing problem (i.e., defective wire, felt, and roll or calendar section). QAMS will report, on demand, a review of defect trends and classes and provides shift and roll reports, product grading reports, day, week or monthly reports and can be transferred across network lines to a host. Using MS Access, data can be easily converted to work with Excel and other forms of .dbf formats.
Simplified diagnostics within the inspection system itself will quickly inform production of any irregularities,
which may require maintenance or corrective action (i.e., bad power supply, sensor, a light source, processing circuits, etc). All components and main system structures will be manufactured with safeguards that will enhance the reliability of the system when exposed to environmental and signal interference conditions. All system components will be housed in ISO rated and environmentally sound enclosures that have positive air purge systems applied. Each unit will come with complete advanced power isolation units that regulate and distribute the power load across the full inspection system.
8.0 INSPECTION METHODOLOGY RELATIVE TO UNDERSTANDING CAMERA
RESOLUTION:
To understand the methodology of high-speed, web inspection defect detection using CCD technology, you must first understand camera resolution and how that resolution is derived versus size of fault, machine speed and process manufacturing environment. Since the invention of the Charged Coupled Device (CCD; A semiconductor device that stores energy and transfers it sequentially to an amplifier and/or detector, Figure 1) back in the 1960's by Bell Labs, CCD technology has become an industry-standard image sensor. In particular, CCD line scanning technology has become the most widely used imaging platform for non-contact, electro-optical measurement of various defect faults commonly found in many paper, paperboard and conversion operations.

IPST & RKB; 02/26/02 Page 9 of 63 ©Copyright 2002; RKB
Of the available CCD line scanning arrangements (i.e., 512, 1024, 2048 and 4096), most suppliers base their standard platform off of the 2048 pixel formats (RKB uses the 1024 platform). This device is a monolithic component generally containing a single row of 13µm (0.00051 inches) square light sensing elements (pixels or photosites)1 (Figure 2). Light energy or the lack thereof received by the pixels generates electron charge packets proportional to the product of integration time and incident light intensity. The electron charged packets are then transferred in parallel to processing circuitry for delivery to signal amplifiers where they are converted into proportional voltage levels. Additionally, CCD’s contain additional processing pixels (non-active sensing pixels) used internally by the sensor for other various functions. All CCD cameras operate with two differential clock signals, a data rate clock (fixed) with a preset frequency that determines the frequency which the video data is clocked out of the camera and a line rate clock (individually adjustable) which specifies the camera scan rate and integration period.
Figure 1 – 2048 Pixel Line Scan CCD Chip
Figure 2 – Detailed view of the Pixel Dimensions
CCD camera based web inspection suppliers typically define system resolutions (or minimum defect size) as
the field of view (FOV) per sensor in the cross machine direction divided by the number of pixels contained within that sensor. That means a 2048 pixel linear array camera viewing 20 inches (50.8 cm) of material in the cross machine direction should have a resolution of slightly less than 10 thousandths of one inch (0.254 mm) or the size of the pixel resolution in the cross machine direction (Table 1).
It, therefore, is also true that a 1024 pixel camera with a 10-inch (25.4-cm) field of view cross machine direction would have approximately the same resolution. The subtle difference is that this resolution may only be true for non-moving or static material, thus it is most accurately called “Static Resolution” (Figure 3).
1 Photosites or pixels are silicon based energy packets similar in function to phototransistors.

IPST & RKB; 02/26/02 Page 10 of 63 ©Copyright 2002; RKB
Figure 3 - Cross machine pixel resolution on a stationary web or "Static Resolution"
In reality, the actual resolution of any CCD camera based video imaging inspection solution is more difficult
to calculate precisely, especially when applied to material that is manufactured at high rates of speed such as coated paper. Unfortunately, there are too many unknown factors that can affect the overall resolution of any given CCD camera based system to accurately pinpoint the systems finite resolution in any given application. Light intensity, machine speed variances, vibration, environmental conditions, applicable data and scan rates actually used in and/or by camera sensors, camera sensor placement from the focal point, to name a few can all adversely affect the expected output of any CCD camera based system, no matter who supplies the system.
Another factor, which has a direct affect on system resolution capability, is Nyquist Theorem. In 1928, Henry Nyquist determined that, when sampling at a given rate, the highest frequency that can appear in the sampled signal is half the sampling frequency. If the sampled signal contains frequencies higher than half the sampling frequency (higher than 4 kHz when sampling at 8 kHz as is the case for µ-law), these higher frequencies will appear folded down to below half the sampling frequency when the signal is reconstructed. This is the Aliasing problem. This problem, commonly referred to as Nyquist’s Law of Unambiguous Detection Measurement, states that the “Defect or event being inspected must be 3 times the diameter of the actual pixel coverage size to guarantee that the defect fault or event covers at least one full pixel under any circumstance (Figure 4).
Figure 4 – Nyquist’s Law of Unambiguous Measurement

IPST & RKB; 02/26/02 Page 11 of 63 ©Copyright 2002; RKB
Since “Static Resolution”, as described above, does not account for web movement during the time interval that the CCD array is collecting and reading off the energy, true pixel array resolution cannot be determined for any applicable application. Actual resolution or “Dynamic Resolution” of any CCD array must be calculated to include the web material process speed, which can have a dramatic affect on overall resolution capabilities of any CCD Array. To determine, within reason, the approximate true resolution of a CCD Array, we must know two things; the web material process speed and the actual scan rate used by the equipment supplier to drive the CCD Array. As we should all know by now, CCD arrays measure the amount of energy falling on them over some time interval. The length of the interval is a function of the number of pixels within the CCD array, and the clock rate used to drive the array. Pixel count and clock rate are normally provided by the inspection system supplier or listed on the system suppliers product literature2.
It is fairly easy to estimate what true resolution can be expected for any CCD array as applied to any
potential inspection application. Thus, a best-case and worst case resolution scenario can be determined. First of all, two pieces of data are required to effectively calculate the true resolution of any CCD camera based solution. You need to know the cross machine direction resolution (CDR – commonly referred to as static resolution; Figure 3) and the machine direction resolution (MDR – commonly referred to as dynamic resolution; at speed; Figure 5) per pixel. These two resolutions, when calculated together, determine the true operational pixel resolution for a particular application.
Figure 5 – Machine Direction pixel resolution on a moving web or "Dynamic Resolution"
An example is instructive:
Your application involves the inspection of a paper web 100 inches (2.54 meters) wide being processed at
1000 feet per minute (304 m/min). The CCD array you decided to use is based on 2048 linear pixels and you are going to place each sensor so that the field of view per sensor is 20 inches (50.8 cm). This array will operate or scan at 20MHz. What are the static and dynamic resolutions? To determine the static (CDR) resolution you take the field of view (FOV) of the sensor and divide it by the number of active pixels used by the CCD array (i.e., 20” FOV ÷ # of pixels (Table 2)).
2 Be wary of the clock rate figure provided as many suppliers will provide the maximum allowable rate, but not necessarily the rate that is actually used by them for inspection.

IPST & RKB; 02/26/02 Page 12 of 63 ©Copyright 2002; RKB
To determine the dynamic resolution (machine direction resolution; MDR) you must take the number of active pixels (P) plus the additional non-active pixels and divide by the data rate (DR) used. This will give you the actual scan rate. The scan rate, which is the time it takes to scan through all pixels, is then multiplied by the web speed (WS3) which will give you an initial pixel resolution (IPR) in the machine direction. That IPR is then added to the CDR4 to give you the actual MDR of the above listed example (Table 3).
The above calculations have now provided you with both the CDR (Figure 3) and MDR (Figure 5) resolution of the active pixels contained in the sensor you are using for the above example. Thus, for a paper web traveling at 1000 fpm (304 m/min) with a 2048 pixel camera applied at a FOV of 20 inches (50.8 cm), the pixel coverage area is 0.010 inches (0.254 mm) CD by 0.031 inches (0.784 mm) MD. From the above calculations, we can now calculate the true resolution of each pixel contained within the specified CCD array. By taking the CDR and multiplying it by the MDR, the overall area that each pixel covers for this specified example is 0.21 sq. mm (according to TAPPI Test Method T437; Dirt in paper and paperboard). Another fact born from the calculations above is how much the paper web will move during one full CCD array scan. We know that the scan rate is 104.3 µs, thus the paper web which is traveling at 1000 fpm (304 m/min) moved 0.020 inches (0.508 mm), twice the static resolution (Figure 3).
Every CCD camera-based solution, no matter what CCD pixel array you use, has a best case and worst-case
resolution scenario. If a defect fault or event covers the full pixel, either in a static environment or dynamic environment, the voltage signal output is at its highest optimum level or full modulation (best case). However, in reality one has to deal with machine process speed, various energy levels, and web tension control fluctuations, web wander, shrinkage and other variables generally not present during inspection in a static environment. All these factors can seriously alter your best case resolution scenario. Another “real-world” issue that most suppliers neglect to consider is the relative timing between a defect fault or event during any one particular CCD pixel array scan. Unfortunately, reality being such as it is, many defect faults or events cover only a portion of the full pixel during any one scan and the resultant voltage signal output is reduced from its optimum level or modulation. It is quite feasible that a defect fault or event could fall on a quarter of the pixel coverage providing only a 25% optimum voltage level output or modulation (worse case). Refer to Figure 6 for a depiction of the best case and worse case signal responses.
3 Remember to adjust the web speed from fpm (m/min) to inches per second (mm/sec). 4 Remember the pixels 13 µm square which means that the CDR static is = to the MDR static and must be added to the IPR for actual MDR resolution at speed.

IPST & RKB; 02/26/02 Page 13 of 63 ©Copyright 2002; RKB
Figure 6 – Best Case/Worse Case Signal and Defect Resolution Response
As seen above in Figure 6, when a defect fault during a CCD linear array scan lands completely within the
pixel, the resultant voltage level output is at full modulation or 100%. However, when the defect fault lands on the crosshairs, so to speak, upon completion of one scan and initiation of another, approximately ¼ of the defect fault is detected resulting in ¼ modulation or 25%. This phenomenon, which can reduce the ability of the detection process, can be avoided if proper and direct care is taken prior to manufacturing a system to take the possibility of decrease modulation into account. Additionally, the reduction in defect modulation dramatically gets worse when machine process speeds are increased. Of course, lighting which is another factor, can play an important roll if you cannot generate enough energy to run the CCD array at optimum scan rates.
Although it is common knowledge that most, if not all, CCD linear array chip sets are rated to work at
20MHz data rate (pixel clock rate). In reality, it takes a very high-energy source to actually achieve this operational rate, if achievable at all. Some CCD chip set suppliers claim to have developed linear arrays, such as a 2048 pixel array, that can operate at 40MHz or higher. This is true and false. If the camera is broken into sections (i.e., dividing 2048 pixels by 4) and parallel processed, then the flow of information is increased from a standard 2048 at 20MHz. However, these types of sensors are very expensive and generally are prohibitive from being used in most applications when costs to implement defect detection are just not warranted. It is believed that all vendors of CCD camera-based video web inspection systems claim the highest possible data rates. RKB does the same thing and it is considered a very viable marketing tool. However, taking this hype out of the picture, reality sets in. In most on-line CCD camera based systems, the actual data rates being used by vendors such as HMX, ABB, Cognex, etc… is not the suggested data rate by CCD chip set manufacturers. In fact, in many cases, the current installed based on camera based systems are operating with scan rates within the 7 to 12 MHz range. RKB generally operates, depending on the application, between 15 and 18 MHz, which is more than sufficient for most inspection applications.
Point of fact! It has been disclosed to RKB by various users of current CCD camera systems and through
head to head, on-line trials with two of the worlds biggest suppliers that their actual operational data rate (scan rate) used is much lower than the rated data rate of the CCD chip sets used and specified the Chip manufacturers. This is due to many factors including, but not limited to sensor placement (distance to web surface), utilization of wide angle lenses, use of extensive software oriented controls and algorithms for actual defect detection (not defect display), types of lighting techniques used and the use of improper CCD linear array chip sets or improper number of sensors. Finally, web speed plays an enormous roll as a detractor for reliable, consistent and accurate detection.
IPST & RKB; 02/26/02 Page 14 of 63 ©Copyright 2002; RKB
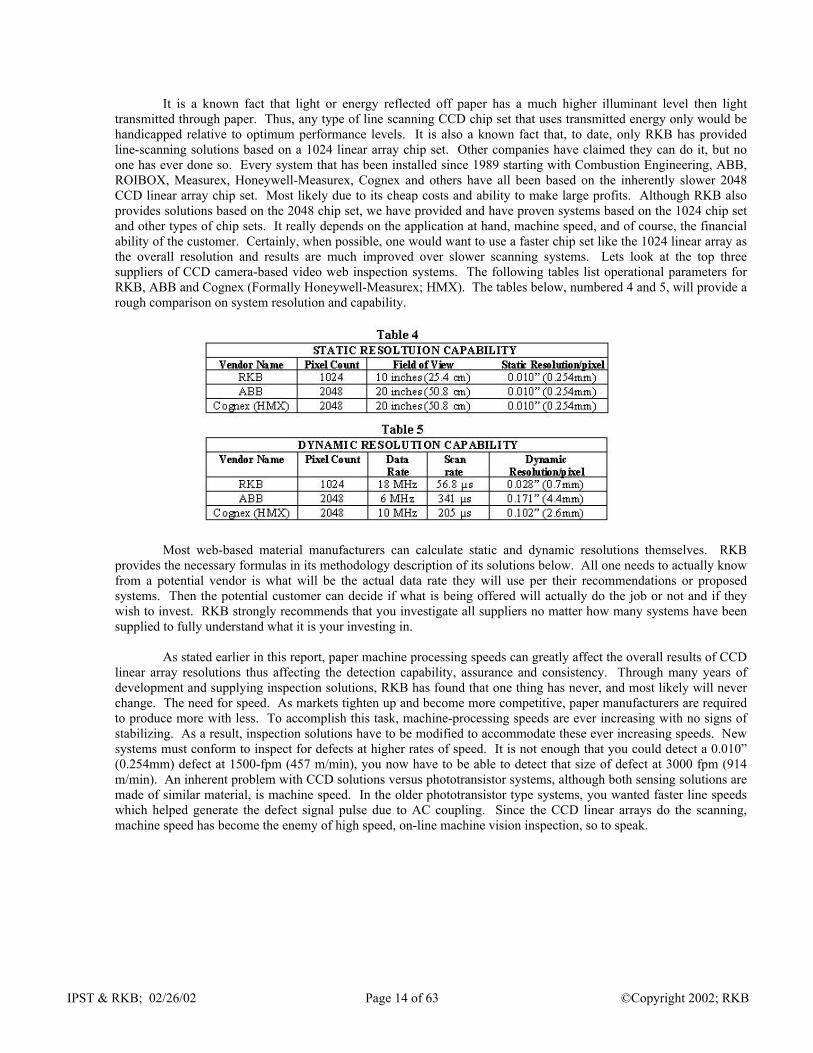
It is a known fact that light or energy reflected off paper has a much higher illuminant level then light transmitted through paper. Thus, any type of line scanning CCD chip set that uses transmitted energy only would be handicapped relative to optimum performance levels. It is also a known fact that, to date, only RKB has provided line-scanning solutions based on a 1024 linear array chip set. Other companies have claimed they can do it, but no one has ever done so. Every system that has been installed since 1989 starting with Combustion Engineering, ABB, ROIBOX, Measurex, Honeywell-Measurex, Cognex and others have all been based on the inherently slower 2048 CCD linear array chip set. Most likely due to its cheap costs and ability to make large profits. Although RKB also provides solutions based on the 2048 chip set, we have provided and have proven systems based on the 1024 chip set and other types of chip sets. It really depends on the application at hand, machine speed, and of course, the financial ability of the customer. Certainly, when possible, one would want to use a faster chip set like the 1024 linear array as the overall resolution and results are much improved over slower scanning systems. Lets look at the top three suppliers of CCD camera-based video web inspection systems. The following tables list operational parameters for RKB, ABB and Cognex (Formally Honeywell-Measurex; HMX). The tables below, numbered 4 and 5, will provide a rough comparison on system resolution and capability.
Most web-based material manufacturers can calculate static and dynamic resolutions themselves. RKB provides the necessary formulas in its methodology description of its solutions below. All one needs to actually know from a potential vendor is what will be the actual data rate they will use per their recommendations or proposed systems. Then the potential customer can decide if what is being offered will actually do the job or not and if they wish to invest. RKB strongly recommends that you investigate all suppliers no matter how many systems have been supplied to fully understand what it is your investing in.
As stated earlier in this report, paper machine processing speeds can greatly affect the overall results of CCD
linear array resolutions thus affecting the detection capability, assurance and consistency. Through many years of development and supplying inspection solutions, RKB has found that one thing has never, and most likely will never change. The need for speed. As markets tighten up and become more competitive, paper manufacturers are required to produce more with less. To accomplish this task, machine-processing speeds are ever increasing with no signs of stabilizing. As a result, inspection solutions have to be modified to accommodate these ever increasing speeds. New systems must conform to inspect for defects at higher rates of speed. It is not enough that you could detect a 0.010” (0.254mm) defect at 1500-fpm (457 m/min), you now have to be able to detect that size of defect at 3000 fpm (914 m/min). An inherent problem with CCD solutions versus phototransistor systems, although both sensing solutions are made of similar material, is machine speed. In the older phototransistor type systems, you wanted faster line speeds which helped generate the defect signal pulse due to AC coupling. Since the CCD linear arrays do the scanning, machine speed has become the enemy of high speed, on-line machine vision inspection, so to speak.

IPST & RKB; 02/26/02 Page 15 of 63 ©Copyright 2002; RKB
As with all inspection solutions, the resultant output obtained from the electronic processing modules is an electronic signal. In this signal you have what we call noise (generated by the product itself). From that noise, you have discrete voltage spikes that may or may not be defect faults (Figure 7). This overall signal is referred to as the signal to noise ratio. In most cases, one would want a signal to noise ratio of 3:1 or better, with 3 representing the defect and 1 representing the noise. However, since reality shows that defects do not necessarily land and cover a full pixel in any given scan, as shown in Figure 6, the resultant voltage levels become lower and more difficult to discern. This phenomenon is especially true with subtle dirt and coating streaks/scratches. Under a static environment, all sensors should produce similar results with similar outputs. However, when machine speed is applied to the equation, the defect may not provide the optimum modulation during detection to provide a reliable output signal. This has been demonstrated in the paper industry time and time again. RKB Commonly hears from papermakers that the units they currently use are so sensitive and see everything that they have to reduce the detection threshold. This was a common statement made when Laser Systems had there hey day. What is actually occurring is that the defect electronic signal is not strong enough nor contains significant characteristic changes for the inspection system to pick out the defect from the random noise. As such, the inspection system is rendered for all intent and purpose, useless.
Product Noise
DefectElectronic Signal
Figure 7 - Signal to Noise Level of Defect Vs Material
The fact is that over sensitive systems cannot discriminate between junk noise produced by the web material
from an actual defect. Yes, it may be true the systems did detect the defect fault, but they detected a lot of other stuff (i.e., fibers, dust, etc.) that was not considered defective material. In most, if not all cases, the operational staff end up adjusting the unit to eliminate the false detection’s and settle for what the unit can do which is a far cry from what they paid for the unit to do.
For example, lets take a 1/32” (0.8mm) black spot on a white paper. Apply machine speed to the paper web and increase said speed accordingly. As you can see in Figure 8, the detection capability of the CCD linear array chip set deteriorates due to the fact that the defect fault or event is no longer falling or covering one full pixel, but only part of a pixel during any given scan. Therefore, the modulation of the defect electronically starts to decrease until it become completely immersed within the noise level of the product material itself.

IPST & RKB; 02/26/02 Page 16 of 63 ©Copyright 2002; RKB
Figure 8 – Effects of web speed on the defect signal to noise ratio
Another phenomena that hinders reliable detection with CCD’s, unless taken into account, is pixel stretch.
Again, as you can see in Figure 8 above, as you increase the machine speed, the machine direction resolution per pixel also increases or stretches. This affect causes the total area covered by the pixel to increase. Therefore, if you are looking at a 1/32” (0.8mm) black spot that covers a full pixel in static mode (left view in Figure 8), the same size spot will cover less of the pixel as machine speed increases until the modulation level of the voltage signal decreases to the point of non-detection (right side view in Figure 8). Now, take a white colored streak on white-coated paper and apply the same principal. Not only does the contrast level significantly decrease, but streak detection no longer can be done using line scanning technology as there is no way of being able to bring the subtle defect out of the noise level if your pixel coverage is, lets say 2mm wide by 10 mm line and your fault is only 5% or 10% of that coverage.
Earlier we mentioned that wide angle lenses also affects reliable detection. The main reason why suppliers
of inspection systems would use this type of lens is to facilitate the use of as few sensors as possible, keeping costs down while maintaining profit margin. Although some applications would require the use of wide-angle lenses, main stream paper inspection is not one of them. Utilizing wide-angle lenses creates Vignette (Figure 9). Vignette is defined as “an image that shades off gradually into the surrounding background.”
Figure 9 - Vignette Affect on Electronic Signal resulting from Wide Angle Lensing
IPST & RKB; 02/26/02 Page 17 of 63 ©Copyright 2002; RKB
Vignette applied to the electronic output signal of a paper defect fault or event, the defect eventually fades off into the noise level of the product material itself seriously degrading the detection systems capabilities for reliable, accurate and consistent detection. This becomes more apparent towards the outer fields of view of the sensors. It is RKB’s opinion, although commonly used in our industry by others, that wide-angle lenses sacrifices the ability of the detection system to perform for the customer as intended. As seen in figure 9, the top oscilloscope representation shows the RKB CCD solution that is designed without the use of wide angle lenses, thus NO VIGNETTE phenomena affects detection reliability. The bottom picture shows what happens when wide-angle lenses are put in place to reduce the number of sensors required to do the job. The result, serious vignette problems exist.
What about coating streaks and scratches? It is true the above information mostly talks about CCD resolution as applied to autonomous defect detection and not streaks which are line type defects that generally run true to the machine direction. The reason is that the above information is relative to CCD line scanning solutions. It is RKB’s position that line-scanning solutions do not work well when applied to streak type phenomena. Why, for many reasons, but the most apparent is that streaks are commonly very subtle in nature and do not have significant deviations from the material in which they occur in. Therefore, the signal to noise ratios generally obtained using line-scanning cameras is not defined well enough to generate a significant electronic defect signal from the electronic noise level of the material being inspected. As a result, the threshold detection settings would have to be set very low which can cause false signals to be generated.
Another reason RKB believes line-scanning techniques are not a valid approach for streak detection is due to the sensor make up themselves which are very similar to phototransistor type sensors. Every pixel, no matter what type of line scan chip set format is used, is made up of similar material (silicone) as a phototransistor. Since you are dealing with one TV line cross machine direction, the line scanning array becomes more or less like a point source sensor like phototransistors packed cross direction. The only difference is that under machine speed, the pixel of a line scan array will stretch and the phototransistor sensor will remain constant. What happens during streak detection is that the material with the defect will pass under the sensor (i.e., pixel or phototransistor) and without significant contrast, causing the sensor, in a way, to recalibrate itself to the new material in this case the defect. Thus, to the sensor, there is no defect, just new material. Yes, the sensor may pick up the change at the beginning of the streak and end, but will not signal during the length of the streak. As a result, many times, a line scan camera will misinterpret the defect as a spot and report as such completely missing the actual event. This has been proven time and time again since the introduction of camera systems that use only line scanning techniques.
Another fact to consider is that if all the so called “Brand Name” suppliers use the same sensor array (i.e.,
2048 pixel chip set), then how could one system outperform the other if the main “BRAIN” of the unit is the same. The answer is that they cannot and this has been proven by many current installations worldwide, especially those at coated paper making facilities. In short, if the system you implement cannot see or discriminate the defect from the noise, it will never register or classify the defect. To the knowledge of RKB, all suppliers of camera inspection equipment base their systems around the 2048 pixel line scan chip set. As a result, none of these companies have been overly successful in coating streak detection. As a result, these systems become, in effect, useless tools that can only provide hole and gross spot detection. Specifications that most paper makers finally accept. But at what cost? We for one would not want to end up with a hole detector that we could have gotten at 1/10th the price. This is not just RKB opinion, but based on facts presented to us from users in the field and the physical makeup of the sensors themselves.
RKB will address its streak detection methodology, along with its line scanning methodology in the
following section titled RKB methodology. We recommend that this section be read completely as it will provide very good insight into how camera technology works and ours in particular.

IPST & RKB; 02/26/02 Page 18 of 63 ©Copyright 2002; RKB
9.0 R.K.B. OPTO-ELECTRONICS, INC. INSPECTION METHODOLOGY:
9.0.1 Autonomous Defect Faults Detection Methodology (Holes, Dirt, Oil, etc):
Since the invention of the CCD (charged coupled device) back in the 1960's by Bell Labs, CCD technology has become the industry-standard image sensor. In particular, CCD line scanning technology has become the most widely used imaging platform for non-contact, electro-optical measurement of various defect faults commonly found in many steel, aluminum, plastic, film, foil, textile, nonwovens, board, paper and conversion process manufacturing operations. This device is a monolithic component containing a single row of 13µm by 13µm light sensing elements (pixels). Of the available CCD pixel resolutions (i.e., 512, 1024, 2048 and 4096), most suppliers base their standard platform off of the 1024 or 2048 pixel formats. Additionally, all CCD formats contain approximately 38 additional processing pixels (non-active sensing pixels) used internally by the sensor for other various functions. The light energy, or lack there of, detected by the pixels generate electron charge packets proportional to the product of integration time and incident light intensity. All CCD cameras operate with two differential clock signals, a data rate clock (fixed) with a maximum frequency up to 20Mhz which determines the frequency which the video data is clocked out of the camera and a line rate clock (individually adjustable) which specifies the camera scan rate and integration period.
FOV5 ÷ P6 = CDR7
The machine direction resolution (MDR) per pixel is somewhat more involved and is directly
affected by web or machine speed, active and inactive pixels and the sensor data rate used. The formula to determine the machine direction resolution is calculated as follows: -
P+388/DR9 x WS10 + CDR11 = MDR12
As seen above, CCD’s use an additional number of pixels when determining actual MDR
specifications. This is because the frequency of the data rate determines the rate at which video pixels are clocked out of the sensor. Pixel data is available within 20 ns of a rising data rate clock edge. This rising data rate causes pixel data to be transferred within the CCD to analog shift registers. The frequency of the data rate clock is the camera scan rate. Pixel charge accumulates only during the logic low state of this signal. Thus, no charge is accumulated when the signal is in the high state. Therefore, electronic exposure control is exercised by controlling the duty cycle of the data rate clock, while the camera scanning rate is controlled by its frequency.
The logic high or low level of the clock must be a minimum of two data rate clock periods. These
signals need not be synchronized as this is accomplished within the camera. As a result, a number of additional pixel clocks are required to fully clock out any CCD sensor after pixel transfer occurs. Thus to determine the actual machine direction resolution of all line scanning sensors whether they are 1024, 2048 or 4096, you have to include the none photo sensitive pixels which are used for clocking purposes.
5 Where FOV represents the field of view per sensor in the cross machine direction. 6 Where P represents the number of pixels used by the camera sensor within the FOV 7 Where CDR represents the cross direction resolution per pixel within the FOV 8 Where P represents the number of active pixels used by the sensor and 38 represents the number of inactive pixels used to fully clock out the CCD sensor after photosite (pixel) transfer occurs. 9 Where DR represents the camera sensors data rate. 10 Where WS represents the maximum web speed in inches per second (mm/sec). 11 Where CDR represents the static pixel resolution. 12 Where MDR represents the machine direction resolution per pixel (at speed).

IPST & RKB; 02/26/02 Page 19 of 63 ©Copyright 2002; RKB
Using the above listed formulas, one can then determine the overall system resolution. This resolution should be relative to TAPPI specification T437. Since TAPPI is recognized worldwide in standards and measurements relative to defect detection, it is concluded that all dirt within processed web materials be within a specified square millimeter size. Therefore overall system resolution must be arranged in a manner to facilitate a sensor resolution capable of detecting down to the required specified size. The formula to determine this is quite simple and is based on finding the area of a circle. Thus the formula used is as follows Table 6:
As you can see by Table 6 above, CDR and MDR formulas are required when determining true capable resolution requirements. But why a 1024 pixel format instead of a 2048 or 4096 pixel format? Many reasons can be given, but most apparent is the resolution capability of a 1024 pixel sensor over the others. By using faster scanning sensors, the machine direction resolution is dramatically reduced therefore providing a smaller overall area in which to monitor. This reduction dramatically increases the detection capability for the system to detect very subtle defects not detectable by use with other sensors. This type of arrangement is only beneficial to the customer where small subtle flaws like dirt are the primary goal of detection, not holes.
Like many suppliers of CCD camera-based video web inspection systems, R.K.B. OPTO-
ELECTRONICS, INC. uses a wide variety of non-contacting, electro-optical CCD sensors like the 1024 and 2048 pixel cameras. Generally these cameras provide greater benefits in use than two-dimensional cameras such as speed, higher resolution, consistent performance and a more advanced architecture. When dealing with the detection of autonomous events like holes, dirt, gels, etc; line-scanning technology is very impressive and reliable. For the most part autonomous faults have discernable characteristics as compared to the material and therefore can be effectively read out for further processing and conditioning. You have to bear in mind that the pixels are viewing, when applied to autonomous events, a very small area of material. Thus the differences in fault characteristic is significantly different to material formation (noise).
i) As with all its CCD camera-based technology, RKB takes a different approach in their use. Without
exception, most inspection system manufacturers specifically use the 2048 pixel format, some even the 4096 format with a minimum of a 40” (1meter) wide field of view per sensor. This helps reduce system-manufacturing costs, but does little to improve efficiency, detectability, accuracy and system reliability. Utilization of a wide field of view also diminishes imaging capability if gray scale is implemented. RKB uses all types of sensors and a variety of field of views depending on the overall application we are asked to look at. For this system model, RKB uses at 1024 pixel CCD camera normally set at inches 10 inches (25.4 cm) field of view per sensor, the Model 3030 can be implemented anywhere from a 0.1” to 30” field of view per sensor. RKB always incorporates the fastest data rate possible to ensure system reliability and accuracy. Certainly using a narrower field of view reduces lens aberration effects commonly found with any photo optic device. In this application RKB will incorporate a minimum of 13.5 inches (34.3 cm) field of view per sensor with a clock rate of 18 MHz. The implications of this are (Table 7 and Table 8):-

IPST & RKB; 02/26/02 Page 20 of 63 ©Copyright 2002; RKB
a) the cross direction resolution13 per pixel based on a 1024 pixel linear array camera at a field of view (FOV) of 13.5 inches (34.3 cm) per sensor is as follows (Table 7):
b) the machine direction resolution14 per pixel based on a 1024 pixel linear array camera at a field of view (FOV) of 13.5 inches (34.3 cm) per sensor is as follows (Table 8):
c) Therefore, both the cross machine and machine direction resolution gives you a theoretical TAPPI Specification at machine speed of :
AREA
1250 fpm = 0.23759 Sq. mm 2500 fpm = 0.36305 Sq. mm 3300 fpm = 0.44334 Sq. mm 5000 fpm = 0.61396 Sq. mm
Therefore, all suppliers of CCD camera-based equipment must conform to the use and
implementation of Nyquist Theorem before determining what actual defect size would be obtainable at speed. If one does not utilize this theorem when determining defect size capability, then the overall results obtained will be incorrect. Thus, for a system arrangement, based on CCD camera technology, to be successful the system should be setup where the pixel size as focused on the web should be one-half the size of the defect required. What implications does this theorem mean? If you wish to detect a defect size of 0.020” (0.51 mm), the pixel as focused on the web should be approximately 0.010” (0.254 mm). This will ensure that the defect signal will be captured effectively. Since RKB uses the Nyquist Theorem when calculating its resolution capabilities, the proposed system herein will meet the requirements as set forth by the IPST.
13 Effectively a static (none movement) resolution. 14 Effectively a dynamic (web movement) resolution.

IPST & RKB; 02/26/02 Page 21 of 63 ©Copyright 2002; RKB
While it is by no means impossible for a competitive system to achieve the detection requirements using fewer sensors or by overlooking Nyquist Theorem, RKB’s approach is more in line with being able to achieve the specification more consistently. Additionally, the IPST can utilize the system to judge roll quality by comparing the defect specification for the grade being run to the defect count provided by the system. This comparison, done on a roll by roll basis, is based upon the trim pattern such that individual rolls can be shipped or rejected. RKB can better suit these requirements for reporting defect fault density increases to analyze each roll better than most competitive solutions considering the level of detection RKB can achieve with its system.
9.0.2 R.K.B.’s STREAK DETECTION METHODOLOGY; PROVEN and RELIABLE:
9.0.2.1 Scratch and streak detection applied with RKB’s streak sensing technology:
As stated above, RKB does not use line-scanning technology for coating scratch and streak
detection for many of the reasons as stated above. Instead, RKB envisioned a radical approach that can guarantee reliable and consistent detection of very subtle scratches and streaks. So radical is this invention, the United States Patent Office awarded RKB patent protection under patent number 5,118,195. The invention features a real time system for detecting scratches and streaks which occur substantially parallel to the direction of motion of a continuous or sheet feed web. An energy source such as an incandescent lamp impinges or transmits energy (light) which is then received by RKB’s CCD based streak camera (what we call our Opto-Tek II™) technology.
The sensors, standard two-dimensional CCD cameras are mounted relative to the web by
conventional means well known in the art. The sensors contain an array of pixels horizontal by pixels vertical. It should be noted that cameras can be mounted collinear or staggered or arranged in any other suitable fashion as long as their cumulative fields of view cover the entire width of the web being monitored with each field of view overlapping its adjacent fields. The overall system design enables the use of a standard 2 inch (5.08 cm) field of view (FOV) per sensor in the transverse web motion (Cross Direction) by a 2.7 inch (6.858 cm) FOV per sensor in the web motion (Machine Direction). The sensors scan at a data rate of 1/60 of a second, producing a standard picture frame every 1/30 of a second. Horizontally, the sensors contain a number of photo-sites or pixels (relative to the chip set used) providing overall tens of thousands of pixels in total pixel coverage. Dividing the 2 inches (5.08-cm) FOV by the number of complete raster lines results in an effective resolution that can range from microns to millimeters per line. The resultant data received by the cameras is processed through proprietary and patented electronic circuitry.
Since the sensors are standard types, a full frame takes only microseconds to read out. The outputs are processed along with undesirable control signals and are shuttled to our proprietary processing circuitry (PPC). The PPC processes each raster separately over its time constant, approximately 63.5µs. As a result of the longer exposure time, the final output reaches an energy level that represents the sum of the energy received by the individual pixels focused on the target web. By using PPC power and other proprietary circuitry, short term background noise (i.e., material noise), as well as very low frequency noise is eliminated, thereby enhancing the overall signal-to-noise (defect to material) ratio of the desired signal that is generated by scratches and streak defects. Since autonomous events (i.e., holes and dirt) or other high frequency background noise affects only a few pixels, normally less than 1% of a raster line and line type events (i.e., scratches and streaks) affects all (100%) of the pixels along a raster line, autonomous events and undesirable frequency noise are eliminated and have no affect on the signaling process of scratches and streaks.
Thus, the invention is not plagued with false signals and undesirable noise, which normally affect
point source sensors such as line scanning technology. Therefore, false signals are not present and are not detected. The resultant signal is a very clean and discernible fault that is indisputably detected. Once identified, the data is transmitted to the Quality Assurance Management System (QAMS™).

IPST & RKB; 02/26/02 Page 22 of 63 ©Copyright 2002; RKB
To determine actual resolution of this innovative, state-of-the-art CCD camera scratch and streak detection process the following formulas are used. These implications are (Table 9 and Table 10): -
The cross direction resolution (effectively a static resolution) per raster line is determined by dividing the field of view (FOV) by the number of active pixel lines (APL) contained within that FOV. RKB minimum FOV per sensor in any given application is 2 inches (50.8 cm) cross direction. For this example; we will use a 4.2-inch (10.67-cm) field of view per sensor. The web width will be 200” (5.0 meters) wide @ 3500 fpm (1066 m/min). The minimum size scratch required to be detected will be 0.004” (0.1mm) wide. To determine minimum pixel resolution capability in the cross machine direction, the following formula is used: -
FOV15 ÷ APL16 = CDR17
The machine direction resolution (effectively a dynamic resolution) per raster line is somewhat more involved in determining. Since we are using two dimension camera sensors with an approximate ratio of 4:3, the static resolution in the machine direction can easily be obtained. Since we know our CD resolution per sensor is 4.2 inches (10.67 cm), the MD resolution per TV line is 5.6 inches (14.22 cm). However, the calculation of true dynamic resolution involves machine speed and the appropriate number of fields required to obtain a minimum of two fields of scratch and streak data. Again, since we know what type of sensor we are using (our patent allows us to use any two dimensional sensor), the picture field rate is pre defined at 1/60 of a second, producing a standard picture frame every 1/30 of a second or 0.033 seconds. Thus the formula to use to determine actual dynamic resolution is a follows: -
DR18 x NF19 x WS20 x SMD21 = MDR
Thus the actual dynamic resolution as calculated using the above formula indicates that the resolution achieved by the RKB system using its patented, state-of-the-art CCD area scanning technology provides a resolution capability of 1/60 x 3 x WS x SMD = MDR.
**NOTE** at 700 inches per second machine speed the web will travel 40.58” in 0.057 seconds
15 Where FOV represents ‘Field of View’ per sensor 16 Where APL represents total number of ‘TV Lines’ (raster lines) in each sensor 17 Where CDR represents cross direction resolution per TV (raster) line 18 Where DR represents sensor data rate in seconds 19 Where NF represents the required number of fields 20 Where WS represents maximum web speed in inches/sec 21 Where SMD represents the static machine direction resolution (no web movement)

IPST & RKB; 02/26/02 Page 23 of 63 ©Copyright 2002; RKB
Thus for the example listed the overall resolution per pixel an equivalent resolution of 0.008 inches
(0.203 mm) CD x 0.070 inches (1.79 mm) MD. What does this mean?
By utilizing a complete raster line containing numerous pixels per line, RKB’s Model 3030 CCD Camera-based Video Web Inspection System can process over a much longer integration time period. As a result, the integration process eliminates noise and other variables that affect line scan type sensors using just one pixel. Additionally, by viewing a longer area of the web with hundreds of thousands of pixels, comparisons can be made quickly as to what is noise versus an actual defect fault and thus be processed accordingly.
This is the theory, but does it work? Yes. RKB’s coating scratch and streak detection technology is
fully field tested and mill proven with very successful installations. In fact, one of our references in Europe has stated “It is the best streak detection system he has ever seen or used.” The end result is that RKB’s Model 3030 can detect more reliably, consistently and accurately coating scratches and streaks in any coated web process. Additionally, the Model 3030 can successfully detect faults as small as 0.002" (0.05mm) wide at any speed. The only restriction faced by RKB’s approach is the length required to fire a signal which lengthens as machine speed increases (i.e., @1000 fpm the length required is 15 inches; @2000 fpm the length required is 25”; @3000 fpm the length required is 35 inches; @4000 fpm the length required is 45 inches and @ 10000 fpm the length required is 105 inches).
Whilst it is by no means theoretically impossible for a line scanning system to detect these types of
defects at lines speeds, RKB’s approach is more in line with being able to achieve it more consistently. Furthermore, Manufacturers that have contacted RKB, who have purchased line scanning systems over the past months and years have all stated that what they are using does not work effectively, if at all. RKB’s 3000 Series CCD Video Web Inspection Systems are intended for those who are serious about successful on-line detection of coating streaks and scratches. The 3000 Series will provide a superior level of coating scratch detection and spot type fault detection. For those not serious about successful detection and their investment, RKB recommends they discuss their applications with some other line scan camera supplier.
10.0 PAPER MILL EVALUATION STUDY CONDITIONS
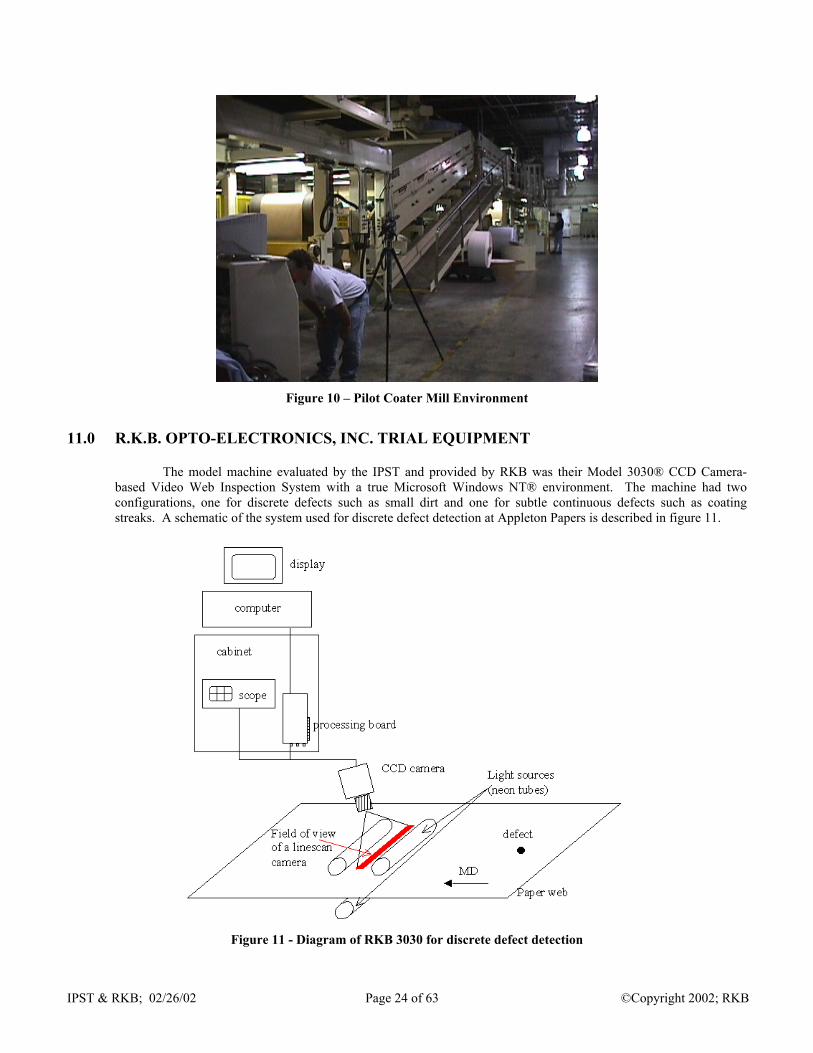
The production machine in which the trial evaluations were conducted was the pilot coater machine located at Appleton Papers, Inc., Appleton, Wisconsin, USA. The machine is located in a separate building away from many environmental conditions that normally are present in the mill. The climate was very clean and dry (Figure 10). All products provided were pre-manufactured thus eliminating the need to actually use coaters and dryers. Vibration from the machine was minimal and ambient light had no affect.
IPST & RKB; 02/26/02 Page 24 of 63 ©Copyright 2002; RKB
Figure 10 – Pilot Coater Mill Environment
11.0 R.K.B. OPTO-ELECTRONICS, INC. TRIAL EQUIPMENT
The model machine evaluated by the IPST and provided by RKB was their Model 3030® CCD Camera-based Video Web Inspection System with a true Microsoft Windows NT® environment. The machine had two configurations, one for discrete defects such as small dirt and one for subtle continuous defects such as coating streaks. A schematic of the system used for discrete defect detection at Appleton Papers is described in figure 11.
Figure 11 - Diagram of RKB 3030 for discrete defect detection
IPST & RKB; 02/26/02 Page 25 of 63 ©Copyright 2002; RKB
The RKB 3030 system for discrete defect detection can work both with reflective and transmissive light for defect detection, classification and mapping. The principle of this part of the 3030 system is as follows: a lens is imaging periodically a line across the web surface into a linear array of CCD (Charged Coupled Device) pixels (photosites, photodiodes). The quantity of light collected by each pixel is independent from the other. An increase or a decrease of the energy collected by a pixel above or below a fixed threshold indicates that a hole (light or bright spot) or a dark spot is present on the web surface. If more than one-pixel experiences an increase or decrease of energy at the same time, then the defect can be, and is, classified into three main categories (small, medium or large), depending on the number of pixels affected.
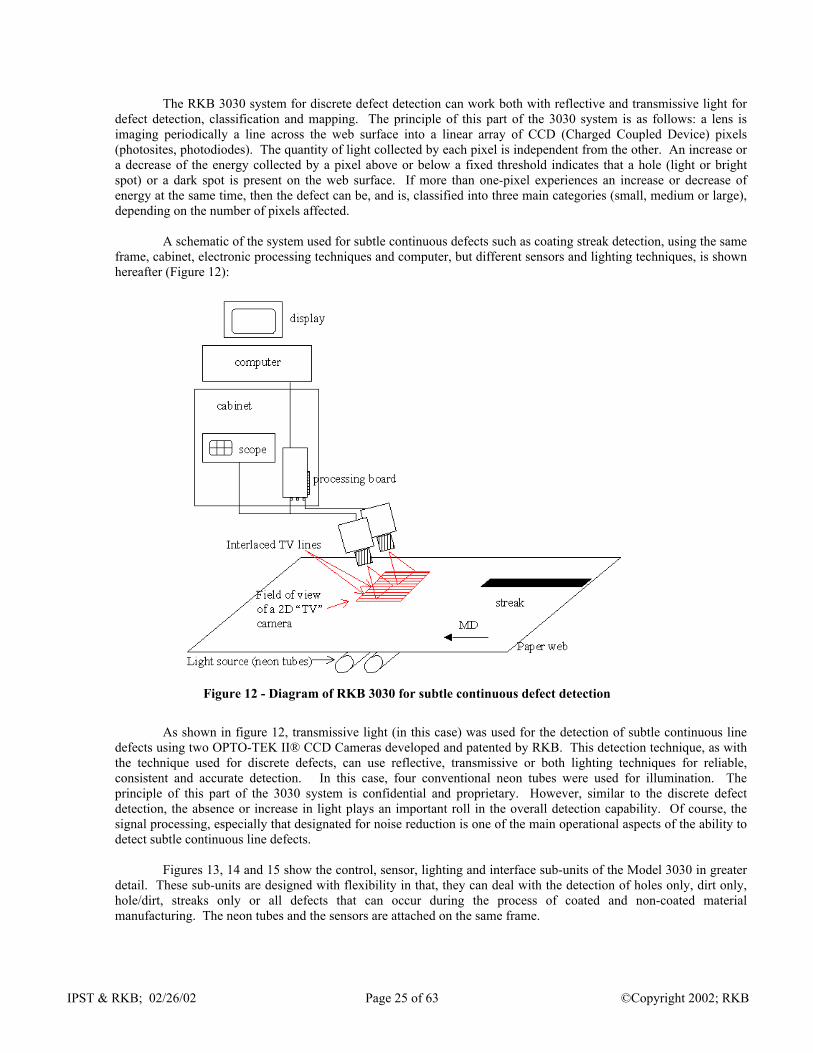
A schematic of the system used for subtle continuous defects such as coating streak detection, using the same
frame, cabinet, electronic processing techniques and computer, but different sensors and lighting techniques, is shown hereafter (Figure 12):
Figure 12 - Diagram of RKB 3030 for subtle continuous defect detection
As shown in figure 12, transmissive light (in this case) was used for the detection of subtle continuous line
defects using two OPTO-TEK II® CCD Cameras developed and patented by RKB. This detection technique, as with the technique used for discrete defects, can use reflective, transmissive or both lighting techniques for reliable, consistent and accurate detection. In this case, four conventional neon tubes were used for illumination. The principle of this part of the 3030 system is confidential and proprietary. However, similar to the discrete defect detection, the absence or increase in light plays an important roll in the overall detection capability. Of course, the signal processing, especially that designated for noise reduction is one of the main operational aspects of the ability to detect subtle continuous line defects.
Figures 13, 14 and 15 show the control, sensor, lighting and interface sub-units of the Model 3030 in greater
detail. These sub-units are designed with flexibility in that, they can deal with the detection of holes only, dirt only, hole/dirt, streaks only or all defects that can occur during the process of coated and non-coated material manufacturing. The neon tubes and the sensors are attached on the same frame.

IPST & RKB; 02/26/02 Page 26 of 63 ©Copyright 2002; RKB
Sensors andLighting
Trial Cabinet
CPU
CRT Display
Oscilloscope
Figure 13 - General view of RKB Model 3030 used for evaluation in Appleton
Paper Web
Lights
CCD Sensors
Linescan Sensor OPTO-TEK II®
Sensors
Figure 14 - View of frame support, lighting and sensors Figure 15 – View of Linescan & OPTO-TEK II®
Figure 16 shows the location along the line of the pilot coater where the measurements were taken. At this
location the web is horizontal at 1 meter above the ground and perpendicular to the optical axis of the cameras. The location is close to the end of the line.

IPST & RKB; 02/26/02 Page 27 of 63 ©Copyright 2002; RKB
Figure 14 - Partial View of Pilot Coater Line. RKB Model 3030 was installed close to the take up reel. Paper is moving
towards the left of this picture.
Regarding the directives set fourth by the IPST, RKB modified their existing demonstration sensing head assembly around their Opto-Tek I™ (Figure 17) and Opto-Tek II ™ (Figure 18) technology with a specific field of view per sensor to achieve the defect detection specifications as submitted by the IPST. The line scan camera, in this application, used 3 special very high output (VHO) neon tubes for the light source, 2 on top of the web in a reflection configuration to facilitate spot detection and one on the bottom side of the web in a transmissive configuration to facilitate hole detection. The distance from the line scan camera to the surface of the web was 27 inches (686 mm). The field of view (length of the line scanned cross machine direction) was 13.5 inches (343 mm). The sensor contained 1024 pixels that provides a scan rate twice as fast as a 2048 pixel line scan sensor (industry standard). The field of view was slightly less than the total width of the web (30 inches; (76.2 cm)) as RKB used only one line scan sensor for this evaluation due to the evaluation study defect specification and time constraints in providing equipment for the designated evaluation date.
Figure 17 - OPTO-TEK I® Figure 18 – OPTO-TEK II®
The OPTO-TEK II camera, in this application used 4 standard neon tubes for the light source. All light sources were placed on the opposite side of the paper (Bottom) in a transmissive configuration to facilitate subtle scratch and streak detection specifically designed for the product mix being evaluated. The distance of the camera to the surface of the web was approximately 48 inches (121 cm). The field of view per sensor was approximately 8 inches (20.32 mm) cross direction. This particular sensor, although any sensor chip set can be used per the patent application, contained 512 pixels by 475 pixels. The reason this type of sensor was used for subtle continuous defect detection is that line scan cameras, according to RKB and related on-line trials and tests, have proven to be ineffective for reliable, consistent and accurate detection. This system configuration is different than all other currently available systems which still use line-scanning technology as a basis to streak detection. Of the five cameras contained in the inspection housing, two cameras were activated to facilitate the 8-inch field of view per sensor for this particular study. RKB can use any number of sensors down to a field of view, for both line and area scan, 0.21 inches (5.3 mm) cross direction.

IPST & RKB; 02/26/02 Page 28 of 63 ©Copyright 2002; RKB
All sensors were fixed to the frame that ran cross direction to the movement of the material web. The frames, as discussed earlier, housed various lamp sources that provided both reflective and transmissive light. The types of lights used are not specific in that any type of lamp can be used depending on the actual application. RKB has used from regular flood to high frequency controlled sodium. The cameras were positioned in the framework to view the coated side of the material web, if and when coated material was tested. The camera framework, unlike the production units, was exposed to the environment to evaluate for environmental conditions and effects on detection capability. The inspection assembly was interfaced into the standard RKB demonstration electronic control console housing all the appropriate electronic processing and hardware circuitry. The software format was run in a WindowsNT® environment (Figure 19) and was developed in visual basic and C++. RKB uses the Microsoft Access97® database format for defect, machine and diagnostic storage. The reason this format was chosen was to provide users with a very flexible package that can be changed and manipulated more effectively than custom oriented packages that require much more significant work and money for the simplest changes.
Figure 15 - Typical WindowsNT® RKB QAMS® Display
12.0 PAPER MILL TRIALS and RESULTS
The RKB Model 3030 CCD Camera Video Web Inspection System (Figure 20) was placed on the pilot coater machine (Figure 21) at the Appleton Papers, Inc., Research & Development, Pilot Coater Machine. The coater was designed to accept paper widths up to 30” wide and could be operated up to full production speeds similar to that of actual production machines found throughout the paper industry. Companies that committed themselves to the interest of this study and provided the process machinery and/or material rolls for evaluation were Appleton Papers Co., International Paper Co., Longview Fiber Co., and Weyerhaeuser Paper Co. The material rolls provided contained numerous defects from oil spots, dirt to coating streaks and scratches. All autonomous (discrete) defects provided were supplied by the previously listed paper companies with the exception of the calibrated spot defects that were made and submitted by the IPST. The evaluation period was set to begin Monday, November 8th and would run to Friday, November 12th, 1999. Monday was designated for equipment installation and setup. Wednesday, November 10th was designated for coating streak detection (refer to Table 11).
TABLE 11
Monday Nov 8 Tuesday Nov 9 Wednesday Nov 10 Thursday Nov 11 Friday Nov 12
Setting up of the system with 33 lb Linerboard provided by Longview Fiber
Evaluation of 33 lb Linerboard and Newsprint Roll #B
Evaluation of Choctaw Matte, A and Accolade Gloss A for streaks/scratches
Evaluation of Springhill (calibrated spots) and Newsprint Roll #B
Evaluation of 35 lb Linerboard, Newsprint Roll #B and Newsprint Roll #A

IPST & RKB; 02/26/02 Page 29 of 63 ©Copyright 2002; RKB
Figure 16 - System on Pilot Coater Machine Figure 21 - View of unwind station of the pilot coater
Other benefits of this evaluation are: -
I) Independent study conducted by a third party with no financial, personal or business ties to the evaluated company.
II) The study of potential environmental effects on detection capability.
ii) The assimilation of actual production environment related to defect detection in a full produ7ction
machine installation. iii) Can re-evaluate roll material for detection capability and detection repeatability. iv) Can test software for user friendliness and data logging repeatability.
Set-up Conditions:
The demonstration equipment was set up to view holes, spots and coating scratches. The system inspection “C” frame was placed on the pilot coater just prior to the take up reel and aligned between the calender and mount hope roll. Inspection sensors were placed above the paper web. The light source assemblies were positioned above and below the paper web approximately one to two inches from the sheet (Figure 22). The placement of the sensors allowed for an eight-inch (20.32-cm) field of view per sensor for scratch detection and 13.5 inches (34.29 cm) for hole and spot detection. RKB adjusted the sensitivity of the system so that it was set at approximately a 2:1 signal to noise ratio for scratches and a 3:1 signal to noise (Figure 23) for holes and spots. Adjusting the signal to noise ratio or detection threshold will eliminate the potential false signals that can be generated by the product noise. The IPST provided various rolls of paper from coated to newsprint for evaluation. Since all products supplied already contained defect faults, there was no need to activate the actual coating station or dryers on the pilot machine. Pilot coater speed was checked and verified to run between 2500 fpm (762 m/min) and 5000 fpm (1524 m/min) per IPST specification. Defects of various sizes were provided and pre existent. Each material roll will be tested two to three times in the same direction and placement to verify repeatability.

IPST & RKB; 02/26/02 Page 30 of 63 ©Copyright 2002; RKB
Figure 17 - Placement of lighting across pilot coater and paper web
Electronic Noise
DEFECTSIGNAL
Figure 18 - Signal to Noise Ratio
12.0.1 MONDAY, NOVEMBER 8, 1999
RKB unpacked all appropriate components and there system. The system was installed on the pilot
machine and verified to be in operational condition.
12.0.2 TUESDAY, NOVEMBER 9, 1999
The material roll evaluated first was provided by Longview Fiber Co., and was labeled as Linerboard, Export 33 lbs. (Figure 24). The basis weight range of the product was 33-lbs/3000 sq. ft. RKB logged this product in its DCS unit as Product 09, Reel #1. The outside surface was up and facing the sensors. Since the product thickness exceeded the minimum 15-lb. limitation for use of just transmissive light, reflective light was used facilitating spot detection on the surface facing the sensors. Holes and/or light spots were detected by use of the transmissive lighting technique. This is normal for grades of this thickness and always should use a duel lighting technique. If spot detection were required on the other side of the sheet, another inspection station with associated reflective light would be required and is normally supplied in applications that call for that type of inspection specification.
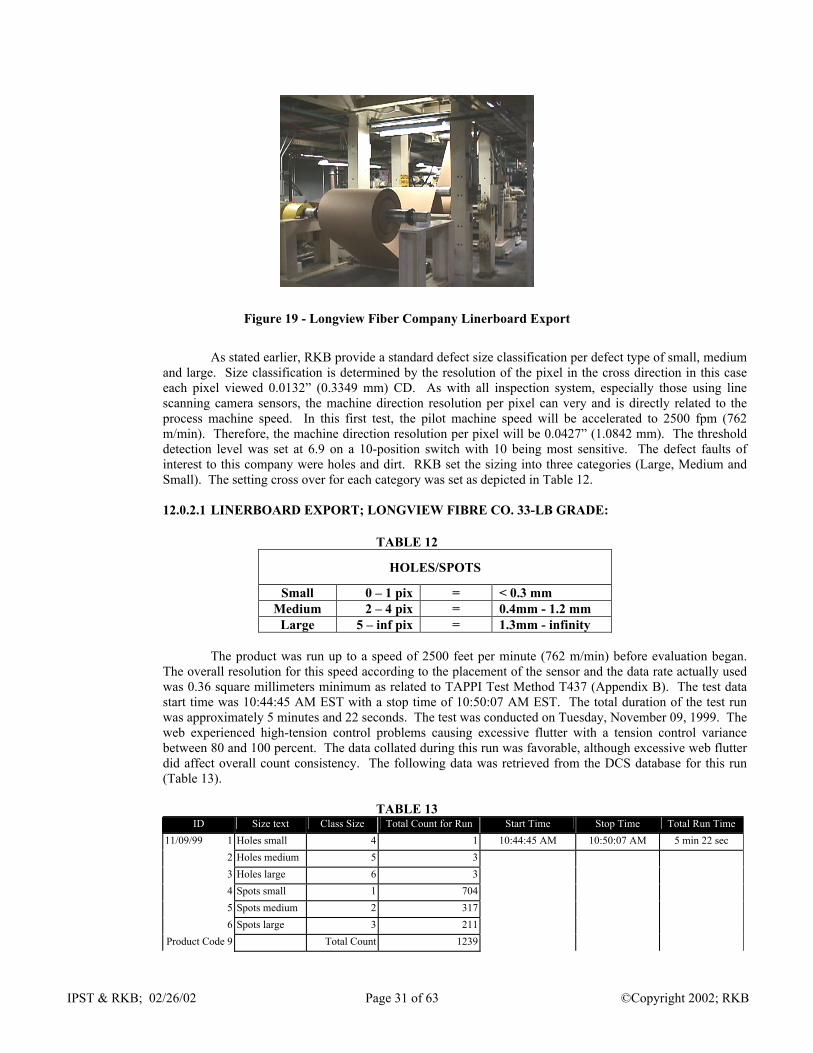
IPST & RKB; 02/26/02 Page 31 of 63 ©Copyright 2002; RKB
Figure 19 - Longview Fiber Company Linerboard Export
As stated earlier, RKB provide a standard defect size classification per defect type of small, medium
and large. Size classification is determined by the resolution of the pixel in the cross direction in this case each pixel viewed 0.0132” (0.3349 mm) CD. As with all inspection system, especially those using line scanning camera sensors, the machine direction resolution per pixel can very and is directly related to the process machine speed. In this first test, the pilot machine speed will be accelerated to 2500 fpm (762 m/min). Therefore, the machine direction resolution per pixel will be 0.0427” (1.0842 mm). The threshold detection level was set at 6.9 on a 10-position switch with 10 being most sensitive. The defect faults of interest to this company were holes and dirt. RKB set the sizing into three categories (Large, Medium and Small). The setting cross over for each category was set as depicted in Table 12.
12.0.2.1 LINERBOARD EXPORT; LONGVIEW FIBRE CO. 33-LB GRADE:
TABLE 12
HOLES/SPOTS
Small 0 – 1 pix = < 0.3 mm Medium 2 – 4 pix = 0.4mm - 1.2 mm
Large 5 – inf pix = 1.3mm - infinity
The product was run up to a speed of 2500 feet per minute (762 m/min) before evaluation began. The overall resolution for this speed according to the placement of the sensor and the data rate actually used was 0.36 square millimeters minimum as related to TAPPI Test Method T437 (Appendix B). The test data start time was 10:44:45 AM EST with a stop time of 10:50:07 AM EST. The total duration of the test run was approximately 5 minutes and 22 seconds. The test was conducted on Tuesday, November 09, 1999. The web experienced high-tension control problems causing excessive flutter with a tension control variance between 80 and 100 percent. The data collated during this run was favorable, although excessive web flutter did affect overall count consistency. The following data was retrieved from the DCS database for this run (Table 13).
TABLE 13
ID Size text Class Size Total Count for Run Start Time Stop Time Total Run Time 11/09/99 1 Holes small 4 1 10:44:45 AM 10:50:07 AM 5 min 22 sec
2 Holes medium 5 3 3 Holes large 6 3 4 Spots small 1 704 5 Spots medium 2 317 6 Spots large 3 211
Product Code 9 Total Count 1239

IPST & RKB; 02/26/02 Page 32 of 63 ©Copyright 2002; RKB
Figure 20 - View of the Inspection Assy and DCS during the trial with the 33-lb Linerboard Export
The IPST observed much more dark spot detection’s than that of holes and light spots in this grade
as expected due to the basis weight and fiber distribution of this grade. Figure 26 depicts the real time mapping function of this run. The colored bars represent the size of the defect. The black circle in the middle of the color bar represents spot type defect (white circle or open circle represents a hole type fault). The color blue represents small, green is medium and red is large. The number on the left side of the mapping screen is footage indicating the machine direction location of the defect. The cross machine direction is determined by many factors in the production system and can be arranged by pixel, camera, group of cameras, etc. In this evaluation, since we were looking at such a small cross direction area, the camera itself represented CD. The roll of material was rewound for preparation for the second run.
Figure 21 - View of the CRT; Real Time Defect Mapping during the 33-lb Linerboard Export
Evaluation
Second Run; Linerboard Export Product #9: The IPST rewound the roll of paper so as the
exact same side of the web would be inspected during the second pass evaluation. This was done to verify repeatability. The Model 3030 QAMS® (Quality Assurance Management Program) logged this product in its DCS unit as Product 09, Reel #2. The threshold detection level was set at 6.9 on a 10-position switch with 10 being most sensitive. The defect faults of interest again were holes and dirt. RKB set the sizing into three categories (Large, Medium and Small). The setting cross over for each category was set exactly the same as in the first run evaluation (refer to Table 12):

IPST & RKB; 02/26/02 Page 33 of 63 ©Copyright 2002; RKB
The product was, again, run up to a speed of 2500 feet per minute (762 m/min) before the evaluation was to begin. The overall resolution for this speed according to the placement of the sensor and the data rate actually used the same as stated in the first run trial. The test data start time was 11:31:47 AM EST with a stop time of 11:37:09 AM EST. The total duration of the test run was approximately 5 minutes and 22 seconds. The test was conducted on Tuesday, November 09, 1999. The web experienced high-tension control problems causing excessive flutter or sagging with a tension control variance between 80 and 100 percent. The data collated during this run was favorable, although excessive web flutter did affect overall count consistency. The following data was retrieved for the DCS database for this run (Table 14).
TABLE 14
ID Size text Class Size Total Count for Run Start Time Stop Time Total Run Time 11/09/99 1 Holes small 4 2 11:31:47 AM 11:37:09 AM 5 min 22 sec
2 Holes medium 5 4 3 Holes large 6 3 4 Spots small 1 643 5 Spots medium 2 310 6 Spots large 3 229
Product Code 9 Total Count 1191
In this particular run, some defects were marked for verification of detection. The marks were
applied by a colored marker along the edge of the web (Figure 27). During the rewind of this web in preparation for the third pass test, the defects were located and photographed for verification. Figure 28 shows these typical defects that were detected in this grade of paper. The defects included oil, light spot (area of reduced fiber content) and scale. The divisional ruler used was in centimeters with the small graduations in millimeters. This was very significant in helping justify the detection capability of the system and to verify the software and hardware verification and classification set up.
Figure 27 - View of the inspection assembly and the linerboard defect marking during the linerboard export test

IPST & RKB; 02/26/02 Page 34 of 63 ©Copyright 2002; RKB
Figure 28 – Pictures of defects detected at production speed during the 33-lb Linerboard Export Test. Defects include a
light spot, oil and type of scale
Third Run; Linerboard Export Product #9: The third pass of the linerboard export 33-lbs grade was done exactly in the same way as in the first and second test. Again, this pass was to verify repeatability of the detection unit. RKB logged this product in its DCS unit as Product 09, Reel #3. The threshold detection level was adjusted prior to this test to a lower sensitivity to verify if there would be a reduction in detection. RKB was asked to lower the detection threshold and adjusted the threshold to a setting of 6.7 on a 10-position switch with 10 being most sensitive. All other settings remained the same relative to hole and spot sizing (refer to Table 12, first run).
The product again was run up to a speed of 2500 feet per minute (762 m/min) before the evaluation
was to begin. The overall resolution for this speed according to the placement of the sensor and the data rate actually used was the same as in the previous first two runs. The test data start time was 1:23:20 PM EST with a stop time of 1:28:57 PM EST. The total duration of the test run was approximately 5 minutes and 37 seconds. The test was conducted on Tuesday, November 09, 1999. The web tension control problem causing excessive flutter was corrected with the tension meter indicating no variance (meter set at 100%, solid). The data collated during this run was favorable, although some flutter still proved problematic during the run. The following data was retrieved for the DCS database for this run (Table 15).
TABLE 15
ID Size text Class Size Total Count for Run Start Time Stop Time Total Run Time 11/09/99 1 Holes small 4 2 1:23:20 PM 1:28:57 PM 5 min 37 sec
2 Holes medium 5 5 3 Holes large 6 1 4 Spots small 1 449 5 Spots medium 2 278 6 Spots large 3 218
Product Code 9 Total Count 952
The test on this run was very good and proved that the detection capability was reduced as a result
of changing the detection threshold. The data conclusively indicated that the detection system was working in a way that was reliable, accurate and consistent.
12.0.2.2 NEWSPRINT ROLL #A; WEYERHAEUSER PAPER CO. 53 GSM GRADE:
First Run; Newsprint Roll A Product #10: The IPST prepared the second roll and type of paper up
that was to be evaluated. This product roll was provided by Weyerhaeuser Paper Co., Longview, Washington and was labeled as Newsprint, Roll A. The basis weight range of the product was 53 grams per square meter (32-lbs/3000 sq. ft). RKB logged this product in its DCS unit as Product 10, Reel #1. The threshold detection level was set at 6.7 on a 10-position switch with 10 being most sensitive. The defect faults of interest to this company were holes and dirt. RKB set the sizing into three categories (Large, Medium and Small). The setting cross over for each category was set as follows (Table 16):
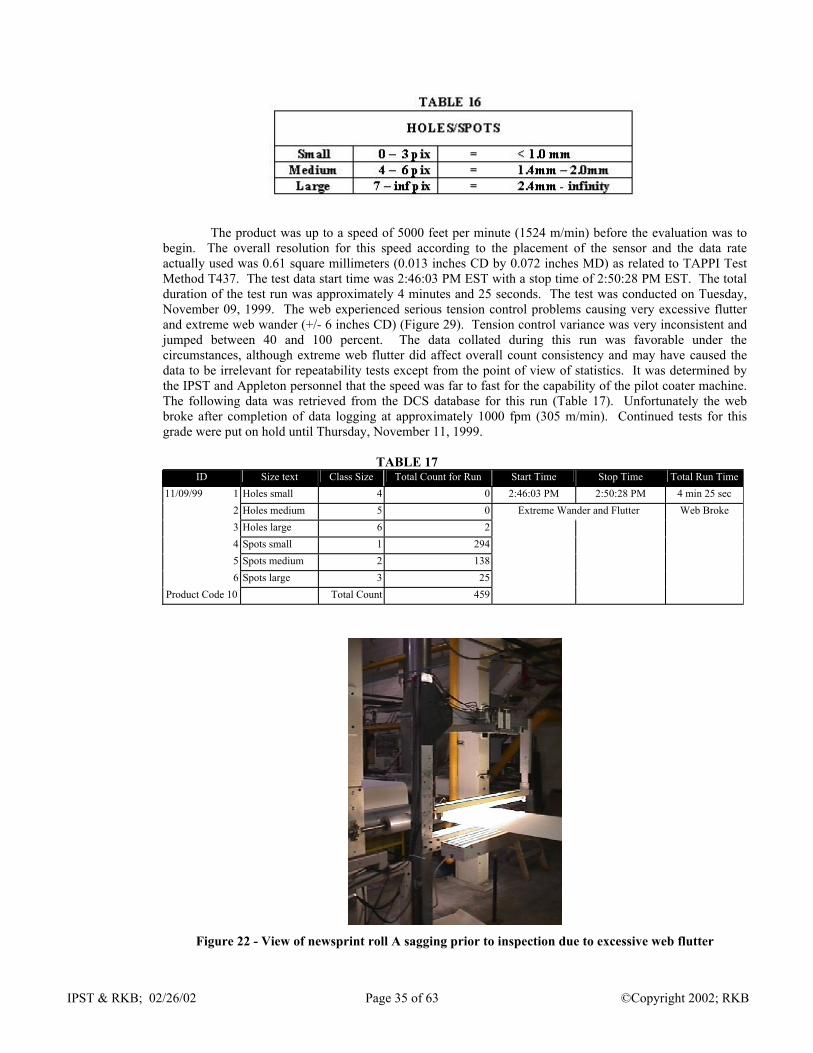
IPST & RKB; 02/26/02 Page 35 of 63 ©Copyright 2002; RKB
The product was up to a speed of 5000 feet per minute (1524 m/min) before the evaluation was to
begin. The overall resolution for this speed according to the placement of the sensor and the data rate actually used was 0.61 square millimeters (0.013 inches CD by 0.072 inches MD) as related to TAPPI Test Method T437. The test data start time was 2:46:03 PM EST with a stop time of 2:50:28 PM EST. The total duration of the test run was approximately 4 minutes and 25 seconds. The test was conducted on Tuesday, November 09, 1999. The web experienced serious tension control problems causing very excessive flutter and extreme web wander (+/- 6 inches CD) (Figure 29). Tension control variance was very inconsistent and jumped between 40 and 100 percent. The data collated during this run was favorable under the circumstances, although extreme web flutter did affect overall count consistency and may have caused the data to be irrelevant for repeatability tests except from the point of view of statistics. It was determined by the IPST and Appleton personnel that the speed was far to fast for the capability of the pilot coater machine. The following data was retrieved from the DCS database for this run (Table 17). Unfortunately the web broke after completion of data logging at approximately 1000 fpm (305 m/min). Continued tests for this grade were put on hold until Thursday, November 11, 1999.
TABLE 17
ID Size text Class Size Total Count for Run Start Time Stop Time Total Run Time11/09/99 1 Holes small 4 0 2:46:03 PM 2:50:28 PM 4 min 25 sec
2 Holes medium 5 0 Extreme Wander and Flutter Web Broke 3 Holes large 6 2 4 Spots small 1 294 5 Spots medium 2 138 6 Spots large 3 25
Product Code 10 Total Count 459
Figure 22 - View of newsprint roll A sagging prior to inspection due to excessive web flutter

IPST & RKB; 02/26/02 Page 36 of 63 ©Copyright 2002; RKB
12.0.3 WEDNESDAY, NOVEMBER 10, 1999
Due to the related speed problem of the pilot coater relative to running the lightweight newsprint grades, the IPST decided to concentrate on the coated papers provided for evaluation. The concentration of this test was not discrete defects such as dirt and holes, but the infamous coating streak and/or scratch that is all too common during the production of coated materials such as paper. It is common knowledge in the coated paper industry, and in fact, in any coated material that streaks and scratches can cost a company millions of dollars per annum in lose production, customer complaints and subsequent damage to sensitive conversion equipment such as soft calendar rolls in supercalendering processes and damage to printing blankets in the printing industry. RKB’s solution they have presented for evaluation is by far unique, new and potentially the most advanced detection method developed to combat this type of defect phenomena from occurring. RKB is the only company in the world that performs coating streak detection in the way they do. All other suppliers, including the major brand name suppliers, all continue to use line-scanning methodology. According to RKB and backed up by current users of line-scanning techniques and other test data, line scan camera systems inherently have significant problems in reliable, consistent and accurate detection of coating streaks and scratches.
12.0.3.1 CHOCTAW MATTE ROLL #A; WEYERHAEUSER PAPER CO. 27 LB GRADE:
RKB’s approach is so innovative that the United States Patent office has approved and awarded
RKB a patent on their application and technique (Patent #5,118,195). The material roll evaluated first for streak detection was provided by was provided by Weyerhaeuser Paper Co., and was labeled as Coated Free Sheet, Choctaw Matte. The basis weight of the product was 27-lbs/3000 sq. ft. RKB logged this product in its DCS unit as Product 11, Reel #1. The threshold detection level was set at 1 minus 2 on a 3-position proprietary filter module with 1-2 being most sensitive. The product was positioned on the pilot coater machine so that the uncoated surface was facing up towards the sensors. This was not the best configuration for streak detection as heavy weighted grades generally do not allow enough energy to pass through the sheet and in some cases indicate that in most streak detection applications of grades above 40 lbs. that the coated side should face the sensor with light being transmitted. Reflective light can be used and is generally used in specialty grades such as supercalendered papers and such where defect enhancement can be accomplished with greater efficiency than with transmitted light.
RKB has found that with most matte-coated grades of paper and/or other material, transmitted light
is best used for defect enhancement, not reflective. The configuration of this test was still acceptable due to the lightweight of the grade being evaluated. The field of view per sensor was placed at 8 inches (20.32 cm) cross direction due to the required specification of evaluation related to size detection requirements for this test. RKB has detected and shown data that there unit can detect streaks as small as 0.5 microns wide at any known production speed.
First Run; Choctaw Matte Roll A Product #11:
Since we were dealing with pre-existing streaks, the camera frame had to be moved towards the left
side of the web as it was determined prior to tests that the streaks were located somewhere on that side of the web. This run was used to verify equipment setup (Figure 30). This was not a data file logging evaluation and was used to adjust and check system performance. The speed was varied.
Second Run; Choctaw Matte Roll A Product #11:
The sensors were placed with a small overlap between them to ensure 100% coverage across the
detection window. The overall inspection area for this evaluation was 8 inches (20.32 cm) cross direction. The defect faults of interest to this company are coating scratches. RKB set the sizing into three categories (Narrow, Medium and Wide). The Uncoated surface was facing up. The product will be run up to a speed of 3300-fpm (1006 m/min) before the evaluation begins. The test data start time was 10:02:20 AM EST with a stop time of 10:10:43 AM EST. The total duration of the test run was approximately 8 minutes and 23 seconds. The test was conducted on Wednesday, November 10, 1999. According to the methodology of this technique and the current setup (which can be adjusted so see smaller streaks), it is possible to detect streaks and/or scratches down to 0.008 inches (0.203 mm) wide The setting cross over for each category was set as follows (Table 18). Data logged is listed in table x below:

IPST & RKB; 02/26/02 Page 37 of 63 ©Copyright 2002; RKB
TABLE 19 ID Size text Class Size Total Count for Run Start Time Stop Time Total Run Time
11/10/99 1 Narrow Scratch 1 2 10:02:20 AM 10:10:43 AM 8 min 23 sec 2 Medium Scratch 2 3 3 Wide Scratch 3 2
Product Code 11 Total Count 7
The test data and evaluation indicated that the unit was setup correctly and no apparent adjustments
were required or performed. The defection threshold for activation of streak defects was set at <0.75 volts for narrow, 0.75 volts to 1.8 volts for medium and 2.0 volts for large. The unit indicated streak detection and was verified not only by the systems software, but by a small Sony TV monitor that is included with part of the unit for visualization. Additionally observed by IPST personnel were two peaks on the oscilloscope (standard equipment with all RKB inspection systems) delimiting the boundaries of the defect. This roll contained a splice where the web material was spliced after a possible web break prior to receiving the roll. As a result, the streak position changed during the run and was observed and picked up by the other sensor and verified via the oscilloscope and computer screen. The streak that was previously under camera one at 80 mm from the left edge of the web moved under camera two just after the splice. The width of the coating streak was a few millimeters in width and varied in width along the machine direction and duration (Figure 31). IPST, Appleton and RKB personnel visually saw the streak defect and were able to correlate the defect to the software data logging. It was also verified that the streak varied in width at times and also completely disappeared at points and then re-appeared.
Figure 23 - Mapping and Text Display of Coating Streak during Choctaw Matter trial

IPST & RKB; 02/26/02 Page 38 of 63 ©Copyright 2002; RKB
Third Run; Choctaw Matte Roll A Product #11:
The IPST set the roll up again to be inspected after rewinding. The Uncoated surface was facing up. The product will be run up to a speed of 3300-fpm (1006 m/min) before the evaluation begins. The test data start time was 10:39:05 AM EST with a stop time of 10:48:59 AM EST. The total duration of the test run varied due to a web break and is listed below in table 20. The test was conducted on Wednesday, November 10, 1999. RKB logged this product in its DCS unit as Product 11, Reel #3. The threshold detection level was set at 1 minus 2 on a 3-position filter module with 1-2 being most sensitive. The defect faults of interest to this company are coating scratches. RKB set the sizing into three categories (Narrow, Medium and Wide). The setting cross over for each category was set as specified in table 20:
TABLE 20
ID Size text Class Size Total Count for Run Start Time Stop Time Total Run Time 11/10/99 1 Narrow Scratch 1 6 10:39:05 AM 10:40:34 AM 1 min 29 sec
2 Medium Scratch 2 7 10:40:35 AM Web Break 3 Wide Scratch 3 6 10:46:00 AM 10:48:59 AM 2 min 59 sec
Product Code 11 Total Count 19
Again, as in the second run, the coating streak was detected and specified correctly (Figure 31). In
this case, the product was not rewound thus the coated side faced the sensor unlike the second run. As with the second run, IPST personnel observed it, the streak jumped from camera to camera just after the splice. In this case, it jumped from camera two to camera one. Upon completion of the test, the roll was taken away and IPST started preparation for the next coated grade, Accolade Gloss Roll A.
Figure 24 - Picture of a coating streak detected by the RKB Model 3030 during the Choctaw Matter
Roll A evaluation
** This roll actually contained two separate scratches. This can be seen via accompanying video
taken during the test runs.

IPST & RKB; 02/26/02 Page 39 of 63 ©Copyright 2002; RKB
12.0.3.2 ACCOLADE GLOSS ROLL #A; INTERNATIONAL PAPER CO. 80 LB GRADE:
First Run; Accolade Gloss Roll A Product 12:
In this evaluation, the IPST set up coated paper provided by International Paper Co. The roll of paper identified as Accolade Gloss is a double-sided coated web with a final basis weight of 80-lbs/3000 sq. ft. The roll surface was glossy in appearance and quite heaving. Unlike other rolls provided, this roll was 16.5 inches wide total and raised questions that the pilot coater could handle it. Initial tests indicated that the pilot coater could process this roll efficiently. The roll was first run to determine to IPST personnel where the defects might be located to ensure that they were contained within the detection area of 8 inches. The outside surface of the roll was placed facing the sensors. IPST personnel observed that scratches in short length, but wide were present on the inside of the web. Also noted were very subtle scratches, continuous in nature and extremely narrow (between 0.0005” and 0.001” (0.0127 mm and 0.0254mm) wide) RKB logged this product in its DCS unit as Product 12, Reel #1. The threshold detection level was set at 1 minus 2 on a 3-position filter module with 1-2 being most sensitive. The defect faults of interest to this company are coating scratches. RKB set the sizing into three categories (Narrow, Medium and Wide). The setting cross over for each category was set to the same specifications as listed in Table 18. Date logged for this trial run is listed below in Table 21. The product will be run up to a speed of 3300-fpm (1006 m/min) before the evaluation begins. The test data start time was 1:00:45 PM EST with a stop time of 2:01:00 PM EST. Test speed started out slow and was increased incrementally. The test was conducted on Wednesday, November 10, 1999.
TABLE 21
ID Size text Class Size Total Count for Run Start Time Stop Time Total Run Time
11/10/99 1 Narrow Scratch 1 2 1:00:45 PM 2:01:00 PM 60 min 16 sec 2 Medium Scratch 2 0 Test Speed was ver slow to start with due to type 3 Wide Scratch 3 1 of scratch and position
Product Code 12 Total Count 3
The test data and evaluation indicated that the unit was setup correctly and no apparent adjustments
were required or performed. The defection threshold for activation of streak defects was set at <0.4 volts for narrow, 0.4 volts to 1.2 volts for medium and 1.2 volts for large. The unit indicated streak detection and was verified not only by the systems software, but by a small Sony TV monitor that is included with part of the unit for visualization. Additionally observed by IPST and RKB personnel were additional streaks that appeared to come and go quite frequently. These signals appeared to move right and left along the cross direction of the web. These scratches appeared on both sides of the web. The characteristics of the scratches were such that reflected light most likely would be required for more consistent pick up. The wider and more apparent streaks were observed by IPST, Appleton and RKB personnel and were visually verified via the TV monitor, data logging and by the oscilloscope. The roll of paper was marked upon detection of the large coating scratches with blue ink on the side of the web indicating location (Figure 32).
Figure 32 – View of inspection assembly during run and a picture of the Accolade Gloss Roll with defect location marks.

IPST & RKB; 02/26/02 Page 40 of 63 ©Copyright 2002; RKB
Second Run; Accolade Gloss Roll A Product 12:
The IPST reset the roll of paper up for a second pass. Prior to inspection the roll was not rewound
as to facilitate placement of the defect on the opposite side (facing the sensors. RKB logged this product in its DCS unit as Product 12, Reel #2. The threshold detection level was set at 1 minus 2 on a 3-position filter module with 1-2 being most sensitive. The defect faults of interest to this company are coating scratches. RKB set the sizing into three categories (Narrow, Medium and Wide). The setting cross over for each category was set to the same as in the previous run Table 18. In this run, the speed was increased to the operational speed of 3300 fpm prior to logging data. The data is as shown below in table 22.
TABLE 22
ID Size text Class Size Total Count for Run Start Time Stop Time Total Run Time 11/10/99 1 Narrow Scratch 1 0 2:38:52 PM 2:46:10 PM 7 min 18 sec
2 Medium Scratch 2 2 Scratch faced Sensing Side 3 Wide Scratch 3 9
Product Code 12 Total Count 11
As in the first run, the larger defects were detected. Again, however, the test indicated the odd
signal of other scratches that would appear and disappear. At the end of the run, IPST personnel located the scratch being detected and took a sample to the Appleton Laboratory for microscopic measurement. It was determined that the scratch, although not continually detected, measured less than 0.001 inches (0.0254 mm) wide. This size of scratch was well below the specification of the equipment tested and would require a field of view of 0.5 inches to 1 inch wide per sensor. However, for the current setting of an 8-inch field of view per sensor to pick up the defect, indicated the success of this technology and the methodology behind the design. IPST and RKB agreed to take the sample of the very small scratch back to the RKB Laboratory for additional testing to see what would be required to detect the defect. The results of that test are included in Appendix A. Additionally, the paper contained many small scratches in length. These defects, commonly called poppers, were not recorded, as the lengths were far to short for the unit to trigger on. At 3300 fpm, the minimum length for 100% detection signaling would need to be 43 inches (109.00 cm). That may appear to be very long, however, at 3300 fpm, the material passes by the sensor at 660 inches per second (1676 cm/sec). IPST informed RKB that no scratches below 1 mm wide were required by this evaluation. It was apparent that RKB could meet, and indeed exceed, the required specifications set fourth by the IPST.
For the sake of trying, IPST and RKB personnel prepared the roll for another pass. IPST rewound
the roll so the inside surface was facing the sensors. RKB adjusted the lighting technique from transmissive too reflective. The system was able to, again, pick up the required streaks, however, obtained similar results with the scratches that were less than 0.001” (0.0254 mm) wide. It was apparent that the resolution of the sensor was too wide for the very small scratch to provide a continuous modulation rate for detection. A much smaller field of view would need to be implemented. Nevertheless, detection of this defect without IPST and RKB knowledge of it being present was significant and indicated that this solution is quite capable, reliable and accurate.
12.0.4 THURSDAY, NOVEMBER 11, 1999
With the coated paper evaluation behind us, the IPST reverted back to the discrete defect detection
such as dirt, holes and light spots. The first product to be evaluated this day was paper supplied by International Paper called Springhill Offset Bond 50 lb. The paper herein was not tested for defects per say as the paper was suppose to be defect free. IPST personnel spliced into this roll various sections of paper that contained calibrated or specific size spot defects (no holes). This was done to test repeatability of the unit related to specified spots. Additionally, the IPST will continue with the Newsprint and the Linerboard Import.

IPST & RKB; 02/26/02 Page 41 of 63 ©Copyright 2002; RKB
12.0.4.1 SPRINGHILL OFFSET BOND; CALIBRATED SPOTS; INTERNATIONAL PAPER CO. 50 LB GRADE:
First Run; Calibrated Spots Product 13:
IPST personnel prepared the calibrated roll of paper for inspection. International Paper Co provided
the overall product or roll. The basis weight range of the product was 50-lbs/3000 sq. ft. RKB logged this product in its DCS unit as Product 13, Reel #1. The threshold detection level was set at 6.9 on a 10-position switch with 10 being most sensitive. The defect faults of interest to this evaluation were the calibrated spots. RKB set the sizing into three categories (Large, Medium and Small). The setting cross over for each category was set as listed below in Table 23.
The product was to be run up to a speed of 3300 feet per minute (1005 m/min) before the evaluation was to begin. The overall resolution for this speed according to the placement of the sensor and the data rate actually used was 0.44 square millimeters (0.013 inches CD by 0.052 inches MD) as related to TAPPI Test Method T437. The test data start time was 11:22:46 AM with a stop time of 11:27:28 AM. The total duration of the test run was approximately 4 minutes 42 seconds. The test was conducted on Thursday, November 11, 1999. IPST personnel placed in various parts of the paper web sections containing calibrated spots (no calibrated holes were provided). The web experienced tension control problems causing flutter and web breaks in the middle of the run. However, the calibrated spot sections went through prior to the web break. Due to the changes in the test, RKB adjusted the threshold detection setting to 6.7. The data collated during this run was favorable. The following data was retrieved for the DCS database for this run (Table 24).
TABLE 24
ID Size text Class Size Total Count for Run Start Time Stop Time Total Run Time11/11/99 1 Holes small 4 0 11:22:46 AM 11:27:28 AM 4 min 42 sec
2 Holes medium 5 1 11:27:28 AM Web Break 3 Holes large 6 18 4 Spots small 1 136 5 Spots medium 2 40 6 Spots large 3 29
Product Code 13 Total Count 224
Second Run; Calibrated Spots Product 13:
The IPST prepared the roll of calibrated spots to be inspected with a second pass. The product was rewound prior to evaluation so the calibrated spots would appear on the same side as the initial test run. RKB logged this product in its DCS unit as Product 13, Reel #2. The threshold detection level was decreased somewhat and set at 6.5 on a 10-position switch with 10 being most sensitive. The defect faults of interest in this evaluation were the same as in run one. RKB set the sizing into three categories (Large, Medium and Small). The setting cross over for each category was set as follows (Table 23):

IPST & RKB; 02/26/02 Page 42 of 63 ©Copyright 2002; RKB
The product was to be run up to a speed of 3300 feet per minute (1005 m/min) before evaluation was to begin. The overall resolution for this speed according to the placement of the sensor and the data rate actually used the same as in the first run. The test data start time was 12:47:30 PM with a stop time of 12:54:07 PM. The total duration of the test run was approximately 6 minutes 37 seconds. The test was conducted on Thursday, November 11, 1999. The web experienced tension control problems causing flutter. All calibrated spots went through fine. The data collated during this run was favorable. The following data was retrieved for the DCS database for this run (Table 25). Figure 33 shows the control cabinet with CRT display and the CRT display close up during test.
TABLE 25
ID Size text Class Size Total Count for Run Start Time Stop Time Total Run Time11/11/99 1 Holes small 4 0 12:47:30 PM 12:54:07 PM 6 min 37 sec
2 Holes medium 5 0 3 Holes large 6 4 4 Spots small 1 101 5 Spots medium 2 56 6 Spots large 3 51
Product Code 13 Total Count 212
Figure 33 - View of cabinet and CRT screen during trial with calibrated defects. Each Red strip indicates a large size defect, Green medium and Blue small.
Third Run; Calibrated Spots Product 13: The IPST again prepared the roll of calibrated spots to
be inspected with a third pass. The product was rewound prior to evaluation so the calibrated spots would appear on the same side as the initial test run. RKB logged this product in its DCS unit as Product 13, Reel #3. The threshold detection level adjusted again and set at 6.4 on a 10-position switch with 10 being most sensitive. The defect faults of interest in this particular evaluation were the same as run one and two. RKB set the sizing into three categories (Large, Medium and Small). The setting cross over for each category was set as follows (Table 23).

IPST & RKB; 02/26/02 Page 43 of 63 ©Copyright 2002; RKB
The product was to be run up to a speed of 3300 feet per minute (1005 m/min) before evaluation was to begin. The overall resolution for this speed according to the placement of the sensor and the data rate actually used was the same as in previous tests. The test data start time was 1:33:36 PM with a stop time of 1:41:35 PM. The total duration of the test run was approximately 7 minutes 59 seconds. The test was conducted on Thursday, November 11, 1999. All calibrated spots went through fine. The data collated during this run was favorable and is shown in Table 26.
TABLE 26
ID Size text Class Size Total Count for Run Start Time Stop Time Total Run Time 11/11/99 1 Holes small 4 0 1:33:36 PM 1:41:35 PM 7 min 59 sec
2 Holes medium 5 0 3 Holes large 6 1 4 Spots small 1 50 5 Spots medium 2 41 6 Spots large 3 42
Product Code 13 Total Count 134
12.0.4.2 NEWSPRINT ROLL #A; WEYERHAEUSER PAPER CO. 53 GSM GRADE:
Second Run; Newsprint Roll A Product #10: The IPST rewound the newsprint roll for a second pass trial. The roll, due to the unevenness and
excessive flutter during the first run was rewound and trimmed to get rid of the badly damaged edges. RKB logged this product in its DCS unit as Product 10, Reel #2. The threshold detection level remained at a setting of 6.7 on a 10-position switch with 10 being most sensitive. RKB left the size settings the same as in the first test run (Table 16).
The product was again run up to a speed of 5000 feet per minute (1524 m/min) before the evaluation
was to begin. The overall resolution for this speed according to the placement of the sensor and the data rate remained the same as in the first run dated Tuesday, November 9, 1999. The test data start time was 2:42:33 PM EST with a stop time of 2:42:46 PM EST. The total duration of the test run was approximately 13 seconds. The test was conducted on Thursday, November 11, 1999. The web experienced much improved tension control; however, the pilot coater experienced other problems causing the web to break many times. What tension problems were present only slightly caused web flutter. Tension control variance was much improved to between 80 and 100 percent. The data collated (Table 27) during this run was completely unreliable under the circumstances, although web flutter improved; operations could not keep the paper web from breaking. The following data was retrieved for the DCS database for this short timed run. The IPST decided, due to pilot coater machine problems related to web control at speeds in excess of design, to push off the tests on this grade to Friday, November 12, 1999.
TABLE 27
ID Size text Class Size Total Count for Run Start Time Stop Time Total Run Time11/09/99 1 Holes small 4 0 2:42:33 PM 2:42:46 PM 13 seconds
2 Holes medium 5 0 2:42:46 PM Web Break 3 Holes large 6 1 4 Spots small 1 50 5 Spots medium 2 41 6 Spots large 3 42
Product Code 10 Total Count 134
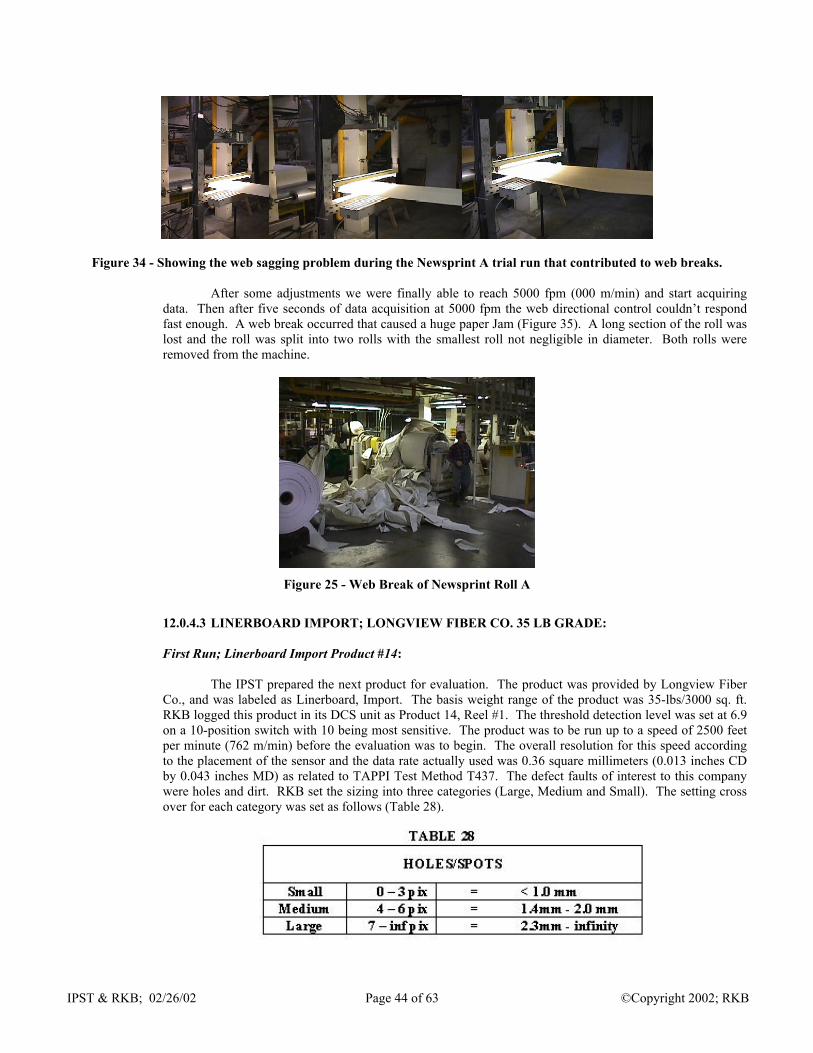
IPST & RKB; 02/26/02 Page 44 of 63 ©Copyright 2002; RKB
Figure 34 - Showing the web sagging problem during the Newsprint A trial run that contributed to web breaks.
After some adjustments we were finally able to reach 5000 fpm (000 m/min) and start acquiring data. Then after five seconds of data acquisition at 5000 fpm the web directional control couldn’t respond fast enough. A web break occurred that caused a huge paper Jam (Figure 35). A long section of the roll was lost and the roll was split into two rolls with the smallest roll not negligible in diameter. Both rolls were removed from the machine.
Figure 25 - Web Break of Newsprint Roll A
12.0.4.3 LINERBOARD IMPORT; LONGVIEW FIBER CO. 35 LB GRADE:
First Run; Linerboard Import Product #14:
The IPST prepared the next product for evaluation. The product was provided by Longview Fiber
Co., and was labeled as Linerboard, Import. The basis weight range of the product was 35-lbs/3000 sq. ft. RKB logged this product in its DCS unit as Product 14, Reel #1. The threshold detection level was set at 6.9 on a 10-position switch with 10 being most sensitive. The product was to be run up to a speed of 2500 feet per minute (762 m/min) before the evaluation was to begin. The overall resolution for this speed according to the placement of the sensor and the data rate actually used was 0.36 square millimeters (0.013 inches CD by 0.043 inches MD) as related to TAPPI Test Method T437. The defect faults of interest to this company were holes and dirt. RKB set the sizing into three categories (Large, Medium and Small). The setting cross over for each category was set as follows (Table 28).

IPST & RKB; 02/26/02 Page 45 of 63 ©Copyright 2002; RKB
TABLE 29 ID Size text Class Size Total Count for Run Start Time Stop Time Total Run Time
11/12/99 1 Holes small 4 1 7:53:38 AM 7:58:27 AM 4 min 49 sec 2 Holes medium 5 4 3 Holes large 6 2 4 Spots small 1 519 5 Spots medium 2 739 6 Spots large 3 343
Product Code 14 Total Count 1608
That data collected (Table 29 above) was favorable according to the settings and conditions. The web exhibited quite a lot of sagging and flutter, which affects the detection capability as the web significantly moved in and out of focus to the sensor. This problem may have been caused by mechanical problems in the pilot machine during the break problems the day before when operational speed was running up to 5000 fpm (000 m/min). The outside surface of the web was facing up towards the sensors. During this test, the footage module was not connected so it was not possible to know exactly the location of the defects in the web. However, the defect count overall was not affected nor was defect detection. Figure 36 depicts a defect that was detected during this trial run. The divisional ruler used was in metric and divided by centimeters. Each graduation represented a millimeter. The spot defect was approximately 3 to 4 millimeters diameter.
Figure 26 - Picture of spot defect detected during linerboard import test run
Second Run; Linerboard Import Product #14:
The IPST prepared the roll for a second pass. The product was not rewound prior to evaluation.
RKB logged this product in its DCS unit as Product 14, Reel #2. The threshold detection level was set at 6.7 on a 10-position switch with 10 being most sensitive. The defect faults of interest to this company were holes and dirt. RKB set the sizing into three categories (Large, Medium and Small). The setting cross over for each category was set as listed in Table 28.
The product again, was to be run up to a speed of 2500 feet per minute (762 m/min) before the
evaluation was to begin. The overall resolution for this speed according to the placement of the sensor and the data rate actually used was the same as in the prior test run. The test data start time was 8:29:08 AM with a stop time of 8:33:48 AM. The total duration of the test run was approximately 4 minutes 32 seconds. The test was conducted on Friday, November 12, 1999. The web experienced tension control problems causing flutter and slake. The data collated during this run was favorable. The following data was retrieved for the DCS database for this run (Table 30).

IPST & RKB; 02/26/02 Page 46 of 63 ©Copyright 2002; RKB
TABLE 30 ID Size text Class Size Total Count for Run Start Time Stop Time Total Run Time
11/12/99 1 Holes small 4 1 8:29:08 AM 8:33:48 AM 4 min 32 sec 2 Holes medium 5 0 3 Holes large 6 1 4 Spots small 1 372 5 Spots medium 2 270 6 Spots large 3 346
Product Code 14 Total Count 990
Third Run; Linerboard Import Product #14:
The IPST set the sixth roll of paper up to be inspected with a third pass. The product was not
rewound prior to evaluation. RKB logged this product in its DCS unit as Product 14, Reel #3. The threshold detection level was set at 6.7 on a 10-position switch with 10 being most sensitive. The defect faults of interest to this company were holes and dirt. RKB set the sizing into three categories (Large, Medium and Small). The setting cross over for each category was set as follows (Table 28).
The product was to be run up to a speed of 1250 feet per minute (381 m/min) before evaluation was
to begin. The overall resolution for this speed according to the placement of the sensor and the data rate actually used was 0.25 square millimeters (0.013 inches CD by 0.029 inches MD) as related to TAPPI Test Method T437. The test data start time was 9:02:44 AM with a stop time of 9:13:29 AM. The total duration of the test run was approximately 10 minutes 45 seconds. The test was conducted on Friday, November 12, 1999. The web experienced little tension control problems causing flutter and slake. The data collated during this run was favorable. The following data was retrieved for the DCS database for this run (Table 31).
The reason speed was reduced was to evaluate machine speed affect on detection count as compared
to product 14, reel #1. As with Reel #1, the outside surface was facing the sensors. The tests indicated that indeed, more spot defects are counted at reduced speed which indicates that machine speed plays an important roll relative to overall resolution capability and as explained by RKB to the IPST in their methodology (earlier discussed in this report).
TABLE 31
ID Size text Class Size Total Count for Run Start Time Stop Time Total Run Time11/12/99 1 Holes small 4 7 9:02:44 AM 9:13:29 AM 10 min 45 sec
2 Holes medium 5 5 3 Holes large 6 5 4 Spots small 1 1223 5 Spots medium 2 1381 6 Spots large 3 1277
Product Code 14 Total Count 3898

IPST & RKB; 02/26/02 Page 47 of 63 ©Copyright 2002; RKB
Figure 27 - Real time mapping of defects. All defects are dark spots of different sizes
Forth Run; Linerboard Import Product #14:
The IPST prepared the roll to be inspected on a fourth pass. The product was not rewound prior to
evaluation. RKB logged this product in its DCS unit as Product 14, Reel #4. The threshold detection level was set at 6.6 on a 10-position switch with 10 being most sensitive. The defect faults of interest to this company were holes and dirt. RKB set the sizing into three categories (Large, Medium and Small). The setting cross over for each category was set the same as previous tests (Table 28).
The product in this test, however, was run up to a maximum speed of 1250 feet per minute (381
m/min) before the evaluation was to begin. The overall resolution for this speed according to the placement of the sensor and the data rate actually used was 0.23 square millimeters (0.013 inches CD by 0.028 inches MD) as related to TAPPI Test Method T437. The test data start time was 9:41:37 AM with a stop time of 9:51:18 AM. The total duration of the test run was approximately 9 minutes 41 seconds. The test was conducted on Friday, November 12, 1999. The web experienced little tension control problems causing flutter and slake. The data collated during this run was favorable. The following data was retrieved from the DCS database for this run (Table 32).
The reason speed was reduced was to evaluate machine speed affect on detection count as compared
to product 14, reel #2. As with Reel #2, the inside surface was facing the sensors. The tests indicated that indeed, more spot defects are counted at reduced speed which indicates that machine speed plays an important roll relative to overall resolution capability and as explained by RKB to the IPST in their methodology (earlier discussed in this report).
TABLE 32
ID Size text Class Size Total Count for Run Start Time Stop Time Total Run Time11/12/99 1 Holes small 4 0 9:41:37 AM 9:51:18 AM 9 min 41 sec
2 Holes medium 5 2 3 Holes large 6 0 4 Spots small 1 1040 5 Spots medium 2 759 6 Spots large 3 796
Product Code 14 Total Count 2597
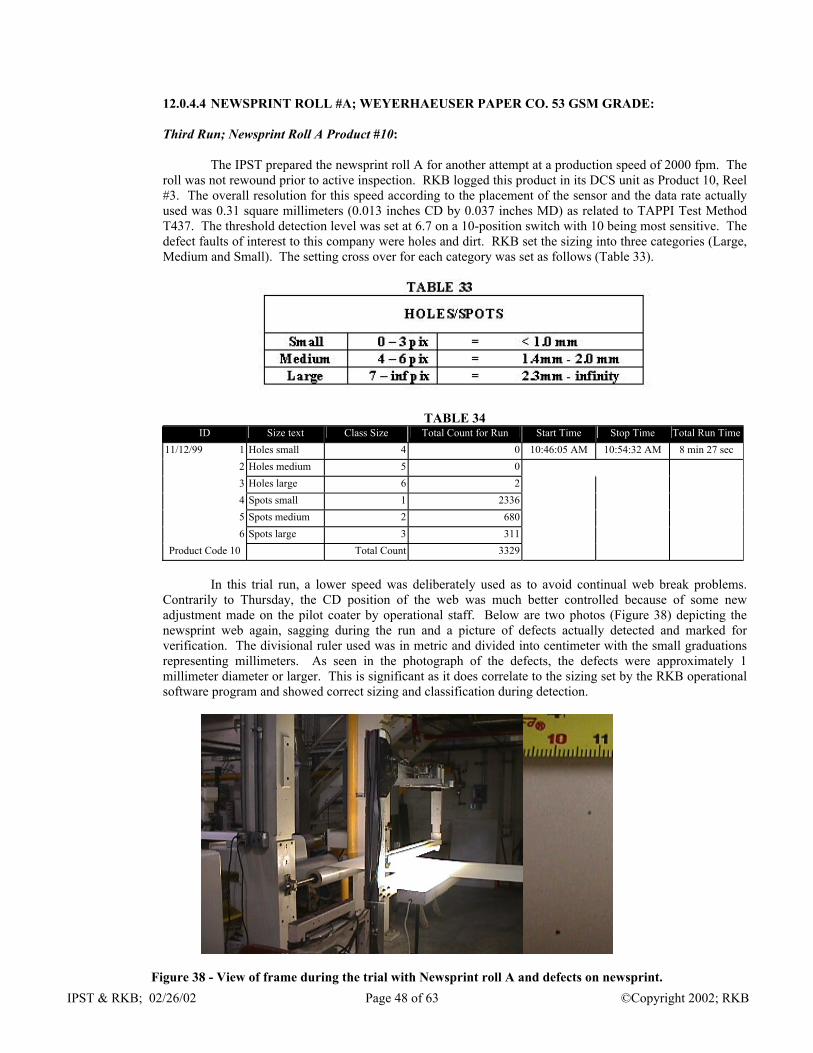
IPST & RKB; 02/26/02 Page 48 of 63 ©Copyright 2002; RKB
12.0.4.4 NEWSPRINT ROLL #A; WEYERHAEUSER PAPER CO. 53 GSM GRADE:
Third Run; Newsprint Roll A Product #10:
The IPST prepared the newsprint roll A for another attempt at a production speed of 2000 fpm. The roll was not rewound prior to active inspection. RKB logged this product in its DCS unit as Product 10, Reel #3. The overall resolution for this speed according to the placement of the sensor and the data rate actually used was 0.31 square millimeters (0.013 inches CD by 0.037 inches MD) as related to TAPPI Test Method T437. The threshold detection level was set at 6.7 on a 10-position switch with 10 being most sensitive. The defect faults of interest to this company were holes and dirt. RKB set the sizing into three categories (Large, Medium and Small). The setting cross over for each category was set as follows (Table 33).
TABLE 34 ID Size text Class Size Total Count for Run Start Time Stop Time Total Run Time
11/12/99 1 Holes small 4 0 10:46:05 AM 10:54:32 AM 8 min 27 sec 2 Holes medium 5 0 3 Holes large 6 2 4 Spots small 1 2336 5 Spots medium 2 680 6 Spots large 3 311
Product Code 10 Total Count 3329
In this trial run, a lower speed was deliberately used as to avoid continual web break problems.
Contrarily to Thursday, the CD position of the web was much better controlled because of some new adjustment made on the pilot coater by operational staff. Below are two photos (Figure 38) depicting the newsprint web again, sagging during the run and a picture of defects actually detected and marked for verification. The divisional ruler used was in metric and divided into centimeter with the small graduations representing millimeters. As seen in the photograph of the defects, the defects were approximately 1 millimeter diameter or larger. This is significant as it does correlate to the sizing set by the RKB operational software program and showed correct sizing and classification during detection.
Figure 38 - View of frame during the trial with Newsprint roll A and defects on newsprint.

IPST & RKB; 02/26/02 Page 49 of 63 ©Copyright 2002; RKB
Fourth Run; Newsprint Roll A Product #10:
The IPST prepared the roll of newsprint for a final inspection pass. The roll was not rewound prior
to active inspection. RKB logged this product in its DCS unit as Product 10, Reel #4. The threshold detection level was set at 6.7 on a 10-position switch with 10 being most sensitive. The defect faults of interest to this company were holes and dirt. RKB set the sizing into three categories (Large, Medium and Small). The setting cross over for each category was set as in previous test (Table 33). The following data was retrieved and logged (Table 35).
TABLE 35
ID Size text Class Size Total Count for Run Start Time Stop Time Total Run Time11/12/99 1 Holes small 4 0 11:18:41 AM 11:22:07 AM 3 min 26 sec
2 Holes medium 5 0 3 Holes large 6 2 4 Spots small 1 769 5 Spots medium 2 250 6 Spots large 3 79
Product Code 10 Total Count 1100
In this test, the inside surface was facing the sensors. Further adjustments were made to the pilot
coater machine. The beginning of the paper machine is now the master that sets the tension of the web. We started recording data when the speed reached 3300 fpm (1006 m/min). The speed stayed at that plateau for a few minutes and then was increased to 5000 fpm (1524 m/min) where it stayed until the end of recording at 11:22 AM EST. Since the machine speed varied, the MD direction resolution per pixel varied that would have a direct variance on detection, sizing and count totals.
At that time, it was determined that we could achieve the maximum speed without web breaks and
decided to move to the Newsprint Roll B which has not be used thus far. Roll A was 30” wide instead of 27” wide for roll B. Despite the fact the paper grade is the same, we changed the product name from 10 to 15 to logged information independently.
12.0.4.5 NEWSPRINT ROLL #B; WEYERHAEUSER PAPER CO. 29 LB GRADE:
Only Run; Newsprint Roll B Product #15:
The IPST prepared the final roll to be inspected. The product was provided by Weyerhaeuser Paper
Co., Longview, Washington and was labeled as Newsprint, Roll B. The basis weight range of the product was 29-lbs/3000 sq. ft. RKB logged this product in its DCS unit as Product 15, Reel #1. The threshold detection level was set at 6.7 on a 10-position switch with 10 being most sensitive. The defect faults of interest to this company were holes and dirt. RKB set the sizing into three categories (Large, Medium and Small). The setting cross over for each category was set as follows (Table 36).
Acquisition of data occurred between the 2nd red mark and the black mark (1st red mark was when the coater reached maximum speed of 3500 fpm) at a constant speed of 5000 fpm. No web breaks occurred and the test was completed up to the end at 5000 fpm without any noticeable pilot machine problems. Data files are currently being processed and analyzed. Figure 39 shows the equipment and a spot defect detected during this run.

IPST & RKB; 02/26/02 Page 50 of 63 ©Copyright 2002; RKB
Figure 39 - Camera frame during testing of Newsprint Roll B and a spot defect detected during the run.
TABLE 37 ID Size text Class Size Total Count for Run Start Time Stop Time Total Run Time
11/12/99 1 Holes small 4 1 12:02:41 PM 12:07:36 PM 4 min 55 sec 2 Holes medium 5 0 3 Holes large 6 0 4 Spots small 1 1080 5 Spots medium 2 782 6 Spots large 3 386
Product Code 15 Total Count 2249
13.0 TRIAL RESULTS SUMMARY
The R.K.B. OPTO-ELECTRONICS, INC., Model 3030 Video Web Inspection System using CCD camera-based technology, in particular, the 1024 CCD Line Scanning Chip set is more than sensitive enough to detect holes and dirt to levels expected by paper makers. By using their patented streak detection technology, RKB is able to accurately and effectively detect subtle coating scratches and streaks consistent with coating material processes from Matte to double sided gloss coating of all basis weights. Although Appleton Papers had some difficulties in maintaining a consistent web where web flutter and slake would be limited, the overall results of the tests were very positive. All scratches that were to be detected were done so consistently and reliably. Spot and Hole detection were accurate although some runs had the sensitivity adjusted to compensate for the transmissivness of the product, type of product and machine variances such as flutter and tension control. This trial has proved that the ability of the RKB system, its methodology and personnel can meet and potentially exceed many, if not all, paper manufacturers requirements. It was verified that system alignment, although, imperative was not a deterrent in reliable detection of coating scratches, streaks, holes and spots. It was also verified that a paper mill environmental condition did not affect detection capability. Although flutter did pose a problem at times during this initial trial, RKB was the first company to be evaluated a multiple camera setup and it was the first time Appleton Papers personnel attempted to run at speeds not intended for the pilot machine and not normally run. Additionally, the placement of the inspection system across a wide span of paper in the machine direction without any rolls for web stabilization contributed to some of the related web control problems. Once many of the tension and brake problems were solved, test results were consistent. Above all, it was proved that RKB could provide paper manufacturers a cost-effective solution for discrete coating scratch, streak, and spot and hole detection. Overall, test evaluations and results for both were excellent.

IPST & RKB; 02/26/02 Page 51 of 63 ©Copyright 2002; RKB
Additionally RKB displayed the following:
The counts of the defects ranged from 90 to 100% of those applied.
The sizing routing seems adequate for IPST and RKB needs.
We believe this is a mill representative exercise in that the pilot coater can run at mill speeds with a rigid head to sheet configuration.
14.0 RECOMMENDATIONS
Since the RKB system met and potentially exceeded the requirements set forth by the IPST, RKB recommends that the IPST can successfully report to the AF&PA MTC Evaluation Team that RKB’s camera-based family of detection systems can and does achieve reliable, consistent and accurate detection of the types of defects presented to the IPST by AF&PA members and their affiliates.
15.0 COSTS
It also appears that an additional benefit can be gained in cost implementation of an RKB system as the overall costs associated for manufacture and supply of such a system appears to be anywhere from 10 to 30% less than those supplied by other inspection companies. It was apparent in discussions with RKB personnel that it is there intention to develop long-term working relationships with their clients and to that end, will work with paper manufacturers, in fact all material manufacturers, in a partnership to achieve the required quality assurance goals.
16.0 APPENDIX
APPENDIX A Additional Remarks about the System Features and Test Conditions
(a) Distributed Control System (DCS) (b) Displaced Symbols & Colors used for Flaw Detection (c) Color Marking on the Edge of Web Material (d) Application of Flood Type Lamps
APPENDIX B
Scratch Evaluation tests of the 0.001” (0.025mm) wide scratch contained in International Papers, Double
Sided Accolade Gloss. Test Results are as follows:
APPENDIX C Literature Cited
APPENDIX D Acknowledgements

IPST & RKB; 02/26/02 Page 52 of 63 ©Copyright 2002; RKB
APPENDIX A
Additional Remarks about the System Features and Test Conditions
Distributed Control System (DCS) The RKB Distributed Control System (DSC) is also called QAMS® (Quality Assurance Management System). In this system, the QAMS receives the data information from hardware circuitry and processes the information into usable parameters that the operational and managerial staff can manipulate. This information can be the type of defect, size of defect, location of defect in both machine and cross machine direction, how many defects, defect sizes, footage counts, start and stop times of defects, etc. Other information such as paper machine diagnostics, i.e., repeating defects, intervals they occur at, where and probable cause (i.e., dryer, felt, wire, etc.), inspection machine diagnostics (i.e., power supplies, sensors, lamps, blowers, etc.), and a variety of other information can be received and processed by the QAMS. This information can be manipulated by the staff and can be transferred to other process stations or systems like Bailey, Honeywell, etc…. Via RS232, RS422 and Ethernet. Since the data is stored in and based on Microsoft® Access® (*.mdb format), the data can be simply converted into other database formats to include by not limited to (*.xl, *.xls, *.xla, *.prn, *.txt, *.csv, *.dbf, *.xlm, *.xlc, *.xll, *.xlb, *.slk, *.dif, *.htlm). User data sources utilized but not limited to dBASE, EXCEL, FoxPro, VISUAL FoxPro, MQIS, SQL, and Text. RKB refers to its QAMS as its DCS as it is really a distributed control system for on-line quality assurance and control inspection. Some examples of RKB’s QAMS operational displays are as follows:
Figure 40 - Defect Size Setup Parameter Figure 41 – Product Code Selection Parameter
Figure 42 – Repeating Defect Diag Selection Parameter Figure 43 – QAMS System Information Display

IPST & RKB; 02/26/02 Page 53 of 63 ©Copyright 2002; RKB
Figure 44 – Defect Mapping Display (real time) Figure 45 – Defect Count Display (reel/prod)
Figure 46 – Hole Defect Profile Display (reel/prod) Figure 47 – Spot Defect Profile Display (reel/prod)
Figure 48 – Streak Defect Profile Display (reel/prod) Figure 49 – QAMS System Setup Display

IPST & RKB; 02/26/02 Page 54 of 63 ©Copyright 2002; RKB
Figure 50 – QAMS Communication Display
Some examples of RKB’s QAMS managerial displays are as follows:
Figure 51 – QAMS Data Setup Parameter Figure 52 – QAMS Product Code Setup Parameter
Figure 53 – QAMS Repeating Defect Setup Parameter Figure 54 – Historical Information Archive

IPST & RKB; 02/26/02 Page 55 of 63 ©Copyright 2002; RKB
Some examples of RKB’s QAMS Historical Information Reporting Functions are as follows:
Figure 55 – System Diagnostics Report Figure 56 – Web Break Report
Figure 57 – Reel Turn Up Report Figure 58 – Defect Event Report

IPST & RKB; 02/26/02 Page 56 of 63 ©Copyright 2002; RKB
Some examples of RKB’s QAMS Diagnostics Alarm Indicators are as follows:
Figure 59 – System Diagnostic Alarm Indicators (show all systems go)
Figure 60 – System Diagnostics Alarm Indicators (show reel turn up alarm indication)
Some examples of RKB’s QAMS Simplified Database Formatting for easy manipulation are as follows:
Figure 61 – Forms Database Information
Figure 62 – Queries Database Information

IPST & RKB; 02/26/02 Page 57 of 63 ©Copyright 2002; RKB
Figure 63 – Report Database Information
Figure 64 – Table Database Information
Displaced Symbols and Colors for Defect Fault Detection RKB follows the guidelines set forth in the TAPPI test methods T437 (refer to appendix C) for determination of dirt in paper and paperboard. In this test method dirt sizes are given in mm² based on the formula for defining area of a circle (pir²). Therefore, in the RKB Model 3030 CCD Camera-based Video Web Inspection System, the symbol used for holes and spots are circles with spots having a dark circle and holes a white circle. The spot circle can be made of a black spot or grey spot, depending on the severity of the spot. The hole symbol is a white circle as the main difference among various holes is in size not appearance. Both holes and spots have a rectangular symbol that surrounds the circle symbol. This rectangular symbol is color-coded in three main colors that are red, blue and green. These colors represent the sizing threshold changes (i.e., blue represents small defects, green represents medium defects and red represents large defects). These sizes are operationally adjustable on the fly or can be preset via the product code setup parameter by managerial staff prior to production depending on what product or grade will be produced. In this evaluation, small holes were set at 0 to 4 mm, medium holes were set at 4.1 to 8 mm and large defects were set a 8.1 mm or larger. If additional size categories are required, they can be implemented with additional color schemes. Additional information provided is the location of the defect in the cross machine and machine direction, total defect count per reel and product run, profiles of holes and spots, historical information, and possible fault causing area in the material production equipment (i.e., felt, wire, dryer, etc…). Additional information can be applied and is generally formulated with each client on a user basis. Symbols as well as text represent the coating streak defects. The streak defect symbols are lines that vary in width depending on the defect size. Wide lines represent true coating streaks and thin lines represent coating scratches. The lines are color-coded similar to the hole and spot defects for easy identification. Blue lines represent scratches, green lines represent scratch/streak and red lines represent streaks. Below these symbols is a text window that provides operational and managerial staff with precise defect location. Each line of text represents a streak or scratch and includes the channel the defect is located in, the start footage of the defect, end footage of the defect, total footage of the defect, location of the defect in the cross machine and machine direction, severity of the defect (i.e., scratch or streak), and possible fault causing location in the paper machine and/or coating machine (i.e., coater station, dryer section, etc.) Additional information can be implemented and it generally formulated with each client on a user basis prior to system implementation.

IPST & RKB; 02/26/02 Page 58 of 63 ©Copyright 2002; RKB
Defect Location Marking RKB offers, in addition to its full web inspection technology, defect-marking technology that can be applied to most web material for the identification and location of defects that require additional process control. Called the Model 1280® Multicolor Spray Marking System, the defect marking technology marks the edges of the web material with various color-coded water-based inks. The mark themselves, are made by spraying suitable marking fluids on to the sheet edge such that when reeled up, the marks are visible as concentric, colored rings on the end of the reel. The spray marker may be employed with various types of automatic web inspection systems, or process control equipment to place marks at the sheet edge whenever a defect fault is identified in the web or when a process unit has failed to perform its application to a web. The multicolor markers provide a red, blue, green, black or orange spray for various defect types or cross machine identification. These enables the colors to be used to indicate defect fault location in the cross machine direction, defect fault classification and type or which process unit such as a coater or treater may have failed. Operational staff can then use these marks to slow down and stop additional processes such as winders for corrective action (i.e., patching, splicing out, etc.). Additionally, RKB can provide sensors to automatically locate such marks and automate the speed control and machine stop time for corrective action processes. All marks are applied by means of a spray nozzle that projects a controllable jet of fluid at the web edge. The spray system is operated under pneumatic pressure, with spray intensity adjustments available. The marker assembly is equipped with a web follower system and, when operating in its automatic mode, will position the movable carriage of the assembly accurately over the edge of the web. A fine adjustment is provided to ensure that the spray is directed onto a narrow band at the web edge when the carriage is positioned. All ink and spare parts are supplied through RKB for proper operation and maintenance of the Model 1280 multicolor spray marker. It is requested that the customer used manufactured supplied water base ink and parts. Should alternative parts or ink be desired, RKB asks that the client inform RKB for verification of performance prior to use. With specific regards to ink, viscosity, acidity and other factors may affect operation and the life of the marker. The Model 1280 consists of three major sub-assemblies. These assemblies are the control enclosure, marker assembly and over spray collection system. The control enclosure is a wall mounted NEMA rated enclosure containing all marker controls, electronics, power supplies, CMOS digital control boards, solid state relays and sheet break and marker test stations. The marker assembly contains all mechanisms required to mark the sheet and follow any web drift if required. The marker assembly consists of two major sub-assemblies, the head of the marker and body. The marker head contains the ink applicator and web guide systems. The body contains all of the color valves, ink wells, and associated components to deliver the ink to the marker head. The body also incorporates the mechanism to allow for movement of the unit in a forward and reverse mode. Finally the over spray collection system mounts around the web guides on the spray head. The over spray collection system is a reservoir which collects unused ink from the marking applicator or nozzle. Because the ink is atomized when leaving the nozzle, it is strongly recommended that the over spray collection system be installed at all times. Custom designed collection systems can be supplied by RKB if physical restraints prevent reliable installation of the standard unit. Additional colors can be added to the spray marking technology depending on the overall application and are formulated with each client on a user basis. Application of Flood Lamps During the Evaluation of the International Paper, Accolade Gloss Product, RKB quickly attempted to use flood type lamps to facilitate detection of the non-specified coating scratch that was intermittently picked up during the test runs. However, because the specifications for this run prior to setting up the equipment did not call for this type of defect, nor light source, the position design of the light source could not be obtained without taking some reasonable time that was not scheduled. Therefore, the presence of the flood lamps resulted in little or no improvement of flaw detection. As indicated, samples of the glossy coated paper used in this part of the evaluation was taken by RKB at the approval of the IPST for further laboratory evaluation at RKB’s facilities in Syracuse, New York. The results of said evaluation are provided in Appendix B of this report. If properly installed, reflective flood type lamps can significantly improve flaw detection capability of the system. An example of this would be an inspection system provided by RKB for one of their European clients in which flood type lamps are utilized for coating streak and scratch detection. This system has been installed for over 5 years and has provided very accurate and reliable coating streak and scratch detection down to a level of 0.006” (0.15mm) without one recorded problem in performance and operation. This installation has also shown historically, that maintenance costs required for this technology upkeep is extremely low averaging US $1,000.00 per annum. In most cases, the location of flood type lamps would be on the same side as the coated surface of the material being inspected and positioned in a proprietary manner that would be determined based on the material, type of streak or scratch and basis weight. The type of sensors and light sources required for a specific application is determined by RKB prior to system manufacturing.

IPST & RKB; 02/26/02 Page 59 of 63 ©Copyright 2002; RKB
APPENDIX B
SCRATCH EVALUATION ON THE IPST INTERNATIONAL PAPER ACCOLADE GLOSS
SCRATCH <0.001” WIDE
Subject: Sample Test Report R.K.B. OPTO-ELECTRONICS, INC. - Sample Test 02-10-0041-2000 To: Emmanuel LaFond; Asst Scientist/ IPST From: Bruce Dobbie; Summary November 10, 1999; R.K.B. OPTO-ELECTRONICS, INC., was involved in various on-line evaluations with the Institute of Paper Science & Technology at the Appleton Paper, Appleton, Wisconsin Mill. The evaluations covered many types of products and defect types. Of these tests, one particular product presented to RKB from International Paper contained various subtle scratches on the surface of the paper. The product, called Accolade Gloss, was a paper coated on both sides and glossed. The initial scratch the IPST was after was detected with no problems, however, RKB noticed that the sample contained many small scratches, in particular, a scratch that was approximately 0.001” wide or smaller. Both RKB and IPST personnel at Appleton via a microscope viewed this scratch. RKB informed the IPST that we wanted to take this sample back for further evaluation as the test setup allowed only for a 4” field of view per sensor or a defect detection capability of 0.004” wide. The sample provided represented a variety of scratch sizes, all of which was less then if not equal to 0.001” wide. The occurrence of this type of fault as seen on the sample indicates that it is quite common and occurs frequently within the production process. The sample was provided to RKB in order to see what our equipment could see at full machine speeds. The following information is the result of the tests that should help better justify a real system. Summaries of the RKB tests are given below. RKB Test Summary The RKB OPTOMIZER system successfully detected the coating scratch that was contained within the sample product brought back for evaluation. Based on the signal to noise ratio obtained, a detection level for the specified scratch can be determined. Trial Background According to Emmanuel LaFond the surface defect fault known as the coating scratch is the main contributor for mechanical problems, customer complaints and credits. A test was conducted to determine if these surface defect (line type) faults could be detected to insure a defect free surface for customers. Various suppliers have been identified for review to better justify a real system and to define differences between suppliers.

IPST & RKB; 02/26/02 Page 60 of 63 ©Copyright 2002; RKB
The RKB test system was utilized in a laboratory environment to look at and identify the coating scratch fault that appeared white on white. The unit was set up in a reflective mode which seem to provide the best possible signal to noise ratio. This means that both camera and lighting sources are to be located on the same side of the web being monitored. Based on the overall results of the tests, this mode of operation is recommended by RKB. RKB’s test system was configured for scratch detection evaluation only. Trial Description A paper sample consisting of linear type defect fault called a coating scratch was provided for evaluation. The defect fault appeared white on white in color and was very subtle. The scratch was of varying size in the cross machine direction. RKB utilized its patented Opto-Tek II CCD camera based technology coupled with its proprietary electronic processing circuitry. A light source was utilized in a reflective mode positioned in an angle to incident to provide the most enhanced signal to noise ratio possible. The Opto-Tek II sensor was positioned on the same side of the web as the light and utilized a standard lens which provided an operation field of view of 1.3 inches in the cross machine direction by approximately 1.5" in the machine direction. The total scan rate and pixel processing power is proprietary and patented. Trial Results The test results achieved were considered very good. The signal to noise ratio achieved and viewed via a dual channel oscilloscope was substantial for such a subtle defect fault. Although some of the more subtle streaks (not marked) were seen the signal to noise ratio yielded indicated that those streaks may or may not be detected depending on material make up, flutter, etc.... The scan rate per sensor is proprietary and will not be available for record. Currently the Opto-Tek II technology is the only kind available in the market today. RKB also holds patents on the technology method. Overall detection is 100%. This percentage ratio suggests that applying a system would be cost effective and justifiable. System Justification Potential annual savings cannot be listed since RKB is not privy to the overall amount of complaints listed against this type of defect. It is known that savings realized, especially those that have incorporated our specialty streak detector, will experience significant savings annually. The justification for savings is based on the presumption to locate and resolve defect issues in a faster time period than existing inspection methods and reduced customer credits. Further “reject” justification would come from the increased salvaging of good paper from reject paper. Increased market share justification is not included. • RKB can detect defect faults of interest and should be considered to provide a full web sheet analysis unit on this
paper/coating machine.
Picture 1 - Setup of IPST Lab Test

IPST & RKB; 02/26/02 Page 61 of 63 ©Copyright 2002; RKB
Picture 2 - Signal to Noise 2.5:1
Picture 3 - Set up of Test Equipment

IPST & RKB; 02/26/02 Page 62 of 63 ©Copyright 2002; RKB
APPENDIX C
Literature Cited 1. Brodeur, P., “Comparative Evaluation of On-line Camera-based Web Inspection Systems” proposal to AF&PA
Measurement Technology Committee (1997) 2. Hojjatie, B., “Evaluation of Commercial On-line Camera-based Web Inspection Systems; Report #82 to AF&PA
Measurement Technology Committee by the Institute of Paper Science and Technology Atlanta, George (2002) 3. Livonen, P. and Martel, F., Defect Detection and On-line Analysis of Coated Papers, Appita 44(5) 305-306 (1991) 4. Dobbie, B., “Coating scratch and streak detection no longer unattainable” http://www.pira-partners.com/pti98/scratch.htm
(1998) 5. Dobbie, B., “R.K.B. OPTO-ELECTRONICS, INC., Operational Manual; Model 3030 CCD Camera-based Video Web
Inspection System” 1992 6. Dobbie, B., “R.K.B. OPTO-ELECTRONICS, INC., 3000 Series, Frequently Asked Questions, www.rkbopto.com (2000) 7. Dobbie, B., “R.K.B. OPTO-ELECTRONICS, INC., Specification D5060 ‘Scratches in coated paper and paperboard’
(1995) 8. Dobbie, W., “R.K.B. OPTO-ELECTRONICS, INC., US Patent 5,118,195; Area Scan Camera System for Detecting
Streaks and Scratches (1992) 9. TAPPI specification T 437 om-96 ‘Dirt in paper and paperboard’ (1996) 10. TAPPI specification T 452 om-98 Brightness of pulp, paper, and paperboard (directional reflectance at 457 nm) (1998) 11. Clark, J. d'A., von Hazmburg, R. S., and Knoll, R. J., “The Estimation of Dirt and Shives in Pulp and Paper,” Paper Trade
J. 96 (5): 40 (1933). 12. Clark, J. d'A., “Method of Estimating the Dirt in Pulp and Paper,” Tech Assoc. Papers 16 (1): 347 (1933); Paper Trade J.
(June 29, 1933); Paper Maker 86 (4): TS 188 (1933). 13. Clark, J. d'A., “An Improved Measure of Dirt in Pulp and Paper,” Tappi 42 (7): 173A (1959). 14. Graff, J. H., and Nihlen, E. K., “A Chart for the Estimation of Dirt in Pulp and Paper,” Tech. Assoc. Papers 25: 331
(1942); Paper Trade J. 114 (21): 61 (1942). 15. “Dirt in Paper,” proposed revision of TAPPI Tentative Standard T 437, Tappi 46 (3): 131A (1963). 16. Clark, J. d'A, “Pulp Technology and Treatment for Paper”, Second Edition, Miller Freeman Publications, San Francisco,
CA, 1985. 17. Trepanier, R. J., “User-Friendly System Analyzes Paper Formation, Dirt Speck Content, and Solid-Print Nonuniformity,”
Tappi 72 (12): 153 (1989) (Appendix). 18. Nyquist, H. “Nyquist's theorem: Nyquist's theorem: A theorem, developed by H. Nyquist, which states that an analog
signal waveform may be uniquely reconstructed, without error, from samples taken at equal time intervals. The sampling rate must be equal to, or greater than, twice the highest frequency component in the analog signal. Synonym sampling theorem.” Definition: Nyquist’s theorem http://www.its.bldrdoc.gov/fs-1037/dir-025/_3621.htm.

IPST & RKB; 02/26/02 Page 63 of 63 ©Copyright 2002; RKB
APPENDIX D ACKNOWLEDGMENTS Financial and technical support of the American Forest and Paper Association; Measurement Technology Committee (AF&PA/MTC) are gratefully acknowledged. Technical Support of The Institute of Paper Science and Technology (IPST), in particular Emmanuel Lafond, Pierre Brodeur and Barry Hojjatie. The IPST’s diligent by-partisan approach to this evaluation has made possible information available to all industries of web based material manufacturers the capabilities and credibility’s of the equipment and services offered by R.K.B. OPTO-ELECTRONICS, INC. The IPST has made possible the insight that CCD camera technology, when applied correctly to high-speed, web inspection applications is reliable, accurate and consistent. In particular, the IPST has, in a by partisan approach, justified the technology and methodology of R.K.B. OPTO-ELECTRONICS CCD Camera-based Web Inspection Solutions as a viable and cost effective approach to on-line web inspection and quality control analysis. RKB would like to thank Appleton Papers Inc., Appleton, Wisconsin and their employees for providing the facilities and time for the IPST evaluations to be conducted in a mill like environment. RKB is greatly appreciative of the in-depth work provided by the IPST and the AF&PA/MTC, in particular the evaluation, study, justification and acceptance of RKB’s patented coating streak detection methodology. RKB is pleased to have this third party acceptance of its equipment and service support capabilities. RKB thanks Peter Ariessohn for a through review of the initial draft report of the actual IPST report and many useful suggestions. The contributions of Dennis Kalberg, Pierre Brodeur and Joe Gerhardstein are gratefully acknowledged. RKB would like to give special thanks to William Dobbie, founder of RKB and current Chairman for the expertise of more than 50 years specific to web inspection and the application thereof. RKB Logos and Symbols are registered trademarks of R.K.B. OPTO-ELECTRONICS, INC. OPTOMIZER is a registered trademark of R.K.B. OPTO-ELECTRONICS, INC. QAMS is a registered trademark of R.K.B. OPTO-ELECTRONICS, INC. Opto-Tek I, Opto-Tek II and Opto-Tek III are registered trademarks of R.K.B. OPTO-ELECTRONICS, INC.
Comments: This report contains privileged and confidential information and is the property of R.K.B. OPTO-ELECTRONICS, INC. This report is copyrighted 2002 and may not be used, disseminated, distributed or copied without the express written consent of R.K.B. OPTO-ELECTRONICS, INC. Any unauthorized use of this report and the information herein contained will be construed as a violation to United States copyright laws and will be held enforceable by a United States Court of competent jurisdiction. Any unauthorized use or misuse of this information in an attempt to harm in any way R.K.B. OPTO-ELECTRONICS, INC., and its agents will be construed as a violation to the directives as outlined in the “Economic Espionage Act of 1996,” title 18, United States Code, sections 1831 and 1832. The obligations of any person or organization as prescribed by RKB’s confidentiality provisions and as described by law will survive termination of this information, contract, projects, discussion and/or any agreement in force. Any violation herein constitutes a breach of these terms and a United States Court of competent jurisdiction will hold law enforceable.