MINING METRICS A Comparative Case Study Assessing Impacts ...

COMPARATIVE ENERGY AND ENVIRONMENTAL IMPACTS
FOR
SOFT DRINK DELIVERY SYSTEMS
(Final Report)
Prepared for
The National Association for Plastic Container Recovery Charlotte, North Carolina
Franklin Associates, Ltd. Prairie Village, Kansas
Veronica R. Sellers Jere D. Sellers
March 1989


PREFACE
This study was performed at the request of the National Association for Plastic Container Recovery (NAPCOR) for the purpose of determining the comparative energy consumption and environmental emissions associated with nine soft drink containers. Comparative impacts were calculated for current and projected industry conditions. The current data base primarily represents conditions in 1987; however, some 1988 data are probably included in the base year numbers. Projections were made for 1990 and 1995 based on information received from government and industry sources
Comparative energy and environmental impacts were calculated through a cradle-to-grave analysis for the delivery of an equal volume of soft drink, 1,000 gallons, for each container. An extensive data base which was derived specifically for conditions in the U.S.A. was used to carry out the calculations. This data base is presented in its entirety in a separate appendix volume. associated with each specific industrial process is included and referenced in that volume. appendix and report.
All of the energy requirements and environmental emissions
Any assumptions made due to limited data are described in the
This report contains the comparative results of the study. Chapter 1 contains a thorough summary of the research findings as well as a list of conclusions which were drawn from the results. Chapter 2 describes the research methodology. Chapter 3 discusses the effects of beverage containers on municipal solid waste incineration. Chapter 4 is a comprehensive presentation and analysis of all the calculated results.
This report was made possible through the cooperation of numerous industry and government representatives. These contacts included representatives from materials manufacturing, container manufacturing, secondary packaging, the soft drink industry, and the recycling industry. The contacts provided information specific to their own industry.
The study was completed by Franklin Associates, Ltd. under the direction of Veronica Sellers and Jere Sellers, project managers. Contributions to this report were also made by the following Franklin Associates’ staff: Marge Franklin, Bob Hunt, Katie Totten, Janet Nelson, Bob Yoos, and Bob Taylor. staff and member companies in the performance and development of this report.
We gratefully acknowledge the assistance of NAPCOR’s
FRANKLIN ASSOCIATES, LTD.

- n . ii
. _- ’ TI
I 1
n
m
A1 - Btu - cu ft - EVA - HDPE - kwh - lb - L - NR - PET - PVC - REF -
oz -
LIST OF ABBREVIATIONS
aluminum British thermal units cubic feet ethylvinyl acetate high-density polyethylene kilowatt-hours pound liter nonrefillable fluid-ounce polyethylene terephthalate polyvinyl chloride refillable
FRANKLIN ASSOCIATES, LID,

TABLE OF CONTENTS
Chapter 1 - EXECUTIVE SUMMARY INTRODUCTION RESEARCH METHODOLOGY RESULTS
Total System Energy Requirements Environmental Impacts
Atmospheric Emissions Waterborne Wastes Solid Waste
CONCLUSIONS Energy Environmental
Chapter 2 - STUDY APPROACH AND METHODOLOGY BACKGROUND PURPOSE METHODOLOGY SELECTED SOFT DRINK PACKAGING SYSTEMS DATA SOURCES IMPACTS EXAMINED
Energy Environmental
Atmospheric Emissions Solid Wastes Waterborne Wastes
ASSUMPTIONS Data Sources Geographic Scope Secondary Impacts or Precombustion Energy Insignificant Impacts
Capital Equipment Space Conditioning
Electricity Energy Content of Material Resources Consumer Impacts Home Market Recycling
Chapter 3 - DETAILED STUDY RESULTS AND ANALYSIS INTRODUCTION CONTAINER SYSTEMS EXAMINED RESULTS AND DISCUSSION
Total System Energy Requirements Effects of Recycling on Energy Consumption
iv
Page
1-1
1-1 1-2 1-3 1-5 1-9 1-9 1-9 1-13 1-16 1-16 1-16
2-1
2-1 2-1 2-3 2-4 2-4 2-5 2-5 2-5 2-5 2-6 2-6 2-6 2 -,6 2-6 2-7 2-7 2-7 2-7 2-7 2-7 2-8 2-8 2-8
3-1
3-1 3-1 3-7 3-7
3-7
FRANKLIN ASSOCIATES, LTD.
TABLE OF CONTENTS (continued)
Energy Consumption Energy Sources Container Versus Noncontainer
Energy Requirements
Atmospheric Emissions Waterborne Waste Solid Waste
Environmental Impacts
V
Page
3 - 1 0 3 - 1 1
3 - 1 1 3 - 1 2 3 - 1 2 3 - 1 2 3 - 1 4
' 1
JJ
1 1
1 1
FRANKLIN ASSOCIATES, LTD. ---
Table
ES-1
ES-2
ES-3
3-1
3-2 3-3 3-4
3-5
3-6
3-7
3-8
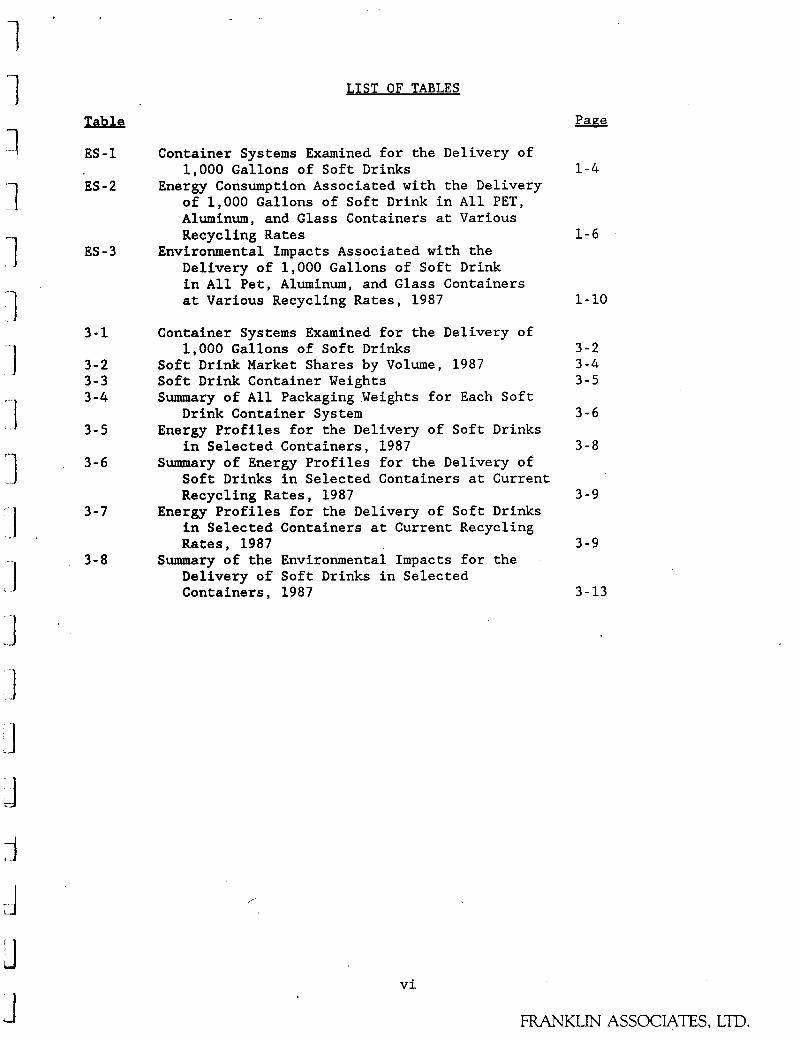
LIST OF TABLES
Page
Container Systems Examined for the Delivery of
Energy Consumption Associated with the Delivery of 1,000 Gallons of Soft Drink in All PET, Aluminum, and Glass Containers at Various
1,000 Gallons of Soft Drinks 1-4
Recycling Rates 1-6 Environmental Impacts Associated with the
Delivery of 1,000 Gallons of Soft Drink in All Pet, Aluminum, and Glass Containers at Various Recycling Rates, 1987 1-10
Container Systems Examined for the Delivery of 1,000 Gallons of Soft Drinks 3-2
Soft Drink Market Shares by Volume, 1987 3-4 Soft Drink Container Weights 3-5 Summary of All Packaging Weights for Each S o f t
Energy Profiles for the Delivery of Soft Drinks
Summary of Energy Profiles for the Delivery of
Drink Container System 3-6
in Selected Containers, 1987 3-8
Soft Drinks in Selected Containers at Current Recycling Rates, 1987 3-9
Rates, 1987 3-9
Energy Profiles for the Delivery of Soft Drinks in Selected Containers at Current Recycling
Summary of the Environmental Impacts for the Delivery of Soft Drinks in Selected Containers, 1987 3-13
/-
vi
FRANKLIN ASSOCIATES, LTD.

.-

LIST OF FIGURES
Figure
ES-1
ES-2
ES-3
ES -4
ES-5
ES-6
ES-7
ES-8
ES-9
ES - 10 ES - 11 ES-12
ES - 13
2 - 1
2-2
2 -3
2-4
Energy consumption of container systems at
Energy consumption of container groups at
Energy Consumption of container groups at
Energy consumption of container groups at
Energy consumption of container groups at
Atmospheric emissions of container systems at
Atmospheric emissions of container groups at
Waterborne wastes of container systems at
Waterborne wastes of container groups at
Weight of solid waste of container systems at
Weight of solid waste of container groups at
Volume of solid waste of container systems at
Volume of solid waste of container groups at
current recycling rates, 1987
current recycling rates, 1987
various recycling rates, 1987
various recycling rates, 1990
various recycling rates, 1995
current recycling rates, 1987
various recycling rates, 1987
current recycling rates, 1987
various recycling rates, 1987
current recycling rates, 1987
various recycling rates, 1987
current recycling rates, 1987
various recycling rates, 1987
Page
1 - 7
1 - 7
1 -8
1 - 8
1 -8
1-11
1-11
1-12
1-12
1-14
1-14
1-15
1-15
General materials flow for "cradle-to-grave" analysis of soft drink distribution system 2-2
2-9
2-10
2-11
Smary diagrm for tk,e pro&uct-oril and recycling of PET soft drink containers
Summary diagram for the production and
Summary diagram for the production and recycling recycling of aluminum soft drink containers
of glass soft drink containers
vii
FRANKLIN ASSOCIATES, Lm.

. . ,,
r--
I 11
. ...

1 Chapter 1
EXECUTIVE SUMMARY
INTRODUCTION
: -1 1 II 1 1 111 -1 L.
.. ‘-1 ‘ 1 . I” I
1.1 ‘ 1 ..
J
Since the early 1970s, many studies have been carried out to compare the energy and environmental impacts of packaging systems, particularly beverage containers. Such studies have been sponsored by various groups, including state and federal government agencies, industrial associations, and companies with special interests in given packaging alternatives. The purposes behind these studies also varied. Some major objectives included the determination of the most and least efficient packages, the effects of proposed container legislation, or perhaps the development of a comprehensive data base to assist a company in long-term planning.
Regardless of sponsor or objectives, most studies have attempted to account for energy or environmental impacts of “packaging systems.” this cradle-to-grave analysis, a packaging system includes not only the primary container, but also the secondary packaging. This study examines all the energy consumed and environmental emissions associated with the fuels, as well as the raw materials required to manufacture containers and secondary packaging, to fill and distribute beverage to consumers, and ultimately the impacts of recycling or disposing of all packaging materials. at Franklin Associates have been involved in these types of analyses since the development of this methodology in the late 1960s.
In
The personnel
Since the beverage container industry is quite competitive, it has been characteristically dynamic as well, which means that studies which compare containers quickly become out of date. There are three major types of changes over time which affect the comparative energy efficiency of beverage container systems. These must be reviewed with some regularity to assure reliable results:
(1) Improvements in industrial process energy
(2) Changes in packaging weights, materials, and
( 3 ) Changes in container recycling or reuse rates.
efficiency
basic configurations
Given the above situation in the soft drink container industry, this study was carried out to develop an accurate up-to-date comparative energy and environmental analysis for the most commonly-used containers in the soft drink industry. This study uses 1987 as the base year and projects comparative energy consumption for 1990 and 1995 based on historical and projected trends. it is much more difficult to predict such changes for environmental emissions. Therefore, in this study environmental impacts represent base year conditions.
While energy efficiency can be projected into the future,
1-1
FRANKLIN ASSOCIATES, LTD.
11
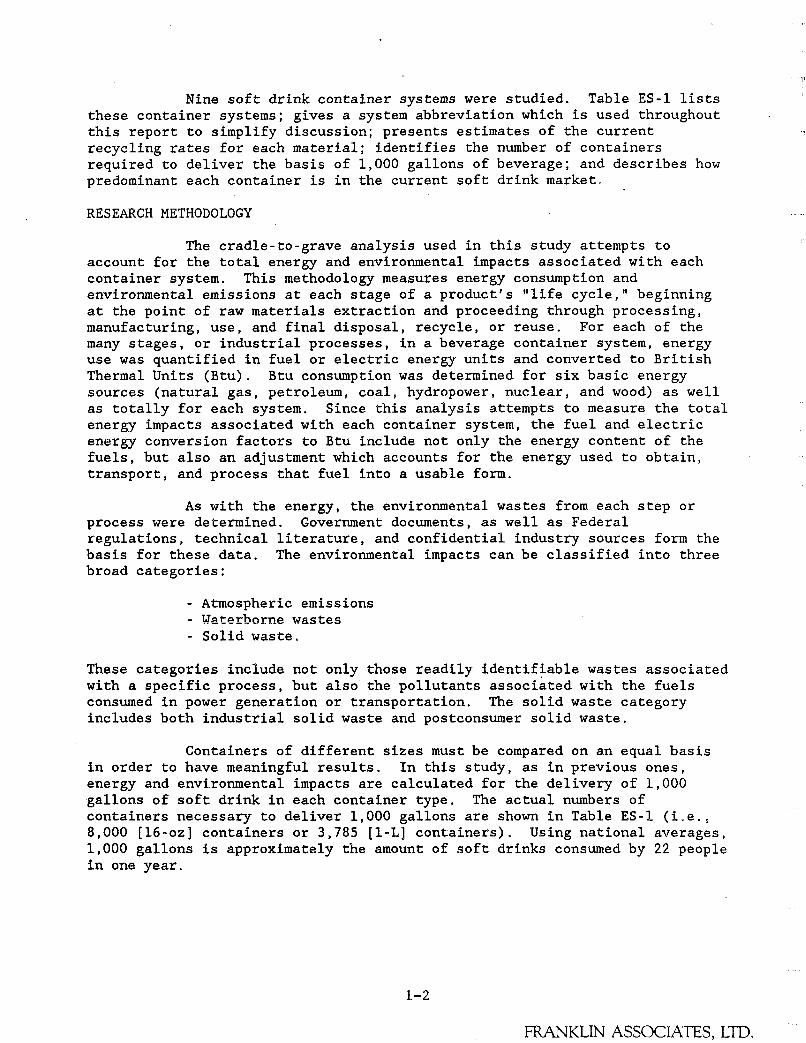
Nine soft drink container systems were studied. Table ES-1 lists these container systems; gives a system abbreviation which is used throughout this report to simplify discussion; presents estimates of the current recycling rates for each material; identifies the number of containers required to deliver the basis of 1,000 gallons of beverage; and describes how predominant each container is in the current soft drink market.
RESEARCH METHODOLOGY
The cradle-to-grave analysis used in this study attempts to account for the total energy and environmental impacts associated with each container system. environmental emissions at each stage of a product's "life cycle," beginning at the point of raw materials extraction and proceeding through processing, manufacturing, use, and final disposal, recycle, or reuse. For each of the many stages, or industrial processes, in a beverage container system, energy use was quantified in fuel or electric energy units and converted to British Thermal Units (Btu). sources (natural gas, petroleum, coal, hydropower, nuclear, and wood) as well as totally for each system, energy impacts associated with each container system, the fuel and electric energy conversion factors to Btu include not only the energy content of the fuels, but also an adjustment which accounts for the energy used to obtain, transport, and process that fuel into a usable form.
This methodology measures energy consumption and
Btu consumption was determined for six basic energy
Since this analysis attempts to measure the total
As with the energy, the environmental wastes from each step or process were determined. Government documents, as well as Federal regulations, technical literature, and confidential industry sources form the basis for these data. The environmental impacts can be classified into three broad categories:
- Atmospheric emissions - wa_terbnrne wastes - Solid waste.
These categories include not only those readily identifiable wastes associated with a specific process, but also the pollutants associated with the fuels consumed in power generation or transportation. The solid waste category includes both industrial solid waste and postconsumer solid waste.
Containers of different sizes must be compared on an equal basis in order to have meaningful results. In this study, as in previous ones, energy and environmental impacts are calculated for the delivery of 1,000 gallons of soft drink in each container type. containers necessary to deliver 1,000 gallons are shown in Table ES-1 (i-e-, 8,000 [16-oz] Containers or 3,785 [l-L] containers). Using national averages, 1,000 gallons is approximately the amount of soft drinks consumed by 22 people in one year.
The actual numbers of
1-2
FRANKLIN ASSOCIATES, Lm.
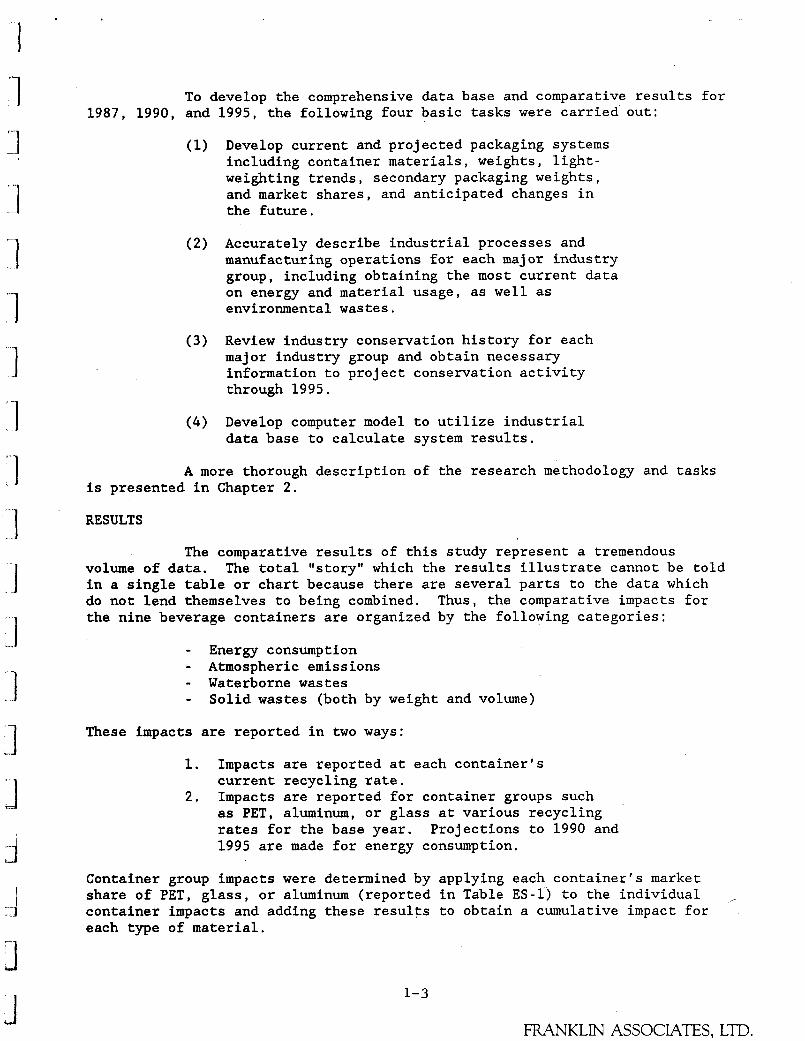
To develop the comprehensive data base and comparative results for 1987, 1990, and 1995, the following four basic tasks were carried'out:
Develop current and projected packaging systems including container materials, weights, light- weighting trends, secondary packaging weights, and market shares, and anticipated changes in the future.
Accurately describe industrial processes and manufacturing operations for each major industry group, including obtaining the most current data on energy and material usage, as well as environmental wastes.
Review industry conservation history for each major industry group and obtain necessary information to project conservation activity through 1995.
Develop computer model to utilize industrial data base to calculate system results.
A more thorough description of the research methodology and tasks is presented in Chapter 2 .
RESULTS
The comparative results of this study represent a tremendous volume of data. in a single table or chart because there are several parts to the data which do not lend themselves to being combined. Thus, the comparative impacts for the nine beverage containers are organized by the following categories:
The total llstory" which the results illustrate cannot be told
- Energy consumption - Atmospheric emissions - Waterborne wastes - Solid wastes (both by weight and volume)
These impacts are reported in two ways:
1.
2 . Impacts are reported for container groups such
Impacts are reported at each container's current recycling rate.
as PET, aluminum, or glass at various recycling rates for the base year. 1995 are made for energy consumption.
Projections to 1990 and
Container group impacts were determined by applying each container's market share of PET, glass, or aluminum (reported in Table ES-1) to the individual container impacts and adding these results to obtain a cumulative impact for each type of material.
1-3
FRANKLIN ASSOCIATES, Lm.
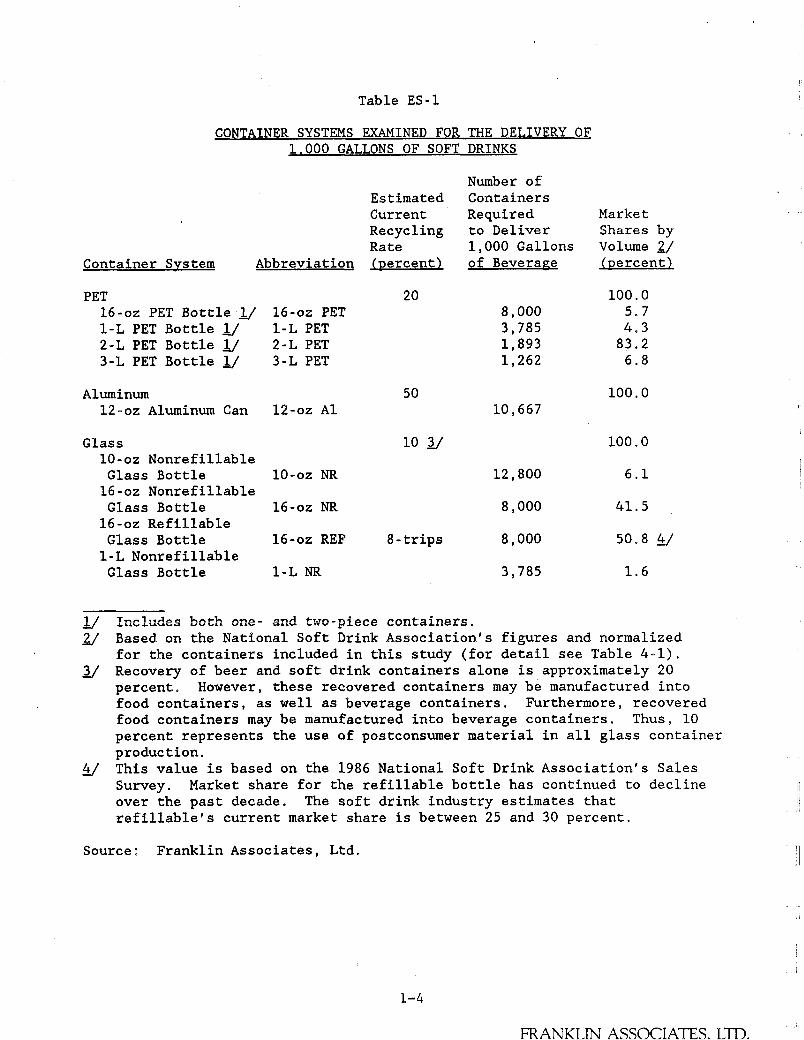
Table ES-1
CONTAINER SYSTEMS EXAMINED FOR THE DELIVERY OF 1.000 GALLONS OF SOFT DRINKS
Container System Abbreviation
PET 16-02 PET Bottle IJ 1-L PET Bottle 1/ 2-L PET Bottle 1/ 3-L PET Bottle 1/
16-02 PET 1-L PET 2-L PET 3-L PET
Aluminum 12-02 Aluminum Can 12-02 A1
Glass 10-oz Nonrefillable
16-02 Nonrefillable
16-02 Refillable
1-L Nonrefillable
Glass Bottle 10-02 NR
Glass Bottle 16-02 NR
Glass Bottle 16-02 REF
Glass Bottle 1-L NR
Estimated Current Recycling Rate (percent)
20
50
10 3J
8 -trips
Number of Containers Required to Deliver 1,000 Gallons of Beverarre
8,000 3,785 1,893 1,262
PO, 667
12,800
8,000
8,000
3,785
Market Shares by Volume 2/ (percent)
100 0 5.7 4.3 83.2 6.8
100.0
100.0
6.1
41.5
50.8 &/
1.6
1 / T--l..d,%n L a t L A n a - nnrl t T . 7 A - m ; a m a m n n t n i n L a r c A/ J.LILCI&UUCZJ U U L L ~ U S A T - ~ . n v ~ A W U U WVIIIUIIIIL-.
- 2/
3J
Based on the National Soft Drink Association's figures and normalized for the containers included in this study (for detail see Table 4-1). Recovery of beer and soft drink containers alone is approximately 20 percent. However, these recovered containers may be manufactured into food containers, as well as beverage containers. Furthermore, recovered food containers may be manufactured into beverage containers. Thus, 10 percent represents the use of postconsumer material in all glass container production. This value is based on the 1986 National Soft Drink Association's Sales Survey. over the past decade. The soft drink industry estimates that refillable's current market share is between 25 and 30 percent.
- 4/ Market share for the refillable bottle has continued to decline
Source: Franklin Associates, Ltd.
1-4
FRANK1.N ASSOCIAES. T_TD.

.~ 1
'I "1 '1
' I .-
L1 I.- ' I
1 J
Total System Enerrrv Reauirements
The energy consumption associated with the use of PET, aluminum, and glass containers for the delivery of 1,000 gallons of soft drinks are reported in Table ES-2. This table illustrates the effect of recycling by presenting data for packaging system groups made entirely from virgin materials or recycled materials with increments in between. Values are presented for recycling rates of 0, 25, 50, 75, and 100 percent for current and projected years.
The energy data from Table ES-2 are presented graphically in Figures ES-1 through ES-5. Figure ES-1, ES-2, and ES-3 represent energy data for 1987, while Figures ES-4 and ES-5 are projections for 1990 and 1995, respectively.
The current recycling rates are estimated to be 20 percent for PET, 50 percent for aluminum, and 10 percent for nonrefillable glass (with refillable glass soft drink containers reporting an average of 8 trips or an 87.5 percent reuse rate). Figure ES-1 illustrates the energy efficiency of the individual containers at these current recycling rates. The containers can be ranked in order of energy to deliver 1,000 gallons at current recycling rates as follows:
1. 2. 3. 4. 5. 6 . 7. 8 . 9.
16-02 refillable glass bottle (15.4 million Btu) 3-L PET bottle (18.6 million Btu) 2-L PET bottle (18.9 million Btu) l-L PET bottle (25.5 million Btu) 16-02 PET bottle (31.6 million Btu) 12-02 aluminum can (32.9 million Btu) 16-02 nonrefillable glass bottle (34.8 million Btu) l-L nonrefillable glass bottle (36.7 million Btu) 10-02 nonrefillable glass bottle (41.7 million Btu)
The individual impacts illustrated in Figure ES- 1 were aggregated by container groups such as PET, aluminum, and glass according to market shares of individual containers. The container group results at current recycling rates are shown in Figure ES-2. containers as a group are the most energy efficient followed by glass containers and aluminum containers, respectively.
This illustration shows PET
The energy impacts for container groups are further illustrated in Figure ES-3 at various recycling rates. various recycling rates for each container group from 0 to 100 percent recycling. As Figure ES-3 illustrates, recycling beverage containers saves energy as well as material. energy consumption as the recycling rate increases.
This table shows the effects of
This trend can be seen by the steady decline in
Projections were made of Figure ES-3 to 1990 and 1995 based on projected container weights, trends in secondary packaging, and energy conservation by specific industries. This was accomplished by using current market shares (shown in Table ES-1) for those containers evaluated in this study. These projections are presented in Table ES-2 and Figures ES-4 and ES-5.
J 1-5
FRANKLIN ASSOCIATES, LTD.
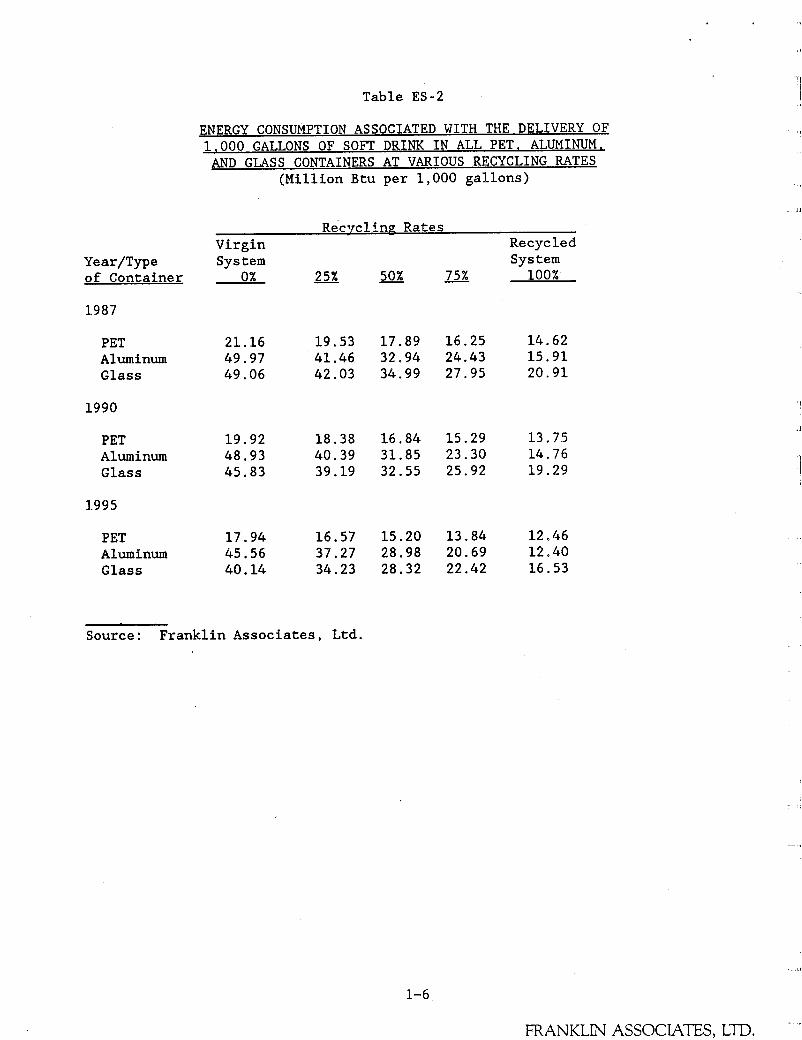
Table ES-2
Year/Type of Container
1987
PET Aluminum Glass
1990
PET Aluminum Glass
1995
PET Aluminum Glass
ENERGY CONSUMPTION ASSOCIATED WITH THE DELIVERY OF 1.000 GALLONS OF SOFT DRINK IN ALL PET. ALUMINUM, AND GLASS CONTAINERS AT VARIOUS RECYCLING RATES
(Million Btu per 1,000 gallons)
RecvcllnP Rates Virgin System
0%
21.16 49 .97 49 .06
1 9 . 9 2 4 8 . 9 3 45 .83
1 7 . 9 4 45 .56 40.14
- 25% - 50%
1 9 . 5 3 17 .89 41 .46 32 .94 42 .03 34 .99
1 8 . 3 8 1 6 . 8 4 40 .39 31 .85 39.19 32 .55
16 .57 1 5 . 2 0 37 .27 28 .98 34 .23 28.32
Source: Franklin Associates, Ltd.
1-6
Recycled System
- 75% 100%
1 6 . 2 5 1 4 . 6 2 24 .43 1 5 . 9 1 27 .95 2 0 . 9 1
1 5 . 2 9 13 .75 23 .30 1 4 . 7 6 25 .92 1 9 . 2 9
1 3 . 8 4 1 2 . 4 6 20 .69 1 2 40 22.42 1 6 . 5 3
11
1 1
FRANKLIN ASSOCIATES, LTD.

I ' 1 Figure ES-1. Energy consumption of container systems* at current
recvclinn rates, 1987
4 0 4 5 1 321 1
1 5
(million Btu 2 5 Energy
gallons) '1 1 3-L 0 16-02 I - L 2-L PET PET PET
12-02 10-02 16-02 16-02 I - L PET AL NR NR REF NR 7 ._ * For delivery of 1,000 gallons of soft drinks.
13 Figure ES-2. Energy consumption of container groups" at current
recvclina rates. 1987
1.1 35 T
Energy (million 2 0
1 5 Btu per 1,000
gal lo n s) 2 0
5 '"t 0 1 I
PET ALUMINUM GLASS* *
** The glass container group is based on 1986 market shares witn the refillable comprising 50.8 percent. It is estimated that the refillable's current market share is between 25 and 30 percent. The return rate for nonrefillable glass is estimated to be 10 percent and the trippage for refillable glass is estimated to be 8 (equivalent to an 87.5 percent reuse or return rate).
For delivery of 1,000 gallons of soft drink.
J J 1-7

Figure ES-3. Energy consumption of container groups' at various recvclincl rates, 1987
5 0
4 0
Energy 3 0
gallons) 2 0
(million Btu per 1,000
1 0
0 0 2 5 5 0 75 100 Recycling rates (%)
* For delivery of 1,000 gallons of soft drinks. ** The glass container group is based on 1986 market shares with the refillable comprising
50.8 percent. It is estimated that the refillable's current market share is between 25 and 30 percent.
C I Figure ES-4. Energy consumption of container groups' at various recvclincl rates. 1990
ALUMINUM KI 1 0 0 Recycling rates (%) 0 2 5 5 0 7 5
For delivery of 1,OOO gallons of soft drinks. All material groups are determined based on 1986 market shares.
I Figure ES-5. Energy consumption of container groups' at recvclino rates. 1995
4 0
ALUMINUM
Energy 30
gallons) 2 0
1 0
(million Btu per 1,000
0 0 25 5 0 75 1 00 Recycling rates (%)
For deli..wv of 1,000 gallons of soft drinks. All material groups are determined based on 1986 market shares.
1-8

Figures ES-3 to ES-5 illustrate that PET containers, as a group, use less energy in a cradle-to-grave analysis than either glass or aluminum at all recycling rates for current and projected years. energy includes not only the process or transportation energy, but also the energy within the raw materials such as crude oil or natural gas, that are the building blocks of PET containers. the group of PET containers are the most energy efficient.
As stated earlier, this
Therefore, with all energy accounted for,
Presenting the data at various recycling rates allows this report to be used for several years without becoming outdated should recycling conditions change. For example, Figure ES-4 allows PET containers to be compared under 1990 conditions at 25 percent recycling to aluminum at 50 or 75 percent recycling. efficient.
Even in this example, PET containers are more energy
Environmental Impacts
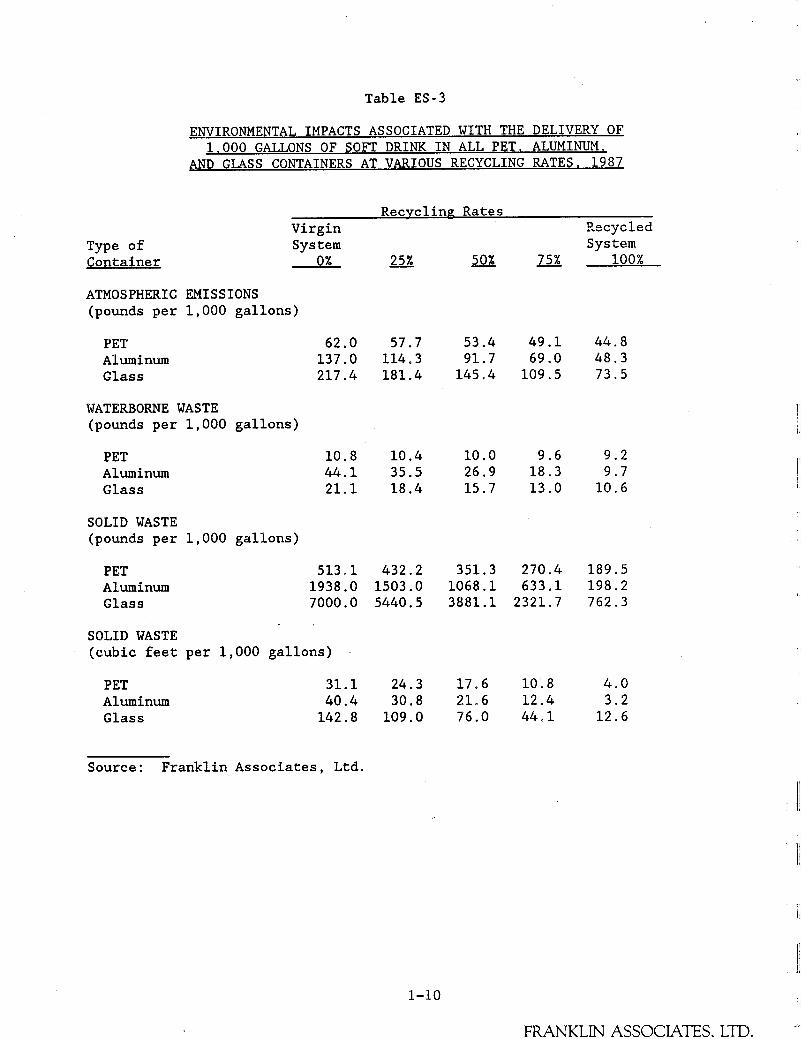
The environmental impacts are considered in three major categories: atmospheric, waterborne, and solid waste. It is not the intent of this study to emphasize one of these impacts over the others, because in a cradle-to-grave analysis each of these impacts is important and should be considered. As with the energy, the environmental impacts are shown for each individual container at current recycling rates and then for each group of containers at various recycling rates. Table ES-3 summarizes the environmental impacts for each container group at various recycling rates.
Atmospheric Emissions. The category of atmospheric emissions includes such components as particulates, sulfur oxides, carbon monoxide, nitrogen oxides, hydrocarbons, etc., after emission control devices are used. Wastes collected in these control devices are included in the solid waste category. Figure ES-6 illustrates the amount of atmospheric emissions for each container system for the delivery of 1,000 gallons of soft drinks at the current recycling rates. This figure sh~w.r: that the l . h - 0 ~ R-EF and 3-T; bottle produce the fewest emissions, while the three nonrefillable glass containers produce the greatest air emissions.
Figure ES-7 shows the effects of recycling on atmospheric emissions for the container groups. PET containers, as a group, produce the lowest emissions of any containers at any specific recycling rate. interesting to note that even at zero percent recycling, PET produces fewer air emissions than glass at 100 percent recycling.
It is
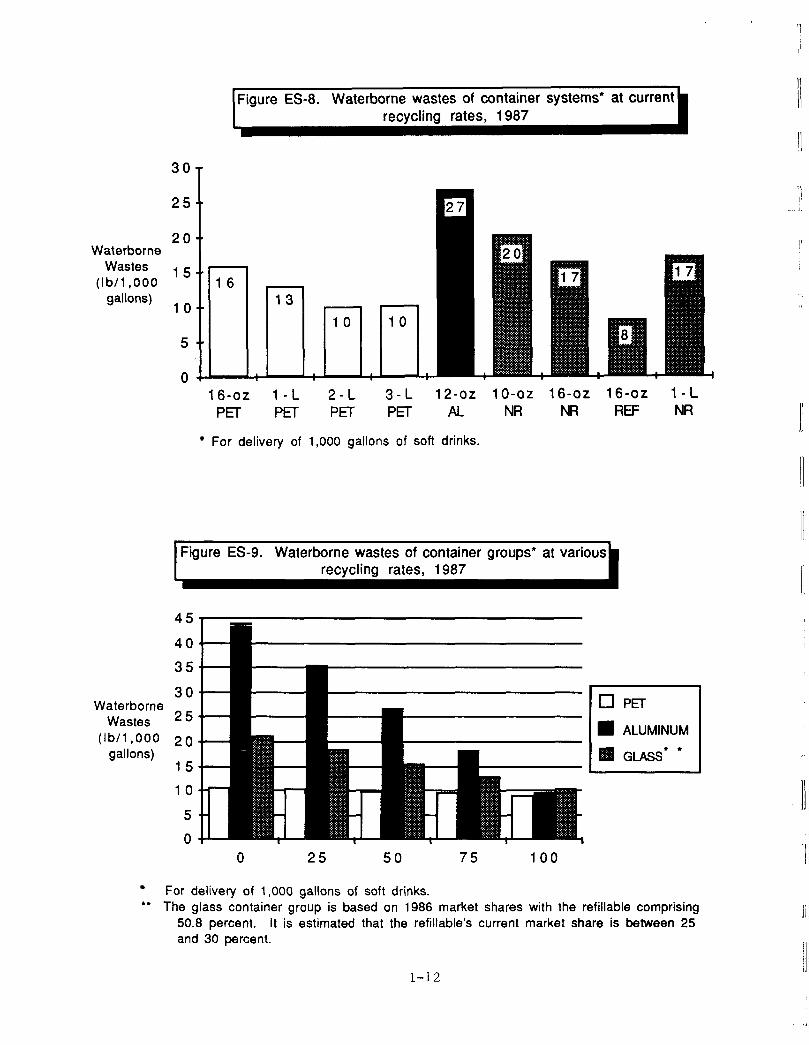
Waterborne Waste. Waterborne waste or water pollutants include those emissions discharged to a body of water or sewer system after wastewater treatment. The sludges from wastewater treatment systems are included in the solid waste category. Typical waterborne wastes include total suspended solids (TSS), total dissolved solids (TDS), biological oxygen demand (BOD), chemical oxygen demand (COD), chlorides, fluorides, iron, ,etc. Figure ES-8 illustrates the amount of waterborne waste for the delivery of 1,000 gallons of beverage. This figure shows that the 16-oz REF glass bottle produces the least waterborne wastes, while the 12-oz aluminum can produces the most. In general, all four of the PET containers produce the lowest amount of waterborne waste.
1-9
FRANKT TN ASSOCTATFS T T n
Type of Container
Table ES-3
ENVIRONMENTAL IMPACTS ASSOCIATED WITH THE DELIVERY OF 1.000 GALLONS OF SOFT DRINK IN ALL PET. ALUMINUM,
AND GLASS CONTAINERS AT VARIOUS RECYCLING RATES. 1987
ATMOSPHERIC EMISSIONS (pounds per 1,000 gallons)
Recycling Rates Virgin Eecyclec! System System
25% - 50% - 75% 100% 0% -
PET Aluminum Glass
WATERBORNE WASTE (pounds per 1,000 gallons)
PET Aluminum Glass
SOLID WASTE (pounds per 1,000 gallons)
PET Aluminum Glass
62.0 57.7 53.4 49.1 44.8 137.0 114.3 91.7 69.0 48.3 217.4 181.4 145.4 109.5 73.5
10.8 10.4 10.0 9.6 9.2 44.1 35.5 26.9 18.3 9.7 21.1 18.4 15.7 13.0 10.6
SOLID WASTE (cubic feet per 1,000 gallons)
PET Aluminum Glass
31.1 24.3 17.6 10.8 4.0 40.4 30.8 21.6 12.4 3.2 142.8 109.0 76.0 44.1 12.6
Source: Franklin Associates, Ltd.
1-10
FR ANKT .TN ASSOCIATES. 1.373.

Figure ES-6. Atmospheric emissions of container systems* at current recycling rates, 1987
1 1
2 0 0
1 1 6 0
Atmospheric 1 20
gallons) 8 0
Emissions ( l b / l , O O O 4 1 1
4 0
0 16-02 I - L 2 - L 3 - L 12-02 10-02 16-OZ 16-02 1 - L PFT PET PET PET AL NR NR REF NR
'For delivery of 1,000 gallons of soft drinks. ' I
I Figure ES-7. Atmospheric emissions of container groups* at variousb
I I 1 I recvclina rates, 1987 I
1 1 200
1 5 0
100
5 0
0
Atmospheric Emissions ( I b / l , O O O
gallons) '1 d
0 2 5 5 0 7 5 1 0 0 Recycling rates ("10)
** For delivery of 1,000 gallons of soft drinks. The glass container group is based on 1986 market shares with the refillable comprising
It is estimated that the refillable's current market share is between 25 50.8 percent. and 30 percent.
1-11
! !
30
2 0 Waterborne
Wastes (Ib/l,OOO
gallons)
5
5 0 (I I Figure ES-8. Waterborne wastes of container systems' at current I recycling rates, 1987 I
16-02 l - L 2 - L 3 - L 12-02 10-02 16-02 16-02 l - L PET PET PET PET AL NR M1 REF NR
For delivery of 1,000 gallons of soft drinks.
Figure ES-9. Waterborne wastes of container groups' at various recvclina rates. 1987
4 5
4 0
35 30
Wastes 2 5 Waterborne
( lb /1 ,000 2 0
1 5 gallons)
a m ALUMINUM
GLASS' '
1 0
5
0 0 2 5 5 0 7 5 1 0 0
+* For delivery of 1,000 gallons of soft drinks. The glass container group is based on 1986 market shares with the refillable comprising
It is estimated that the refillable's current market share is between 25 50.8 percent. and 30 percent.
I1
I/ 1-12
-I
1
II
II ' I
.1 I " I
J
Figure ES-9 shows how recycling impacts the amount of waterborne waste for container groups. This figure shows that aluminum containers produce more waterborne waste than PET or glass except at very high recycling rates (greater than 8 5 percent). PET containers, as a group, produce the lowest waterborne waste except at very high recycling rates, where all three materials are approximately equal in the amount of waste generated.
Solid Waste. The category of solid waste includes industrial solid waste generated through individual steps in the manufacture of containers and packaging, as well as postconsumer solid waste. Postconsumer solid waste is typically where the most emphasis is focused; however, in an over a l l analysis such as this study all solid waste is considered. The solid waste is represented by both weight and volume, because many people argue that weight data for landfill considerations are not as relevant as volume.
Figure ES-10 illustrates the weight of solid waste generated by each container for the delivery of 1,000 gallons of beverage. This figure shows that at current recycling rates all four PET containers produce less solid waste by weight than any of the other containers. nonrefillable glass containers produce the greatest amount. further illustrates the fact that PET containers produce the least amount of solid waste by weight of any of the containers at various recycling rates.
Not surprisingly, the Figure ES-11
On a volume basis the results are somewhat different. Figure ES-12 illustrates the generation of solid waste for each container on a volume basis. its current recycling rate. This is followed by the 2-L and 3 - L PET containers and the 16-02 REF bottle. produce the greatest amounts of solid waste by volume.
The 12-02 aluminum can produces the lowest volume of solid waste at
The nonrefillable glass containers
Figure ES-13 shows the effect of recycling on the volume of solid waste generation for container groups. This figure illustrates that PET containers produce the smallest volume of solid waste at most recycling rates. PET 'is closely followed by aluminum and at very high recycling rates the difference is negligible. solid waste by volume of any of the container groups, at any recycling rate.
Glass containers produce the largest amount of
Thus far the energy and environmental impacts have been focused on individually. conclusions from the study. conclusions from both the energy and environmental impacts for the delivery of 1,000 gallons of beverage.
The next step is to highlight the primary results or The following section describes the major
1-13
FRANKLIN ASSOCIATES, LTD.

, Figure ES-10. Weight of solid waste of container systems* at current
recycling rates, 1987 -
6 ,000 T
5 , 0 0 0 * -
4 ,000 Solid Waste (Ib/l,OOO 3 , 0 0 0 gal Ions)
2 ,000
El 1 ,000
0
-. - - - -
5 9 2 n 1 0 6 8
4 1 5 n 4 0 3 a +
5 2 7 3
+
4 9 1 6 4 3 4 7
-t
1505
-I -I + 16-02 1 - L 2-L 3 - L 12-02 10-02 16-02 16-02 1 - L
NR REF NR PET PET PET PET AL NR
For delivery of 1,000 gallons of soft drinks.
Figure ES-11. Weight of solid waste of container groups* at various recvclina rates. 1987
Solid Waste (Ib/l,OOO
gallons)
7,000
6 ,000
5 ,000
4 , 0 0 0
3 ,000
2 ,000
1 ,000
0
0 PET
ALUMINUM
GLASS*
0 2 5 5 0 7 5 1 0 0 Recycling rates (%)
** For delivery of 1,000 gallons of soft drinks. The glass container group is based on 1986 market shares with the refillable comprising
50.8 percent. It is estimated that the refillable's current market share is between 25 and 30 percent.
1-14
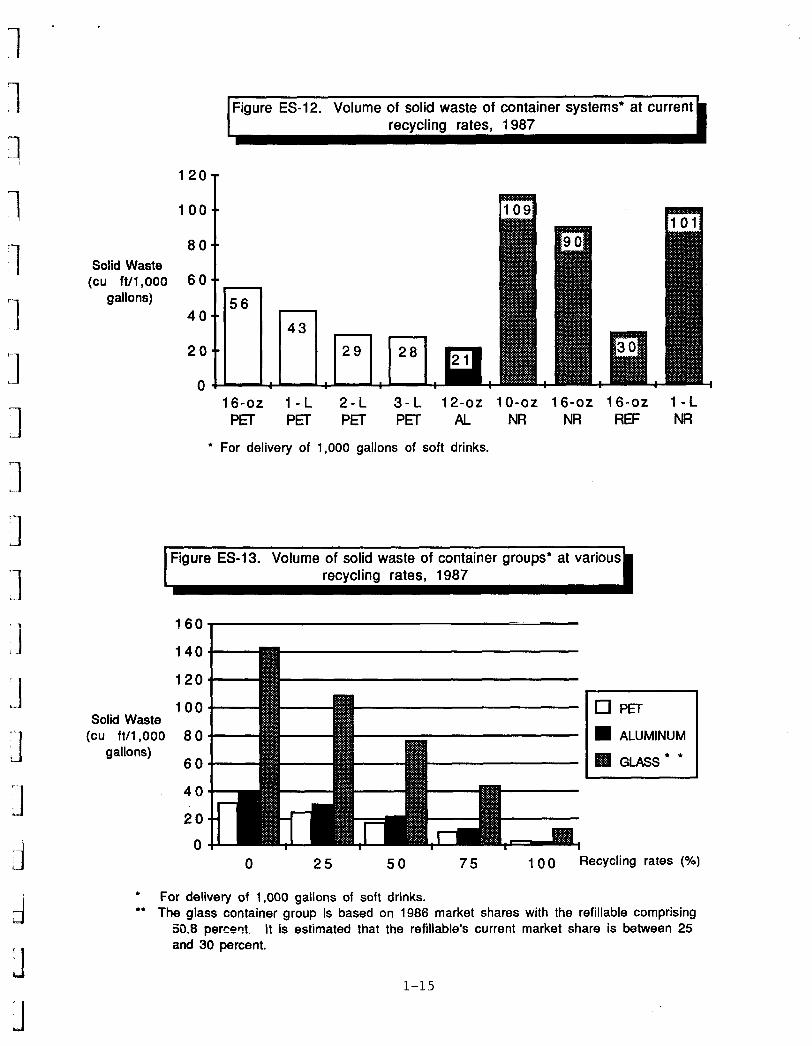
Figure ES-12. Volume of solid waste of container systems* at current recvclina rates, 1987
lPO1 1 0 0
16-02 I - L 2 - L 3-L PET PET PET PET
12-02 10-02 1 6 - O Z 16-02 I - L AL NR NR REF NR
* For delivery of 1,000 gallons of soft drinks.
Figure ES-13. Volume of solid waste of container groups' at various I recvclina rates. 1987
Solid Waste (cu ft/1,000
gallons)
160
1 4 0
120
1 0 0
8 0
6 0
4 0
2 0
0 8 I I 8 8 I
0 PET
ALUMINUM
GLASS* *
0 2 5 5 0 7 5 1 0 0 Recycling rates (%)
* **
For delivery of 1,000 gallons of soft drinks. The glass container group is based on 1986 market shares with the refillable comprising
50.8 percent, It is estimated that the refillable's current market share is between 25 and 30 percent.
1-15

CONCLUSIONS
Several conclusions can be drawn from the comparison of the nine beverage containers contained in this study.
1. The nine beverage containers examined in this study can be ranked in the following order from most to least energy efficient at current recycling rates:
1. 16-oz refillable glass bottle 2. 3-L PET bottle 3. 2-L PET bottle 4 . l-L PET bottle 5. 16-02 PET bottle 6. 12-02 aluminum can 7. 16-oz nonrefillable bottle 8. l-L nonrefillable bottle 9. 10-oz nonrefillable bottle.
2. As a group, PET containers are 25 percent more energy efficient than glass containers and 65 percent more efficient than aluminum containers at the current recycling rates for the delivery of equivalent volumes.
3. The group of PET containers is the most energy efficient when compared to the group of aluminum or glass containers at all recycling rates and are projected to remain so through 1995.
Environmental
1. At current recycling rates the atmospheric emissions and waterborne wastes for the 16-oz refillable bottle, the '3-L PET bottle, and the 2-L PET bottle are the least of all the containers examined.
2. PET containers contribute the least atmospheric emissions and waterborne wastes of the three container groups (PET, aluminum, and glass) for the delivery of equivalent volumes of soft drinks at all recycling rates.
3. On an individual container basis, the four PET containers contributed the least amount of solid waste by weight at the current recycling rates.
4 . As a group, PET containers contribute the smallest amount of solid waste by weight at all recycling rates.
5. Of the nine containers examined, the 12-oz aluminum can is the lowest contributor of solid waste by volume at the current recycling rates.
6. PET containers contribute the least amount of solid waste by volume of the three container groups at virtually all recycling rates. It is closely followed by aluminum which surpasses PET at very high recycling rates
1-16
FRANKLIN ASSOCIATES, LTD. u
n 1
Chapter 2
STUDY APPROACH AND METHODOLOGY ,
BACKGROUND
II '1 1 .
I1 ' "1 .I
.. 1
3 I)
Since the early 1970s "energy and environmental awareness" among industry, government, and the general public has grown significantly. Several domestic and international events have increased the awareness of these issues, such as long- and short-term energy shortages, the Mobro "garbage barge," and the costs or economics associated with both energy and environmental issues. It is important for all those interested (government officials, industry, and citizens) to consider the entire "cradle-to-grave" analysis in the delivery of soft drinks or any material or product.
For this reason a resource and environmental profile analysis such as this study is necessary. In this study the entire "cradle-to-grave" analysis is performed for the delivery of soft drinks. The unique feature of this type of analysis is that the focus is on the total system, not on a single manufacturing step nor on a single environmental emission. the beverage container is viewed as a system which begins with the extraction or mining of raw materials from the earth, processing of these raw materials into usable components, manufacturing the package materials, bottling or filling, distribution of the packaged soft drink, soft drink consumption, and final disposition (whether recycled, reused, or disposed) of the package.
Instead,
A generalized materials flow diagram is shown in Figure 2-1. Each box in this figure represents many steps within any package system. The components of any step can be presented in terms of resources and environmental impacts. Resources are expressed in terms of materials and process or transportation energy. Environmental impacts are expressed in the form of air emissions, solid waste, or waterborne waste.
Franklin Associates is uniquely qualified to perform such an These analysis, having worked on similar studies since the early 1970s.
analyses have been performed domestically as well as internationally. The studies have been prepared for numerous clients including the U.S. Environmental Protection Agency, Federal Energy Administration, National Science Foundation, The Aluminum Association, Society of the Plastics Industry, and various private clients in the paper, plastics, food, and beverage industries.
PURPOSE
The purpose of this study is to thoroughly assess the energy and environmental impacts through a "cradle-to-grave" analysis for the delivery of soft drink in the most typical packages currently used. The major objective is to compare total system energy and environmental impacts for each packaging system for 1990 and 1995. components, including the container and any secondary packaging such as paperboard wraps, closures, labels, etc. In addition, the filling, distribution, and ultimate disposition (recycled or disposal) of packaging wastes are also considered part of a total packaging system.
A packaging system is defined as all packaging
2- 1
FRANKLIN ASSOCIATES, LTD.

>r F I Lu
)r P I Lu
L s
44
2-2

n [1
ri -1
I n
An important aspect of this study is the effort which is put into maintaining objectivity. This is accomplished by thoroughly updating industrial data for all packaging systems, rather than concentrating only on the changes in some industries.
The study is also useful for several other reasons: the effects of recycling; describing the historical, existing: and projected trends in the beverage industry; and effectively presenting a total impact analysis of various packaging systems utilized by the soft drink industry.
illustrating
METHODOLOGY
The following section describes the methodology that was used in preparing the cradle-to-grave analysis of soft drink containers. processes and subprocesses were first considered to be separate, independent systems. For each system a standard unit, such as 1,000 pounds of output, was used as a basis for calculations. A complete materials balance was first determined. If marketable coproducts or byproducts were produced, the materials inputs were adjusted to reflect only the input attributable to the output product being considered. The wastes and energy were adjusted also.
All
Once the detailed material balance and energy information had been determined for 1,000 pounds of output from each subprocess, a master flow chart was established for the manufacture of containers. yield rates, the output of each subprocess necessary to produce 1,000 pounds of finished containers was determined. Summary tables for the manufacture of 1,000 pounds of containers were then constructed. (Details of calculations, summary tables, and data sources are included in the Appendices.)
Using known process
For purposes of comparing the container systems, another adjustment of the raw numbers was necessary. containers (their ultimate utility) depend not on the number of pounds of containers, bat oii the w i h r of units necessary to deiiver a given quantity of the beverage to the consumer. Hence, the values based on container weight were converted so that containers were considered on a unit-by-unit basis. A standard unit of 1,000 gallons of beverage delivered to the consumer was selected as the unit of comparison.
The purchase and consumption of
Using this systems approach: energy and environmental impacts were calculated for each of the nine soft drink container systems in 1987. projections for 1990 and 1995 were developed by making adjustments for container lightweighting and projected industry conservation.
The
For each year and container type, impacts were calculated for "virgin" and "recycled" systems. A "virgin" system means that containers are manufactured from virgin raw materials, and a "recycled" system means containers are manufactured from recovered used container material. Of course, totally recycled systems do not and cannot exist because of material losses in handling and processing and due to material quality specifications; however, the development of these hypothetical systems is necessary to calculate the energy requirements for realistic recycling rates.
2-3
I I
11 From the virgin and recycling system results, the energy
requirements for any recycling rate can be calculated by extrapolation between the end-points of the curve represented by the virgin and recycled data. At very high recycling rates (above 90 percent) the curves may be less valid.
SELECTED SOFT DRINK PACKAGING SYSTEMS
The most common types and sizes of soft drink containers were analyzed in this study. These containers icclude:
The e nin
1. 3-liter PET bottle (one- and two-piece containers) 2. 2-liter PET bottle (one- and two-piece containers) 3. 1-liter PET bottle (one- and two-piece containers) 4. 16-ounce PET bottle (one- and two-piece containers) 5. 12-ounce aluminum can 6 . 10-ounce nonrefillable glass bottle 7. 16-ounce refillable glass bottle 8 . 16-ounce nonrefillable glass bottle 9. 1-liter nonrefillable glass bottle.
containers make up approximately 97 percent of the total p . ~- kaged soft drinks by volume. represented for each container group or type of material (PET, aluminum, and glass).
Approximately 94 percent of the sales by volume is
DATA SOURCES
Over the past 15 years, several studies have been carried out which examined comparative impacts of beverage delivery systems. much of the basic industry descriptions, raw material requirements, and container system components point. However, revising or updating the data is always necessary. The primary soiirccs for these revisiGns 2rs t P _ C k r ? i C d literature, government publications, published industry statistics, and personal interviews with industry representatives.
Therefore,
from previous studies were used as a starting
In this report Franklin Associates, Ltd. is usually shown as the source of information for the summarized comparative results. In most cases, a single summary table may have been developed from raw industrial data obtained from 100 or more specific sources. this report presents all of the basic industrial data and each specific source.
The comprehensive Appendix of
Energy projections for 1990 and 1995 were based on actual conditions reported by industry to the U.S. Department of Energy (DOE). Since 1972 DOE has prepared annual reports to Congress and the President on industrial energy conservation. These reports qualitatively assess the potential for increased energy efficiency improvements in most of the industries which comprise the packaging systems. used to project fuel use and types to generate electricity through 1995; to calculate and project the fuel consumption associated with transport modes; and to calculate the current and projected energy required to extract, process, and transport fuels prior to their consumption by industry.
Annual DOE reports were also
2-4
FRANKLIN ASSOCIATES, LTD.
IMPACTS EXAMINED
Enerev
Energy requirements for each industrial process are first quantified in terms of fuel or power units such as gallons of distillate oil, cubic feet of natural gas, kilowatt-hours (kwh) of electricity, etc. Transportation requirements were developed in the conventional units of "ton- miles" by each transport mode (e. g. , truck, rail, barge, etc. ) , and then converted to fuel units depending on the average efficiency of each mode. Fuel and power units are then converted to Btu using conversion factors which account not only for the energy content of the fuels, but also the energy required to extract, transport, and process the fuels before they are used by industry. For electricity, precombustion energy also adjusts for the average efficiency of steam turbines used to generate power and transmission losses in power lines.
The converted Btu values for the fuel and power consumed by each industrial process (and then summarized system data) are categorized according to the six basic energy sources listed below:
- Natural gas - Petroleum - Coal - Hydropower - Nuclear - Wood (self-generated power in pulp mills). In addition to fuel and power consumption, these packaging systems
consume energy as a material resource. For example, petroleum- and natural gas-based hydrocarbons serve as the raw material feedstock to manufacture plastics. Other materials such as crude oil or coal in the form of coke are
energy impacts of each container, the energy content of the basic hydrocarbon feedstocks was included. content of the material feedstock is at least partially conserved.
used in the mi;rk.dfaepdre of zl-~ziiL-Gz steel. m- - - ~ - - - . I - L - ~ 1 - - ----.I - - - - - - IU L ~ L L U L ~ L ~ ~ i t : ~ w i d ~ sy s i em
If the container material is recycled, the energy
Environmental
The environmental impacts include wastes in the form of air emissions, solid waste, and waterborne waste. For all processes it is assumed that industries are meeting the guidelines or standards specified by the U.S. Environmental Protection Agency. where and what wastes are generated through a cradle-to-grave analysis. attempt is made to describe what the effects from these wastes may be. other words, no attempt has been made to determine the relative environmental effects of these pollutants.
The scope of this analysis is to identify No In
AtmosDheric Emissions. These emissions include all substances classified as pollutants, per unit of product output. The amounts reported represent actual discharges into the atmosphere after existing emission controls devices. emission standards.
It was assumed that all processes are meeting current air
2- 5

Solid Wastes. This category includes solid waste generated from all sources, that is, landfilled or disposed in some other way, but not recycled. industrial solid waste generated during the manufacture of a product. For example, industrial solid waste includes wastewater treatment sludges, solids resulting from air pollution control devices, trim or waste materials from manufacturing operations that are not recycled, fuel combustion residues, such as the ash generated by burning coal or wood, and mining or extraction waste. These mining wastes include materials discarded due to raw ore processing and do not include overburden removed to uncover the raw ore. Postconsumer solid waste refers to the container and its secondary/tertiary packaging discarded into the municipal waste stream.
Too often people consider only postconsumer waste and not
Waterborne Wastes. These wastes include all substances classified as pollutants per unit of product output. still present in the waste stream after wastewater treatment---represent discharges into receiving waters. effluent guideline standards. reported waterborne wastes: biological oxygen demand (BOD), chemical oxygen demand (COD), suspended solids, dissolved solids, oil and grease, sulfides, iron, chromium, tin, metal ions, cyanide, fluorides, phenol, phosphates, and ammonia.
The effluent values--those amounts
All processes are assumed to be meeting The following are some of the most commonly
ASSUMPTIONS
Some assumptions are always necessary to limit a study to a reasonable scope, and it is important to know what assumptions have been made. The principal assumptions and limitations for this study are discussed in the following sections. presented throughout the Appendices; many of these assumptions have been verified through the numerous clients for whom this study has been performed.
Many more minor assumptions that also were required are
Data Sources
The primary data sources utilized in this study were discussed in When data are obtained from many sources, a previous section of this chapter.
it is important to critically review the sources and content of the information prior to using it. basis for data evaluation to determine the reasonableness of content. For this study, Franklin Associates has assumed that the data used are both accurate and representative of typical conditions for each industry.
In some cases, past experience provided a
GeograDhic - Scope
Impacts associated with imported materials are included. cases, it was assumed that foreign impacts would be similar to comparable activities in the U.S.; thus U.S. data were applied to foreign operations. For instance, iron ore mined in Canada was assumed to produce the same impacts on a 1,000 pound basis as domestic iron ore.
In most
2-6
I 1
I1 II
FRANKT TN ACSOC-TATS im
I Secondarv ImDacts or Precombustion Enemy
1 1 7 -1 11 7 -1 L -1 :J
c- ‘1 ..I J
“7 . LJ
3
I
The energy content of fuels was assumed to include the energy requirements for extraction, processing, and transporting of fuels, in addition to the primary energy of a fuel resulting from its combustion. this study, that additional energy is called precombustion energy; it refers to all the energy that must be expended to prepare and deliver the primary fuel.
In
Insienificant Impacts
The impacts associated with insignificant packaging system components are not included in the comparative results. These insignificant components are briefly discussed below.
CaDital Eauiument. The energy impacts associated with the manufacture of the capital equipment used in beverage distribution systems were not included. This includes equipment to manufacture buildings, motor vehicles, and industrial machinery. The impacts for such capital equipment become negligible with respect to a 1,000-pound or 1,000-gallon system.
SDace Conditioning. The fuels and power consumed to heat, cool, and light manufacturing establishments were omitted from the calculations in most cases. Only for beverage filling plants were these energy requirements deliberately accounted for. For most industries, space conditioning energy is quite low compared to process energy. usually comprises less than one percent of total consumption for the basic materials industries such as aluminum, steel, and glass. In general, the closer one gets to the final product, which is filled containers, the more significant space conditioning becomes.
Energy consumed for space conditioning
Electricitv
For most industries, electricity is a minor source of energy, and detailed data do not exist on the fuels used to generate the power consumed by each industry. Therefore, the national average fuel consumption by the electrical utilities was used for most industries. However, the aluminum industry is based on electro-chemical processes and is, therefore, relatively electricity-intensive. to specific electric power sources (e.g., hydropower). Statistics compiled by the Aluminum Association provide a basis for estimating the fuels consumed to generate the electricity consumed by the aluminum industry. These data, which distinguish between self-generated and purchased power use, were used for this study .
Aluminum smelting plants are generally located close
Enernv Content of Material Resources
As previously described, the primary material resources for plastic products are natural gas and petroleum, as well as aluminum and steel use coke derived from coal or crude oil. The principal use of these materials in this country is as fuels. Thus, the total energy requirements for these plastic, aluminum, and steel products is calculated as the energy value of the fuels used as materials, plus the fuels used in the manufacturing processes.
2- 7
FRANKLIN ASSOCIATES, LTD.

II 11
Consumer ImDacts
Impacts related to consumer activities such as transporting a beverage home from the retail store were not included in this study. assumed that trips to retail stores are necessary for other reasons, and should not be attributed solely to the beverage systems. required to operate refrigerators in the home is not included, since a number of other foods and beverages are stored in the refrigerators.
It was
Similarly, energy
Home Market
In beverage industry terms, the comparative results presented in Although several of the selected this report represent the "home market."
containers can be vended or sold cold in convenience stores, the energy required for refrigerating is not included. would be similar for all containers and would not provide additional value to this comparative analysis.
These "cold drink" market impacts
Recvc 1 ing
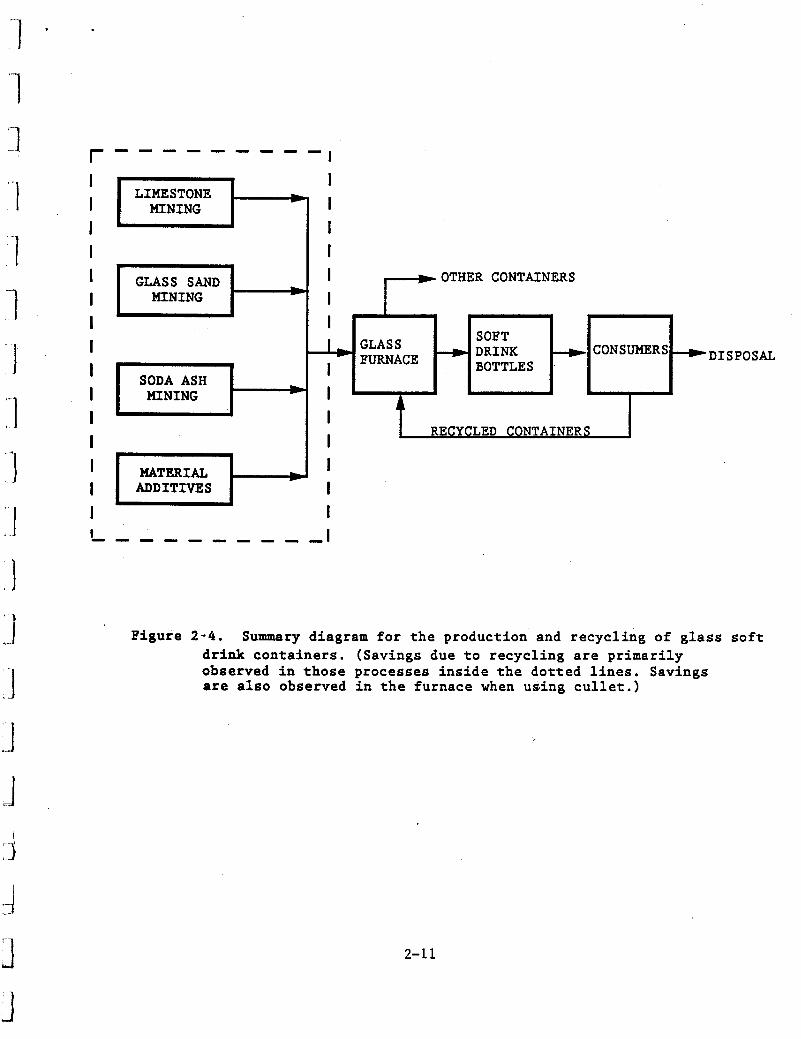
The recycling of beverage containers is similar, yet different for the three types of materials analyzed in this study. Figures 2-2, 2-3, and 2 - 4 summarize the processes necessary to manufacture PET, aluminum, and glass. These figures also illustrate where in this system recycled soft drink containers may be reintroduced. observed in those processes within the dotted lines,
Savings of materials and energy are primarily
These diagrams take into account the fact some recycled materials may leave the system because they are recycled into products other than new soft drink containers. Even aluminum exhibits some characteristics of open- loop recycling. For example, a small percentage of aluminum soft drink cans (less than 5 percent) are recycled into other products. Examples from both glass and PET can illustrate this point. Recycled glass soft drink bottles can be added to the furnace thereby saving raw materials from being utilized and saving energy through lower furnace temperatures. The glass soft drink bottles can be made into food containers which are outside the soft drink container system. However, the glass food containers may be and currently are recycled back into beverage containers. currently the majority of recycled PET is manufactured into fiber used for a variety of purposes. production of fiber, and like the example for glass, is no longer within the soft drink container system. The difference, however, is in the fact that postconsumer fiber is not currently recycled, or more specifically, recycled back into beverage containers. The PET bottle can be compared to a 2-trip Container (or, in other words, a container with a 50 percent recycling rate). In this example the first use is as a container, and the second use is a fiber. Therefore in this analysis, a 50 percent savings is attributed to the PET resin manufacture for recycling PET. The areas for these savings for PET and the other materials are illustrated in Figures 2-2 through 2 - 4 .
PET is another example where
This recycling saves raw materials and energy for the
2- 8
FRANKLIN ASSOCIATES LTD.

N I
- - - - - - - - - - - - - - - - - - - DISTILLATION, DESALTING, b HYDROTREATING P-XYLENE EXTRACTION
I - I I I I I I I I I I
DISPOSAL FIBER AND
I
I I
1 OTHER USES .
MANUFACTURE I I A
L
I *
I PRODUCTION * MANUFAC'IURE I
I I
I PET RESIN
MANUFACTURE
- c-- TPA MANUFACTURE
METHANOL DMT - L
t - - - - - - > .
POTENTIAL FUTUI
ACETIC ACID PRODUCTION n--1 j I
~
PRODUCTION
I I I I I
ETHYLENE I I PRODUCTION & I PRoDuc~~-*
PROCESSING I I 1 I
A I
RESIN MANUFACTURE
- - - A RECYCLING
I BASECUPS
Figure 2 - 2 . Summary diagram f o r t h e production and r e c y c l i n g o f PET s o f t drink c o n t a i n e r s . ( S a v i n g s due t o r e c y c l i n g a r e observed i n t h o s e p r o c e s s e s i n s i d e t h e d o t t e d l i n e s . )

I I
I I I I I I I I I I I I
i
I I I
tt
I .
I 0 0: V I
I I I I I I I I
- - - - I
al c 6,
al 71 7-1 w C 7-1
A d m + a " m
a m al
9 0 4-10 O & w a H a J 7 w c o
1 d C r d 7 - 1
* a
4 5
W L! 7 00 7-1 rS4
11
2-10
r I I I I I I I I 1 I I I I I I
b
MINING
L
GLASS SAND MINING
- 1 I I I )OTHER CONTAINERS
* I
SOFT I
' DISPOSAL GLASS DRINK FURNACE - BOTTLES I SODA ASH
Figure 2 - 4 . Summary diagram for the production and recycling of g las s s o f t dr ink containers. (Savings due t o recycling are primarily observed i n those processes inside the dotted l i n e s . Savings are a l s o observed i n the furnace when using c u l l e t . )
CONSUMERS-
2-1 1
MINING W I I
RECYCLED CONTAINERS

. ..
I -- / I
_- .I
. ..
. ..
Chapter 3
DETAILED STUDY RESULTS AND ANALYSIS
INTRODUCTION
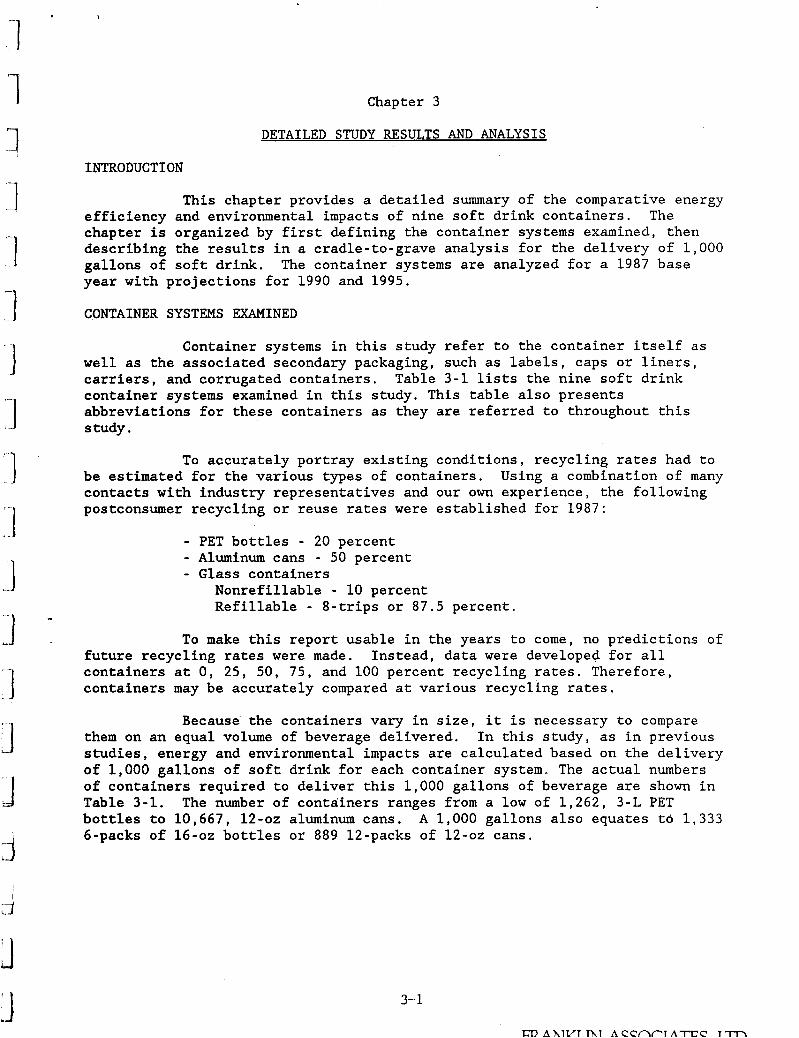
This chapter provides a detailed summary of the comparative energy efficiency and environmental impacts of nine soft drink containers. chapter is organized by first defining the container systems examined, then describing the results in a cradle-to-grave analysis for the delivery of 1,000 gallons of soft drink. year with projections for 1990 and 1995.
The
The container systems are analyzed for a 1987 base
CONTAINER SYSTEMS EXAMINED
Container systems in this study refer to the container itself as well as the associated secondary packaging, such as labels, caps or liners, carriers, and corrugated containers. container systems examined in this study. This table also presents abbreviations for these containers as they are referred to throughout this study .
Table 3-1 lists the nine soft drink
To accurately portray existing conditions, recycling rates had to be estimated for the various types of containers. contacts with industry representatives and our own experience, the following postconsumer recycling or reuse rates were established for 1987:
Using a combination of many
- PET bottles - 20 percent - Aluminum cans - 50 percent - Glass containers
Nonrefillable - 10 percent Refillable - 8-trips or 87.5 percent.
To make this report usable in the years to come, no predictions of future recycling rates were made. containers at 0, 25, 50, 75, and 100 percent recycling rates. Therefore, containers may be accurately compared at various recycling rates.
Instead, data were developed for all
Because the containers vary in size, it is necessary to compare them on an equal volume of beverage delivered. In this study, as in previous studies, energy and environmental impacts are calculated based on the delivery of 1,000 gallons of soft drink for each container system. The actual numbers of containers required to deliver this 1,000 gallons of beverage are shown in Table 3-1. The number of containers ranges from a low of 1,262, 3-L PET bottles to 10,667, 12-02 aluminum cans. A 1,000 gallons also equates to 1,333 6-packs of 16-oz bottles or 889 12-packs of 12-02 cans.
3- 1

Table 3-1
CONTAINER SYSTEMS EXAMINED FOR THE DELIVERY OF 1.000 GALLONS OF SOFT DRINKS
Number of Estimated Containers Current Required Market Recycling to Deliver Shares by Rate 1,000 Gallons Volume 2/
Container Svstem Abbreviation (percent) of Beverage (percent
PET 20 100.0 16-oz PET Bottle 1/ 16-oz PET 8,000 5.7 l-L PET Bottle 1/ l-L PET 3,785 4.3 2-L PET Bottle L/ 2-L PET 1,893 83.2 3-L PET Bottle lJ 3-L PET 1,262 6.8
Aluminum 50 100 e 0 12-oz Aluminum Can 12-02 A1 10,667
Glass 10 100.0
Glass Bottle 10-oz NR 12,800 6.1
Glass Bottle l6-oz NR 8,000 41.5
Glass Bottle 16-oz REF 8-trips 8,000 50.8 &/
Glass Bottle l-L NR 3,785 1.6
10-oz nonrefillable
16-oz nonrefillable
16-oz Refillable
l-L nonrefillable
3 I T-- &/ r1lc;:Udes both oiie- a d "piece cmtainers. Based on the 1986 National Soft Drink Association's figures and normalized for the containers included in this study (for detail see Table 3-2). Recovery of beer and soft drink containers alone is approximately 20 percent. However, these recovered containers may be manufactured into food containers, as well as beverage containers. Furthermore, recovered food containers may be manufactured into beverage containers. Thus, 10 percent represents the use of postconsumer material in all glass container production. This value is based on the 1986 National Soft Drink Association's Sales Survey. over the past decade. refillable's current market share is between 25 and 30 percent.
- 4 / Market share for the refillable bottle has continued to decline
The soft drink industry estimates that
Source: Franklin Associates, Ltd.
3- 2
FR ANKT .pN ASSOCTATES. T 773.

1
I
-1
'-1 ...
. ' 1 ,.
'1 L
To summarize the data for the Executive Summary, cumulative results were developed for each material. These cumulative results were developed by multiplying the individual container data by its market share in the soft drink industry. Therefore, instead of comparing nine containers in one figure, only three groups or categories (PET, aluminum, and glass) were necessary.
Using cumulative results in this manner is accurate only if each container group is sufficiently represented by the individual containers examined. As illustrated in Table 3 - 2 , this criterion is met. Table 3 - 2 shows that the nine containers evaluated in this study comprise 97 percent of all packaged soft drink sales by volume. For each container group (e.g., PET, aluminum, or glass), the individual containers in this study comprise a majority of the market. For example, the containers in this study comprise 100 percent of the PET market, 98 percent of the aluminum market, and 94 percent of the glass market. necessary to normalize the values to 100 percent.
To use these market shares in this study, it was
The first step in the analysis and data gathering was establishing accurate weights for the containers and packaging. Table 3 - 3 lists the container weights for 1987, 1990, and 1995. Because industry representatives refer to containers in both ounces and grams, each is presented in this table. The weights listed in this table are for individual containers; they range from 0.584 ounces for an aluminum can to 18 ounces for a 1-L NR glass bottle in the 1987 base year. Table 3 - 3 also illustrates the lightweighting predicted f o r the containers in the next seven years. The glass industry is reporting the most substantial plans for further lightweighting their containers. For example, the 16-02 REF is predicted to decrease in weight 33 percent by 1995. It is interesting that this lightweighting is being planned for a container that many industry representatives believe is slowly losing its market. In general, all the container weights are predicted to decrease, illustrating that the s o f t drink and container industry has not yet reached its limits for lightweighting mid waste reduction.
Table 3-4 identifies the components for each container system. This table also identifies the weight of each component necessary to deliver 1,000 gallons of soft drinks. The weights for the secondary packaging are in proportion to their current share of the market. For example, in the case of the 16-02 PET bottle all the carrier weights for paperboard, "Hi-Cone,'' "Contour Pack," and shrink-wrap are in proportion to their share of the 16-02 PET market, and therefore all of the weights added together are necessary to deliver 1,000 gallons of beverage.
i
s 3- 3

PET 1 6 - 0 2 PET l-L PET 2 - L PET 3 - L PET
Total
Aluminum 1 2 - 0 2 A1
Total
Glass 10-02 NR 1 6 - 0 2 NR 16-02 REF P-L NR
Total
TOTAL
Percent of Packaged Soft Drlnks
1.7 1.3
2 4 . 5 2.0
2 9 . 5
- 4 3 . 1 4 3 . 1
1.5 10.3 1 2 . 6 - 0 . 4 2 4 . 8
9 7 - 4
Table 3 - 2
SOFT DRINK MARKET SHARES BY VOLUME. 1987
Percent of Each Material
5 . 7 4 . 3
8 3 . 2 6 . 8
100 0 0
L 9 8 0 9 8 . 0
1 2 . 5 y 8 4 . 4 y 8 8 . 0 2/
9 3 . 6 4J + 3 1 y
Percent of Each Material Normalized to 100 Percent
5 . 7 4 . 3
8 3 . 2 6 . 8
100.0
100.0 100 e 0
6 . 1 4 1 . 5
1.6 100 0
50.8
y l T - l - - - - ^^L c-c-1 1 A A ..-...A --t l.n"n......-. -nnt.3innrcl T l r r t P Y n m i n d r l v a l u e 3 may uuc. c.uc.ai &vu pcLbcuL w c b a u a G ~ u u ~ o ~ u = ~ a u v c -a-.u*u+w i~ this study make up the remaining market share.
2/ Percent of refillable glass. 3J Percent of nonrefillable glass. 4J Percent of total glass.
Source: Franklin Associates, Ltd. Based on National Soft Drink Association, Sales Survey 1 9 8 6 .
3-4

Container
16-02 PET b o t t l e - 1/ 1 - p i e c e 2-piece - 2 /
1-liter PET b o t t l e 1/ - 1 - p i e c e 2-piece - 2 /
2 - l i t e r PET b o t t l e 1/ - 1 - p i e c e 2-piece - 2 /
w I 3-liter PET b o t t l e - 1/ 1 - p i e c e 2-piece - 2 /
cn
12-02 aluminum can
T a b l e 3-3
SOFT DRINK CONTAINER WEIGHTS
1987 1 9 90 1995 U n i t Weights U n i t Weights Unit Weights
grams ounces grams ounces grams ounces
28.8 ’ 1.016 27.5 0.970 25.7 0.907 28.6 1.009 27.0 0.952 25.0 0.882 29.4 1.037 29.4 1.037 29.4 1.037
48.8 1 .721 46.8 1 . 6 5 1 44.7 1.577 1.340 42.0 1.482 40.0 1 . 4 1 1 38.0
50.5 1 .781 49.0 1.728 47.5 1.676
65.0 2.293 63.6 2.243 62.8 2.215 56 .1 1.979 54.5 1.922 54 .0 1.905 68.0 2.399 67.5 2.381 67.5 2.381
94.4 3.331 92.2 3.252 92.2 3.252 84.7 2.988 78.5 2.769 78.5 2.769 95.5 . 3.369 93.7 3.305 93.7 3.305
16.6 0.584 15 .7 0.555 14 .4 0.507
4.4 124.7 10-02 n o n r e f i l l a b l e 155.9 5.49 141.7 5.0
16-02 n o n r e f i l l a b l e 205.5 7.25 1 8 4 . 3 6.5 170.1 6.0
9 .0 255.1 16-02 REF 398.8 13.75 297.7 10.5
1-L n o n r e f i l l a b l e 510.3 18.0 425.2 15.0 396.9 1 4 . 0
- 1/ -. 2 /
Average w e i g h t based on marke t s h a r e of one- and two-piece c o n t a i n e r s . I n c l u d e s t h e w e i g h t of the HDPE basecup.
Source: F r a n k l i n Associates, Ltd . , from i n d u s t r y d a t a .

Table 3-4
w I
Q\
Conta iners 1987 1990 1995
SUMMARY OF ALL PACKAGING WEIGHTS FOR EACH SOFT DRINK CONTAINER SYSTEM &/ (Pounds pe r 1,000 ga l lons )
16-oz 1-L 2-L 3-L 12-oz 10-02 16-02 16-oz 1-L PET 2/ PET 2/ PET 2/ -- PET 2 / Aluminum NR NR REF NR --
508 407 27 1 263 398 4,392 3,625 6,875 4,258 4 85 391 . 265 257 370 4,000 3,250 5,250 3,548 45 3 37 3 262 257 338 3,520 3,000 4,500 3,312
Carriers Paperboard 27.2 - - - 16.3 34.1 34.0 150 -
- - - - 47.0 42.1 - - - - - "Hi-Cone" 2.7 - - - 9.4 2/ -
"Countour Pack" 25.0 Shrink-wrap 0.9 - - 0.4 2.7 - - -
Labels - - - - Polypropylene 7.0 4.4 5.5 4.9 - Paper-lamina te 3.3 2.3 2.6 1.9 - - - - - Polys tyrene s h i e l d - - - - 27.2 38.0 - 32.4
Closures Polypropylene 18.5 8.8 4.4 3.4 - 29.6 18.5 - 8.8
2.6 - 19.8 12.4 - 5.9 Aluminum 12.4 5.9 2.9 S t e e l crowns - - - 40.0 - - - - -
Liners BVC EVA
- - - - - 3.9 3.8 3.6 1 . 2 6.3 3.0 1.5 1.6 - 6.1 2.5 - 1.8
Corrugated t r a y s 75.4 169.0 156.2 185.7 100.2 120.8 75.4 - 175.5 - - Shrink-wrap 0.6 - - - 2 . 1 1.0 0.6
- - - - & Low-depth carriers - - 94.7 - - - - - HDPE basecups 4/ 21.8 73.5 60.3 62.6 -
- 1/
- 2 / - 3/ - 4 /
Packaging components such as carriers, l a b e l s , c l o s u r e s , etc., r e p r e s e n t weights per 1,000 g a l l o n s based on c u r r e n t market shares . Container weights are based on market s h a r e of one- and two-piece con ta ine r s . Values inc ludes both t h e "Hi-Cone" 6-pack and 12-pack bands. The weight of t h e basecups is inc luded i n t h e con ta ine r weights shown above, b u t are l i s t e d s e p a r a t e l y h e r e t o d e f i n e t h e e x t e n t t h a t they a f f e c t t h e o v e r a l l con ta ine r weight.
Source: F rank l in Assoc ia tes , Ltd.

Before discussing the results, a moment should be spent to define the accuracy of the data. Although the precision of all of the industrial data is not known, it is generally felt that the data are accurate to 5 to 10 percent. In the Executive Summary chapter, a 5 percent difference in system totals was assumed to conclude that a significant difference exists between systems. While this is probably a reasonable judgment, one should be careful about stating clearcut, significant differences in energy efficiency or environmental impacts unless the difference is greater than 10 percent.
I. -1
RESULTS AND DISCUSSION
Total Svstem Enerev Requirements
Summaries of the total system energy requirements are shown in Tables 3-5 through 3-7. The data in Table 3-5 illustrate the effect of recycling on container system energy requirements for 1987, 1990, and 1995. Table 3-6 presents a breakdown in million Btu of the various energy sources for the base year at current recycling rates. Table 3 - 7 shows the same breakdown as presented in Table 3-6 as a percent of the total system energy consumption.
Effects of Recvcline on Enerev ConsumDtion. As previously stated, the reuse and recycling of beverage containers saves energy and materials. The effects of recycling on each container system are shown in Table 3-5. amount of energy savings due to recycling varies for different containers, but is primarily related to the energy-intensiveness of the virgin system. example, the 12-02 aluminum can and the 16-02 REF bottle consume the greatest amount of energy of any of the container systems at zero percent recycling (virgin system). savings with increased recycling. This is not surprising, because recycling allows manufacturers to by-pass the processes required in the virgin manufacturing system. This issue is discussed further in Chapter 2. PET and nonrefillable glass containers are more energy-efficient containers in a virgin system, eliminating some of the initial steps of virgin production by container recycling does not produce as great effect as in the case of aluminum cans or refillable glass.
The
For
However, these two systems also report the greatest energy
Because
The data in Table 3-5 illustrate that the 12-02 aluminum can must be recycled at a rate of 45 percent or higher to maintain a positive rating as an energy-efficient container. This minimum recycling rate must be increased in the future just to stay even with the other containers. For instance, in 1987 the aluminum can recycling rate must be 48 percent to equal the energy efficiency of the virgin 16-02 PET bottle. equal the energy consumed for the virgin 16-02 PET bottle, the aluminum recycling rates must be 52 percent and 54 percent, respectively. compares aluminum at a relatively high recycling rate to a virgin PET system and does not take into account any increased activity of PET recycling, which will likely occur in the future.
In 1990 and 1995, in order to
This example
3- 7
FRANKLIN ASSOCIAES. LTD.

T a b l e 3-5
SUMMARY OF ENERGY PROFILES FOR THE DELIVERY OF SOFT DRINKS I N SELECTED CONTAINERS, 1987
( M i l l i o n Btu p e r 1,000 g a l l o n s )
1987
16-02 PET 1-L PET 2-L PET 3-L PET 12-02 Aluminum 10-02 NR 16-02 NR 16-02 REF 1-L NR
1990
16-02 PET 1-L PET 2-L PET 3-L PET 12-oz Aluminum 10-02 NR
16-02 REF 1-L NR
16-02 NR
1995
16-02 PET 1-L PET 2-L PET 3-L PET 12-02 Aluminum 10-02 NR 16-02 NR 16-02 REF 1-L NR
I1 Recyc l ing Rates V i r g i n System
0%
33.89 27.35 20.09 19.72 49.97 41.97 35.09 61.71 37.01
31.37 25 ., 4 1 18 .96 18.57 48 .93 41.97 31.38 58.58 30 .51
27.85 22.37 17.12 16.92 45.56 31.15 26.88 52.49 26.04
25%
31.00 25.04 18.56 18.26 41.46 41.15 34.42 48.53 36.22
28.51 23.29 17.53 17 .21 40.39 41.15 30.80 46.11 29.88
25.55 20.52 15.83 15.67 37.27 30.58 26.39 4 1 e 35 25.51
50%
28.11 22.73 17 .03 16.80 32.94 40.33 33.74 35.35 35.42
25.65 21.16 16.09 15.84 31.85
30.22 33.63 29.25
40.33
23.24 18.67 14.54 14 .41 28.98 30.00 25.91 30.20 24.97
75%
25.22 20.42 15 a 50 15.34
39.51 240 4 3
33-07 22. ii 34.63
22.79 19.04 14.65 1 4 48 23.30 39.51 29.65 21.16 28.62
20.93 16.82 13 .25 13.16 20.69 29.43 25.42 19.06 24.44
Recycled syst€;n 100%
22.32 18.10 13.97 13.88 15 .91 38.69 32.39
8.99 33.83
19 .93 1 6 9 1 1 3 . 2 1 13.11 14.76 38.69 29.07
8.69 27.99
18.62 14.97 11.95 11.90 12.40 28.86 24.93
7 .91 23.90
Source : F r a n k l i n A s s o c i a t e s , Ltd.
3- 8

Table 3-6
SUMMARY OF ENERGY PROFILES FOR THE DELIVERY OF SOFT DRINKS IN SELECTED CONTAINERS AT CURRENT RECYCLING RATES, 1987
(Million Btu per 1,000 gallons)
Energv Profile Natural
Containers Gas Petroleum
16-02 PET 1-L PET 2-L PET 3-L PET 12 - 02 A1 10-02 NR 16-02 NR 16-02 REF 1-L NR
9.79 8.06 6.10 6.03 10.44 22.03 18.28 6.51 19.27
12.99 9.97 6.96 6.72 6.94 10 28 8.84 3.80 9.32
~.
Hydro - Total Coal power Nuclear Wood Energv
5.85 0.33 4.74 0.26 3.60 0.20 3.52 0.19 10.64 2.51 6.08 0.34 5.06 0.28 3.48 0.18 5.16 0.28
2.10 0.53 1.67 0.80 1.26 0.74 1.21 0.88 1.83 0.58 2.16 0.77 1.80 0.56 1.17 0.29 1.82 0.83
Source: Franklin Associates, Ltd.
Table 3-7
ENERGY PROFILES FOR THE DELIVERY OF SOFT DRINKS IN SELECTED CONTAINERS AT CURRENT RECYCLING RATES. 1987 L/
Percent of Total Enerrrv, Natural Hydro -
Containers Gas Petroleum Coal power Nuclear Wood
16-02 PET 1-L PET 2-L PET 3-L PET 12-02 A1 10-02 NR 16-02 NR 16-02 REF 1-L NR
31.0 31.6 32.3 32.5 31.7 52.9 52.5 42.2 52.5
41.1 39.1 36.9 36.2 21.1 24.7 25.4 24.6 25.4
18.5 18.6 19.1 19.0 32.3 14.6 14.5 22.6 14.1
1.0 1.0 1.1 1.0 7.6 0.8 0.8 1.1 0.8
6.6 6.5 6.7 6.5 5.6 5.2 5.2 7.6 5.0
1.7 3.1 3.9 4.7 1.7 1.8 1.6 1.9 2.2
Based on Table 3-6.
Source: Franklin Associates, Ltd.
3- 9
31.59 25.50 18.86 18.55 32.94 41.66 34.82 15.43 36.68
F3? A hTKT T A T A C C n m A I T C 1 ”n

current I order of
Energv - Consumption. Table 3 - 6 compares container systems at the *ecycling rates. energy efficiency to deliver 1,000 gallons of beverage in 1987:
,The container systems may be ranked in the following
1. 16-02 refillable glass bottle ( 1 5 . 4 million Btu) 2 . 3-L PET bottle ( 1 8 . 6 million Btu) 3 . 2-L PET bottle ( 1 8 . 9 million Btu) 4 . l - L PET bottle ( 2 5 . 5 million Btu) 5 . 16-02 PET bottle ( 3 1 . 6 million Btu) 6 . 12-02 aluminum can ( 3 2 . 9 million Btu) 7 . 16 -02 nonrefillable glass bottle ( 3 4 . 8 million Btu) 8 . 9 . 10-oz nonrefillable glass bottle ( 4 1 . 7 million Btu)
l-L nonrefillable glass bottle ( 3 6 . 7 million Btu)
These results illustrate that after the refillable container, all four PET containers are the next most energy efficient container systems.
It is important to understand the relative rank of the container systems with respect to their energy efficiency. However, most people do not think in terms of million Btu or 1,000 gallons of soft drinks. Therefore, the following examples may help equate these results into more common terms. A 1,000 gallons of beverage is equivalent to:
- the average soft drink consumption of 22 people in one year, or
- 333 cases ( ( 2 4 ) 16 -02 bottles), or - 12 standard bathtubs full of beverage. The energy results range from 1 5 . 4 million Btu for the 1 6 - 0 2 REF
bottle to 4 1 . 7 million Btu for the 10-02 NR bottle in a cradle-to-grave analysis for the delivery of 1,000 gallons of soft drinks. values can be equated into common terms.
These energy In this study the delivery of 1,000
galloils of s o f t brifiks requires the equivalent ef:
- 2 . 6 6 to 7 . 2 0 barrels of crude oil, or - 123 to 334 gallons of gasoline, or - 0 . 5 to 1.5 homes electricity consumption each year, or - 0 . 9 to 2.4 cords of wood.
Thus far the discussion has focused on 1987 values at current recycling rates, however, it is also interesting to examine future years at various recycling rates (Table 3 - 5 ) . The information in Table 3 - 5 shows a continued decrease in energy consumption for all container systems through 1995 . These decreases are due to further container lightweighting and container improvements by manufacturers in their processing capabilities.
3-10

:‘1
1 . . -1 n -1
: I -1
1- I
._. F- J
d
Examining the data for 1990 and 1995 shows slight variations in the differences or spread between containers. ranking of these nine containers as far as energy efficiency does not change from the order reported in 1987. In other words, the 1 6 - 0 2 REF will remain the most efficient, with the 3 - L , 2-L, and 1-L PET bottles close behind. A shift is observed between 1987 and 1990 as the 1 - L NR becomes slightly more energy-efficient than the 16-02 NR. 1995.
However, in general the primary
This trend then continues through to
Energy Sources. In our analysis the consumption of energy can be broken down into the original sources of energy (i.e., natural gas, petroleum, coal, hydropower, nuclear, and wood). Therefore, whether the energy consumption is in the form of a raw material, as in the case of PET or HDPE, or a fuel to generate power, such as electricity, the energy consumption may be broken down into the six energy sources just defined.
Table 3 - 7 converts the energy profile shown in Table 3 - 6 into percentages of the total system energy requirements. The results in Table 3 - 7 illustrate that the three predominant energy sources for any of the container systems are natural gas, petroleum, and coal. These three energy sources range between 85 percent of the total energy for the 12-02 aluminum can, to 92 percent of the total energy for the nonrefillable glass containers. This shows that the perception many people have about PET containers being large consumers of hydrocarbons is really unfounded. analysis, such as this study, PET containers consume no more hydrocarbons than aluminum or glass containers.
In an overall systems
Container Versus Noncontainer Energv Requirements. In most beverage container packaging systems, the manufacture of the container consumes most of the system energy. this report, the energy requirements for each container system are broken out with respect to the container, secondary packaging, filling/distribution, and solid waste disposal. At the current recycling rates: the following results were observed: nonrefillable glass bottles and 12-02 aluminum cans require the most energy to manufacture containers, comprising approximately 70 percent of the total container system energy in 1987. This is just slightly higher than the 60 to 65 percent reported for container manufacture of the four PET systems. percent of the total system energy for the 16-02 REF bottle.
In the Worksheet section at the end of
On the other hand, container manufacture only accounts for 40
It is important to recognize which components are the major contributors to the total energy requirements so that efforts at reducing energy consumption can be more effectively directed at these major categories.
J 3-1 1
FRANKLIN ASSOCIATES. L?a.

Environmental Impacts
The environmental impacts examined in this study include atmospheric emissions, waterborne waste, and solid waste. In a cradle-to- grave analysis, each of these wastes must be examined separately. this study identifies these wastes, it makes no attempt to quantify any effects on the environment due to these wastes. A summary of the environmental impacts from the delivery of 1,000 gallons of beverage in 1987 is shown for each container in Table 3 - 8 . Environmental wastes are presented for a virgin system (0 percent recycling), current recycling rate, and recycled system (100 percent recycling).
Although
/
Atmospheric Emissions, The atmospheric emissions included in this study were components such as particulates, sulfur oxides, carbon monoxide, nitrogen oxides, hydrocarbons, etc. Atmospheric emissions only include those emissions after or leaving control devices. Wastes collected in these control devices are included in the solid waste category.
For every container, atmospheric emissions decrease as recycling is increased. On an individual container basis, the 3 - L PET, 2-L PET, and 16- 02 REF containers produce the lowest atmospheric emissions of any of the containers at current recycling rates. produce the most emissions. At the current recycling rates, the 3-L PET, 2 - L PET, and 16-oz REF produce approximately one-third the amount of emissions of the nonrefillable glass containers. lower atmospheric emissions than either virgin aluminum or glass systems. The virgin REF glass system produces the largest amount of emissions, yet this amount is greatly reduced as recycling or reuse occurs.
The nonrefillable glass containers
In general the virgin PET systems produce
Waterborne Waste. Waterborne waste or water pollutants include those emissions discharged to a body of water or into the sewer system after in-house wastewater treatment. Sludges from wastewater treatment systems are
in this study were total suspended solids (TSS), biological oxygen demand' (BOD) , chemical oxygen demand (COD) , chlorides, fluorides, iron, etc.
inc'l-a&d ifi s o l i d vast- eategorj; . >&e t yp i ca l water-orne r*lastes incl12ded
Table 3 - 8 lists the waterborne waste associated with each container system. three, and four as producing the least amount of waterborne waste. virgin system the 12-02 aluminum can produces the greatest amount of waterborne waste. At the current recycling rate, the 16-02 REF glass system produces the lowest quantity of waterborne waste. The refillable system is closely followed by the four PET containers in least amount of waterborne waste generation. At the current recycling rates the 12-02 aluminum can still generates the largest amount of waterborne waste. At 100 percent recycling all containers report low emissions, with the 12-02 aluminum can even improving their rank.
In the virgin system the four PET containers rank one, two, In the
3-12
FRANKLIN ASSOCIATES. Lm.
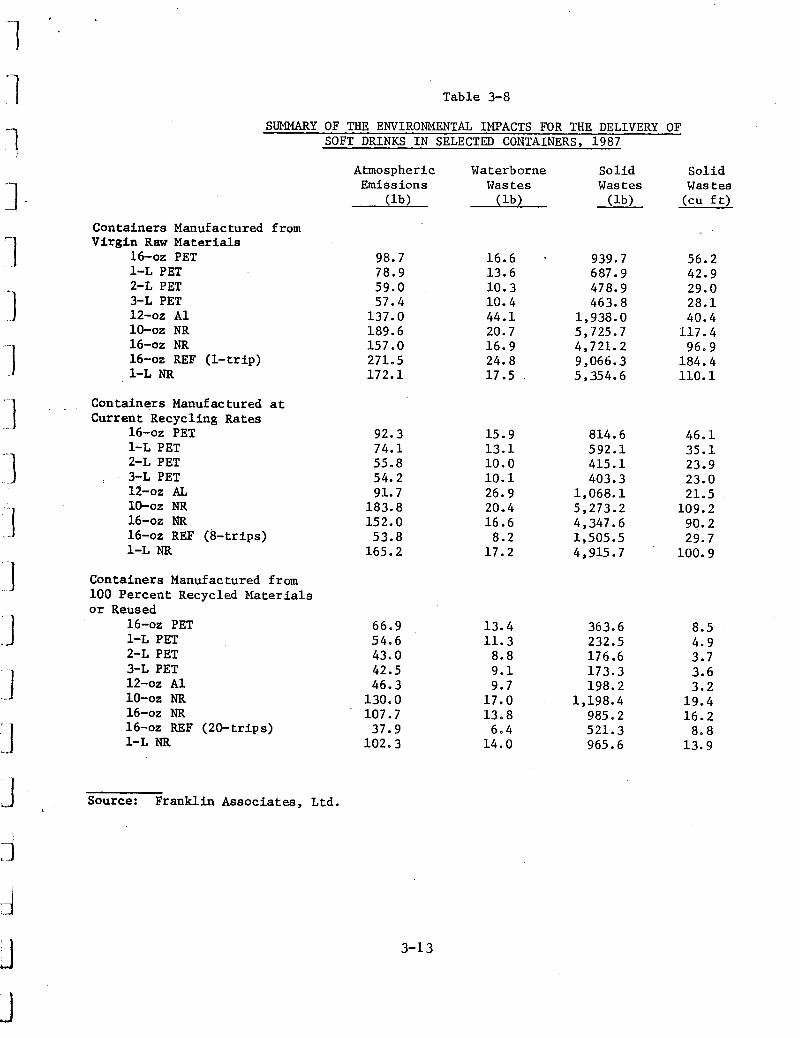
Table 3-8
SUMMARY OF THE ENVIRONMENTAL IMPACTS FOR THE DELIVERY OF SOFT DRINKS I N SELECTED CONTAINERS, 1987
Atmospheric Waterborne So l i d S o l i d
(cu f t ) Was t es Wastes E m i s s i o n s Wastes
( l b ) ( I b ) ( Ib )
Con ta ine r s Manufactured from V i r g i n Raw Materials
16-02 PET 1-L PET 2-L PET 3-L PET 12-02 A 1 10-02 NR 16-02 NR 16-02 REF (1- t r ip) 1-L NR
Conta iners Manufactured a t Curren t Recycl ing Rates
16-02 PET 1-L PET 2-L PET 3-L PET 12-02 AL 10-02 NR 16-02 NR 16-02 REF (8- t r ips ) 1-L NR
Conta iners Manufactured from 100 P e r c e n t Recycled Materials o r Reused
16-02 YET 1-L PET 2-L PET 3-L PET 12-02 A 1 10-02 NR 16-02 NR 16-02 REF (20- t r ips ) 1-L NR
98.7 78.9 59.0 57.4
137.0 189.6 157.0 271.5 172.1
92.3 74.1 55.8 54.2 91.7
183.8 152.0 53.8
165.2
66.9 54.6 43.0 42.5 46.3
130.0 107.7
37.9 102.3
16.6 13.6 10.3 10.4 44.1 20.7 16.9 24.8 17.5
15.9 13.1 10.0 10 .1 26.9 20.4 16.6
8.2 1 7 . 2
13.4 11.3
8.8 9.1 9.7
17.0 13.8
6.4 14.0
Source: F r a n k l i n Assoc ia t e s , Ltd.
3-13
939.7 687.9 478.9 463.8
1 , 938.0 5,725.7 4,721.2 9,066.3 5,354.6
814.6 592.1 415.1 403.3
1,068.1 5,273.2 4,347.6 1,505.5 4,915.7
363.6 232.5 176.6 173.3 198.2
1,198.4 985.2 521.3 965.6
56.2 42.9 29.0 28.1 40.4
117.4 96.9
184.4 110.1
46.1 35.1 23.9 23.0 21.5
109.2 99.2 29.7
100.9
8.5 4.9 3.7 3.6 3.2
19.4 16.2
8.8 13 .9
Solid Waste. The solid waste category includes industrial solid waste generated through individual processes in the manufacture of containers and packaging, as well as postconsumer waste. wastewater treatment sludges, solids resulting from air pollution control devices, trim or waste materials from manufacturing operations that are not recycled, fuel combustion residues, such as ash from burning wood or coal, and mining or extraction waste. These mining wastes include materials discarded due to raw ore processing and do not include overburden removed to uncover the raw ore. Postconsumer solid waste refers to the container and its secondary packaging, which are discarded into the municipal waste stream. study, solid waste is presented by both weight and volume. important because when considering land disposal questions, volume, not weight, is the issue.
Industrial solid waste includes
In this Volume data are
Table 3 - 8 lists the weight and volume of solid waste associated with each container system. All four PET containers produce the least amount of solid waste by weight at the current recycling rates as well as in the case of the virgin system. In the 100 percent recycled case, secondary packaging becomes a more predominant factor for each container system. In this analysis corrugated containers are assumed to be the only secondary packaging component consistently recycled, and therefore, caps, liners, labels, carriers, etc., end up as solid waste.
While defining container solid waste in terms of weight is relatively straightforward, it is more difficult to describe it in terms of volume. This is due primarily to the fact that while there are many estimates for landfill volumes of postconsumer waste, no estimate has received wide- spread acceptance. With the lack of such acceptable data, Franklin Associates, Ltd. utilized information from previous and current work. These’ estimates are considered conservative, but realistic. The landfill volume estimates used in this report are as follows:
- PET b o t t l e s - 3== per c.Gbie yard
- Aluminum cans - 560 pounds per cubic yard - Glass bottles - 1,200 pounds per cubic yard.
The volume for all secondary packaging was estimated at 800 pounds per cubic yard. Besides including postconsumer solid waste, industrial solid waste is also included in the weight and volume estimates.
Evaluating the volume of solid waste only slightly affects the For example, the 12-oz aluminum can
The 2 - L rank of the individual container systems. system reports the lowest amount by volume of solid waste generation. PET, 3-L PET, and 16-02 REF glass bottle follow next behind the aluminum can in solid waste generation by volume. The group of PET containers report the lowest volume of solid waste for the delivery of 1,000 gallons of soft drinks at virtually all recycling rates. However, aluminum containers follow closely behind, even surpassing the PET group at recycling rates greater than 90 percent. solid waste generation for delivering 1,000 gallons of beverage in each recycling scenario.
The nonrefillable glass containers report the greatest volumes of
3-1 4
FRANK1 TN A S C n r l A T F C TTn

WORKSHEETS
- Energy Profiles - Fuel Profiles - Energy Requirements for Packaging Components - Environmental Impacts
FRANKLIN ASSOCTATFS im

r -*
f-
. ..
I-
.-- i-
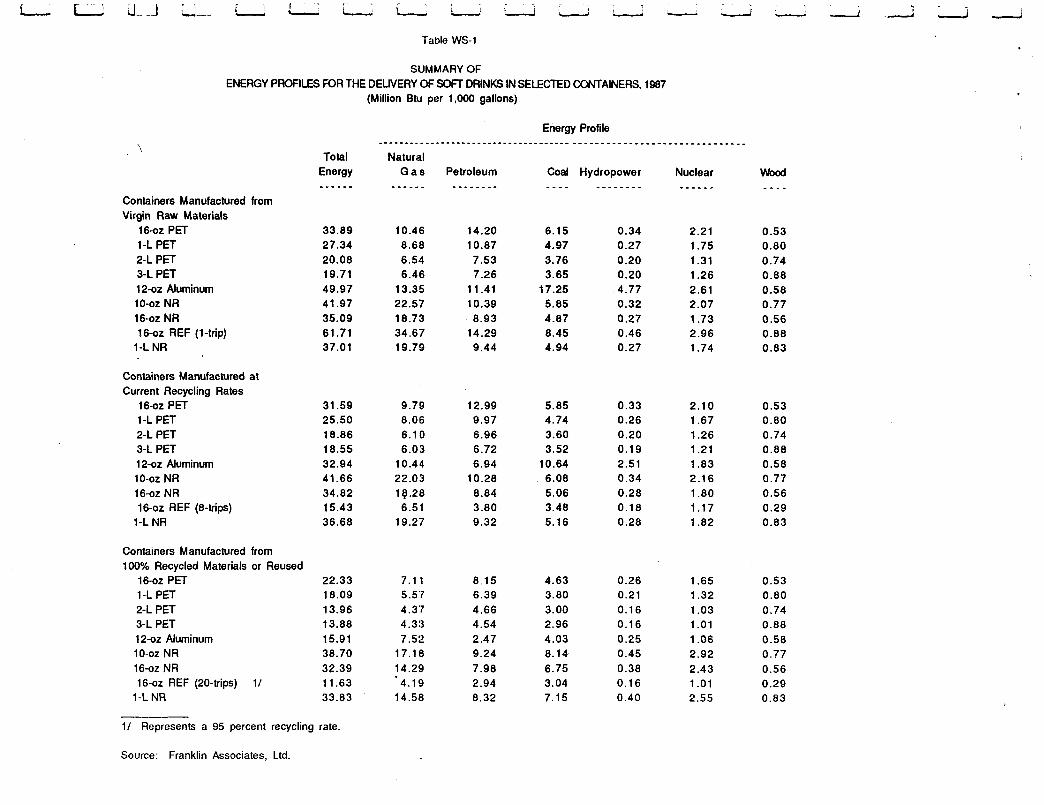
t L L J
\
Table WS-1
Containers Manufactured from Virgin Raw Materials
16-02 PET 1-L PET 2-L PET 3-L PET 12-02 Aluminum 10-02 NR 16-02 NR 16-02 REF (1-trip)
1-L NR
Containers Manufactured at Current Recycling Rates
16-02 PET 1-L PET 2-L PET 3-L PET 12-02 Aluminum 10-02 NR 16-02 NR 16-02 REF (8-trips)
1-L NR
Containers Manufactured from 100% Recycled Materials or Reused
16-02 PET 1-L PET 2-L PET 3-L PET 12-02 Aluminum
16-02 NR 16-02 REF (20-trips) 1/
10-02 NR
1-L NR
Total Energy _ _ - - _ _
33.89 27.34 20.08 19.71 49.97 41.97 35.09 61.71 37.01
31.59 25.50 18.86 18.55 32.94 41.66 34.82 15.43 36.68
22.33 18.09 13.96 13.88 15.91 38.70 32.39 11.63 33.83
11 Represents a 95 percent recycling rate.
Source: Franklin Associates, Ltd.
Natural G a s
- - - - - _
10.46 8.68 6.54 6.46
13.35 22.57 18.73 34.67 19.79
9.79 8.06 6.1 0 6.03
22.03
6.51 19.27
10.4,4
18.2’6
7.1 1 5.5’7 4.3;7 4.3:3 7.52
17.18 14.2!) 4.19
14.58
Petroleum _ - - _ _ - _ _
14.20 10.87 7.53 7.26
11.41 10.39 8.93
14.29 9.44
12.99 9.97 6.96 6.72 6.94
10.28 8.84 3.80 9.32
8.15 6.39 4.66 4.54 2.47 9.24 7.98 2.94 8.32
coal - - - -
6.15 4.97 3.76 3.65
17.25 5.85 4.87 8.45 4.94
5.85 4.74 3.60 3.52
10.64 6.08 5.06 3.48 5.16
4.63 3.80 3.00 2.96 4.03 8.14 6.75 3.04 7.15
0.34 2.21 0.27 1.75 0.20 1.31 0.20 1.26 4.77 2.61 0.32 2.07 0.27 1.73 0.46 2.96 0.27 1.74
0.33 2.10 0.26 1.67 0.20 1.26 0.19 1.21 2.51 1.83 0.34 2.16 0.28 1.80 0.18 1.17 0.28 1.82
0.26 0.21 0.16 0.16 0.25 0.45 0.38 0.16 0.40
1.65 1.32 1.03 1.01 1.06 2.92 2.43 1.01 2.55
wood _ - - _
0.53 0.80 0.74 0.88 0.58 0.77 0.56 0.88 0.83
0.53 0.80 0.74 0.88 0.58 0.77 0.56 0.29 0.83
0.53 0.80 0.74 0.88 0.58 0.77 0.56 0.29 0.83

Table WS-2
SUMMARY OF ENERGY PROFILES FOR THE DEILlVERY OF SOFT DRINKS IN SELECTED CONTAINERS, 1990
(Uillion Btu per 1,000 gallons)
Containers Manufactured from Virgin Raw Materials
16-02 PET 1-L PET 3-L PET 2-1 PET 12-02 Aluminum 10-02 NR 16-02 NR 16-02 REF (1-trip) 1-L NR
Containers Manufactured from 1 00 Percent Recycled Materials or Reused
16-02 PET 1-L PET 2-L PET 3-L PET 12-02 Aluminum
10-02 NR 16-02 Nfl 16-02 REF (20-trips) 1/ 1-L NR
31 -36 25.41 18.96 18.58 48.93 41.97 31.38 58.58 30.51
19.92 16.92 13.21 13.12 14.76 3-8.70 29.07 11.18 27.99
--------- 1/ Represents a 95 percent recycling rate.
Source: Franklin Associates, Ltd.
9.62 7.95 6.03 6.01
13.02 22.57 16.29 32.49 15.79
6.09 5.13 4.03 4.02 6.66
17.18 12.47 3.89
11.62
13.19 10.15 7.20 6.86
10.80 10.39 8.36
13.48 7.86
6.94 5.97 4.44 4.29 2.32 9.24 7.48 2.82 6.91
5.44 4.46 3.43 3.35
17.11 5.85 4.21 8.00 4.14
4.33 3.46 2.78 2.74 3.86 8.14. 5.81 2.89 5.88
0.29 0.23 0.18 0.17 4.75 0.32 0.22 0.42 0.22
0.23 0.18 0.14 0.14 0.24 0.45 0.31 0.14 0.31
2.35 1.89 1.45 1.39 2.73 2.07 1.31 3.39 1 .75
1.86 1.45 1.15 1 . I 3 1.16 2.92 2.51 1.17 2.52
0.47 0.73 0.67 0.80 0.52 0.77 0.49 0.80 d.75
0.47 0.73 0.67 0.80 0.52 0.77 0.49 0.27 0.75

Table WS-3
SUMMARY OF ENERGY PROFILES FOR THE DELIVERY OF SOFT DRINKS IN SELECTED CONTAINERS, 1995
(Milion Btu per 1,000 gallons)
Containers Manufactured from Virgin Raw Materials
16-02 PET 1-L PET 2-L PET 3-L PET 1'2-02 Aluminum
16-02 NR 10-02 NR
16-02 REF (1-trip) 1-L NR
Containers Manufactured from 100 Percent Recycled Materials or Reused
16-02 PET 1-L PET 2-L PET 3-L PET '12-02 Aluminum 10-02 NR 16-02 NR 16-02 REF (20-trips) 1/
1-L NR
27.85 22.38 17.12 16.91 45.56 31.1 6 26.88 52.49 26.04
18.61 14.98 11.95 11.89 12.40 28.87 24.93 10.14 23.90
8.86 7.16 5.57 5.65
10.94 16.55 14.01 29.24 13.45
6.17 4.65 3.73 3.76 5.16
12.84 10.86 3.52 9.97
12.16 9.31 6.78 6.47
10.41 8.18 7.37
12.22 6.89
7.04 5.51 4.1 9 4.04 2.1 5 7.31 6.62 2.71 6.07
4.40 3.64 2.90 2.85
16.53 4.03 3.48 7.09 3.49
3.44 2.90 2.40 2.38 3.48 5.57 4.80 2.55 4.94
0.22
0.14 0.14 4.73 0.20 0.17 0.35 0.17
0.18
0.17 0.14 0.12 0.1 1 0.21
0.24 0.12 0.25
0.28
1.86 1.50 1.19 1.16 2.53 1.67 1.46 2.94 1.43
1.44 1.19 0.97 0.96 0.98 2.34 2.02 1.02 2.06
0.35 0.59 0.54 0.64 0.42 0.53 0.39 0.65 0.61
0.35 0.59 0.54 0.64 0.42 0.53 0.39 0.22 0.61
1/ Represents a 95 percent recycling rate.
Source: Franklin Associates, Ltd.

Table WS-4
1987 SUMMARY OF FUEL PROFILES FOR M E DELIVERY OF SOFT DRINKS IN SELECTED CONTAINERS
(Fuel requirements per 1,000 gallons)
Containers Manufactured from Virgin Raw Materials
16-02 PET 1-L PET 2-L PET 3-L BET 1202 Aluminum 10-0~ NR 16-02 NR
16-02 REF (1-trip) 1-L NR
Containers Manufactured at Current Recycling Rates
16-02 PET 1-L PET 2-L PET 3-L PET 12-02 Aluminum 10-02 NR 16-02 NR 16-02 REF (8-trip) .
1-L NR
Containers Manufactured from 100 Percent Recycled Materials or Reused
16-02 BET 1-L PET 2-L PET 3-1 PET 12-02 Aluminum
10-02 NR 16-02 NR 16-02 REF (20-trips) I / 1-L NR
Distillate Oil
(gal) _ _ - - - -
4.7 4.4 3.8 3.9 3.3 9.5 8.0
15.7 9.6
4.5 4.2 3.7 3.9 2.9 9.3 7.8 4.9 9.4
3.5 3.6 3.3 3.4 2.5 7.4 6.2 4.0 7.5
--__ 1/ Represents a 95 percent recycling rate.
Source: Franklin Associates, Ltd.
Residual Oil
(gal) - _ _ _ - -
22.3 16.3 10.8 10.5 23.3 21.2 17.2 36.4 20.2
20.2 14.9 9.9 9.6
13.1 20.8 16.9 4.8
19.8
11.9 9.1 6.2 6.2 3.0
17.1 13.9 2.3
16.2
Gasdine (gal) _ - - - - - - -
5.7 4.9 4.2 3.9 4.5 6.9 6.2
10.4 6.3
5.2 4.6 3.9 3.7 3.6 6.6 5.9 5.8 6.0
3.3 3.0 2.9 2.7 2.7 3.6 3.5 5.4 3.2
Diesel Fuel
(gal) - - - -
6.7 6.0 4.9 4.8
10.9 14.8 12.7 20.1 13.7
6.4 5.8 4.8 4.7 8.3
15.0 12.8 7.6
13.9
5.1 4.9 4.2 4.1 5.6
16.0 13.6 5.2
15.0
Natural Gas (a 11)
3.488.8 3,016.5 2,428.6 2,438.9 7,518.2
17.361.7 14,440.4 29.596.5 16,428.5
3,303.6 2,860.3 2,322.6 2,136.2 6.807.7
16,837.0 14,008.1
5,228.9 15,920.8
2,562.9 2.235.2 1.898.2 1,925.2 6,070.3
12.114.5 10,117.4 3.225.1
11 350.7
Electricity (kwh) - - - - - -
961.1 762.1 570.7 549.7 389.9 901 .8 755.3
1,288.2 756.2
91 2.4 724.7 546.6 527.5 380.8 938.5 785.4 51 0.7 791.6
717.5 575.2 450.2 438.6 371.6
1,268.0 1,056.9
440.1 1,110.5
wood cod Wastes ( I b ) (1,000 Btu)
11.8 527 17.3 805 15.7 745 18.4 882 58.7 577 17.4 770 12.1 555 33.6 883 17.7 830
11.8 527 17.3 805 15.7 745 18.4 882 35.0 577 17.4 770 12.0 555 24.2 294 17.7 830
11.8 17.3 15.7 18.4 11.2 17.2 11.9 24.2 17.6
527 805 74 5 882 577 770 5 5 5 294 830
Natural Gas
_ - - - _ -
5.386.9 4,381 .O 3,125.0 3,059.3
249.6 2,066.0 1,669.9
37.7 516.2
4,982.2 3,978.2 2,838.2 2,775.4
249.6 2,066.0 1,669.9
37.7 516.2
3,363.4 2,367.2 1,690.9 1,640.1
249.6 2,066.0 1,669.9
37.7 51 6.2
Petroleum - - - - - - - -
7,142.6 5,225.2 3.347.1 3,174.7 4.227.6 1.283.7 1.318.9
9.7 835.6
6,476.4 4.718.0 3.022.2 2,865.7 2.1 47.2 1,283.7 1,318.9
9.7 835.6
3.81i.5 2,688.9 1,722.5 1,629.8
66.8 1,283.7 1,318.9
9.7 835.6
cod _ - - - -
3.1 1.4 0.7 0.6
105.6 4.9 3.1 0.6 1.4
3.1 1.4 0.7 0.6
52.8 4.9 3.1 0.6 1.4
3.1 1.4 0.7 0.6 0.0 4.9 3.1 0.6 1.4

1 1 _1
-1 7 1 1 'I 1
. I i
L A 1 J .I r-i
1 J
I
Table WS - 5 CURRENT AND PROJECTED ENERGY REOUIREMENTS FOR
(Million Btu per 1,000 gallons) THE COMPONENTS OF THE 16-OUNCE PET BOTTLE SYSTEM
ComDonent - 1987 - 1990 1995
PET Bottle System Virgin Raw Materials 23.90 21.78 19.16 Recycled Raw Materials 12.68 10.68 10.26
Secondary Packaging 5.03 4.74 4.19
Filling/Distribution 4.54 4.43 4.10
Solid Waste Disposal Virgin Bottle Recycled Bottle
Total Virgin Bottle Recycled Bottle
0.43 0.41 0.40 0.07 0.07 0.07
33.89 31.36 27.85 22.31 19.92 18.62
Source: Franklin Associates, Ltd.

Table WS - 6
CURRENT AND PROJECTED ENERGY REQUIREMENTS FOR THE COMPONENTS OF THE 1-LITER PET BOTTLE SYSTEM
(Million Btu per 1,000 gallons)
Component
PET Bottle System Virgin Raw Materials Recycled Raw Materials
Secondary Packaging
Filling/Distribution
Solid Waste Disposal Virgin Bottle Recycled Bottle
Total Virgin Bottle Recycled Bottle
- 1987
19.11 10 14
3.36
4.58
0.30 0.02
27 35 18.10
- 1990
17 58 9.25
3.07
4.47
0.29 0.02
25.41 16.91
- 1995
15 36 8.22
2.58
4.15
0.28 0.02
22.37 14 97
Source: Franklin Associates, Led.

-1 1 -l 1 '1 17 1 :1 I :.I 1 .i '1 .- I I
-1 L.,
II J
Table WS - 7 CURRENT AND PROJECTED ENERGY REQUIREMENTS FOR
(Million Btu per 1,000 gallons) THE COMPONENTS OF THE 2-LITER PET BOTTLE SYSTEM
Component - 1987 - 1990 1995
PET Bottle System Virgin Raw Materials 12.64 11.90 10.74 Recycled Raw Materials 6.71 6.34 5.75
Secondary Packaging 2.71 2.44 2.08
Filling/Distribution 4.53 4.43 4.10
Solid Waste Disposal Virgin Bottle Recycled Bottle
Total Virgin Bottle Recycled Bottle
0.20 0.20 0.20 0.01 0.01 0.01
20.08 18.97 17.12 13.96 13.22 11.94
Source: Franklin Associates, Ltd.

Table WS - 8
Component
CURRENT AND PROJECTED ENERGY REQUIREMENTS FOR
(Million Btu per 1,000 gallons) THE COMPONENTS OF THE 3-LITER PET BOTTLE SYSTEM
- 1987 1990 I 1995
PET Bottle System Virgin Raw Materials 12.07 11.32 10.42 Recycled Raw Materials 6.41 6.03 5.58
Secondary Packaging 2.97 2.68 2.25
Filling/Distribution 4.49 4.38 4.05
Solid Waste Disposal Virgin Bottle Recycled Bottle
Total Virgin Bottle Recycled Bottle
Source: Franklin Associates, Ltd,
0.19 0.19 0.19 0.01 0.01 0.01
19.72 18 57 16.91 13 88 13 10 11 0 89

1 ' 1 1
Table WS - 9 CURRENT AND PROJECTED ENERGY REQUIREMENTS FOR
(Million Btu per 1,000 gallons) THE COMPONENTS OF THE 12-OUNCE ALUMINUM CAN SYSTEM
ComDonent - 1987 1990 1995
Aluminum Can Virgin Raw Materials 43 32 42.54 39.75 Recycled Raw Materials 9.47 8.58 6.82
Secondary Packaging 1.97 1.83 1.55
Filling/Distribution 4.46 4.35 4.03
Solid Waste Disposal Virgin Can Recycled Can
Total Virgin Can Recycled Can
0.23 0.23 0.23 0.02 0.02 0.02
49 e 97 48.94 45.55 15.91 14.76 12.40
Source: Franklin Associates, Inc.

Table WS - 10 CURRENT AND PROJECTED ENERGY REQUIREMENTS FOR
(Million Btu per 1,000 gallons) THE COMPONENTS OF THE 10-OUNCE NONREFILLABLE GLASS BOTTLE SYSTEM
ComDonent
Glass Bottle Virgin Raw Materials Recycled Raw Materials
Secondary Packaging
Filling/Distribution
Solid Waste Disposal Virgin Bottle Recycled Bottle
Total Virgin Bottle Recycled Bottle
- 1987
28.07 25 .25
8 . 6 3
4 . 8 0
0 . 4 8 0 . 0 2
41 e 98 38 a 70
1990
2 4 . 1 4 21 .73
8 .35
4 . 6 9
0 . 4 4 0 . 0 2
37.62 34.79
1995
l a 9a 17 06
7 . 4 1
4 . 3 7
0 . 3 9 0 . 0 2
3 1 . 1 5 2 8 . a6
Source: Franklin Associates, Ltd.

-1 ’
‘1 1 _1
1 -1 ‘ 1 ‘I .-I ..I 1
: I .I 11 J
Table WS - 11
CURRENT AND PROJECTED ENERGY REOUIREMENTS FOR
(Million Btu per 1,000 gallons) THE COMPONENTS OF THE 16-OUNCE NONREFILLABLE GLASS BOTTLE SYSTEM
ComDonent - 1987 1990 - 1995
Glass Bottle Virgin Raw Materials 23.12 19.62 16 e 18 Recycled Raw Materials 20 80 17.65 14.54
Secondary Packaging 6.81 6.76 6.07
Filling/Distribution 4.75 4.65 4.32
Solid Waste Disposal Virgin Bottle Recycled Bottle
Total Virgin Bottle Recycled Bottle
Source: Franklin Associates, Ltd.
0.40 0.36 0.33 0.02 0.02 0.02
35.45 31.38 26.89 32.39 29.07 24.94

Table WS - 12 CURRENT AND PROJECTED ENERGY REQUIREMENTS FOR
(Million Btu per 1,000 gallons) THE COMPONENTS OF THE 16-OUNCE REFILLABLE GLASS BOTTLE SYSTEM
Component - 1987
Glass Bottle l-trip 5 -trip 8 -trip 10 - trip 20-trip
Secondary Packaging
Filling/Distribution
Solid Waste Disposal 1 -trip 5 -trip 8 trip 10-trip 20- trip
Total 1 -&Kip 5 -trip 8 -trip 10-trip 20-trip
50 70 10 e 04 6.27 5.02 2.51
1 23-2.42
7.84
0.74 0.15 0.09 0.08 0.04
61 71 19.26 15.44 14.17 11.63
1990
47 98 9.50 5.94 4.75 2.37
1.12-2.20
7.65
0.75 0.15 0.10 0.08 0.04
58 58 18.42 14.80 13.60 11.19
1995
42.89 8.49 5.31 4.24 2.12
0.89-1.76
7.09
0.75 0.15 0.10 0.08 0.04
52.49 16.61 13.37 12.29 10.13
Source: Franklin Associates, Ltd.

1 ' 7 1 11 -1 -1 * I ' -1 '-1 : I
I 1 1
. J J Ij
:1 1 J
Table WS-13
CURRENT AND PROJECTED ENERGY REQUIREMENTS FOR
(Million Btu per 1,000 gallons) THE COMPONENTS OF THE 1-LITER NONREFILLABLE GLASS BOTTLE SYSTEM
ComDonent - 1987 1990 1995
Glass Bottle Virgin Raw Materials 27.16 21.41 17.85 Recycled Raw Materials 24.44 19.27 16.05
Secondary Packaging 4.73 4.15 3.61
Filling/Distribution 4.66 4.55 4.23
Solid Waste Disposal Virgin Bottle Recycled Bottle
To tal Virgin Bottle Recycled Bottle
0.45 0.38 0.36 0.01 0.01 0.01
37.00 30.51 26.05 33.83 27 99 23.89
Source: Franklin Associates, Ltd.

Table WS-14
16-02 PET I - L PET 2-L PET 3-L PET 12-02 Aluminum 10-02 NR 16-02 NR 16-02 REF I - L NR
SUMMARY OF ATMOSPHERIC EMISSIONS FOR THE DELIVERY OF SOFT DRINKS IN SELECTED CONTAINERS, 1987
(Pounds per 1,000 gallons)
98.7 78.9 59.0 57.4
137.0 189.6 157.0 271.5 172.1
90.7 72.8 55.0 53.7
11 4.3 174.7 144.6 21 3.1 154.7
82.8 66.8 51 .O 49.9 91.7
159.8 132.3 154.7 137.2
74.8 60.7 47.0 46.2 69.0
144.9 120.0
96.3 119.8
66.9 54.6 43.0 42.5 48.3
130.0 107.7
37.9 102.3
----__ Source: Franklin Associates, Ltd.
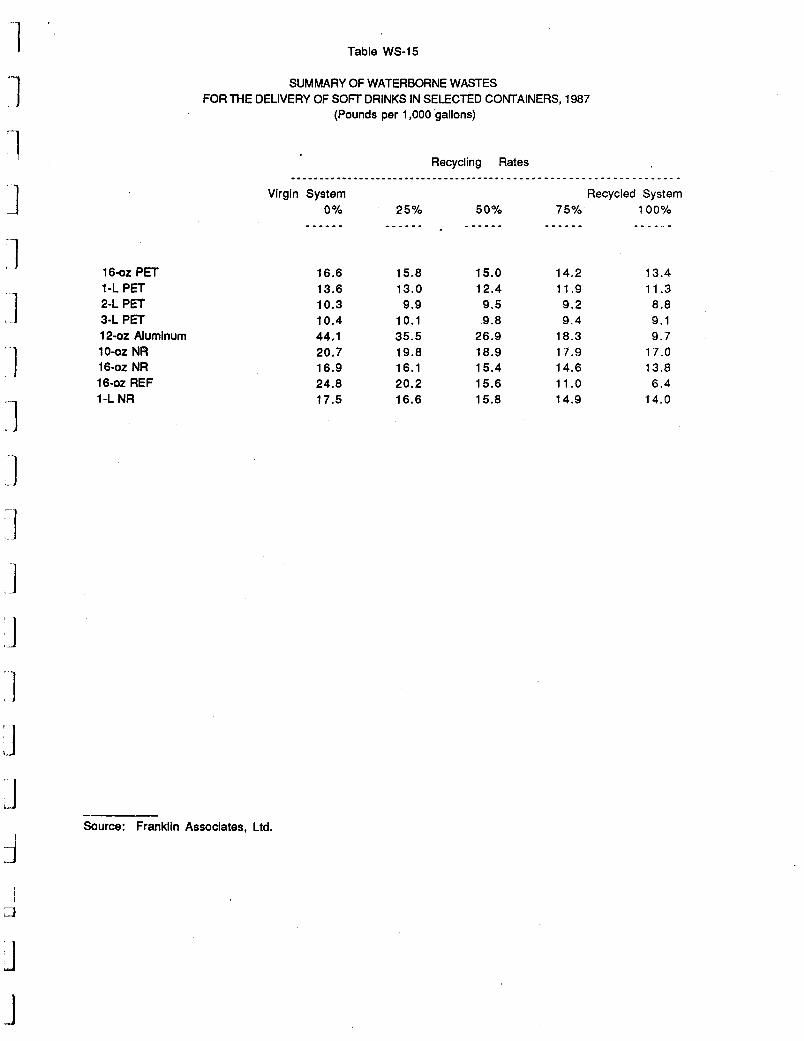
16-02 PET 1-L PET 2-L PET 3-L PET 12-02 Aluminum 10-02 NR 16-02 NR 16-02 REF 1-L NR
Table WS-15
SUMMARY OF WATERBORNE WASTES FOR M E DELIVERY OF SOFT DRINKS IN SELECTED CONTAINERS, 1987
(Pounds per 1,000 gallons)
- Source: Franklin Associates, Ltd.
16.6 13.6 10.3 10.4 44.1 20.7 16.9 24.8 17.5
15.8 13.0 9.9
10.1 35.5 19.8 16.1 20.2 16.6
15.0 12.4 9.5 9.8
26.9 18.9 15.4 15.6 15.8
14.2 11.9 9.2 9.4
18.3 17.9 14.6 11.0 14.9
13.4 11.3 8.8 9.1 9.7
17.0 13.8 6.4
14.0

Table WS-16
16-0~ PET 1-L PET 2-L PET 3-b PET 12-oz Aluminum 10-oz NR 16-02 NR 16-02 REF 1-L NR
SUMMARY OF SOLIDS WASTES
(Pounds per 1,000 gallons) FOR THE DELIVERY OF SOFT DRINKS IN SELECTED CONTAINERS, 1987
939.7 687.9 478.9 463.8
1,938.0 5,725.7 4,721.2 9,066.3 5,354.6
795.7 574.1 403.3 391.2
1.503.0 4,593.9 3,787.2 6,930.1 4,257.4
651.6 460.2 327.7 31 8.6
1,068.1 3.46 2 .O 2,853.2 4,793.8 3,160.1
507.6 346.4 252.2 245.9 633.1
2,330.2 1,919.2 2,657.6 2,062.9
363.6 232.5 176.6 173.3 198.2
1 ,i 98.4 985.2 521 -3 965.6
-- Source: Franklin Associates, Ltd.

16-02 PET 1-L PET 2-L PET 3-L PET 12-02 Aluminum 10-02 IUR 16-02 NR 16-02 REF 1-L NR
Table WS-17
SUMMARY OF SOLIDS WASTES FOR THE DELIVERY OF SOFT DRINKS IN SELECTED CONTAINERS, 1987
(Cubic Feet per 1,000 gallons)
56.2 42.9 29.0 28.1 40.4
11 7.4 96.9
184.4 11 0.1
Source: Franklin Associates, Ltd.
44.3 33.4 22.7 22.0 30.8 94.3 78.0
136.8 86.5
32.4 23.9 16.4 15.9 21.6 69.3 57.4 92.4 62.3
20.4 14.4 10.0 9.7
12.4 44.4 36.8 50.2 38.1
8.5 4.9 3.7 3.6 3.2
19.4 16.2 8.8
13.9

I-
I ,,
r -
.- I ,
. ._.
.-