Comparative Emissions Testing of Vehicles Aged …higher ethanol blends, up to 20% by volume, on...
76
NREL is a national laboratory of the U.S. Department of Energy, Office of Energy Efficiency & Renewable Energy, operated by the Alliance for Sustainable Energy, LLC. Contract No. DE-AC36-08GO28308 Comparative Emissions Testing of Vehicles Aged on E0, E15 and E20 Fuels Keith Vertin, Gerard Glinsky, and Aaron Reek SGS Environmental Testing Corporation Aurora, Colorado NREL Technical Monitor: Aaron Williams Subcontract Report NREL/SR-5400-55778 August 2012
Transcript of Comparative Emissions Testing of Vehicles Aged …higher ethanol blends, up to 20% by volume, on...

NREL is a national laboratory of the U.S. Department of Energy, Office of Energy Efficiency & Renewable Energy, operated by the Alliance for Sustainable Energy, LLC.
Contract No. DE-AC36-08GO28308
Comparative Emissions Testing of Vehicles Aged on E0, E15 and E20 Fuels Keith Vertin, Gerard Glinsky, and Aaron Reek SGS Environmental Testing Corporation Aurora, Colorado
NREL Technical Monitor: Aaron Williams
Subcontract Report NREL/SR-5400-55778 August 2012

NREL is a national laboratory of the U.S. Department of Energy, Office of Energy Efficiency & Renewable Energy, operated by the Alliance for Sustainable Energy, LLC.
National Renewable Energy Laboratory 15013 Denver West Parkway Golden, Colorado 80401 303-275-3000 • www.nrel.gov
Contract No. DE-AC36-08GO28308
Comparative Emissions Testing of Vehicles Aged on E0, E15 and E20 Fuels Keith Vertin, Gerard Glinsky, and Aaron Reek SGS Environmental Testing Corporation Aurora, Colorado
NREL Technical Monitor: Aaron Williams Prepared under Subcontract Nos. JEV-7-77439-01, JCG-9-99141-01, and JXH-1-11668-01
Subcontract Report NREL/SR-5400-55778 August 2012

This publication received minimal editorial review at NREL.
NOTICE
This report was prepared as an account of work sponsored by an agency of the United States government. Neither the United States government nor any agency thereof, nor any of their employees, makes any warranty, express or implied, or assumes any legal liability or responsibility for the accuracy, completeness, or usefulness of any information, apparatus, product, or process disclosed, or represents that its use would not infringe privately owned rights. Reference herein to any specific commercial product, process, or service by trade name, trademark, manufacturer, or otherwise does not necessarily constitute or imply its endorsement, recommendation, or favoring by the United States government or any agency thereof. The views and opinions of authors expressed herein do not necessarily state or reflect those of the United States government or any agency thereof.
Available electronically at http://www.osti.gov/bridge
Available for a processing fee to U.S. Department of Energy and its contractors, in paper, from:
U.S. Department of Energy Office of Scientific and Technical Information P.O. Box 62 Oak Ridge, TN 37831-0062 phone: 865.576.8401 fax: 865.576.5728 email: mailto:[email protected]
Available for sale to the public, in paper, from:
U.S. Department of Commerce National Technical Information Service 5285 Port Royal Road Springfield, VA 22161 phone: 800.553.6847 fax: 703.605.6900 email: [email protected] online ordering: http://www.ntis.gov/help/ordermethods.aspx
Cover Photos: (left to right) PIX 16416, PIX 17423, PIX 16560, PIX 17613, PIX 17436, PIX 17721
Printed on paper containing at least 50% wastepaper, including 10% post consumer waste.

Comparative Emissions Testing of Vehicles Aged on E0, E15 and E20 Fuels
i
Comparative Emissions Testing of Vehicles Aged on E0, E15 and E20 Fuels
Table of Contents
Table of Contents .................................................................................................................................................. i
List of Figures ....................................................................................................................................................... ii
List of Tables ........................................................................................................................................................ ii
Abbreviations and Acronyms .............................................................................................................................. iii
Acknowledgements ............................................................................................................................................. iv
1.0 Executive Summary .................................................................................................................................. 1
2.0 Introduction ............................................................................................................................................. 2
3.0 Approach and Test Procedures ................................................................................................................ 3
3.1 Vehicle Models and Test Matrix ......................................................................................................... 3
3.2 Vehicle Preparation ............................................................................................................................. 6
3.3 Aging on Mileage Accumulation Dynamometers ............................................................................... 7
3.4 Preparation for Emission Testing ...................................................................................................... 10
3.5 Emissions Test Procedure ................................................................................................................. 11
3.6 SHED Test Procedure ........................................................................................................................ 14
4.0 Fuels ....................................................................................................................................................... 16
5.0 Vehicle Maintenance and Operational Issues ....................................................................................... 18
6.0 Exhaust Emissions Results ...................................................................................................................... 19
6.1 2009 Honda Odyssey ........................................................................................................................ 20
6.2 2009 Ford Focus ................................................................................................................................ 24
6.3 2009 Toyota Camry ........................................................................................................................... 28
6.4 2009 Saturn Outlook ......................................................................................................................... 31
6.5 2000 Honda Accord ........................................................................................................................... 34
6.6 2000 Ford Focus ................................................................................................................................ 37
6.7 Catalyst Sulfur Purge Effects on Exhaust Emissions .......................................................................... 40
7.0 Evaporative Emissions Results – Tier 2 Vehicles .................................................................................... 41
8.0 Conclusions ............................................................................................................................................ 44
9.0 References ............................................................................................................................................. 45
10.0 Appendices ............................................................................................................................................. 46
10.1 Exhaust Emissions Data Table ........................................................................................................... 46
10.2 Cylinder Compression and Leak-Down Reports ................................................................................ 52

Comparative Emissions Testing of Vehicles Aged on E0, E15 and E20 Fuels
ii
List of Figures
Figure 1. Test Vehicles Operating on the Mileage Accumulation Dynamometers ............................................. 8 Figure 2. Typical Vehicle Speed Compared to SRC, for Emissions Dyno Lab with Driver (upper) ...................... 9 Figure 3. Road Load Derivation Results for 2009 Ford Focus #128417 (RE0) and #128422 (RE20) ................. 11 Figure 4. Saturn Outlook RE20 Installed in Chassis Dynamometer Emissions Laboratory ............................... 13 Figure 5. Saturn Outlook RE15 Following Completion of a 2-Day Diurnal SHED Test ...................................... 15 Figure 6. 2009 Honda Odyssey RE0 Emissions Before and After Sensor Change, Cert_E0 Fuel ....................... 20 Figure 7. 2009 Honda Odyssey – Weighted FTP75 Exhaust Emissions Results ................................................ 21 Figure 8. 2009 Honda Odyssey – Weighted FTP75 Exhaust Emissions Results ................................................ 22 Figure 9. 2009 Honda Odyssey Catalyst Conversion Efficiency over FTP75 Cycle ............................................ 23 Figure 10. 2009 Ford Focus – Weighted FTP75 Exhaust Emissions Results ...................................................... 25 Figure 11. 2009 Ford Focus – Weighted FTP75 Exhaust Emissions Results ...................................................... 26 Figure 12. 2009 Ford Focus Catalyst Conversion Efficiency over FTP75 Cycle ................................................. 27 Figure 13. 2009 Toyota Camry – Weighted FTP75 Exhaust Emissions Results ................................................. 28 Figure 14. 2009 Toyota Camry – Weighted FTP75 Exhaust Emissions Results ................................................. 29 Figure 15. 2009 Toyota Camry Catalyst Conversion Efficiency over FTP75 Cycle ............................................ 30 Figure 16. 2009 Saturn Outlook – Weighted FTP75 Exhaust Emissions Results ............................................... 31 Figure 17. 2009 Saturn Outlook – Weighted FTP75 Exhaust Emissions Results ............................................... 32 Figure 18. 2009 Saturn Outlook Catalyst Conversion Efficiency over FTP75 Cycle .......................................... 33 Figure 19. 2000 Honda Accord – Weighted FTP75 Exhaust Emissions Results ................................................ 34 Figure 20. 2000 Honda Accord – Weighted FTP75 Exhaust Emissions Results ................................................ 35 Figure 21. 2000 Honda Accord Catalyst Conversion Efficiency over FTP75 Cycle ............................................ 36 Figure 22. 2000 Ford Focus – Weighted FTP75 Exhaust Emissions Results ...................................................... 37 Figure 23. 2000 Ford Focus – Weighted FTP75 Exhaust Emissions Results ...................................................... 38 Figure 24. 2000 Ford Focus Catalyst Conversion Efficiency over FTP75 Cycle ................................................. 39 Figure 25. Catalyst Sulfur Purge Effect on Emissions, Odyssey RE0 and Focus RE0 ......................................... 40 Figure 26. Catalyst Sulfur Purge Effect on Emissions, Camry RE0 and Outlook RE0 ........................................ 41 Figure 27. Evaporative Emissions Results for 2009 Model Year Vehicles, on Cert_E0 and Cert_E15 Fuels ..... 43
List of Tables
Table 1. Vehicle Specification and Odometer at Start and End of Testing ......................................................... 4 Table 2. Vehicle Test Matrix and Fuels ............................................................................................................... 6 Table 3. Adaptive Controls During WOT Accelerations .................................................................................... 11 Table 4. Fuel Batches and Fuel Property Summary .......................................................................................... 17 Table 5. Evaporative Emissions for 2009 Model Year Vehicles Aged on RE0 and RE15 Fuels .......................... 42

Comparative Emissions Testing of Vehicles Aged on E0, E15 and E20 Fuels
iii
Abbreviations and Acronyms
Cert_E0 Test fuel with no ethanol, meeting EPA specification for certification gasoline for altitudes >4,000 feet
Cert_E15 Test fuel containing 15%vol ethanol splash blended into Cert_E0 certification gasoline Cert_E20 Test fuel containing 20%vol ethanol splash blended into Cert_E0 certification gasoline CO Carbon monoxide CO2 Carbon dioxide CRC Coordinating Research Council DOE US Department of Energy DTC Diagnostic Trouble Code E0 Ethanol-free gasoline E20 20%vol ethanol blended into ethanol-free gasoline EPA US Environmental Protection Agency FID Flame Ionization Detector FTP75 Federal Test Procedure consisting of a 3-Phase drive cycle also known as the CVS80 GC Gas Chromatograph HC Hydrocarbons I/M Inspection and Maintenance for vehicle test readiness, as determined from OBD scan LA4 2-Phase drive cycle also known as the FTP72 or Urban Dynamometer Driving Schedule LFT Long Term Fuel Trim MAD Mileage Accumulation Dynamometer MIL Malfunction Indicator Lamp NLEV EPA emissions standard for National Low Emissions Vehicle NMHC Non Methane Hydrocarbons NOx Oxides of nitrogen NREL National Renewable Energy Laboratory OBD On Board Diagnostics OEM Original Equipment Manufacturer ORNL Oak Ridge National Laboratory ppm Parts per million RE0 Road aging gasoline containing <0.1%vol ethanol RE15 Road aging fuel containing 15%vol ethanol blended into RE0 RE20 Road aging fuel containing 20%vol ethanol blended into RE0 RVP Reid Vapor Pressure SGS SGS Environmental Testing Corporation SHED Sealed Housing for Evaporative Determination SRC EPA Standard Road Cycle THC Total Hydrocarbons as measured by FID WOT Wide Open Throttle, commonly referring to a WOT test procedure in this report

Comparative Emissions Testing of Vehicles Aged on E0, E15 and E20 Fuels
iv
Acknowledgements
This project and report were funded by the American Recovery and Reinvestment Act, via subcontracts JEV-7-77439-01, JCG-9-99141-01 and JXH-1-11668-01 from the National Renewable Energy Laboratory (NREL). The overall multi-lab test program to evaluate the potential impact of intermediate ethanol blends on the vehicle fleet has been co-led and co-funded by the U.S. Department of Energy (DOE) Office of Energy Efficiency and Renewable Energy (EERE) Biomass Program and the EERE Vehicle Technologies Program. The U.S. Environmental Protection Agency, U.S. auto manufacturers, engine companies, and other organizations have also contributed to the multi-lab test program. The authors gratefully acknowledge the support provided by Robert McCormick, Keith Knoll, Aaron Williams and Wendy Clark from NREL, and by Kevin Stork, Steve Przesmitzki and Brian Duff from the U.S. Department of Energy. The authors thank those who have made significant technical contributions to this project, including Brad Kotch, David Reeves, Myles Weddington, and Tom Beierschmitt Jr from SGS Environmental Testing Corporation, and Jon Luecke and Teresa Alleman from NREL.

Comparative Emissions Testing of Vehicles Aged on E0, E15 and E20 Fuels
1
1.0 Executive Summary
The Energy Independence and Security Act passed into law in December 2007 mandates the use of 36 billion ethanol equivalent gallons per year of renewable fuel by 2022. A primary pathway to achieve this national goal is to increase the amount of ethanol blended into gasoline. In 2007, DOE initiated a test program to evaluate the potential impacts of intermediate ethanol blends on the legacy vehicle fleet. There was concern in the automotive community that increasing the ethanol content in gasoline may cause higher catalyst temperatures and lead to catalyst performance deterioration over time. The interaction of the engine emissions control system, the 3-way catalyst, and fuel properties is complex, and a large scale study was needed to evaluate higher ethanol-containing fuels for a variety of vehicle technologies. The present study is part of a multi-laboratory test program coordinated by DOE to evaluate the effect of higher ethanol blends, up to 20% by volume, on vehicle exhaust emissions over the lifetime of the vehicle. Six different vehicle models were chosen for testing at SGS Environmental Testing Corporation. Four types of vehicles from the 2009 model year were aged to 120,000 miles, and two types of vehicles from the 2000 model year were aged for an additional 50,000 miles over the starting odometer. The vehicles were aged under very consistent and controlled conditions by running them on mileage accumulation dynamometers using the Standard Road Cycle. The fuels used to age the vehicles, or “aging fuels,” were designated as RE0, RE15, and RE20 to indicate the ethanol content. Emissions tests were performed using fuels designated as Cert_E0, Cert_E15, and Cert_E20 to indicate the amount of ethanol splash-blended into certification gasoline. For each vehicle model chosen for testing, three closely matched vehicles were recruited. The three vehicles in the set all had the same engine family and evaporative emissions family. One vehicle was aged on ethanol-free fuel (RE0), one aged on 15 vol% ethanol splash blended into gasoline (RE15), and one on 20 vol% ethanol splash blended into gasoline (RE20). The test plan was designed to establish baseline (pre-aging) exhaust emissions, and then to periodically retest the eighteen vehicles in the study following mileage accumulation to quantify the change of exhaust emissions as the vehicles aged. For each vehicle model, the test results for the vehicles aged on RE0, RE15, and RE20 fuels were directly compared to assess the impact of ethanol content on exhaust emissions deterioration.
The conclusions drawn here apply to the six vehicle models tested. The reader is referred to the DOE V4 Program Report [Ref 3] for a comprehensive statistical analysis of 82 vehicles, including 14 vehicles from this study.
• The vehicles aged on 15% and 20% ethanol-containing fuels did not produce higher exhaust emissions compared to control vehicles aged on ethanol-free fuel, for all six models tested in the study.
• Fuel economy was lower for vehicles tested on blends of 15% to 20% ethanol into certification gasoline, and was in proportion to the lower energy density of these oxygenated fuels.
• Blends of 15% to 20% ethanol into certification gasoline either produced no change or lowered NMHC and CO emissions for each vehicle tested, relative to the same vehicle tested on ethanol-free certification gasoline. NOx emissions were not statistically different for each vehicle tested on ethanol-containing certification fuels, compared to the same vehicle tested on ethanol-free certification gasoline.

Comparative Emissions Testing of Vehicles Aged on E0, E15 and E20 Fuels
2
• The mean NOx emissions increased over the aging period for 17 of the 18 vehicles in the study. Of these vehicles, five were aged using RE0 fuel, six were aged using RE15 fuel, and six were aged using RE20 fuel.
• For four of the six models tested, the vehicle aged on RE0 fuel had higher exhaust emissions compared to the matched vehicles aged on RE15 or RE20 fuel. This finding contradicted the concern that higher ethanol content in gasoline may accelerate catalyst deterioration.
• The 2009 Honda Odyssey aged using RE0 fuel had higher NMHC, CO and NOx emissions at 120,000 miles compared to the vehicles aged on RE15 and RE20 with 95% confidence. The catalyst conversion efficiency for the HC, CO and NOx species was poorer for Odyssey RE0 as it aged compared to the other vehicles.
• NOx emissions from the 2009 Ford Focus aged using RE0 fuel were higher than Focus RE15 at 90,000 miles and higher than Focus RE20 at 120,000 miles with statistical confidence. All three vehicles in this set had significant deterioration of NOx emissions over the 120,000 mile aging period.
• There was no statistical difference in NMHC, CO and NOx emissions for the 2009 Toyota Camrys aged on RE15 and RE20 fuels compared to Camry RE0 after 120,000 miles of aging.
• NMHC, CO and NOx emissions were higher for 2009 Saturn Outlook RE0 compared to the vehicles aged on RE15 and RE20 fuels after 120,000 miles, with statistical confidence.
• The effect of the aging fuel on NMHC and NOx emissions was not statistically significant for the model year 2000 Honda Accords. CO emissions from Accord RE0 were higher compared to Accords RE15 and RE20 at 120,000 miles with statistical confidence.
• There was no statistical evidence that the ethanol-containing aging fuels impacted the exhaust emissions from the model year 2000 Ford Focus cars.
• There was no evidence of a cylinder compression problem with any of the vehicles over the course of the study, based on periodic compression and leak-down tests performed.
• Evaporative emissions were measured for the 2009 Odyssey, Camry, Focus, and Outlook as they aged to 120,000 miles on the mileage accumulation dynamometer. The limited data from this testing suggested the evaporative emissions were very similar for these vehicle models as they aged on RE0 and RE15 fuels. Supplemental 2-day evaporative emissions results for all tests were under the 2009 Tier 2 evaporative emissions standards, for both Cert_E0 and Cert_E15 test fuels. It is acknowledged that these vehicles aged on the MADs experienced far fewer refuel, diurnal, and canister purge events compared to real-world operation, and also had a shorter duration of fuel exposure.
• Emissions testing performed before and after the WOT catalyst sulfur purge cycle confirmed the sulfur purging produced a significant reduction in NOx emissions for two of the four vehicles tested. NOx emissions were reduced by 31% on average for the 2009 Ford Focus RE0, and by 25% on average for the 2009 Saturn Outlook RE0 following the catalyst sulfur purge.
2.0 Introduction
The Energy Independence and Security Act passed into law in December 2007 mandates the use of 36 billion ethanol equivalent gallons per year of renewable fuel by 2022. A primary pathway to achieve this national goal is to increase the amount of ethanol blended into gasoline. In 2007, DOE initiated a test program to evaluate the potential impacts of intermediate ethanol blends on the legacy vehicle fleet. Earlier research has shown that higher ethanol concentrations in gasoline may lead to less fuel enrichment during accelerations where the engine control system reverts to an open-loop fueling strategy for catalyst protection (CRC E-87 Program [Ref 1], DOE V1 Program [Ref 2]). Leaner combustion results in higher exhaust

Comparative Emissions Testing of Vehicles Aged on E0, E15 and E20 Fuels
3
and catalyst temperatures at higher engine loads, for vehicles that do not employ long term fuel trim (LFT) adaptation under open-loop conditions. There was concern in the automotive community that increasing the ethanol content in gasoline for these vehicles may cause higher catalyst temperatures and lead to catalyst performance deterioration over time. The present study is part of a multi-laboratory test program coordinated by the DOE to evaluate the effect of higher ethanol blends, up to 20% by volume, on vehicle exhaust emissions over the lifetime of the vehicle. Six different vehicle models were chosen for testing at SGS Environmental Testing Corporation. Four types of vehicles from the 2009 model year were aged to 120,000 miles, and two types of vehicles from the 2000 model year were aged for an additional 50,000 miles over the starting odometer. The vehicles were aged under very consistent and controlled conditions by running them on mileage accumulation dynamometers using the Standard Road Cycle.
The fuels used to age the vehicles, or “aging fuels,” were designated as RE0, RE15, and RE20 to indicate the ethanol content. Emissions tests were performed using fuels designated as Cert_E0, Cert_E15, and Cert_E20 to indicate the amount of ethanol splash-blended into certification gasoline.
For each vehicle make and model chosen for testing, three closely matched vehicles were recruited. The three vehicles in the set all had the same engine family and evaporative emissions family. One vehicle was aged on ethanol-free fuel (RE0), one aged on 15 vol% ethanol splash blended into gasoline (RE15), and one on 20 vol% ethanol splash blended into gasoline (RE20). The test plan was designed to establish baseline (pre-aging) exhaust emissions, and then to periodically retest the eighteen vehicles in the study following mileage accumulation to quantify the change of exhaust emissions as the vehicles aged. For each vehicle model, the test results for the vehicles aged on RE0, RE15, and RE20 fuels were directly compared to assess the impact of ethanol content on exhaust emissions deterioration.
The overall results from this present study have been reported and published along with the results from other test labs participating in the DOE program (DOE V4 Program Report [Ref 3]). This broader report produced by the ORNL and NREL national laboratories included a comprehensive statistical analysis for the 82 vehicles that participated in the DOE V4 Program.
The present report includes more details regarding the test methodology, vehicle operation history, and emissions data. Catalyst conversion efficiency data is presented for each phase of the FTP75 emissions test cycle. The effect of catalyst sulfur purge on the exhaust emissions is discussed. In addition, some cursory data is presented comparing the evaporative emissions of vehicles aged on RE0 and RE15 fuels.
Based largely on DOE V4 test dataset, on October 13, 2010 the Environmental Protection Agency granted a partial waiver to allow fuel and fuel additive manufacturers to introduce E15 into commerce for use in model year 2007 and newer light-duty motor vehicles [Ref 4]. On January 21, 2011, EPA took further action to allow the introduction of E15 into commerce for use in model year 2001 and newer light-duty motor vehicles if the waiver conditions were met [Ref 5].
3.0 Approach and Test Procedures
3.1 Vehicle Models and Test Matrix
The DOE and EPA chose the six vehicle makes and models to be tested at SGS-ETC [Ref 3]. Vehicle selection criteria included manufacturer, model year, sales/registration volumes, and whether a vehicle model did or

Comparative Emissions Testing of Vehicles Aged on E0, E15 and E20 Fuels
4
did not apply long-term fuel trim at WOT. Several previous studies also factored into the vehicles selected for testing, including the DOE’s previous 16-vehicle screening study (known as “V1,” [Ref 2]), DOE’s EPAct vehicle study (known as “V2”), and CRC’s E-87 study [Ref 1]. For each vehicle make and model chosen for testing, three closely matched vehicles were recruited. The three vehicles in the set all had the same engine family and evaporative emissions family. One vehicle was aged on RE0, one aged on RE15 fuel, and one on RE20 fuel. The vehicles are summarized in Table 1. The cars were given unique 6-digit ID numbers and had large color-coded labeling to ensure positive identification and proper refueling.
Table 1. Vehicle Specification and Odometer at Start and End of Testing
The test plan was designed to establish baseline (pre-aging) exhaust emissions, and then to periodically retest the vehicles following mileage accumulation to quantify the change of exhaust emissions as the vehicles aged. Four vehicle makes/models were tested from the 2009 model year. The Odyssey, Camry, and Outlook were certified to EPA Tier 2 Bin 5 standards, and the Focus was Tier 2 Bin 4. The cars to be aged on RE0 and RE15 fuels were purchased new and conditioned to 4000 miles (Section 3.2) before performing baseline emissions tests. The RE20 vehicle testing was authorized in the spring of 2011, and therefore it was not possible to purchase new vehicles. SGS-ETC recruited the vehicles to be aged on RE20 fuel from the public fleet, with emphasis on obtaining low mileage vehicles. The RE20 vehicles were inspected prior to
Make and Model Engine Advertised
Horse Power
Engine Family
Federal Emission
Certification Standard
Evap Family Test ID Number
VIN Aging Fuel
Emissions Test
Date Odometer(Miles)
End 5/14/2010 120147Start 7/6/2009 4039End 6/29/2010 120397Start 7/6/2009 4040End 10/20/2011 120156Start 5/13/2011 19618End 5/19/2010 120145Start 7/11/2009 4033End 6/24/2010 120259Start 7/11/2009 4032End 10/28/2011 120140Start 4/27/2011 16235End 5/7/2010 120131Start 7/6/2009 4044End 6/15/2010 120273Start 7/6/2009 4029End 10/31/2011 120111Start 5/4/2011 12294End 5/25/2010 120192Start 7/11/2009 4033End 6/17/2010 120246Start 7/12/2009 4037End 11/10/2011 120102Start 5/13/2011 11716End 12/28/2010 141628Start 9/8/2010 91525End 12/2/2010 146186Start 6/22/2010 95340End 2/4/2011 139898Start 10/16/2010 89550End 12/2/2010 153194Start 7/5/2010 103069End 12/2/2010 135788Start 7/13/2010 85481End 2/1/2011 120226Start 8/26/2010 69965
2009 Honda Odyssey
2009 Ford Focus
2009 Toyota Camry
2009 Saturn Outlook
3.5L V6
2.0L I4
2.4L I4
3.6L V6
244
140
158
281
9HNXT03.5J29
9FMXV02.0VDX
9TYXV02.4BEA
9GMXT03.6151
Tier 2 Bin 5
Tier 2 Bin 4
Tier 2 Bin 5
Tier 2 Bin 5
9HNXR01562EA
9FMXR0125NAA
9TYXR0130A12
9GMXR0197972
5FNRL38229B024871
5FNRL38229B024876
5FNRL38289B033459
1FAHP35N29W172017
1FAHP35NX9W178664
RE0
RE15
RE20
RE0
RE15
YFMXR0080BBE
RE0
RE15
2000Honda Accord 2.3L I4 135 YHNXV02.3PF3 NLEV YHNXR0130AAA
1HGCG5649YA027642 RE0
RE20
5GZER13D59J180937
5GZER13D49J181741
5GZER13D39J197980
2000Ford Focus 2.0 I4 110 YFMXV02.0VF2 NLEV
1FAFP34P4YW422950 RE20
1HGCG5647YA153420 RE15
1HGCG5649YA049592 RE20
128422
1FAFP34P3YW412653 RE0
1FAFP34P9YW400216 RE15
RE20
RE0
RE15
RE20
4T1BE46K89U375470
4T1BE46K79U892484
4T1BE46K79U288823
1FAHP36N89W168617
128414
128415
128424
128416
128417
102021
128418
128419
128423
128420
128421
128425
101021
101015
101022
102001
102015

Comparative Emissions Testing of Vehicles Aged on E0, E15 and E20 Fuels
5
purchase, had no pending or active MILs or DTCs, and had trouble-free history per Carfax checks. The vehicles were confirmed to have no exhaust leaks, no evaporative emissions system leaks, and no aftermarket modifications. The baseline emissions tests for the RE20 vehicles were performed with less than 20,000 odometer miles per Table 1. The 2009 vehicles were aged on mileage accumulation dynamometers (Section 3.3) and emissions tests were performed at approximately 60,000, 90,000, and 120,000 miles on the odometer (Table 2). The control vehicles were exposed only to RE0 and Cert_E0 ethanol-free fuels throughout the aging period and test process (fuels defined in Section 4). The RE15 vehicles were aged on RE15 fuel, and emissions tests were performed using Cert_E15 fuel, and then Cert_E0 fuel at each mileage interval. Likewise, the RE20 vehicles were aged on RE20 fuel, and emissions tests were performed using Cert_E20 fuel, and then Cert_E0 fuel at each mileage interval. Two makes and models were tested from the 2000 model year. Both the 2000 Accord and 2000 Focus were certified to EPA NLEV standards. The cars were recruited from the public fleet by others and provided to SGS-ETC for testing. Significant operational problems and failures were encountered with some of the model year 2000 cars provided (Section 5), and testing was restarted with spare vehicles to complete the test matrix. Only the vehicles that completed the test matrix are included in Table 1 and in the results sections. The starting odometers were within 6,000 miles of each other for the 2000 Accord cars aged on RE0, RE15 and RE20 fuels. The starting odometers for the 2000 Focus cars were significantly different, with the Focus RE0 having the highest starting mileage of 103,069 miles, about 33,000 miles higher than Focus RE20. The model year 2000 vehicles were aged on mileage accumulation dynamometers (Section 3.3). Emissions tests were performed at the starting mileage, and following approximately 25,000 and 50,000 miles of aging (Table 2). The emissions tests were performed in triplicate for each vehicle and fuel combination, at each mileage interval. Occasionally, additional emissions tests were performed if the results had high variability. Triplicates were performed to allow calculation of 95% confidence intervals while maintaining a reasonable budget. Confidence intervals were calculated using the Student-T distribution for small sample sizes. The test matrix was constructed so one can determine the effect of the aging fuel on vehicle exhaust emissions. It was of interest to determine if the addition of ethanol in gasoline impacts the vehicle emissions as the vehicle ages. In addition, the matrix allowed a comparison of exhaust emissions for the same vehicle fueled on ethanol-containing and ethanol-free fuels, by performing back-to-back tests at each mileage interval. In this report, “Model RExx” refers to a vehicle model that was aged on RExx fuel. For example, “Odyssey RE20” refers to a Honda Odyssey that was aged on RE20 fuel, but emissions tested on either Cert_E20 or Cert_E0 fuels.

Comparative Emissions Testing of Vehicles Aged on E0, E15 and E20 Fuels
6
Table 2. Vehicle Test Matrix and Fuels
3.2 Vehicle Preparation
The vehicles were modified for testing, including the following:
• An ignition key switch relay was added to allow automated vehicle shutdown on the mileage accumulation dynamometer.
• K-type thermocouples were added in the exhaust stream, at the engine-out and between catalyst locations.
• K-type thermocouple was affixed to the upper radiator hose to measure coolant outlet temperature.
• K-type thermocouple was added to measure engine oil temperature, in the oil dipstick tube. • K-type thermocouple was added to measure transmission oil temperature. • A quick-disconnect fitting was added for oil pressure measurement. • A fuel drain hose with Schrader fitting was added to the engine fuel supply line to facilitate rapid
fuel drains. Note that this drain hose was found to be permeable and not used for SHED tests. • Pipe thread fittings (“bungs”) were added to the exhaust system pipes and stainless steel tubes
were run to the side of the car to allow for raw exhaust emissions sampling. • The gas pedal was modified to allow attachment of throttle actuator for driverless mileage
accumulation.
Model Year Vehicle Number
Aging Fuel
Baseline Test
(<20,000 Miles)
60,000 Miles
90,000 Miles
120,000 Miles
Cert_E0 Cert_E15 Cert_E15 Cert_E15Cert_E15 Cert_E0 Cert_E0 Cert_E0Cert_E0 Cert_E20 Cert_E20 Cert_E20
Cert_E20 Cert_E0 Cert_E0 Cert_E0
Model Year Vehicle Number
Aging Fuel
Baseline Test
(Starting Odometer)
Starting Odometer + 25,000
miles
Starting Odometer + 50,000
miles
Cert_E0 Cert_E15 Cert_E15Cert_E15 Cert_E0 Cert_E0Cert_E0 Cert_E20 Cert_E20
Cert_E20 Cert_E0 Cert_E0
2009 Model Year Vehicles
Cert_E0 Cert_E0 Cert_E0 Cert_E0
Vehicle #3
RE0
RE15
RE20
2000 Model Year Vehicles Vehicle #2
Vehicle #1
Emissions Test Mileage andEmissions Test Fuel
Emissions Test Mileage andEmissions Test Fuel
Vehicle #1
Vehicle #2
Vehicle #3
RE0
RE15
RE20
Cert_E0 Cert_E0 Cert_E0

Comparative Emissions Testing of Vehicles Aged on E0, E15 and E20 Fuels
7
• The vehicle traction control was defeated to allow for “rolls mode” testing on the chassis dynamometer.
• Wheel rims were color-coded to designate which wheels were to be used for mileage accumulation (YELLOW) and which wheels were to be used for emissions testing (RED). The intention was to use the same tires for all emissions tests to minimize any rolling resistance differences.
• Labels were affixed to each car to clearly designate the vehicle ID, thermocouple locations, emission sample lines, and refueling requirements.
Log books were placed in each vehicle, to record each refueling and maintenance event and record mileage accumulation progress.
The new vehicles were degreened under controlled conditions in the chassis dynamometer laboratory. The cars were run to 4000 miles, which is the mileage at which the engine-catalyst system combination is considered stabilized for emission data testing per EPA 40CFR86.095-26(b)(4)(ii)(A). The degreening was performed using ethanol-free fuel over the EPA Standard Road Cycle (Section 3.3). 3.3 Aging on Mileage Accumulation Dynamometers
The vehicles were aged using eight eddy-current mileage accumulation dynamometers (also known as “MADs,” Figure 1) using the EPA Standard Road Cycle (SRC). The SRC is a geometric cycle that has series of prescribed accelerations, cruises and decelerations. The cycle has an average speed of 46.3 mph and a peak cruise speed of 75 mph (Figure 2).
The vehicles were aged in a very consistent and controlled manner on the MADs. The laboratory is fully automated and eliminates many of the risks and intangibles associated with on-road and on-track aging.
The vehicles were aged in a driverless manner, using a throttle (gas pedal) actuator and braking action provided by the eddy-current power absorber. Independent closed loop controllers were used for the dynamometer and the vehicle throttle actuator. During accelerations and cruises, the dynamometer controller determined the roll torque setpoint using a model for inertia simulation and road load, and the vehicle throttle controller was used to achieve the target vehicle speed. During decelerations, the vehicle throttle was completely released and the dynamometer braked the vehicle in the speed control mode of operation.

Comparative Emissions Testing of Vehicles Aged on E0, E15 and E20 Fuels
8
Figure 1. Test Vehicles Operating on the Mileage Accumulation Dynamometers Photos by SGS Environmental Testing Corporation

Comparative Emissions Testing of Vehicles Aged on E0, E15 and E20 Fuels
9
Figure 2. Typical Vehicle Speed Compared to SRC, for Emissions Dyno Lab with Driver (upper) and Mileage Accumulation Dyno without Driver (lower), 2009 Toyota Camry RE0
Great care was taken to ensure realistic vehicle operation on the MADs. Road load derivations were first performed on the Burke Porter dynamometers used in the emissions labs, per SAE J2264. The vehicle was driven on the Burke Porter dyno to accurately determine wheel power over the SRC and over steady state cruise events. The vehicle was then moved to the MAD and the road load model was adjusted to match the power absorption measured on the Burke Porter dyno system and energy over the SRC. This process was performed for each vehicle model to ensure the vehicle was being loaded properly during the aging process.
The throttle actuator controllers were tuned to find the best compromise between meeting the SRC prescribed acceleration rates while minimizing vehicle speed overshoot. A typical example of automated control of the vehicle over the SRC is shown in Figure 2, lower. Whereas small speed overshoots are evident for this particular vehicle on the MADs, detuning the throttle controller would have resulted in acceleration rates below the SRC rates.
The automation system continuously monitored engine and transmission fluid temperatures, exhaust temperatures, oil pressure and vehicle speed. Warnings or alarms were triggered to protect the vehicle from

Comparative Emissions Testing of Vehicles Aged on E0, E15 and E20 Fuels
10
overheating or catastrophic failure in the event of a vehicle or laboratory malfunction. These signals were recorded at 1Hz, providing a record of the aging process.
The vehicles were shut down for periodic refueling. The vehicles remained strapped to the dynamometer during the fueling process. During each refueling event, a technician checked oil level, inspected the car, and checked for MILs prior to restarting the aging cycle.
A mileage accumulation rate of about 1050 miles per day per vehicle was achieved on days with no interruptions. Over 1.63 million miles were accumulated for the study. Up to eight vehicles were aged simultaneously over a 24 hour / 7 days per week operation, with an attendant on site to perform refueling and inspection tasks.
3.4 Preparation for Emission Testing
Each vehicle was operated on its emissions test fuel (Cert_Ex) for the last 500 miles on the mileage accumulation dynamometer prior to emissions testing. The vehicle was therefore completely purged of the aging fuel and conditioned on the test fuel at the start of the test sequence. Prior to emissions testing at each mileage interval, the following preparations were made:
• The vehicle was washed without soap. • Front and rear wheels were switched, so the same tires were used for all emissions tests. • Basic maintenance items were checked (fluids, hoses, belts, tires). • An OBD scan was performed to verify the vehicle was in a state of I/M readiness. • The vehicle exhaust system was leak checked. • A pressure decay check was performed for the vehicle evaporative emissions system. For the car at
soak conditions, the evaporative emissions system was pressurized with shop air to 13” H2O through the canister vent. Pressure should not decay over 5 minutes.
• Vehicle was stored in temperature and humidity controlled soak area for the duration of testing. • A dynamometer road load derivation was performed at each mileage interval, as is best practice for
vehicles accumulating this amount of miles.
The dyno set / vehicle loss ABC road load coefficients were very similar for all three vehicles within the vehicle model group, and did not change significantly as the cars aged. Typical variation in road load derivation result is shown as a function of speed in Figure 3.

Comparative Emissions Testing of Vehicles Aged on E0, E15 and E20 Fuels
11
Figure 3. Road Load Derivation Results for 2009 Ford Focus #128417 (RE0) and #128422 (RE20) at each Mileage Interval
3.5 Emissions Test Procedure
For vehicles returning from aging on the MADs, a WOT catalyst sulfur purge test was run before emissions tests were performed. The WOT test, also known as the EPEFE cycle and further described in the CRC E-87 study [Ref 1], consists of a series of 10 WOT accelerations that significantly elevated the exhaust temperatures to promote sulfur purge from the catalyst. During this cycle, exhaust temperatures, lambda and OBD fuel trim data were logged to compare vehicle behavior for different fuels. Lambda was measured at the engine-out location and is defined as the actual air-to-fuel ratio divided by the stoichiometric air-to-fuel ratio. The results were analyzed to determine if each vehicle model used adaptive controls to further enrich fueling during open loop WOT accelerations, when fueled with ethanol-containing fuels (Table 3).
Table 3. Adaptive Controls During WOT Accelerations
All exhaust emissions results presented are for tests following the sulfur purge, unless otherwise indicated. Early in the study, a few tests were run before and after the sulfur purge, to quantify the effect on exhaust emissions (Section 6.7).
0
20
40
60
80
100
120
140
0 20 40 60 80
Road
Load
(lbs
)
Vehicle Speed (mph)
128417 4k128417 60k128417 90k128417 120k128422 16k128422 60k128422 90k128422 120k
Legend: Car ID#, Mileage
For Vehicles Tested on Both Ethanol-Free and Ethanol-Containing Fuels →
Did Adaptive Controls Further Enrich Fueling for Ethanol-Containing Fuels
During WOT Accelerations?
2009 Odyssey No2009 Focus Yes2009 Camry Yes2009 Outlook Yes2000 Accord No2000 Focus No

Comparative Emissions Testing of Vehicles Aged on E0, E15 and E20 Fuels
12
A sequence identical to the federal supplemental certification test was then performed per 40CFR86 Subpart B. In summary this sequence included:
a) Fuel drain and 40% fill b) Soak 6-36 hours c) LA4 dynamometer prep cycle d) Fuel drain and 40% fill within 1 hour of prep cycle completion e) Canister load with nitrogen/butane to 2g breakthrough f) Soak 12-36 hours g) Cold Start FTP75 3 bag dynamometer emissions test
Steps c) to g) were then repeated twice, to collect triplicate emissions data.
For select vehicles, SHED tests were then performed per Section 3.6 and included these additional steps:
h) 1 hour hot soak SHED test started within 7 minutes following emissions test i) Soak 6-36 hours j) 2-day diurnal SHED test, 72-96-72°F
Vehicles aged on RE15 and RE20 fuels also required additional emissions testing using Cert_E0 fuels, per the Test Matrix, Table 2. For these vehicles, the following steps were performed for the fuel changeover and to complete the emissions testing:
k) Fuel drain and 40% fill with Cert_E0 l) Start and idle for 2 minutes m) Fuel drain n) Key on for 30 seconds to confirm tank empty using fuel gage o) 40% fill with Cert_E0 p) Four LA4 dynamometer prep cycles q) WOT sulfur purge cycle r) Soak 6-36 hours s) LA4 dynamometer prep cycle t) Fuel drain and 40% fill with Cert_E0 within 1 hour of prep cycle completion u) Canister load with nitrogen/butane to 2g breakthrough v) Soak 12-36 hours w) Cold Start FTP75 3 bag dynamometer emissions test
Steps s) to w) were then repeated twice, to collect triplicate emissions data for Cert_E0 fuel.
Emissions tests were performed in certification-compliant emissions laboratories at SGS Environmental Testing Corporation (Figure 4). The SGS-ETC laboratories feature Burke Porter 48” rolls in a temperature and humidity controlled environment. All SGS laboratories feature constant volume sampling system (CVS), raw modal and dilute bag gas sampling and analysis. Regulated emissions measurement included CO, CO2, NOx, total HC, and methane. The following equipment and methods were used to ensure accurate measurement of the very low emission concentrations from these vehicles:
• Bag samples were simultaneously collected from the diluted vehicle exhaust and from the ambient, to ensure quantification of the background, and accurate calculation of cycle average exhaust mass emissions.

Comparative Emissions Testing of Vehicles Aged on E0, E15 and E20 Fuels
13
• Continuous engine-out and tailpipe raw emissions measurements were made to provide information on catalyst conversion efficiency.
• Non methane hydrocarbons (NMHC) were equal to the FID total hydrocarbons minus the response
factor-corrected methane. Methane measurement was by GC FID.
• Low range gas analyzers and low concentration span gas bottles were used to ensure appropriate analyzer response and resolution, per SGS-ETC normal operating practice.
• Fuel consumption was calculated using the carbon balance method, accounting for actual mass
fractions of carbon, hydrogen and oxygen in the fuel (Section 4). Fuel economy was calculated using the “uncorrected method”. The older EPA corrected calculation for MPG, per 40CFR600.113-08(h)(1), was not applicable for oxygenated fuels.
Tests were performed by multiple drivers on multiple dynamometer test sites.
Figure 4. Saturn Outlook RE20 Installed in Chassis Dynamometer Emissions Laboratory Photo by SGS Environmental Testing Corporation
The emissions test sequence was conducted like a certification test sequence, with the following deviations:
• EPA certification fuel is ethanol-free, whereas Cert_E15 and Cert_E20 fuels were splash blended with ethanol and did not conform to a certification fuel standard.
• Raw exhaust measurements were made to determine catalyst efficiency.

Comparative Emissions Testing of Vehicles Aged on E0, E15 and E20 Fuels
14
• An Innova photoacoustic analyzer was used to draw sample from the ambient and sample bags, with the intention of measuring ethanol concentration.
Attempts were made to use an Innova photoacoustic analyzer to measure ethanol concentration from ambient and bag samples. The method was not successful as a correlation between ethanol and total hydrocarbon mass was not established for the vehicles tested with ethanol-containing fuels. The authors believe that ethanol hang-up in the sample stream, the very short time available for sample reads from the bags, and the very small ethanol concentrations were all contributors to measurement error. The authors endorse the impinger and gas chromatograph analysis method for alcohol measurement in vehicle exhaust, per [Ref 6].
3.6 SHED Test Procedure
Whereas vehicle evaporative emissions testing was beyond the scope of work in the subcontracts, SGS-ETC contributed SHED testing to the project. The objective of the tests was to gain some early comparative information about the evaporative emissions from 2009 vehicle models aged on RE0 and RE15 fuels.
2-day diurnal evaporative emissions tests were performed following the FTP75 exhaust emissions tests, at start (4,000-5,500), 60,000, 90,000 and 120,000 mileage events.
Four vehicles were aged on RE0 fuel and four aged on RE15 fuel using mileage accumulation dynamometers. Since the vehicles accumulated about 1,000 miles per day during 24hour/7day per week aging on the MADs, the evaporative emissions systems were not exercised as would be under real-world driving. On the MADs, the vehicles experienced far fewer refuel, diurnal, and canister purge events compared to real-world operation, and also had a shorter duration of fuel exposure. Nevertheless, the test approach provided some timely, comparative data on evaporative emissions from vehicles aged on RE0 and RE15 fuels. The authors have subsequently performed a more rigorous study comparing the durability of automotive evaporative emissions systems exposed to E0 and E20 fuels (CRC E-91, [Ref 7]).
For the present study, evaporative emissions tests were run per Federal Test Procedure Supplemental Evaporative Test (“2-Day Diurnal” sequence) using a SHED test fixture (Figure 5). The tests were performed using both Cert_E0 and Cert_E15 test fuels.
In preparation for testing:
• The windshield washer bottles were drained and flushed with water. There was no need to refill the washer fluid throughout the duration of the program since the vehicles were captive.
• The vehicles were washed without soap. • The “aftermarket” fuel drain hose used to aid fuel drain and fills was removed prior to the prep
cycle for all SHED testing as these hoses were determined to be permeable. The fuel supply hose connection was returned to stock configuration prior to each prep cycle.
• The vehicles did not have service ports, so canisters were butane-loaded through a modified gas cap. The stock gas cap was reinstalled after the completion of the canister load, during the soak period.
• Note that there was no attempt made to soak the vehicle at elevated temperatures to “off-gas” or “bake-off” residual hydrocarbons prior to the initial tests, and the vehicles had newer tires.

Comparative Emissions Testing of Vehicles Aged on E0, E15 and E20 Fuels
15
Baseline Evaporative Emissions Tests
All vehicles were SHED tested after approximately 4,000 miles of run-in, on high altitude Cert_E0 fuel (conforming to 40CFR86.113-04).
One vehicle from each 2009 model group was then refueled on Cert_E15 fuel. Fuel conditioning after the initial fuel change included:
• Approximately 1,000 miles of vehicle operation using the Standard Road Cycle • Exposure to Cert_E15 fuel, in the fuel tank for approximately 2 months before exhaust emissions
and SHED testing was performed (September to November/December 2009).
The RE15 vehicles were then retested in SHED, using Cert_E15 fuel, at approximately 5,400 miles.
Evaporative Emissions Tests at 60000, 90000 and 120000 Mile Events
Control vehicles aged using RE0 fuel were retested at 60,000, 90,000 and 120,000 miles. These vehicles were switched to Cert_E0 fuel for last 500 miles of each aging interval. SHED testing was performed using Cert_E0 fuel after the triplicate exhaust emissions tests were completed.
The vehicles aged using RE15 fuel were retested at 60,000, 90,000 and 120,000 miles. These vehicles were switched to Cert_E15 fuel for last 500 miles of each aging interval. SHED testing was performed using Cert_E15 fuel after the triplicate exhaust emissions tests were completed.
Figure 5. Saturn Outlook RE15 Following Completion of a 2-Day Diurnal SHED Test Photo by SGS Environmental Testing Corporation

Comparative Emissions Testing of Vehicles Aged on E0, E15 and E20 Fuels
16
4.0 Fuels
Different fuels were used for aging the vehicles and for emissions testing, in order to economically complete the test plan. Fuel descriptions and properties are shown in Table 4. Each row in this table represents a different batch of fuel used over the duration of the study.
The fuels used for aging had an “R” prefix, designating them as “Road Fuels.” RE0 is ethanol-free gasoline that was purchased in bulk directly from a local fuel terminal. RE0 is a finished market fuel, an ethanol-free gasoline that had nominal 85 octane rating (R+M)/2, the standard octane for regular unleaded fuel in the Denver area. The RE0 fuel was purchased from the same terminal, Suncor, for the duration of the model year 2009 RE0 and RE15 vehicles tests. In September 2010, a switch was made to a different terminal, Magellan. The RVP of the road fuels varied seasonally (Table 4), and this was desirable since the cars were aged outdoors. Due to the length of the study it was not possible to maintain a common batch of fuel used for vehicle aging.
This same ethanol-free base fuel was splash blended with fuel-grade ethanol to produce the RE15 and RE20 fuels. The fuel grade ethanol was denatured with about 3% isopentane. Ethanol is known to boost the octane rating of gasoline. Therefore the octane rating of the road aging fuel increased in proportion to the ethanol content.
Fuel “Cert_E0” was an ethanol-free high altitude certification gasoline conforming to 40CFR86.113-04. This certification fuel was splash blended with fuel grade ethanol to produce the Cert_E15 and Cert_E20 fuels. Fuels with the “Cert” prefix were used for all emissions tests in the study.
For both aging fuels and emissions fuels, blending was done volumetrically and the ethanol blend concentration was verified on site using a Wilks infrared spectrometer and also by the ethanol water extraction method. Blend concentration was held to within ±1% tolerance by volume.
Samples of the fuels were collected periodically and sent to an outside laboratory for analysis. Results from the laboratory analysis and from the Certificate of Analysis are combined in Table 4. Fuel property analysis confirmed the ethanol-free fuels contained <0.1% ethanol.

Comparative Emissions Testing of Vehicles Aged on E0, E15 and E20 Fuels
17
Table 4. Fuel Batches and Fuel Property Summary
FuelDescription
SampleName / Date
%-EtOHSpec
%-EtOH(vol%)
RVP(psi)
LHV(BTU/lbm) SG S
(ppm)Ttl Arom
(wt%)C
(wt frac)H
(wt frac)O
(wt frac) H:C O:C T10(°F)
T50(°F)
T90(°F)
ASTM Method → - D5599 D5191 D240N D4052 D5453D5580 or
D1319 D5291 D5291 D5599 - - D86 D86 D86
RE0 7/17/09 0% 0.0% 7.2 18132 0.7494 36 - 0.8634 0.1313 - 1.812 - 137 220 333RE0 1/19/10 0% 0.0% 12.4 18707 0.7311 33 - 0.8656 0.1379 0.0000 1.898 0.000 105 204 327RE0 3/9/10 0% 0.0% 13.3 18652 0.7028 17 - 0.8665 0.1368 0.0000 1.881 0.000 104 200 313RE0 4/21/10 0% 0.0% 8.9 18609 0.7407 15 - 0.8676 0.1346 0.0000 1.849 0.000 125 207 308RE0 5/13/10 0% 0.0% 7.6 18480 0.7481 18 42 0.8708 0.1296 0.0000 1.773 0.000 132 201 304RE0 6/15/10 0% 0.0% 6.8 18582 0.7423 50 34 0.8639 0.1359 0.0000 1.875 0.000 137 205 316RE0 9/02/10 0% 0.0% 7.4 18581 0.7511 31 37 0.8642 0.1311 0.0000 1.808 0.000 138 222 329RE15 8/19/09 15% 15.0% 8.5 17404 0.7568 37 - 0.8077 0.1308 0.0547 1.930 0.051 131 163 324RE15 1/19/10 15% 17.7%* - 17223 0.7571 17 31 0.8121 0.1328 0.0646 1.949 0.060 132 165 326RE15 3/9/10 15% 15.4% - 17500 0.7374 21 - 0.8094 0.1350 0.0576 1.987 0.053 107 158 304RE15 4/21/10 15% 14.2% 10.1 17483 0.7458 17 29 0.8132 0.1349 0.0526 1.977 0.049 122 159 305RE15 5/13/10 15% 14.0% 9.3 17475 0.7500 16 30 0.8151 0.1309 0.0513 1.914 0.047 128 160 307RE15 6/15/10 15% 14.4% 8.1 17479 0.7546 32 30 0.8129 0.1335 0.0526 1.957 0.049 131 164 322RE15 7/01/10 15% 14.0% 8.8 17507 0.7473 28 30 0.8142 0.1359 0.0518 1.989 0.048 126 163 305RE15 9/02/10 15% 15.1% 8.1 17246 0.7570 26 31 0.8079 0.1313 0.0551 1.937 0.051 131 163 323RE20 7/01/10 20% 19.4% 8.5 17006 0.7525 21 29 0.7927 0.1342 0.0709 2.017 0.067 129 164 296RE20 9/02/10 20% 20.3% 8.0 17013 0.7584 18 29 0.7877 0.1309 0.0737 1.980 0.070 133 164 318RE20 6/14/11 20% 20.1% - - - - - - - 0.0744 - - - - -RE20 7/12/11 20% 20.5% - - - - - - - 0.0761 - - - - -RE20 8/26/11 20% 20.5% - - - - - - - 0.0761 - - - - -Cert E0 7/1/09 0% 0.0% 7.7 18360 0.7378 32 27 0.8641 0.1349 - 1.860 - 132 218 318Cert E0 3/31/10 0% 0.0% 7.9 18614 0.7416 24 30 0.8641 0.1359 0.0000 1.874 0.000 129 215 311Cert E0 4/21/10 0% 0.0% 7.8 18559 0.7437 26 - 0.8670 0.1335 0.0000 1.835 0.000 128 215 311Cert E0 8/9/10 0% 0.0% 8.1 18590 0.7382 42 27 0.8639 0.1361 0.0000 1.878 0.000 129 212 302Cert E0 9/02/10 0% 0.0% 7.9 18614 0.7385 48 35 0.8761 0.1358 0.0000 1.847 0.000 127 213 299Cert E0 12/20/10 0% 0.0% 8.0 18609 0.7388 40 29 0.8629 0.1371 0.0000 1.894 0.000 129 215 300Cert E0 4/22/11 0% 0.0% 7.9 18549 0.7420 18 30 0.8649 0.1351 0.0000 1.861 0.000 127 218 300Cert E0 6/8/11 0% 0.0% 7.9 18585 0.7397 18 28 0.8597 0.1403 0.0000 1.945 0.000 124 217 303Cert E15 (SS-56020-17) 9/28/09 15% 14.7% 8.4 17525 0.7501 15 - 0.8113 0.1351 0.0541 1.984 0.050 128 162 311Cert E15 (SS-56020-18) 9/28/09 15% 14.8% 8.5 17462 0.7502 15 - 0.8116 0.1336 0.0544 1.962 0.050 128 164 310Cert E15 4/21/10 15% 15.0% 8.7 17408 0.7488 20 - 0.8118 0.1344 0.0553 1.973 0.051 125 163 298Cert E15 9/02/10 15% 14.8% 8.6 17449 0.7492 22 30 0.8133 0.1327 0.0546 1.944 0.050 126 164 296Cert E20 9/02/10 20% 20.3% 8.3 17030 0.7525 20 29 0.7864 0.1316 0.0744 1.994 0.071 128 164 294Cert E20 (SS-56020-17) 5/20/11 20% 19.8% - - 0.7515 15 - 0.7969 0.1350 0.0725 2.019 0.068 - - -Cert E20 (SS-56020-18) 5/20/11 20% 19.7% - - 0.7516 14 - 0.7959 0.1338 0.0724 2.003 0.068 - - -Cert E20 9/15/11 20% 20.1% - - 0.7489 14 - 0.7928 0.1335 0.0738 2.007 0.070 - - -
* Alternative measurements using water extraction method and IR spectrometer confirmed ethanol content was within 15 ±1% by volume, contradicting this result
Cert E15
Cert E20
Distillation
RE0
RE15
RE20
Cert E0

Comparative Emissions Testing of Vehicles Aged on E0, E15 and E20 Fuels
18
5.0 Vehicle Maintenance and Operational Issues
Engine oil and filter changes were performed at 5,000 mile intervals throughout the mileage accumulation period. The same brand and viscosity of oil were used for each make and model for the duration of the testing. Emissions tests were always performed with aged engine oil. Manufacturer scheduled maintenance pertaining to the engine and powertrain was performed.
Cylinder compression and leak-down checks were performed following completion of the emissions testing at each aging interval, to determine if there were any significant durability issues arising from the RE15 and RE20 fuel exposure. The technician used standard mechanic-grade equipment to determine compression pressure and leak-down on a percentage basis. Small amounts of leakage were recorded as 0% in the logs. The intention of logging this data was to monitor for changes in compression pressure or leak-down over time, which could be an indicator of a piston ring, valve guide, and valve seat problems. The results from these checks are provided in Appendix 10.2. There was no compelling evidence of a compression problem with any of the vehicles over the course of the study.
The 2009 Honda Odyssey aged on RE0 fuel (#128414) had a MIL and DTC set during mileage accumulation starting at about 80,000 miles. The P0420 fault code (Catalyst System Efficiency Below Threshold - Bank 1) was reset and illuminated twice more leading up to 90,000 mile emissions test interval. The fault code re-appeared during the prep cycle for the first emissions test. A decision was made to not clear the MIL/DTC for emissions testing due to possible impact on adaptive controls. Following completion of the 90,000 mile emissions tests, further investigation revealed the Bank 1/Sensor 2 oxygen sensor had excessive signal noise. The sensor was replaced and the DTC did not reappear. The vehicle was driven on LA4 cycles until in a state of I/M readiness. Then the 90,000 mile emissions tests were repeated with the new sensor installed. Exhaust mass emissions were comparable before and after sensor replacement at 90,000 miles (Section 6.1). The 2009 Ford Focus aged on RE15 (#128417) experienced a transmission failure at 70,300 miles. Failure was related to excessive wear of the band for a planetary gear set. The transmission was replaced and mileage accumulation resumed. The 2009 Ford Focus aged on RE20 (#128422) experienced a similar transmission failure at 90,285 miles. The transmission was replaced and mileage accumulation was resumed. In both cases, the transmission could have been repaired rather than replacing the complete transmission. However, in the interest of time and in consideration of the cost differential, a decision was made to replace the complete transmission. Six 2000 Honda Accords were provided, in anticipation that these older vehicles may experience operational problems during the aging process. Several problems were encountered with the Accords:
• The original vehicle selected for aging on RE0 fuel (#101000) set a MIL (DTC P0420) after about 25,000 miles of aging (~130,000 miles on odometer). The emission test performed just prior to failure showed elevated levels of CO and NOx. Following the WOT and emissions tests, the vehicle was returned to mileage accumulation. After 1,000 additional miles, high catalyst outlet temperature (> 1550°F) triggered test shutdown. The catalyst monolith was found to be fractured and the front face partially melted. The vehicle was removed from study and a spare RE0 Honda Accord was used as replacement.
• A second RE0 Accord (#101001) experienced a transmission failure within the first 1,000 miles of
aging. The transmission was replaced and mileage accumulation was resumed. Following the 25,000 mile WOT and emissions tests (~116,000 miles on odometer), the vehicle was returned to mileage

Comparative Emissions Testing of Vehicles Aged on E0, E15 and E20 Fuels
19
accumulation. After about 3,200 additional miles of aging, a MIL was set (P0420) and the vehicle was manually shutdown for inspection. The catalyst monolith was found to be fractured and front face partially melted, with catalyst failure mode nearly identical to first RE0 vehicle failure. Data logged up to the time of failure showed the thermocouples upstream and downstream of the catalyst did not exceed 1,500°F during the WOTs that preceded the failure, and did not exceed 1,400°F on the MADs prior to failure. The vehicle was removed from the study. A third Honda Accord (#101021) was used as a replacement and completed 50,000 miles of aging without further incident.
• The car selected for aging on RE15 fuel (#101015) experienced two MIL illuminations at 40,000
accumulated miles (135,000 miles on odometer): a P0420 (catalyst efficiency) and a P1381 (cylinder position sensor interruption). There was no evidence of a catalyst temperature excursion when this fault occurred and the vehicle was shut down for inspection. The ignition coil, position sensor, and ignition module were replaced, and mileage accumulation was resumed. No further issues were observed.
• The original vehicle (#101020) selected for aging on RE20 fuel experienced an engine coolant boil-
over within the first 1,000 miles of mileage accumulation. The MAD temperature alarm was triggered and interrupted testing immediately but a boil-over still occurred. Inspection showed excessive engine oil contaminated the coolant, appearing as a sludgy substance. A head gasket failure was suspected but not verified. A spare vehicle was used as a replacement.
Five model year 2000 Ford Focus cars were provided, in anticipation that these older vehicles may experience operational problems during the aging process. The original Focus selected for aging on RE0 fuel (#102000) experienced a misfire on cylinders 2 and 3 (MIL set, and DTC P0302 and P0303) at about 8,000 accumulated miles (~95,000 miles on odometer). The fault was due to a failed plug wire which caused subsequent failure of ignition coil. The engine misfires resulted in high temperature catalyst exposure and deactivation of the catalyst coating. Catalyst deactivation was confirmed by emissions tests. The vehicle was removed from the program. A spare vehicle (#102001) was used as replacement.
6.0 Exhaust Emissions Results
The exhaust mass emissions data presented in this section were determined from the ambient and diluted exhaust bag measurements, and represent phase-weighted (“composite”) results over the FTP75 emissions test. Tabular data is presented in Appendix 10.1. For each vehicle, one set of results shows the minimum and maximum measurements made for the triplicate tests. Another set of results shows the 95% confidence intervals for the data, noting that three or more tests were performed for each event in the test matrix. Statistical analysis of this dataset was performed by others [Ref 3] and therefore not included in this report. Catalyst conversion efficiency information is provided as a means for determining if emissions changes were caused by a change in catalyst performance, and quantifies the catalyst performance change over the three phases of the FTP75 test. Catalyst conversion efficiency data is accompanied by normalized engine-out emissions, for vehicles tested on Cert_E0 fuel. For each graph, there are three data points representing each mileage interval. The data points are in chronological order from left to right.

Comparative Emissions Testing of Vehicles Aged on E0, E15 and E20 Fuels
20
6.1 2009 Honda Odyssey
All three Honda Odysseys had comparable baseline exhaust emissions and fuel economy at the start of the study (Figure 7). The emissions deterioration rate was considerably different for the vehicles and was affected by the ethanol content of the aging fuel. The vehicle aged with RE0 fuel had higher mean NMHC, CO and NOx emissions at 120,000 miles compared to its baseline emissions. The Odyssey aged using RE0 fuel also had higher NMHC, CO and NOx emissions at 120,000 miles compared to the vehicles aged on RE15 and RE20 with 95% confidence (Figure 8).
The higher emissions deterioration rate for the Odyssey RE0 does not appear to be related to the Bank 1/Sensor 2 oxygen sensor replacement that was made at approximately 90,000 miles (described in Section 5). After sensor replacement and conditioning to ensure I/M test readiness, the emissions were found to be comparable to the tests performed before the sensor change (Figure 6). Moreover, the emissions deterioration rate was higher for Odyssey RE0 even at 60,000 miles, well before the sensor fault had first occurred.
Figure 6. 2009 Honda Odyssey RE0 Emissions Before and After Sensor Change – Cert_E0 Fuel Bars Represent 95% Confidence Intervals
Both RE15 and RE20 fueled vehicles trended towards higher NOx emissions as the vehicles aged.
Exhaust emissions were nearly identical for the Odyssey RE15 tested using Cert_E15 and Cert_E0 fuels. Likewise, there was no statistical difference in exhaust emissions for Odyssey RE20 tested using Cert_E20 and Cert_E0 fuels (Figure 8). The lower fuel economy was expected for the vehicles tested on Cert_E15 and Cert_E20 fuels, and was in proportion to the lower energy density of these oxygenated fuels.
The Odysseys produced very repeatable results and were insensitive to different drivers relative to other vehicles in the study. The minimum and maximum measurements (Figure 7) had a small spread for most tests performed.
0
20
40
60
80
100
NMHC*1000 g/mi
CO*100 g/mi
NOx*1000 g/mi
Fuel Economy (MPG)
Odyssey RE0, Before Sensor Change
Odyssey RE0, After Sensor Change

Comparative Emissions Testing of Vehicles Aged on E0, E15 and E20 Fuels
21
Vehicle Odometer (Miles)
Figure 7. 2009 Honda Odyssey – Weighted FTP75 Exhaust Emissions Results Bars Represent Minimum and Maximum Data

Comparative Emissions Testing of Vehicles Aged on E0, E15 and E20 Fuels
22
Vehicle Odometer (Miles)
Figure 8. 2009 Honda Odyssey – Weighted FTP75 Exhaust Emissions Results Bars Represent 95% Confidence Intervals
Catalyst conversion efficiency data provided some information about the cause of higher emissions deterioration rates for Odyssey RE0 (Figure 9). Clearly, for the Phase 1 “505” cold start, the HC, CO and NOx catalyst conversion efficiency is poorer for Odyssey RE0 as it aged compared to the other vehicles. The engine-out CO remained relatively constant throughout the aging period. Engine-out NOx increased for Odyssey RE0 and RE15 from 60,000 to 120,000 miles, and therefore the engine-out emissions were also a factor in the higher NOx deterioration rates for those vehicles. Phase 1 engine-out NOx emissions increased by about 21% for Odyssey RE0 over the aging period.

Comparative Emissions Testing of Vehicles Aged on E0, E15 and E20 Fuels
23
Figure 9. 2009 Honda Odyssey Catalyst Conversion Efficiency over FTP75 Cycle

Comparative Emissions Testing of Vehicles Aged on E0, E15 and E20 Fuels
24
6.2 2009 Ford Focus
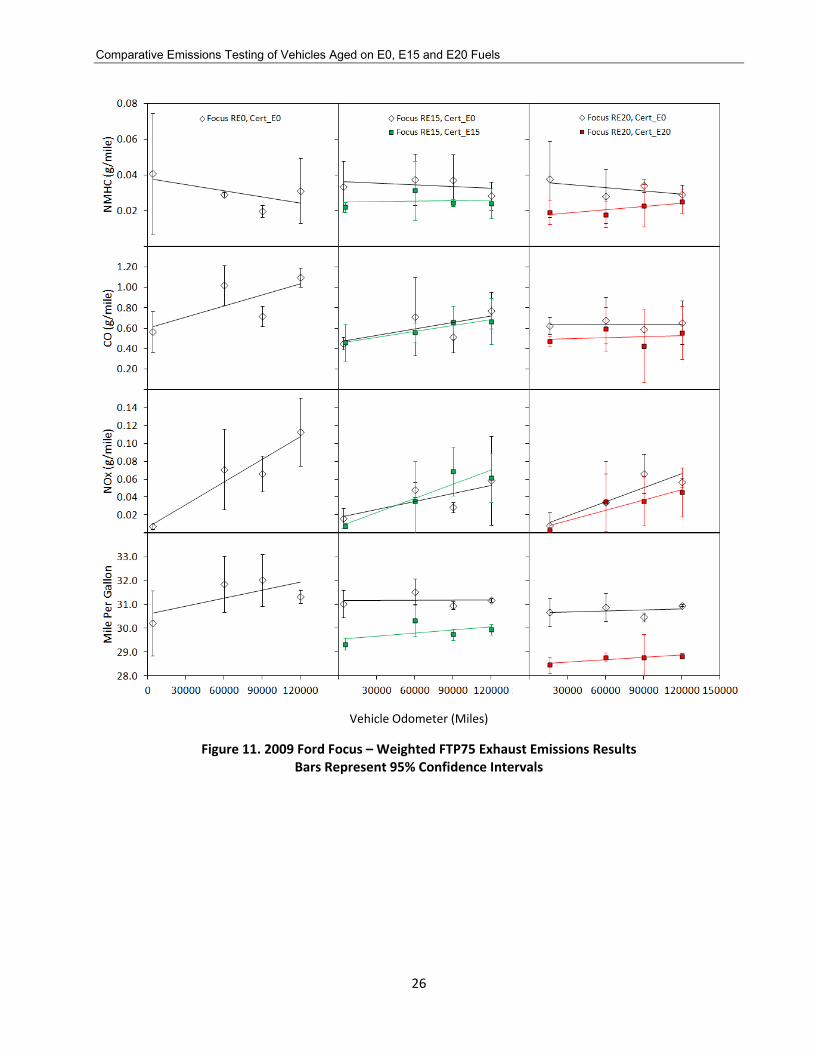
All three 2009 Ford Focus cars had comparable baseline exhaust emissions and fuel economy at the start of the study (Figure 10). All three vehicles tested had NOx emissions deterioration at 120,000 miles using Cert_E0 fuel, and the increase was shown to be statistically greater than the baseline starting emissions (Figure 11).
The 2009 Focus aged on RE0 fuel had NOx deterioration rates which on average trended considerably higher than the cars aged on RE15 and RE20 fuels. The NOx for Focus RE0 was statistically higher than Focus RE15 at 90,000 miles and statistically higher than Focus RE20 at 120,000 miles.
CO emissions were statistically higher for Focus RE0 compared to Focus RE15 and RE20 at 120,000 miles. NMHC emissions were not statistically different for the three vehicles over the aging period. NMHC (estimated NMOG) and CO emissions were well within Full Useful Life standards over the aging period.
Blending 15% to 20% ethanol into certification gasoline produced lower NMHC and CO emissions on average, relative to the same vehicles tested on ethanol-free certification gasoline. Fuel economy was 3.9% lower and 6.5% lower on average for vehicles tested using Cert_E15 and Cert_E20 fuels respectively, consistent with the lower energy density of the oxygenated fuel.
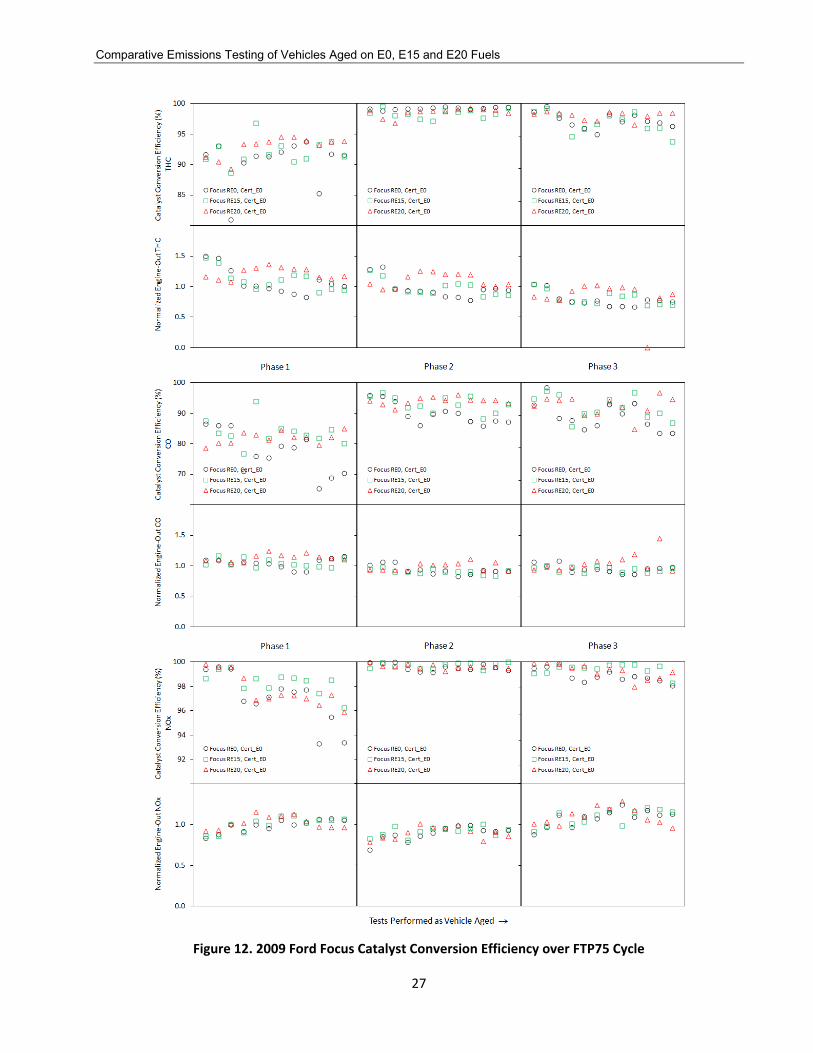
Raw modal emissions data showed CO and NOx conversion efficiency was lower for the Focus RE0 compared to the vehicles aged on RE15 and RE20 fuels at 120,000 miles (Figure 12). Phase 1 engine-out NOx emissions increased by about 18% for Focus RE0 over the aging period. The data suggests that both the engine-out NOx emissions and reduced catalyst conversion efficiency were contributors to the higher NOx emissions measured for Focus RE0.

Comparative Emissions Testing of Vehicles Aged on E0, E15 and E20 Fuels
25
Vehicle Odometer (Miles)
Figure 10. 2009 Ford Focus – Weighted FTP75 Exhaust Emissions Results Bars Represent Minimum and Maximum Data
Comparative Emissions Testing of Vehicles Aged on E0, E15 and E20 Fuels
26
Vehicle Odometer (Miles)
Figure 11. 2009 Ford Focus – Weighted FTP75 Exhaust Emissions Results Bars Represent 95% Confidence Intervals
Comparative Emissions Testing of Vehicles Aged on E0, E15 and E20 Fuels
27
Figure 12. 2009 Ford Focus Catalyst Conversion Efficiency over FTP75 Cycle

Comparative Emissions Testing of Vehicles Aged on E0, E15 and E20 Fuels
28
6.3 2009 Toyota Camry
All three Toyota Camrys had comparable baseline exhaust emissions and fuel economy at the start of the study (Figure 13). All three vehicles showed a general upward trend in NMHC, CO and NOx emissions over the aging period. The exhaust emissions at 120,000 miles were mostly higher, with statistical significance, for Camry RE0 and Camry RE20 compared to their baseline emissions (Figure 14).
Vehicle Odometer (Miles)
Figure 13. 2009 Toyota Camry – Weighted FTP75 Exhaust Emissions Results Bars Represent Minimum and Maximum Data

Comparative Emissions Testing of Vehicles Aged on E0, E15 and E20 Fuels
29
Vehicle Odometer (Miles)
Figure 14. 2009 Toyota Camry – Weighted FTP75 Exhaust Emissions Results Bars Represent 95% Confidence Intervals
After 120,000 miles of aging, the NMHC, CO and NOx emissions for Camry RE0 were statistically indistinguishable compared to the vehicles aged on RE15 and RE20 fuels. Exhaust emissions were nearly identical for the Camry RE15 tested using Cert_E15 and Cert_E0 fuels. Likewise, there was no statistical difference in exhaust emissions for Camry RE20 tested using Cert_E20 and Cert_E0 fuels (Figure 14). The Camrys had very high NOx conversion efficiencies across the catalyst, at or above 97% even for the Phase 1 cold start (Figure 15, disregarding the outliers).

Comparative Emissions Testing of Vehicles Aged on E0, E15 and E20 Fuels
30
Figure 15. 2009 Toyota Camry Catalyst Conversion Efficiency over FTP75 Cycle

Comparative Emissions Testing of Vehicles Aged on E0, E15 and E20 Fuels
31
6.4 2009 Saturn Outlook
All three Outlooks had comparable baseline exhaust emissions and fuel economy at the start of the study (Figure 16). Only Outlook RE0 had higher NMHC, CO and NOx emissions at 120,000 miles, compared to the baseline emissions measured at the start of the program. NMHC, CO and NOx emissions were higher for Outlook RE0 compared to the vehicles aged on RE15 and RE20 fuels after 120,000 miles of aging, with statistical confidence (Figure 17, and [Ref 3]).
Vehicle Odometer (Miles)
Figure 16. 2009 Saturn Outlook – Weighted FTP75 Exhaust Emissions Results Bars Represent Minimum and Maximum Data

Comparative Emissions Testing of Vehicles Aged on E0, E15 and E20 Fuels
32
Vehicle Odometer (Miles)
Figure 17. 2009 Saturn Outlook – Weighted FTP75 Exhaust Emissions Results Bars Represent 95% Confidence Intervals
The mean NMHC, CO and NOx levels trended lower over time for the Outlook RE20 tested using Cert_E20 fuel, relative to the same vehicle tested on Cert_E0 fuel (Figure 17). Outlook RE15 also had lower CO emissions on Cert_E15 fuel relative to Cert_E0 fuel over time. Fuel economy was 4.9% lower and 6.6% lower on average for vehicles tested using Cert_E15 and Cert_E20 fuels respectively, consistent with the lower energy density of the oxygenated fuel.
Outlook RE0 had lower catalyst conversion efficiencies at the start of testing and throughout the study (Figure 18), and also trended towards having higher engine-out emissions relative to the other vehicles.

Comparative Emissions Testing of Vehicles Aged on E0, E15 and E20 Fuels
33
Figure 18. 2009 Saturn Outlook Catalyst Conversion Efficiency over FTP75 Cycle

Comparative Emissions Testing of Vehicles Aged on E0, E15 and E20 Fuels
34
6.5 2000 Honda Accord
The Accords aged on RE0 and RE15 fuels had comparable baseline exhaust emissions and fuel economy at the start of the study (Figure 19). Accord RE20 had lower NMHC, CO and fuel economy when tested with Cert_E0 fuel at the start of the study. Accord RE0 and RE15 showed general deteriorations in NMHC, CO and NOx emissions over the aging period. The 120,000 mile NMHC and CO exhaust emissions were higher, with statistical significance, for Accord RE0 and RE15 compared to their baseline emissions (Figure 20). In contrast, the emissions for Accord RE20 did not change significantly during the 50,000 mile aging period.
Vehicle Odometer (Miles)
Figure 19. 2000 Honda Accord – Weighted FTP75 Exhaust Emissions Results Bars Represent Minimum and Maximum Data

Comparative Emissions Testing of Vehicles Aged on E0, E15 and E20 Fuels
35
Vehicle Odometer (Miles)
Figure 20. 2000 Honda Accord – Weighted FTP75 Exhaust Emissions Results Bars Represent 95% Confidence Intervals
The effect of the aging fuel on NMHC and NOx emissions was not statistically significant for the Accords as they aged. CO emissions from Accord RE0 were higher compared to Accords RE15 and RE20 at 120,000 miles with statistical confidence. The CO emission trends were not fully explained by the catalyst conversion efficiency data collected (Figure 21).
NMHC and NOx emissions were similar for the Accord RE15 tested using Cert_E15 and Cert_E0 fuels, and CO emissions were lower with Cert_E15 fuel. The exhaust emissions for Accord RE20 tested using Cert_E20 were statistically indistinguishable from emissions using Cert_E0 fuel (Figure 20).

Comparative Emissions Testing of Vehicles Aged on E0, E15 and E20 Fuels
36
Figure 21. 2000 Honda Accord Catalyst Conversion Efficiency over FTP75 Cycle

Comparative Emissions Testing of Vehicles Aged on E0, E15 and E20 Fuels
37
6.6 2000 Ford Focus
The 2000 Ford Focus cars were not as closely matched as other models tested in this study. The Focus aged on RE0 fuel started the program with about 103,000 miles, over 33,000 more miles than Focus RE20 (Table 1). The cars had somewhat comparable CO, NOx and fuel economy at the start of the aging period, but Focus RE0 had much higher NMHC emissions (Figure 22). These cars had much greater variation during testing than any other models in the study. Note in particular the large shifts in NMHC emissions that occurred at the 25,000 mile interval (midpoint) for Focus RE0 and RE15. Focus RE15 trended differently than the other vehicles.
Vehicle Odometer (Miles)
Figure 22. 2000 Ford Focus – Weighted FTP75 Exhaust Emissions Results Bars Represent Minimum and Maximum Data

Comparative Emissions Testing of Vehicles Aged on E0, E15 and E20 Fuels
38
Vehicle Odometer (Miles)
Figure 23. 2000 Ford Focus – Weighted FTP75 Exhaust Emissions Results Bars Represent 95% Confidence Intervals
There was no statistical evidence that the ethanol-containing aging fuels impacted the emissions from these vehicles (Figure 23). Similarly, there is no statistical evidence that the vehicle emissions were significantly different when tested using Cert_E0, Cert_E15 and Cert_E20 fuels, owing to the very different trends that were observed at different mileage intervals. Fuel economy was 3.0% lower and 6.2% lower on average for vehicles tested using Cert_E15 and Cert_E20 fuels respectively, consistent with the lower energy density of the oxygenated fuel.

Comparative Emissions Testing of Vehicles Aged on E0, E15 and E20 Fuels
39
Figure 24. 2000 Ford Focus Catalyst Conversion Efficiency over FTP75 Cycle

Comparative Emissions Testing of Vehicles Aged on E0, E15 and E20 Fuels
40
6.7 Catalyst Sulfur Purge Effects on Exhaust Emissions
Some data was collected to investigate the effect the WOT catalyst sulfur purge cycle had on the exhaust emissions. Whereas this was not a rigorously designed experiment and was beyond the assigned scope of work, the data demonstrates the sulfur poisoning effect on the catalyst during the aging process, and quantifies the effectiveness of the WOT sulfur purge cycle. Tests were performed on the 2009 vehicles aged on RE0 fuel, at 60,000 miles. Emissions tests were run in triplicate before and after the sulfur purge. A few individual tests were also performed before the sulfur purge, at 90,000 and 120,000 miles. The aging fuel RE0 averaged about 24ppm during the period these tests were performed, and the Cert_E0 fuel used for emissions tests and WOT tests averaged about 27ppm. The sulfur purge did not have an effect on lowering the Odyssey emissions (Figure 25). The sulfur purge did have an effect on the 2009 Focus mean CO and NOx emissions. Focus RE0 CO emissions were reduced by 14% on average, and NOx emissions were reduced by 31% on average following the WOT sulfur purge cycle. The sulfur purge lowered the THC and NOx emissions from the Camry at 120,000 miles (Figure 26). The sulfur purge also effected the mean exhaust emissions from the Outlook. CO emissions from Outlook RE0 were reduced by 15% on average, and NOx emissions were reduced by 25% on average following the WOT sulfur purge cycle.
Figure 25. Catalyst Sulfur Purge Effect on Emissions, Odyssey RE0 and Focus RE0
2009 Odyssey RE0 2009 Focus RE0

Comparative Emissions Testing of Vehicles Aged on E0, E15 and E20 Fuels
41
Figure 26. Catalyst Sulfur Purge Effect on Emissions, Camry RE0 and Outlook RE0
7.0 Evaporative Emissions Results – Tier 2 Vehicles
Whereas vehicle evaporative emissions testing was beyond the scope of work in the subcontracts, tests were performed to gain some early comparative information about the evaporative emissions from 2009 vehicle models aged on RE0 and RE15 fuels.
A summary of evaporative emission results are provided in Table 5. Some tests were performed using Cert_E0 fuel and others on Cert_E15 fuel as noted in the table. Note that the RVP of the Cert_E0 and Cert_E15 fuels are different (Table 4), as ethanol is known to increase the RVP of gasoline. The Cert_E15 RVP was about 0.7 psi higher than Cert_E0 on average over the duration of this testing. The fuel RVP difference is a consideration when comparing the SHED results, as vehicles tested with Cert_E15 fuel having higher RVP may have more potential for canister venting during the 2-day diurnal.
The SHED test results are compared with the 2009 EPA Federal Evaporative Emissions Standard in Figure 27. The relevant test metric for comparison is equal to the highest daily hydrocarbon mass plus the 1 hour hot soak hydrocarbon mass, as measured by the FID. This metric is compared to the 2009 EPA standard of 0.65 g/test for light duty vehicles (LDVs), and 0.85 g/test for light duty trucks (LDTs). Supplemental evaporative emissions results for all tests were under the 2009 Tier 2 evaporative emissions standards, for both Cert_E0 and Cert_E15 fuels.
It is acknowledged that these vehicles aged on the MADs experienced far fewer refuel, diurnal, and canister purge events compared to real-world operation, and also had a shorter duration of fuel exposure. Nevertheless, the test approach provides some comparative data that suggests the evaporative emissions were not significantly different for the vehicles aged on RE0 and RE15 fuels. The authors have subsequently performed a more rigorous study comparing the durability of automotive evaporative emissions systems exposed to E0 and E20 fuels (CRC E-91, [Ref 7]).

Comparative Emissions Testing of Vehicles Aged on E0, E15 and E20 Fuels
42
Table 5. Evaporative Emissions for 2009 Model Year Vehicles Aged on RE0 and RE15 Fuels
Vehicle ID#
Test ID #, 1Hr Hot Soak
Date, 1Hr Hot Soak
Test ID #, 2-Day Diurnal
Date, 2-Day Diurnal
Nominal Mileage Interval
Odometer (miles) Fuel
1 Hour Hot Soak
(g)
Day 1 Diurnal
(g)
Day 2 Diurnal
(g)
Total Diurnal
(g)2009 Honda Odyssey RE0
128414 S3_1440 7/27/2009 S3_1443 7/30/2009 4k 4099 Cert_E0 0.099 0.291 0.287 0.578128414 S1_1331 2/15/2010 S1_1332 2/17/2010 60k 60212 Cert_E0 0.013 0.194 0.162 0.356128414 S1_1380 3/30/2010 S1_1381 4/1/2010 90k 90138 Cert_E0 0.007 0.221 0.223 0.444128414 S5_1789 5/14/2010 S5_1790 5/17/2010 120k 120158 Cert_E0 0.041 0.456 0.427 0.883
2009 Honda Odyssey RE15128415 S5_1660 7/28/2009 S5_1662 7/31/2009 4k 4128 Cert_E0 0.041 0.355 0.314 0.669128415 S1_1290 12/15/2009 S1_1292 12/17/2009 4k 5516 Cert_E15 0.022 0.232 0.273 0.505128415* S3_1646 8/9/2010 S3_1647 8/12/2010 120k 120255 Cert_E0 0.026 0.311 0.352 0.663
2009 Ford Focus RE0128416 S3_1444 7/30/2009 S3_1445 8/1/2009 4k 4209 Cert_E0 0.017 0.214 0.208 0.422128416 S4_1511 2/24/2010 S4_1512 2/27/2010 60k 60105 Cert_E0 0.043 0.212 0.191 0.403128416 S3_1582 4/9/2010 S3_1583 4/11/2010 90k 90164 Cert_E0 0.016 0.158 0.177 0.335128416 S3_1612 5/19/2010 S3_1613 5/21/2010 120k 120156 Cert_E0 0.021 0.202 0.228 0.43
2009 Ford Focus RE15128417 S4_1402 7/27/2009 S4_1405 7/30/2009 4k 4111 Cert_E0 0.029 0.428 0.429 0.857128417 S3_1478 12/14/2009 S3_1479 12/17/2009 4k 5451 Cert_E15 0.035 0.292 0.281 0.573128417 S1_1375 3/15/2010 S1_1376 3/17/2010 60k 60145 Cert_E15 0.024 0.324 0.355 0.679128417 S3_1626 6/18/2010 S3_1627 6/21/2010 120k 120150 Cert_E15 0.015 0.196 0.227 0.423
2009 Toyota Camry RE0 128418 S1_1265 7/30/2009 S1_1266 8/1/2009 4k 4198 Cert_E0 0.027 0.274 0.257 0.531128418 S1_1328 2/12/2010 S1_1329 2/15/2010 60k 60075 Cert_E0 0.015 0.167 0.128 0.295128418 S1_1378 3/26/2010 S1_1379 3/29/2010 90k 90124 Cert_E0 0.017 0.205 0.175 0.38128418 S5_1780 5/3/2010 S5_1781 5/6/2010 120k 120131 Cert_E0 0.015 0.285 0.321 0.606
2009 Toyota Camry RE15128419 S1_1259 7/24/2009 S1_1260 7/27/2009 4k 4134 Cert_E0 0.046 0.178 0.25 0.428128419 S3_1480 12/18/2009 S3_1481 12/21/2009 4k 5647 Cert_E15 0.021 0.184 0.182 0.366128419 S3_1586 4/20/2010 S3_1587 4/22/2010 90k 90198 Cert_E15 0.018 0.2 0.229 0.429128419 S5_1802 6/2/2010 S5_1803 6/4/2010 120k 120085 Cert_E15 0.021 0.333 0.399 0.732
2009 Saturn Outlook RE0128420 S4_1406 7/31/2009 S4_1407 8/3/2009 4k 4155 Cert_E0 0.037 0.339 0.586 0.925128420 S4_1509 2/22/2010 S4_1510 2/24/2010 60k 60109 Cert_E0 0.032 0.319 0.501 0.82128420 S3_1578 4/3/2010 S3_1579 4/6/2010 90k 90167 Cert_E0 0.026 0.246 0.419 0.665128420 S5_1797 5/25/2010 S5_1798 5/28/2010 120k 120192 Cert_E0 0.03 0.374 0.521 0.895
2009 Saturn Outlook RE15128421 S4_1408 8/4/2009 S4_1409 8/6/2009 4k 4226 Cert_E0 0.053 0.492 0.786 1.278128421 S1_1293 12/18/2009 S1_1294 12/20/2009 4k 5629 Cert_E15 0.012 0.264 0.46 0.724128421 S5_1755 3/14/2010 S5_1756 3/17/2010 60k 60186 Cert_E15 0.021 0.33 0.538 0.868128421 S5_1778 4/28/2010 S5_1779 4/30/2010 90k 90193 Cert_E15 0.028 0.463 0.623 1.086128421 S3_1619 6/9/2010 S3_1620 6/11/2010 120k 120069 Cert_E15 0.031 0.275 0.448 0.723
*Testing after fuel tank filler hose replacement and 2 days aging on Cert_E0 certification fuel

Comparative Emissions Testing of Vehicles Aged on E0, E15 and E20 Fuels
43
Figure 27. Evaporative Emissions Results for 2009 Model Year Vehicles, on Cert_E0 and Cert_E15 Fuels
N/A
N/A
N/A
N/A
0.0
0.2
0.4
0.6
0.8
1.0
Star
t (4k
-5k)
60k
90k
120k
Star
t (4k
-5k)
60k
90k
120k
Star
t (4k
-5k)
60k
90k
120k
Star
t (4k
-5k)
60k
90k
120k
Mas
s (H
ighe
st D
ay +
1 h
r H
ot S
oak)
, g/t
est RE0 Contol Vehicle
RE15 Test Vehicle
Focus Camry Odyssey Outlook
2009 EPA LDV Std
2009 EPA LDT Std
Nominal Vehicle Mileage

Comparative Emissions Testing of Vehicles Aged on E0, E15 and E20 Fuels
44
8.0 Conclusions
The conclusions drawn here apply to the six vehicle models tested. These findings are not sufficient to make conclusions about the use of higher ethanol blends in the nation’s legacy vehicle fleet. The reader is referred to the DOE V4 Program Report [Ref 3] for a comprehensive statistical analysis of 82 vehicles, including 14 vehicles from this study.
• The vehicles aged on 15% and 20% ethanol-containing fuels did not produce higher exhaust emissions compared to control vehicles aged on ethanol-free fuel, for all six models tested in the study.
• Fuel economy was lower for vehicles tested on Cert_E15 and Cert_E20 fuels, and was in proportion to the lower energy density of these oxygenated fuels.
• Blends of 15% to 20% ethanol into certification gasoline either produced no change or lowered NMHC and CO emissions for each vehicle tested, relative to the same vehicle tested on ethanol-free certification gasoline. NOx emissions were not statistically different for each vehicle tested on ethanol-containing certification fuels, compared to the same vehicle tested on ethanol-free certification gasoline.
• The mean NOx emissions increased over the aging period for 17 of the 18 vehicles in the study. Of these vehicles, five were aged using RE0 fuel, six were aged using RE15 fuel, and six were aged using RE20 fuel.
• For four of the six models tested, the vehicle aged on RE0 fuel had higher exhaust emissions compared to the matched vehicles aged on RE15 or RE20 fuel. This finding contradicted the concern that higher ethanol content in gasoline may accelerate catalyst deterioration.
• The 2009 Honda Odyssey aged using RE0 fuel had higher NMHC, CO and NOx emissions at 120,000 miles compared to the vehicles aged on RE15 and RE20 with 95% confidence. The catalyst conversion efficiency for the HC, CO and NOx species was poorer for Odyssey RE0 as it aged compared to the other vehicles.
• NOx emissions from the 2009 Ford Focus aged using RE0 fuel were higher than Focus RE15 at 90,000 miles and higher than Focus RE20 at 120,000 miles with statistical confidence. All three vehicles in this set had significant deterioration of NOx emissions over the 120,000 mile aging period.
• There was no statistical difference in NMHC, CO and NOx emissions for the 2009 Toyota Camrys aged on RE15 and RE20 fuels compared to Camry RE0 after 120,000 miles of aging.
• NMHC, CO and NOx emissions were higher for 2009 Saturn Outlook RE0 compared to the vehicles aged on RE15 and RE20 fuels after 120,000 miles, with statistical confidence.
• The effect of the aging fuel on NMHC and NOx emissions was not statistically significant for the model year 2000 Honda Accords. CO emissions from Accord RE0 were higher compared to Accords RE15 and RE20 at 120,000 miles with statistical confidence.

Comparative Emissions Testing of Vehicles Aged on E0, E15 and E20 Fuels
45
• There was no statistical evidence that the ethanol-containing aging fuels impacted the exhaust emissions from the model year 2000 Ford Focus cars.
• There was no evidence of a cylinder compression problem with any of the vehicles over the course
of the study, based on periodic compression and leak-down tests performed.
• Evaporative emissions were measured for the 2009 Odyssey, Camry, Focus and Outlook as they aged to 120,000 miles on the mileage accumulation dynamometer. The limited data from this testing suggested the evaporative emissions were very similar for these vehicle models as they aged on RE0 and RE15 fuels. Supplemental 2-day evaporative emissions results for all tests were under the 2009 Tier 2 evaporative emissions standards, for both Cert_E0 and Cert_E15 test fuels. It is acknowledged that these vehicles aged on the MADs experienced far fewer refuel, diurnal, and canister purge events compared to real-world operation, and also had a shorter duration of fuel exposure.
• Emissions testing performed before and after the WOT catalyst sulfur purge cycle confirmed the sulfur purging produced a significant reduction in NOx emissions for two of the four vehicles tested. NOx emissions were reduced by 31% on average for the 2009 Ford Focus RE0, and by 25% on average for the 2009 Saturn Outlook RE0 following the catalyst sulfur purge.
9.0 References
1. Dudek, W., “CRC Project No. E-87-1 Mid-Level Ethanol Blends Catalyst Durability Study Screening,” Transportation Research Center Inc., June 2009.
2. Knoll, K., West, B., Clark, W., Graves, R., Orban, J., Przesmitzki, S., Theiss, T., “Effects of Intermediate Ethanol Blends on Legacy Vehicles and Small Non-Road Engines, Report 1 – Updated,” NREL/TP-540-43543 and ORNL/TM-2008/117, Feb. 2009.
3. West, B., Sluder, S., Knoll, K., Orban, J., Feng, J., “Intermediate Ethanol Blends Catalyst
Durability Program,” Oak Ridge National Laboratory Report ORNL/TM-2011/234, Feb. 2012.
4. US EPA, Partial Grant and Partial Denial of Clean Air Act Waiver Application Submitted by Growth Energy To Increase the Allowable Ethanol Content of Gasoline to 15 Percent; Federal Register, Vol. 75, No. 213, November 4, 2010. http://www.epa.gov/otaq/regs/fuels/additive/e15/index.htm
5. US EPA, Partial Grant of Clean Air Act Waiver Application Submitted by Growth Energy To Increase the Allowable Ethanol Content of Gasoline to 15 Percent; Decision of the Administrator, Federal Register, Vol. 76, No. 17, January 26, 2011.
6. “California Non-Methane Organic Gas Test Procedures,” Mobile Source Division, Monitoring and
Laboratory Division, Southern Laboratory Branch, July 2002.
7. Vertin, K., Glinsky, G., Mickelsen, J., Morgan, C., St. Denis, M., Roeschen, J., “CRC E-91 Evaporative Emissions Durability Testing,” Coordinating Research Council, August 2012.

Comparative Emissions Testing of Vehicles Aged on E0, E15 and E20 Fuels
46
10.0 Appendices
10.1 Exhaust Emissions Data Table
Vehicle Model, Aging Fuel, Emissions Fuel
Test Start Date
Vehicle No. Test No.
Odometer
(Miles)
WTD Bag THC
(g/mi)
WTD Bag
NMHC (g/mi)
WTD Bag CH4
(g/mi)
WTD Bag CO (g/mi)
WTD Bag NOx
(g/mi)
WTD Bag CO2
(g/mi)
WTD Fuel Econ (mpg)
Bag PH1 THC
(g/mi)
Bag PH1
NMHC (g/mi)
Bag PH1 CH4
(g/mi)
Bag PH1 CO (g/mi)
Bag PH1 NOx
(g/mi)
Bag PH1 CO2
(g/mi)
PH1 Fuel Econ (mpg)
Bag PH2 THC
(g/mi)
Bag PH2
NMHC (g/mi)
Bag PH2 CH4
(g/mi)
Bag PH2 CO (g/mi)
Bag PH2 NOx
(g/mi)
Bag PH2 CO2
(g/mi)
PH2 Fuel Econ (mpg)
Bag PH3 THC
(g/mi)
Bag PH3
NMHC (g/mi)
Bag PH3 CH4
(g/mi)
Bag PH3 CO (g/mi)
Bag PH3 NOx
(g/mi)
Bag PH3 CO2
(g/mi)
PH3 Fuel Econ (mpg)
Odyssey RE0, Cert_E0 5/14/10 128414 116320 120147 0.0527 0.0408 0.0121 0.7284 0.0677 440.4 20.09 0.1891 0.1720 0.0198 1.7254 0.2604 466.7 18.89 0.0152 0.0072 0.0091 0.4077 0.0044 456.0 19.44 0.0198 0.0095 0.0118 0.5755 0.0404 391.6 22.61Odyssey RE0, Cert_E0 5/13/10 128414 116312 120128 0.0603 0.0491 0.0115 0.5746 0.0724 441.4 20.06 0.2345 0.2183 0.0188 1.3871 0.2951 463.1 19.05 0.0131 0.0055 0.0088 0.3339 0.0026 457.3 19.39 0.0176 0.0081 0.0110 0.4147 0.0360 395.2 22.42Odyssey RE0, Cert_E0 5/12/10 128414 116303 120109 0.0702 0.0580 0.0125 0.4970 0.0831 441.5 20.06 0.2768 0.2609 0.0183 1.3613 0.3305 465.0 18.97 0.0143 0.0051 0.0106 0.2358 0.0150 457.3 19.39 0.0194 0.0092 0.0117 0.3353 0.0243 394.2 22.49Odyssey RE0, Cert_E0 4/8/10 128414 116120 90297 0.0438 0.0333 0.0108 0.5847 0.0602 436.7 20.28 0.1633 0.1486 0.0170 1.2881 0.2509 457.3 19.30 0.0100 0.0030 0.0081 0.4010 0.0022 455.1 19.48 0.0172 0.0077 0.0110 0.4000 0.0256 386.5 22.93Odyssey RE0, Cert_E0 4/7/10 128414 116114 90279 0.0490 0.0393 0.0107 0.5186 0.0662 434.2 20.40 0.1989 0.1834 0.0179 1.2960 0.2774 454.0 19.44 0.0062 -0.0006 0.0078 0.2856 0.0008 450.7 19.68 0.0165 0.0073 0.0106 0.3713 0.0302 388.3 22.82Odyssey RE0, Cert_E0 4/3/10 128414 116095 90210 0.0481 0.0365 0.0119 0.8011 0.0664 438.4 20.18 0.1813 0.1649 0.0190 1.8133 0.2822 457.9 19.24 0.0110 0.0029 0.0093 0.5595 0.0000 455.0 19.47 0.0178 0.0080 0.0114 0.4938 0.0289 392.4 22.57Odyssey RE0, Cert_E0 4/2/10 128414 116084 90146 0.0482 0.0377 0.0108 0.6578 0.0653 427.7 20.70 0.1841 0.1690 0.0174 1.3697 0.2723 447.4 19.72 0.0102 0.0031 0.0082 0.5119 0.0000 444.0 19.96 0.0175 0.0084 0.0106 0.3966 0.0328 381.9 23.20Odyssey RE0, Cert_E0 3/28/10 128414 116049 90109 0.0480 0.0371 0.0111 0.5201 0.0617 436.7 20.18 0.1691 0.1538 0.0176 1.3731 0.2422 460.0 19.09 0.0114 0.0039 0.0087 0.2782 0.0000 452.8 19.48 0.0256 0.0163 0.0108 0.3330 0.0418 388.5 22.69Odyssey RE0, Cert_E0 3/27/10 128414 116047 90090 0.0486 0.0378 0.0111 0.5500 0.0916 438.0 20.11 0.1815 0.1655 0.0186 1.4785 0.2710 457.3 19.19 0.0096 0.0026 0.0081 0.2817 0.0023 455.3 19.38 0.0219 0.0122 0.0112 0.3551 0.1245 390.9 22.56Odyssey RE0, Cert_E0 3/4/10 128414 115910 67929 0.0479 0.0371 0.0111 0.5013 0.0553 426.0 20.69 0.1750 0.1592 0.0182 1.3320 0.2254 448.0 19.59 0.0133 0.0063 0.0081 0.2067 0.0012 443.2 19.91 0.0173 0.0074 0.0115 0.4297 0.0290 376.8 23.39Odyssey RE0, Cert_E0 3/3/10 128414 115902 67910 0.0500 0.0390 0.0113 0.5545 0.0596 420.3 20.96 0.1832 0.1670 0.0187 1.6405 0.2529 439.9 19.93 0.0139 0.0064 0.0087 0.2677 0.0000 437.2 20.18 0.0173 0.0081 0.0106 0.2742 0.0259 373.5 23.61Odyssey RE0, Cert_E0 3/2/10 128414 115894 67892 0.0480 0.0373 0.0110 0.4039 0.0522 414.0 21.29 0.1721 0.1573 0.0171 1.0653 0.2105 432.7 20.30 0.0143 0.0070 0.0085 0.2018 0.0034 430.5 20.50 0.0182 0.0087 0.0110 0.2891 0.0255 368.7 23.92Odyssey RE0, Cert_E0 7/27/09 128414 115169 4088 0.0255 0.0233 0.0026 0.1936 0.0102 453.6 19.45 0.0877 0.0813 0.0074 0.5163 0.0282 476.8 18.48 0.0142 0.0129 0.0015 0.1194 0.0020 475.8 18.55 0.0000 -0.0010 0.0012 0.0894 0.0122 394.3 22.39Odyssey RE0, Cert_E0 7/14/09 128414 410686 4069 0.0226 0.0203 0.0024 0.2258 0.0089 448.6 19.67 0.0971 0.0902 0.0079 0.6470 0.0290 470.9 18.70 0.0029 0.0023 0.0007 0.1447 0.0000 464.3 19.01 0.0036 0.0021 0.0017 0.0612 0.0108 402.1 21.96Odyssey RE0, Cert_E0 7/7/09 128414 410661 4050 0.0212 0.0189 0.0025 0.2659 0.0100 455.4 19.37 0.0901 0.0829 0.0083 0.7323 0.0274 473.2 18.61 0.0032 0.0026 0.0007 0.1485 0.0020 474.8 18.59 0.0035 0.0020 0.0017 0.1361 0.0120 405.3 21.78Odyssey RE0, Cert_E0 7/6/09 128414 410657 4039 0.0215 0.0192 0.0025 0.2418 0.0082 448.9 19.66 0.0896 0.0830 0.0077 0.6496 0.0227 468.5 18.80 0.0037 0.0029 0.0009 0.1590 0.0000 469.7 18.79 0.0039 0.0024 0.0016 0.0903 0.0128 394.8 22.36
Odyssey RE15, Cert_E15 6/15/10 128415 116416 120211 0.0280 0.0224 0.0058 0.2170 0.0404 434.0 19.39 0.1047 0.0938 0.0126 0.8024 0.0979 452.4 18.55 0.0072 0.0049 0.0026 0.0449 0.0033 449.5 18.73 0.0093 0.0037 0.0066 0.0994 0.0670 390.7 21.54Odyssey RE15, Cert_E15 6/9/10 128415 116397 120192 0.0282 0.0222 0.0062 0.1882 0.0314 432.2 19.47 0.1045 0.0938 0.0124 0.7062 0.0935 452.0 18.57 0.0071 0.0043 0.0032 0.0480 0.0064 446.7 18.85 0.0105 0.0045 0.0070 0.0622 0.0317 390.0 21.58Odyssey RE15, Cert_E15 6/8/10 128415 116395 120173 0.0287 0.0249 0.0039 0.2174 0.0460 435.3 19.33 0.1141 0.1049 0.0106 0.7677 0.0924 457.9 18.33 0.0045 0.0040 0.0006 0.0706 0.0018 451.0 18.67 0.0101 0.0057 0.0051 0.0808 0.0950 388.2 21.69Odyssey RE15, Cert_E15 6/7/10 128415 116388 120154 0.0336 0.0275 0.0062 0.1612 0.0371 431.4 19.50 0.1295 0.1193 0.0118 0.5577 0.0986 448.1 18.74 0.0081 0.0047 0.0039 0.0600 0.0031 448.9 18.76 0.0093 0.0038 0.0064 0.0524 0.0547 386.1 21.80Odyssey RE15, Cert_E15 4/22/10 128415 116174 90154 0.0260 0.0212 0.0049 0.1443 0.0402 439.1 19.19 0.1013 0.0912 0.0117 0.5643 0.0707 474.6 17.72 0.0058 0.0041 0.0019 0.0462 0.0092 452.7 18.62 0.0074 0.0026 0.0056 0.0127 0.0759 386.5 21.81Odyssey RE15, Cert_E15 4/21/10 128415 116170 90135 0.0269 0.0218 0.0052 0.1675 0.0394 437.1 19.27 0.1048 0.0952 0.0111 0.6275 0.0714 456.7 18.41 0.0061 0.0038 0.0026 0.0480 0.0055 455.5 18.51 0.0078 0.0028 0.0057 0.0481 0.0798 387.3 21.76Odyssey RE15, Cert_E15 4/20/10 128415 116167 90117 0.0244 0.0189 0.0059 0.1631 0.0456 433.2 19.45 0.0988 0.0887 0.0117 0.5832 0.0668 455.1 18.47 0.0035 0.0000 0.0041 0.0631 0.0036 448.8 18.78 0.0077 0.0035 0.0049 0.0355 0.1091 387.0 21.78Odyssey RE15, Cert_E15 3/11/10 128415 115949 60126 0.0239 0.0209 0.0040 0.1820 0.0197 428.2 19.67 0.1087 0.1000 0.0101 0.6043 0.0739 444.7 18.90 0.0000 -0.0016 0.0018 0.0729 0.0011 445.6 18.91 0.0052 0.0021 0.0036 0.0697 0.0141 382.7 22.02Odyssey RE15, Cert_E15 3/10/10 128415 115944 60107 0.0283 0.0235 0.0049 0.1595 0.0327 435.8 19.33 0.1105 0.1020 0.0098 0.5526 0.0685 451.4 18.63 0.0066 0.0039 0.0031 0.0519 0.0062 453.8 18.57 0.0074 0.0034 0.0046 0.0666 0.0558 390.0 21.61Odyssey RE15, Cert_E15 3/9/10 128415 115931 60088 0.0278 0.0237 0.0042 0.1797 0.0200 436.2 19.31 0.1127 0.1040 0.0100 0.5279 0.0701 449.8 18.69 0.0048 0.0027 0.0024 0.1019 0.0000 455.5 18.50 0.0071 0.0042 0.0033 0.0628 0.0196 389.7 21.63Odyssey RE15, Cert_E15 12/14/09 128415 9115103 5523 0.0198 0.0168 0.0031 0.1577 0.0117 452.5 18.62 0.0867 0.0792 0.0086 0.5086 0.0272 469.7 17.91 0.0019 0.0008 0.0013 0.0633 0.0009 470.1 17.93 0.0031 0.0011 0.0023 0.0707 0.0204 406.4 20.74Odyssey RE15, Cert_E15 12/11/09 128415 9115096 5504 0.0282 0.0250 0.0034 0.1932 0.0112 451.1 18.67 0.1061 0.0981 0.0092 0.5578 0.0374 473.7 17.75 0.0091 0.0074 0.0019 0.1138 0.0007 467.3 18.03 0.0059 0.0044 0.0018 0.0685 0.0114 403.1 20.91Odyssey RE15, Cert_E15 12/4/09 128415 9410968 5486 0.0256 0.0231 0.0027 0.1846 0.0108 447.8 18.81 0.1072 0.0998 0.0086 0.4790 0.0308 484.5 17.36 0.0041 0.0036 0.0006 0.1306 0.0022 459.6 18.33 0.0045 0.0026 0.0022 0.0640 0.0119 397.6 21.20Odyssey RE15, Cert_E15 11/3/09 128415 115403 5467 0.0240 0.0209 0.0032 0.1820 0.0069 454.1 18.55 0.0940 0.0867 0.0085 0.4639 0.0195 473.2 17.78 0.0058 0.0046 0.0014 0.1261 0.0007 473.9 17.78 0.0058 0.0036 0.0026 0.0752 0.0091 402.1 20.96Odyssey RE15, Cert_E0 6/29/10 128415 116483 120397 0.0313 0.0252 0.0063 0.1945 0.0565 442.9 20.02 0.1122 0.1019 0.0120 0.6450 0.1050 457.0 19.36 0.0093 0.0061 0.0036 0.0912 0.0016 463.7 19.14 0.0116 0.0054 0.0071 0.0493 0.1235 393.1 22.58Odyssey RE15, Cert_E0 6/23/10 128415 116464 120364 0.0311 0.0261 0.0053 0.1498 0.0531 444.6 19.95 0.1245 0.1154 0.0105 0.4935 0.1088 477.6 18.54 0.0061 0.0037 0.0028 0.0649 0.0067 458.3 19.36 0.0080 0.0029 0.0059 0.0506 0.0986 393.7 22.54Odyssey RE15, Cert_E0 6/21/10 128415 116450 120326 0.0277 0.0225 0.0054 0.1605 0.0240 439.8 20.17 0.1151 0.1052 0.0115 0.5831 0.0893 460.1 19.24 0.0033 0.0011 0.0026 0.0225 0.0041 453.6 19.57 0.0076 0.0024 0.0060 0.1016 0.0121 398.3 22.28Odyssey RE15, Cert_E0 6/18/10 128415 116441 120252 0.0268 0.0216 0.0054 0.3231 0.0219 436.5 20.31 0.1008 0.0909 0.0115 0.8992 0.0860 463.1 19.10 0.0062 0.0041 0.0024 0.1413 0.0000 450.4 19.70 0.0099 0.0044 0.0063 0.2329 0.0150 390.2 22.73Odyssey RE15, Cert_E0 4/29/10 128415 116224 90315 0.0235 0.0209 0.0040 0.1524 0.0310 437.2 20.29 0.0988 0.0902 0.0099 0.5286 0.0624 456.3 19.41 0.0059 0.0048 0.0012 0.0540 0.0059 452.9 19.60 0.0000 -0.0040 0.0047 0.0541 0.0547 392.8 22.59Odyssey RE15, Cert_E0 4/27/10 128415 116214 90289 0.0255 0.0209 0.0047 0.1578 0.0348 436.9 20.30 0.1018 0.0933 0.0098 0.5198 0.0873 455.1 19.46 0.0051 0.0028 0.0027 0.0601 0.0041 452.9 19.59 0.0066 0.0026 0.0046 0.0694 0.0535 392.6 22.60Odyssey RE15, Cert_E0 4/26/10 128415 116208 90242 0.0236 0.0200 0.0037 0.1553 0.0477 440.0 20.16 0.0966 0.0883 0.0096 0.4921 0.0659 455.3 19.45 0.0031 0.0020 0.0012 0.0696 0.0012 454.4 19.53 0.0073 0.0039 0.0039 0.0636 0.1224 400.8 22.14Odyssey RE15, Cert_E0 3/17/10 128415 115986 60301 0.0278 0.0249 0.0030 0.1383 0.0212 426.5 20.69 0.1073 0.0999 0.0086 0.4579 0.0398 448.0 19.66 0.0045 0.0041 0.0005 0.0577 0.0009 439.8 20.07 0.0124 0.0091 0.0038 0.0510 0.0458 385.1 22.93Odyssey RE15, Cert_E0 3/16/10 128415 115981 60283 0.0268 0.0236 0.0034 0.1337 0.0124 428.2 20.61 0.0987 0.0914 0.0084 0.4324 0.0502 448.5 19.65 0.0078 0.0065 0.0015 0.0412 0.0016 441.9 19.98 0.0088 0.0061 0.0030 0.0841 0.0044 386.7 22.83Odyssey RE15, Cert_E0 3/15/10 128415 115963 60167 0.0236 0.0196 0.0041 0.1892 0.0144 443.9 19.88 0.0891 0.0813 0.0090 0.5659 0.0516 457.1 19.27 0.0063 0.0043 0.0023 0.0842 0.0000 461.7 19.12 0.0069 0.0035 0.0039 0.1026 0.0136 400.4 22.05Odyssey RE15, Cert_E0 7/28/09 128415 115170 4089 0.0279 0.0259 0.0024 0.1410 0.0132 459.9 19.19 0.1270 0.1206 0.0075 0.2708 0.0409 492.7 17.89 0.0029 0.0021 0.0008 0.1100 0.0024 479.0 18.43 0.0004 -0.0010 0.0016 0.1014 0.0127 399.1 22.12Odyssey RE15, Cert_E0 7/14/09 128415 410690 4070 0.0223 0.0203 0.0021 0.2185 0.0087 452.2 19.51 0.0962 0.0901 0.0071 0.5939 0.0321 481.5 18.30 0.0023 0.0020 0.0004 0.1437 0.0000 470.9 18.75 0.0040 0.0027 0.0015 0.0763 0.0073 395.1 22.35Odyssey RE15, Cert_E0 7/7/09 128415 410662 4052 0.0232 0.0210 0.0024 0.2530 0.0086 453.1 19.47 0.0990 0.0919 0.0083 0.7364 0.0248 475.8 18.51 0.0033 0.0029 0.0005 0.1342 0.0031 472.4 18.69 0.0036 0.0023 0.0015 0.1131 0.0068 399.4 22.10Odyssey RE15, Cert_E0 7/6/09 128415 410658 4040 0.0225 0.0202 0.0025 0.2510 0.0119 451.4 19.55 0.0944 0.0875 0.0080 0.6822 0.0324 472.9 18.62 0.0036 0.0031 0.0006 0.1495 0.0016 470.5 18.76 0.0039 0.0023 0.0019 0.1177 0.0159 398.9 22.13
Odyssey RE20, Cert_E20 10/20/11 128424 1102519 120156 0.0289 0.0242 0.0049 0.1594 0.0257 434.0 18.94 0.1215 0.1117 0.0102 0.6694 0.1026 454.9 18.02 0.0036 0.0005 0.0032 0.0260 0.0033 450.7 18.25 0.0067 0.0029 0.0040 0.0267 0.0099 387.0 21.25Odyssey RE20, Cert_E20 10/19/11 128424 1102501 120137 0.0285 0.0239 0.0048 0.1540 0.0214 438.9 18.73 0.1187 0.1091 0.0100 0.6042 0.0810 451.1 18.18 0.0042 0.0009 0.0034 0.0239 0.0029 460.2 17.87 0.0066 0.0031 0.0036 0.0607 0.0114 389.2 21.13Odyssey RE20, Cert_E20 10/18/11 128424 1102480 120118 0.0288 0.0245 0.0044 0.1655 0.0183 437.6 18.78 0.1175 0.1084 0.0095 0.5835 0.0716 453.5 18.08 0.0048 0.0023 0.0026 0.0522 0.0004 457.5 17.97 0.0070 0.0031 0.0041 0.0640 0.0119 388.1 21.19Odyssey RE20, Cert_E20 9/2/11 128424 1101641 90108 0.0351 0.0300 0.0053 0.1347 0.0230 443.1 18.70 0.1347 0.1239 0.0113 0.5910 0.0784 469.4 17.62 0.0096 0.0067 0.0030 0.0170 0.0029 459.1 18.06 0.0081 0.0032 0.0051 0.0116 0.0189 393.3 21.08Odyssey RE20, Cert_E20 9/1/11 128424 1101625 90090 0.0421 0.0378 0.0044 0.1278 0.0197 439.3 18.86 0.1658 0.1561 0.0100 0.5246 0.0729 465.3 17.77 0.0098 0.0075 0.0023 0.0307 0.0002 453.7 18.27 0.0095 0.0054 0.0042 0.0109 0.0163 392.3 21.14Odyssey RE20, Cert_E20 8/31/11 128424 1101598 90071 0.0427 0.0389 0.0040 0.1087 0.0190 439.3 18.86 0.1722 0.1625 0.0101 0.4941 0.0771 463.1 17.86 0.0085 0.0070 0.0016 0.0047 0.0017 453.6 18.28 0.0094 0.0057 0.0038 0.0132 0.0076 394.5 21.01Odyssey RE20, Cert_E20 7/20/11 128424 2100864 60123 0.0176 0.0155 0.0033 0.1618 0.0142 432.5 19.16 0.0822 0.0750 0.0076 0.5299 0.0483 442.2 18.70 0.0000 0.0000 0.0015 0.0879 0.0015 454.4 18.24 0.0021 0.0000 0.0035 0.0232 0.0124 383.8 21.60Odyssey RE20, Cert_E20 7/19/11 128424 2100845 60105 0.0157 0.0135 0.0031 0.2121 0.0181 432.9 19.14 0.0721 0.0643 0.0083 0.6971 0.0619 448.9 18.42 0.0000 0.0000 0.0015 0.1057 0.0011 452.8 18.31 0.0027 0.0005 0.0022 0.0459 0.0170 383.4 21.62Odyssey RE20, Cert_E20 7/18/11 128424 2100819 60086 0.0179 0.0157 0.0032 0.1726 0.0157 431.6 19.20 0.0838 0.0754 0.0089 0.5723 0.0523 447.5 18.48 0.0000 0.0000 0.0011 0.0831 0.0014 450.1 18.42 0.0017 0.0000 0.0028 0.0390 0.0153 384.5 21.56Odyssey RE20, Cert_E20 5/25/11 128424 117031 19730 0.0165 0.0143 0.0033 0.1394 0.0127 445.4 18.60 0.0768 0.0698 0.0080 0.5786 0.0430 456.0 18.14 0.0000 -0.0014 0.0017 0.0237 0.0000 462.0 17.95 0.0024 -0.0002 0.0030 0.0273 0.0140 405.9 20.42Odyssey RE20, Cert_E20 5/24/11 128424 117025 19711 0.0191 0.0167 0.0034 0.1510 0.0177 444.9 18.63 0.0883 0.0808 0.0086 0.6129 0.0588 461.3 17.93 0.0000 -0.0016 0.0019 0.0470 0.0040 459.9 18.03 0.0030 0.0010 0.0024 0.0000 0.0130 403.9 20.53Odyssey RE20, Cert_E20 5/23/11 128424 213637 19693 0.0211 0.0181 0.0032 0.1847 0.0172 452.1 18.33 0.0804 0.0729 0.0088 0.6273 0.0490 469.3 17.62 0.0051 0.0037 0.0016 0.0811 0.0072 467.5 17.73 0.0066 0.0049 0.0019 0.0459 0.0120 410.0 20.22Odyssey RE20, Cert_E0 10/28/11 128424 1102655 120270 0.0323 0.0286 0.0039 0.1048 0.0234 435.3 20.23 0.1417 0.1329 0.0091 0.4630 0.0741 453.2 19.39 0.0029 0.0008 0.0021 0.0175 0.0054 453.5 19.42 0.0056 0.0025 0.0032 0.0000 0.0192 386.9 22.77Odyssey RE20, Cert_E0 10/27/11 128424 1102626 120251 0.0352 0.0311 0.0042 0.1423 0.0243 436.4 20.17 0.1531 0.1451 0.0084 0.5686 0.0915 455.5 19.28 0.0034 0.0011 0.0023 0.0128 0.0045 452.3 19.48 0.0060 0.0016 0.0046 0.0643 0.0110 391.9 22.47Odyssey RE20, Cert_E0 10/26/11 128424 1102594 120232 0.0330 0.0292 0.0040 0.1715 0.0290 444.7 19.79 0.1435 0.1344 0.0094 0.6701 0.1210 458.6 19.15 0.0031 0.0010 0.0022 0.0601 0.0001 465.4 18.92 0.0060 0.0029 0.0032 0.0051 0.0143 394.9 22.30Odyssey RE20, Cert_E0 9/8/11 128424 1101759 90195 0.0378 0.0330 0.0049 0.1178 0.0175 442.6 20.07 0.1544 0.1441 0.0107 0.5078 0.0568 462.7 19.16 0.0048 0.0019 0.0031 0.0118 0.0019 461.1 19.28 0.0116 0.0077 0.0041 0.0228 0.0170 392.7 22.63Odyssey RE20, Cert_E0 9/7/11 128424 1101715 90176 0.0422 0.0379 0.0045 0.1146 0.0296 441.0 20.15 0.1236 0.1150 0.0089 0.4645 0.0559 460.2 19.27 0.0233 0.0207 0.0027 0.0353 0.0016 460.4 19.31 0.0163 0.0121 0.0044 0.0000 0.0624 390.0 22.79Odyssey RE20, Cert_E0 9/6/11 128424 1101685 90157 0.0363 0.0328 0.0037 0.1388 0.0217 439.6 20.21 0.1335 0.1249 0.0089 0.5765 0.0713 461.9 19.19 0.0114 0.0098 0.0016 0.0285 0.0020 453.5 19.60 0.0100 0.0066 0.0036 0.0160 0.0215 396.4 22.43Odyssey RE20, Cert_E0 7/26/11 128424 2100956 60209 0.0198 0.0170 0.0041 0.2245 0.0188 442.0 20.09 0.0909 0.0816 0.0099 0.6544 0.0719 457.3 19.39 0.0000 0.0000 0.0023 0.1294 0.0013 462.0 19.23 0.0034 0.0002 0.0034 0.0796 0.0116 392.6 22.64Odyssey RE20, Cert_E0 7/25/11 128424 1100938 60190 0.0309 0.0274 0.0036 0.1394 0.0135 435.4 20.40 0.1081 0.1001 0.0083 0.5023 0.0496 448.8 19.76 0.0122 0.0105 0.0018 0.0549 0.0013 457.9 19.41 0.0079 0.0045 0.0035 0.0254 0.0094 382.6 23.23Odyssey RE20, Cert_E0 7/22/11 128424 2100897 60172 0.0194 0.0172 0.0031 0.1900 0.0169 440.3 20.17 0.0894 0.0824 0.0073 0.5600 0.0490 455.8 19.45 0.0000 0.0000 0.0014 0.1092 0.0016 460.9 19.28 0.0030 0.0002 0.0030 0.0633 0.0213 389.8 22.80Odyssey RE20, Cert_E0 5/17/11 128424 213623 19655 0.0151 0.0124 0.0029 0.1877 0.0139 451.5 19.67 0.0666 0.0602 0.0074 0.5116 0.0464 468.5 18.93 0.0009 -0.0001 0.0012 0.0999 0.0012 466.5 19.05 0.0027 0.0003 0.0028 0.1085 0.0131 410.3 21.66Odyssey RE20, Cert_E0 5/16/11 128424 213621 19637 0.0150 0.0133 0.0029 0.1796 0.0129 451.2 19.69 0.0706 0.0648 0.0067 0.4388 0.0480 466.7 19.01 0.0000 -0.0016 0.0018 0.1408 0.0003 467.5 19.01 0.0015 -0.0004 0.0022 0.0566 0.0103 408.5 21.76Odyssey RE20, Cert_E0 5/13/11 128424 213617 19618 0.0152 0.0128 0.0030 0.1926 0.0125 451.2 19.69 0.0689 0.0624 0.0075 0.4295 0.0456 464.2 19.11 0.0004 -0.0006 0.0012 0.1523 0.0002 465.5 19.09 0.0024 0.0000 0.0028 0.0892 0.0107 414.4 21.44

Comparative Emissions Testing of Vehicles Aged on E0, E15 and E20 Fuels
47
Vehicle Model, Aging Fuel, Emissions Fuel
Test Start Date
Vehicle No. Test No.
Odometer
(Miles)
WTD Bag THC
(g/mi)
WTD Bag
NMHC (g/mi)
WTD Bag CH4
(g/mi)
WTD Bag CO (g/mi)
WTD Bag NOx
(g/mi)
WTD Bag CO2
(g/mi)
WTD Fuel Econ (mpg)
Bag PH1 THC
(g/mi)
Bag PH1
NMHC (g/mi)
Bag PH1 CH4
(g/mi)
Bag PH1 CO (g/mi)
Bag PH1 NOx
(g/mi)
Bag PH1 CO2
(g/mi)
PH1 Fuel Econ (mpg)
Bag PH2 THC
(g/mi)
Bag PH2
NMHC (g/mi)
Bag PH2 CH4
(g/mi)
Bag PH2 CO (g/mi)
Bag PH2 NOx
(g/mi)
Bag PH2 CO2
(g/mi)
PH2 Fuel Econ (mpg)
Bag PH3 THC
(g/mi)
Bag PH3
NMHC (g/mi)
Bag PH3 CH4
(g/mi)
Bag PH3 CO (g/mi)
Bag PH3 NOx
(g/mi)
Bag PH3 CO2
(g/mi)
PH3 Fuel Econ (mpg)
Focus RE0, Cert_E0 5/19/10 128416 116332 120145 0.0351 0.0254 0.0099 1.1387 0.1301 281.5 31.33 0.0951 0.0797 0.0178 2.1373 0.3636 295.6 29.66 0.0127 0.0064 0.0072 0.7211 0.0394 286.3 30.88 0.0316 0.0240 0.0088 1.1675 0.1237 261.6 33.68Focus RE0, Cert_E0 5/17/10 128416 116325 120119 0.0358 0.0283 0.0077 1.0880 0.1009 282.4 31.23 0.1021 0.0887 0.0154 2.1988 0.2763 299.8 29.24 0.0128 0.0089 0.0045 0.6674 0.0291 287.0 30.81 0.0290 0.0224 0.0077 1.0411 0.1036 260.7 33.83Focus RE0, Cert_E0 5/14/10 128416 116319 120100 0.0476 0.0393 0.0086 1.0670 0.1074 280.4 31.45 0.1662 0.1520 0.0164 2.1763 0.3576 293.0 29.90 0.0111 0.0062 0.0057 0.7291 0.0152 285.2 30.99 0.0270 0.0201 0.0080 0.8667 0.0924 262.0 33.70Focus RE0, Cert_E0 4/9/10 128416 116123 90153 0.0257 0.0181 0.0078 0.6716 0.0632 271.8 32.52 0.0652 0.0555 0.0113 1.1944 0.1212 286.9 30.72 0.0140 0.0083 0.0065 0.5762 0.0355 275.2 32.15 0.0182 0.0117 0.0075 0.4583 0.0722 254.1 34.83Focus RE0, Cert_E0 4/8/10 128416 116122 90135 0.0273 0.0201 0.0075 0.7403 0.0750 278.0 31.79 0.0746 0.0646 0.0115 1.3686 0.1254 292.0 30.15 0.0091 0.0044 0.0055 0.5360 0.0331 281.5 31.44 0.0263 0.0192 0.0083 0.6545 0.1163 260.7 33.91Focus RE0, Cert_E0 4/7/10 128416 116112 90116 0.0275 0.0208 0.0069 0.7418 0.0599 278.4 31.75 0.0878 0.0763 0.0134 1.5187 0.1517 293.8 29.94 0.0089 0.0050 0.0045 0.5310 0.0231 282.9 31.29 0.0169 0.0112 0.0066 0.5523 0.0597 258.2 34.25Focus RE0, Cert_E0 3/5/10 128416 115913 60214 0.0373 0.0295 0.0080 0.9687 0.0629 271.0 32.39 0.0977 0.0854 0.0142 1.7640 0.1571 287.3 30.41 0.0143 0.0101 0.0049 0.5895 0.0294 275.8 31.91 0.0350 0.0271 0.0092 1.0863 0.0553 249.8 35.10Focus RE0, Cert_E0 3/3/10 128416 115903 60195 0.0377 0.0290 0.0089 1.1091 0.0918 278.4 31.51 0.1075 0.0941 0.0154 1.8420 0.2345 293.2 29.80 0.0117 0.0062 0.0064 0.8176 0.0395 285.6 30.78 0.0338 0.0263 0.0086 1.1019 0.0820 253.9 34.54Focus RE0, Cert_E0 3/2/10 128416 115897 60177 0.0367 0.0285 0.0084 0.9828 0.0581 277.5 31.64 0.1032 0.0896 0.0158 2.0125 0.1177 295.1 29.58 0.0132 0.0083 0.0056 0.6445 0.0291 282.5 31.15 0.0312 0.0241 0.0082 0.8473 0.0678 254.8 34.47Focus RE0, Cert_E0 7/27/09 128416 115168 4100 0.0631 0.0562 0.0071 0.6435 0.0060 293.0 30.02 0.2494 0.2361 0.0154 1.0219 0.0213 308.9 28.37 0.0135 0.0101 0.0040 0.4089 0.0000 300.0 29.37 0.0162 0.0104 0.0067 0.8017 0.0057 267.8 32.81Focus RE0, Cert_E0 7/12/09 128416 410679 4044 0.0359 0.0312 0.0051 0.4851 0.0082 295.5 29.79 0.1088 0.0987 0.0117 1.1952 0.0109 314.1 27.92 0.0224 0.0192 0.0037 0.3878 0.0067 303.1 29.08 0.0064 0.0040 0.0028 0.1331 0.0088 267.4 33.00Focus RE0, Cert_E0 7/11/09 128416 410675 4033 0.0396 0.0346 0.0053 0.5660 0.0068 285.5 30.83 0.1273 0.1178 0.0109 1.0498 0.0139 303.3 28.92 0.0161 0.0134 0.0031 0.3340 0.0000 289.3 30.46 0.0176 0.0131 0.0052 0.6393 0.0144 264.7 33.24
Focus RE15, Cert_E15 6/21/10 128417 116452 120153 0.0390 0.0278 0.0116 0.7456 0.0724 280.5 29.88 0.0920 0.0768 0.0175 1.5368 0.2512 296.1 28.19 0.0191 0.0104 0.0100 0.4471 0.0190 285.1 29.46 0.0365 0.0277 0.0102 0.7103 0.0381 260.3 32.21Focus RE15, Cert_E15 6/18/10 128417 116435 120134 0.0334 0.0234 0.0103 0.6883 0.0550 279.0 30.06 0.0790 0.0656 0.0155 1.4622 0.2096 294.5 28.36 0.0180 0.0103 0.0089 0.3857 0.0095 284.0 29.58 0.0280 0.0202 0.0090 0.6762 0.0245 257.8 32.53Focus RE15, Cert_E15 6/17/10 128417 116433 120116 0.0291 0.0211 0.0082 0.5698 0.0574 280.3 29.94 0.0853 0.0733 0.0138 1.4046 0.1953 296.4 28.18 0.0111 0.0053 0.0066 0.3190 0.0006 286.9 29.30 0.0207 0.0145 0.0071 0.4125 0.0603 255.5 32.87Focus RE15, Cert_E15 5/7/10 128417 116268 90127 0.0339 0.0245 0.0096 0.5833 0.0555 282.9 29.67 0.0847 0.0717 0.0150 1.2466 0.2260 299.7 27.89 0.0157 0.0092 0.0076 0.2683 0.0079 288.2 29.17 0.0299 0.0217 0.0095 0.6782 0.0168 260.0 32.25Focus RE15, Cert_E15 5/6/10 128417 116266 90109 0.0305 0.0234 0.0073 0.6937 0.0741 282.4 29.70 0.0887 0.0747 0.0162 1.6268 0.3069 293.6 28.40 0.0053 0.0031 0.0026 0.1662 0.0017 289.2 29.09 0.0340 0.0258 0.0095 0.9801 0.0346 261.0 32.06Focus RE15, Cert_E15 5/5/10 128417 116261 90090 0.0335 0.0250 0.0087 0.6981 0.0765 280.9 29.85 0.1029 0.0869 0.0184 1.9159 0.3568 294.7 28.26 0.0099 0.0054 0.0052 0.2663 0.0000 286.8 29.32 0.0257 0.0189 0.0079 0.5950 0.0096 259.5 32.32Focus RE15, Cert_E15 3/15/10 128417 115961 60145 0.0553 0.0464 0.0091 0.5598 0.0380 280.5 29.94 0.1766 0.1636 0.0150 1.2707 0.1337 294.2 28.41 0.0216 0.0152 0.0074 0.3593 0.0085 286.0 29.41 0.0272 0.0204 0.0079 0.4013 0.0216 259.8 32.36Focus RE15, Cert_E15 3/13/10 128417 115957 60126 0.0353 0.0266 0.0089 0.5325 0.0202 278.2 30.21 0.0600 0.0495 0.0121 0.8563 0.0652 293.7 28.55 0.0310 0.0240 0.0081 0.4365 0.0092 283.3 29.67 0.0247 0.0177 0.0081 0.4718 0.0074 256.5 32.76Focus RE15, Cert_E15 3/12/10 128417 115953 60107 0.0304 0.0230 0.0076 0.6379 0.0466 277.3 30.28 0.0807 0.0693 0.0132 1.0527 0.2022 289.2 28.96 0.0116 0.0073 0.0049 0.4390 0.0029 282.8 29.73 0.0280 0.0207 0.0083 0.7003 0.0120 257.9 32.54Focus RE15, Cert_E15 3/11/10 128417 115947 60082 0.0347 0.0289 0.0060 0.5000 0.0355 271.9 30.91 0.1199 0.1084 0.0133 1.2595 0.1701 287.1 29.13 0.0066 0.0038 0.0032 0.2327 0.0000 276.7 30.42 0.0239 0.0189 0.0058 0.4335 0.0011 251.1 33.47Focus RE15, Cert_E15 12/14/09 128417 9115101 5452 0.0245 0.0196 0.0050 0.4911 0.0080 287.7 29.22 0.0840 0.0739 0.0118 1.3273 0.0353 301.4 27.75 0.0079 0.0057 0.0025 0.2799 0.0000 293.0 28.73 0.0108 0.0067 0.0047 0.2576 0.0023 267.4 31.48Focus RE15, Cert_E15 12/11/09 128417 9115097 5433 0.0273 0.0232 0.0041 0.4018 0.0037 287.0 29.30 0.1046 0.0951 0.0110 0.9952 0.0146 300.3 27.90 0.0068 0.0052 0.0018 0.2499 0.0000 292.5 28.78 0.0076 0.0047 0.0034 0.2411 0.0023 266.4 31.59Focus RE15, Cert_E15 12/4/09 128417 9410969 5415 0.0273 0.0234 0.0042 0.6081 0.0126 284.3 29.54 0.1031 0.0923 0.0125 1.6950 0.0524 310.2 26.92 0.0081 0.0069 0.0014 0.3650 0.0027 284.6 29.56 0.0063 0.0037 0.0030 0.2476 0.0012 264.3 31.85Focus RE15, Cert_E15 11/2/09 128417 115401 5377 0.0252 0.0215 0.0038 0.3477 0.0057 287.6 29.25 0.0992 0.0894 0.0113 1.0153 0.0230 296.3 28.27 0.0064 0.0052 0.0013 0.1936 0.0006 294.1 28.63 0.0048 0.0024 0.0028 0.1342 0.0020 268.7 31.35Focus RE15, Cert_E0 6/24/10 128417 116473 120259 0.0359 0.0272 0.0090 0.8391 0.0766 283.2 31.19 0.0986 0.0851 0.0156 1.6136 0.2841 298.2 29.49 0.0082 0.0035 0.0055 0.4266 0.0009 288.8 30.66 0.0408 0.0314 0.0109 1.0297 0.0621 261.3 33.75Focus RE15, Cert_E0 6/23/10 128417 116467 120240 0.0349 0.0256 0.0096 0.6967 0.0368 283.8 31.15 0.0762 0.0657 0.0121 1.0989 0.1422 301.1 29.29 0.0201 0.0123 0.0090 0.5624 0.0062 287.0 30.82 0.0317 0.0240 0.0089 0.6457 0.0148 264.6 33.41Focus RE15, Cert_E0 6/22/10 128417 116458 120194 0.0414 0.0317 0.0102 0.7788 0.0618 283.2 31.20 0.0780 0.0663 0.0135 1.2468 0.1709 299.6 29.41 0.0306 0.0226 0.0093 0.6772 0.0329 287.4 30.76 0.0342 0.0263 0.0092 0.6172 0.0340 262.8 33.64Focus RE15, Cert_E0 5/12/10 128417 116301 90298 0.0477 0.0396 0.0083 0.4637 0.0289 286.5 30.89 0.1329 0.1200 0.0149 1.2183 0.0948 300.5 29.31 0.0321 0.0268 0.0061 0.2747 0.0100 291.7 30.37 0.0128 0.0063 0.0075 0.2501 0.0148 266.0 33.32Focus RE15, Cert_E0 5/11/10 128417 116292 90280 0.0494 0.0411 0.0086 0.5846 0.0259 285.3 31.00 0.1414 0.1309 0.0122 1.1209 0.0785 307.5 28.67 0.0239 0.0181 0.0068 0.4363 0.0087 288.6 30.68 0.0282 0.0202 0.0092 0.4606 0.0188 262.4 33.73Focus RE15, Cert_E0 5/10/10 128417 116286 90233 0.0381 0.0304 0.0080 0.4973 0.0303 285.5 31.00 0.0942 0.0831 0.0129 1.1061 0.0946 304.2 28.99 0.0232 0.0182 0.0059 0.3127 0.0114 289.1 30.64 0.0239 0.0168 0.0082 0.3858 0.0173 264.4 33.49Focus RE15, Cert_E0 3/21/10 128417 116012 60277 0.0531 0.0430 0.0104 0.7711 0.0496 280.0 31.38 0.1066 0.0937 0.0150 1.4322 0.1126 294.8 29.70 0.0430 0.0350 0.0093 0.5837 0.0328 283.1 31.08 0.0317 0.0241 0.0088 0.6271 0.0338 263.2 33.42Focus RE15, Cert_E0 3/20/10 128417 116007 60259 0.0404 0.0314 0.0092 0.5381 0.0444 276.9 31.78 0.0439 0.0353 0.0099 0.4012 0.1022 285.1 30.90 0.0392 0.0318 0.0085 0.5370 0.0344 283.7 31.02 0.0401 0.0316 0.0099 0.6436 0.0196 257.8 34.11Focus RE15, Cert_E0 3/19/10 128417 116004 60240 0.0479 0.0377 0.0105 0.8297 0.0510 279.4 31.44 0.1075 0.0946 0.0149 1.5812 0.1864 293.7 29.79 0.0286 0.0211 0.0086 0.4949 0.0105 284.9 30.91 0.0394 0.0303 0.0105 0.8954 0.0253 258.4 33.97Focus RE15, Cert_E0 7/27/09 128417 115166 4099 0.0461 0.0396 0.0067 0.4702 0.0192 288.2 30.55 0.1335 0.1220 0.0133 1.3166 0.0182 300.1 29.18 0.0272 0.0230 0.0050 0.2619 0.0188 296.0 29.79 0.0157 0.0116 0.0048 0.2257 0.0208 264.3 33.36Focus RE15, Cert_E0 7/21/09 128417 410719 4080 0.0300 0.0259 0.0044 0.4736 0.0118 284.4 30.96 0.1091 0.0992 0.0115 1.3760 0.0195 299.3 29.26 0.0084 0.0067 0.0019 0.2526 0.0000 287.7 30.65 0.0112 0.0079 0.0038 0.2101 0.0281 266.9 33.04Focus RE15, Cert_E0 7/12/09 128417 410678 4043 0.0476 0.0428 0.0052 0.4684 0.0241 280.5 31.39 0.1379 0.1286 0.0107 0.8874 0.0357 293.4 29.91 0.0278 0.0248 0.0034 0.3476 0.0186 285.8 30.83 0.0171 0.0133 0.0045 0.3809 0.0257 260.7 33.79Focus RE15, Cert_E0 7/11/09 128417 410674 4032 0.0301 0.0257 0.0047 0.3941 0.0087 282.2 31.22 0.0789 0.0709 0.0093 0.9407 0.0131 298.6 29.41 0.0220 0.0190 0.0035 0.2841 0.0082 287.6 30.66 0.0084 0.0052 0.0037 0.1901 0.0064 259.6 33.98
Focus RE20, Cert_E20 10/28/11 128422 1102653 120140 0.0301 0.0239 0.0064 0.4498 0.0469 284.6 28.82 0.0929 0.0789 0.0145 1.3467 0.1663 301.6 27.06 0.0131 0.0086 0.0047 0.2134 0.0071 291.0 28.23 0.0146 0.0110 0.0037 0.2178 0.0317 259.9 31.60Focus RE20, Cert_E20 10/25/11 128422 1102569 120084 0.0305 0.0233 0.0075 0.5588 0.0555 283.7 28.89 0.0996 0.0844 0.0158 1.9106 0.2041 300.7 27.06 0.0096 0.0049 0.0049 0.1822 0.0070 288.5 28.48 0.0179 0.0117 0.0064 0.2479 0.0349 261.9 31.35Focus RE20, Cert_E20 10/21/11 128422 1102536 120065 0.0341 0.0280 0.0063 0.6602 0.0336 284.5 28.80 0.1380 0.1194 0.0193 2.6659 0.1381 301.9 26.84 0.0049 0.0021 0.0029 0.1440 0.0000 288.1 28.53 0.0112 0.0084 0.0029 0.1277 0.0185 264.5 31.07Focus RE20, Cert_E20 9/2/11 128422 1101643 90140 0.0374 0.0281 0.0097 0.5528 0.0455 290.8 28.42 0.0981 0.0829 0.0157 1.4701 0.1476 307.0 26.78 0.0197 0.0120 0.0080 0.2313 0.0121 295.9 27.98 0.0248 0.0168 0.0083 0.4655 0.0314 269.0 30.74Focus RE20, Cert_E20 8/31/11 128422 1101594 90084 0.0287 0.0217 0.0073 0.4555 0.0374 283.2 29.20 0.0744 0.0625 0.0123 1.3489 0.1385 296.9 27.71 0.0156 0.0102 0.0055 0.1621 0.0038 288.4 28.72 0.0191 0.0126 0.0067 0.3344 0.0246 263.1 31.44Focus RE20, Cert_E20 8/30/11 128422 1101561 90065 0.0242 0.0186 0.0058 0.2704 0.0236 288.2 28.73 0.0775 0.0653 0.0127 1.0222 0.0499 302.0 27.29 0.0087 0.0052 0.0037 0.0794 0.0055 293.5 28.24 0.0134 0.0088 0.0047 0.0644 0.0381 267.7 30.96Focus RE20, Cert_E20 7/22/11 128422 2100902 60117 0.0266 0.0196 0.0074 0.5382 0.0255 286.4 28.86 0.0701 0.0569 0.0139 1.4827 0.0435 303.0 27.14 0.0160 0.0100 0.0063 0.3138 0.0144 291.2 28.42 0.0138 0.0094 0.0047 0.2469 0.0330 264.8 31.26Focus RE20, Cert_E20 7/21/11 128422 2100882 60105 0.0261 0.0192 0.0073 0.6924 0.0558 287.0 28.78 0.0760 0.0631 0.0136 1.6698 0.2393 298.9 27.47 0.0082 0.0037 0.0047 0.2704 0.0038 293.0 28.26 0.0222 0.0151 0.0075 0.7485 0.0150 266.6 30.95Focus RE20, Cert_E20 7/19/11 128422 2100838 60068 0.0194 0.0144 0.0059 0.5473 0.0236 287.9 28.71 0.0696 0.0576 0.0128 1.4929 0.0826 299.4 27.46 0.0015 0.0000 0.0028 0.1728 0.0001 294.5 28.13 0.0152 0.0090 0.0065 0.5372 0.0233 266.7 30.99Focus RE20, Cert_E20 5/25/11 128422 117029 16329 0.0296 0.0220 0.0079 0.4792 0.0041 291.0 28.42 0.1066 0.0946 0.0139 1.5405 0.0063 305.2 26.92 0.0068 0.0012 0.0065 0.1971 0.0018 296.9 27.90 0.0144 0.0092 0.0060 0.2104 0.0066 269.0 30.78Focus RE20, Cert_E20 5/24/11 128422 117023 16310 0.0250 0.0188 0.0068 0.4881 0.0018 288.9 28.62 0.0952 0.0847 0.0122 1.5800 0.0089 299.6 27.42 0.0046 0.0000 0.0053 0.1896 0.0000 296.6 27.93 0.0104 0.0057 0.0054 0.2248 0.0000 266.2 31.10Focus RE20, Cert_E20 5/23/11 128422 213635 16291 0.0204 0.0166 0.0040 0.4490 0.0023 291.6 28.36 0.0783 0.0686 0.0112 1.4564 0.0092 306.2 26.86 0.0042 0.0028 0.0017 0.2015 0.0000 298.2 27.77 0.0073 0.0046 0.0030 0.1575 0.0014 268.0 30.91Focus RE20, Cert_E0 11/2/11 128422 1102745 120227 0.0379 0.0304 0.0079 0.5755 0.0585 283.6 30.95 0.0933 0.0792 0.0147 1.2257 0.2094 303.5 28.81 0.0256 0.0182 0.0077 0.4379 0.0187 288.5 30.45 0.0196 0.0167 0.0030 0.3466 0.0205 259.5 33.87Focus RE20, Cert_E0 11/1/11 128422 1102709 120208 0.0342 0.0267 0.0079 0.6479 0.0563 283.4 30.96 0.0949 0.0819 0.0135 1.6211 0.1677 298.5 29.23 0.0173 0.0111 0.0064 0.4233 0.0202 289.9 30.32 0.0203 0.0143 0.0063 0.3373 0.0404 260.0 33.80Focus RE20, Cert_E0 10/31/11 128422 1102698 120189 0.0373 0.0302 0.0073 0.7457 0.0543 283.1 30.98 0.1038 0.0909 0.0134 1.7769 0.1701 295.4 29.51 0.0167 0.0115 0.0053 0.3981 0.0155 289.4 30.37 0.0259 0.0196 0.0065 0.6218 0.0397 262.0 33.48Focus RE20, Cert_E0 9/9/11 128422 1101774 90245 0.0411 0.0338 0.0076 0.7479 0.0854 289.2 30.60 0.0958 0.0824 0.0139 1.3993 0.2250 299.7 29.42 0.0207 0.0164 0.0045 0.3284 0.0154 296.5 29.92 0.0384 0.0301 0.0086 1.0488 0.1122 267.6 33.00Focus RE20, Cert_E0 9/8/11 128422 1101751 90226 0.0400 0.0312 0.0092 0.5940 0.0661 290.6 30.48 0.0946 0.0813 0.0138 1.4677 0.2065 301.0 29.28 0.0262 0.0189 0.0076 0.2789 0.0293 296.1 29.97 0.0249 0.0165 0.0088 0.5279 0.0295 272.6 32.50Focus RE20, Cert_E0 9/7/11 128422 1101717 90207 0.0449 0.0367 0.0085 0.5630 0.0561 292.2 30.32 0.0923 0.0802 0.0126 1.2968 0.1547 310.1 28.45 0.0368 0.0301 0.0070 0.3354 0.0336 297.5 29.81 0.0245 0.0164 0.0083 0.4377 0.0241 268.7 33.00Focus RE20, Cert_E0 9/6/11 128422 1101687 90189 0.0412 0.0339 0.0076 0.4632 0.0562 290.8 30.48 0.0957 0.0840 0.0122 0.9972 0.1683 304.9 28.98 0.0296 0.0234 0.0065 0.3333 0.0226 295.5 30.02 0.0218 0.0158 0.0063 0.3050 0.0348 271.3 32.70Focus RE20, Cert_E0 7/27/11 128422 2100970 60238 0.0322 0.0242 0.0084 0.7127 0.0389 287.9 30.75 0.0814 0.0668 0.0154 1.5865 0.1309 304.0 28.98 0.0150 0.0097 0.0056 0.3249 0.0079 294.0 30.18 0.0275 0.0196 0.0084 0.7843 0.0279 264.4 33.46Focus RE20, Cert_E0 7/26/11 128422 2100948 60219 0.0331 0.0247 0.0089 0.7439 0.0436 287.9 30.74 0.0832 0.0699 0.0141 1.5663 0.1536 304.0 28.98 0.0157 0.0091 0.0070 0.3641 0.0181 295.1 30.06 0.0283 0.0201 0.0086 0.8405 0.0085 262.2 33.73Focus RE20, Cert_E0 7/25/11 128422 1100935 60200 0.0432 0.0349 0.0086 0.5715 0.0189 284.3 31.15 0.1033 0.0909 0.0128 1.2871 0.0564 300.6 29.35 0.0264 0.0193 0.0074 0.3777 0.0065 288.0 30.80 0.0295 0.0221 0.0076 0.3989 0.0142 265.2 33.43Focus RE20, Cert_E0 4/29/11 128422 116995 16272 0.0558 0.0470 0.0092 0.6578 0.0139 286.6 30.89 0.1413 0.1283 0.0151 1.5801 0.0137 303.3 29.03 0.0429 0.0356 0.0084 0.4759 0.0188 291.7 30.39 0.0157 0.0102 0.0064 0.3047 0.0050 264.4 33.56Focus RE20, Cert_E0 4/28/11 128422 116989 16254 0.0428 0.0355 0.0076 0.6204 0.0086 291.1 30.42 0.1255 0.1140 0.0133 1.6499 0.0119 308.7 28.52 0.0255 0.0197 0.0067 0.3711 0.0113 295.4 30.03 0.0134 0.0090 0.0051 0.3150 0.0010 269.8 32.89Focus RE20, Cert_E0 4/27/11 128422 116985 16235 0.0360 0.0302 0.0061 0.5909 0.0021 288.6 30.70 0.1213 0.1114 0.0115 1.6147 0.0047 304.7 28.90 0.0117 0.0078 0.0046 0.2662 0.0004 293.7 30.22 0.0178 0.0135 0.0050 0.4340 0.0035 266.6 33.25

Comparative Emissions Testing of Vehicles Aged on E0, E15 and E20 Fuels
48
Vehicle Model, Aging Fuel, Emissions Fuel
Test Start Date
Vehicle No. Test No.
Odometer
(Miles)
WTD Bag THC
(g/mi)
WTD Bag
NMHC (g/mi)
WTD Bag CH4
(g/mi)
WTD Bag CO (g/mi)
WTD Bag NOx
(g/mi)
WTD Bag CO2
(g/mi)
WTD Fuel Econ (mpg)
Bag PH1 THC
(g/mi)
Bag PH1
NMHC (g/mi)
Bag PH1 CH4
(g/mi)
Bag PH1 CO (g/mi)
Bag PH1 NOx
(g/mi)
Bag PH1 CO2
(g/mi)
PH1 Fuel Econ (mpg)
Bag PH2 THC
(g/mi)
Bag PH2
NMHC (g/mi)
Bag PH2 CH4
(g/mi)
Bag PH2 CO (g/mi)
Bag PH2 NOx
(g/mi)
Bag PH2 CO2
(g/mi)
PH2 Fuel Econ (mpg)
Bag PH3 THC
(g/mi)
Bag PH3
NMHC (g/mi)
Bag PH3 CH4
(g/mi)
Bag PH3 CO (g/mi)
Bag PH3 NOx
(g/mi)
Bag PH3 CO2
(g/mi)
PH3 Fuel Econ (mpg)
Camry RE0, Cert_E0 5/7/10 128418 116270 120131 0.0423 0.0309 0.0117 0.2647 0.0572 320.2 27.68 0.1487 0.1339 0.0171 1.0777 0.1791 341.6 25.82 0.0131 0.0046 0.0098 0.0046 0.0083 329.8 26.92 0.0177 0.0079 0.0114 0.1453 0.0582 285.9 31.02Camry RE0, Cert_E0 5/3/10 128418 116249 120112 0.0402 0.0295 0.0110 0.2744 0.0499 319.1 27.77 0.1439 0.1292 0.0170 1.1032 0.1892 339.1 26.01 0.0105 0.0026 0.0091 0.0158 0.0075 329.0 26.98 0.0178 0.0093 0.0099 0.1369 0.0247 285.6 31.06Camry RE0, Cert_E0 5/1/10 128418 116231 120075 0.0432 0.0339 0.0095 0.3246 0.0505 321.7 27.54 0.1607 0.1459 0.0171 1.3901 0.1368 344.0 25.60 0.0085 0.0028 0.0066 0.0145 0.0077 330.5 26.85 0.0204 0.0123 0.0093 0.1089 0.0664 288.0 30.80Camry RE0, Cert_E0 3/30/10 128418 116053 90132 0.0409 0.0307 0.0104 0.2830 0.0517 315.0 27.99 0.1493 0.1335 0.0162 1.2601 0.1762 333.0 26.33 0.0106 0.0027 0.0081 0.0076 0.0051 325.5 27.13 0.0166 0.0064 0.0105 0.0689 0.0462 281.3 31.38Camry RE0, Cert_E0 3/26/10 128418 116038 90095 0.0433 0.0341 0.0094 0.2389 0.0447 312.9 28.18 0.1554 0.1430 0.0144 1.0343 0.1253 328.4 26.72 0.0123 0.0059 0.0074 0.0159 0.0081 323.4 27.31 0.0175 0.0091 0.0096 0.0613 0.0534 281.3 31.38Camry RE0, Cert_E0 3/26/10 128418 116040 90113 0.0389 0.0293 0.0098 0.2528 0.0528 315.5 27.95 0.1383 0.1255 0.0148 1.1279 0.1486 338.9 25.89 0.0120 0.0047 0.0084 0.0079 0.0233 325.2 27.15 0.0147 0.0071 0.0087 0.0542 0.0360 279.6 31.57Camry RE0, Cert_E0 3/25/10 128418 116035 90076 0.0416 0.0327 0.0091 0.1984 0.0310 306.4 28.78 0.1565 0.1431 0.0155 0.8473 0.1232 326.8 26.87 0.0105 0.0041 0.0074 0.0097 0.0049 316.2 27.93 0.0138 0.0072 0.0076 0.0662 0.0107 272.5 32.40Camry RE0, Cert_E0 3/3/10 128418 115905 69987 0.0385 0.0289 0.0098 0.1998 0.0395 313.0 28.17 0.1415 0.1288 0.0147 0.8585 0.1401 335.9 26.15 0.0100 0.0026 0.0085 0.0113 0.0119 321.6 27.46 0.0146 0.0071 0.0086 0.0585 0.0156 279.7 31.56Camry RE0, Cert_E0 3/2/10 128418 115898 69968 0.0439 0.0345 0.0097 0.2615 0.0375 317.1 27.80 0.1569 0.1424 0.0167 1.1438 0.1248 338.9 25.88 0.0142 0.0075 0.0077 0.0259 0.0128 327.1 27.00 0.0149 0.0078 0.0081 0.0412 0.0183 282.0 31.30Camry RE0, Cert_E0 3/1/10 128418 115891 69950 0.0438 0.0357 0.0083 0.2681 0.0318 318.7 27.66 0.1656 0.1519 0.0159 1.1910 0.0941 344.1 25.49 0.0107 0.0056 0.0059 0.0183 0.0081 327.6 26.95 0.0141 0.0080 0.0071 0.0423 0.0293 282.8 31.22Camry RE0, Cert_E0 7/30/09 128418 115175 4141 0.0199 0.0174 0.0025 0.1040 0.0256 323.7 27.26 0.0866 0.0808 0.0068 0.4855 0.0894 343.7 25.62 0.0026 0.0013 0.0014 0.0000 0.0052 335.5 26.33 0.0022 0.0011 0.0013 0.0132 0.0160 286.4 30.84Camry RE0, Cert_E0 7/15/09 128418 410695 4085 0.0226 0.0205 0.0022 0.1666 0.0191 320.4 27.54 0.0968 0.0910 0.0067 0.6641 0.0367 345.8 25.44 0.0028 0.0022 0.0008 0.0413 0.0094 329.4 26.80 0.0039 0.0024 0.0017 0.0277 0.0241 284.2 31.07Camry RE0, Cert_E0 7/8/09 128418 410665 4065 0.0169 0.0150 0.0021 0.1529 0.0164 322.7 27.35 0.0707 0.0658 0.0056 0.6123 0.0520 349.7 25.17 0.0029 0.0019 0.0012 0.0373 0.0072 331.3 26.65 0.0028 0.0017 0.0012 0.0238 0.0067 286.0 30.88Camry RE0, Cert_E0 7/6/09 128418 410659 4044 0.0236 0.0216 0.0022 0.1879 0.0136 315.3 27.98 0.1023 0.0962 0.0070 0.7793 0.0397 339.2 25.92 0.0029 0.0024 0.0006 0.0344 0.0070 324.6 27.20 0.0034 0.0022 0.0015 0.0308 0.0064 279.5 31.59
Camry RE15, Cert_E15 6/9/10 128419 116398 120167 0.0400 0.0290 0.0113 0.2551 0.0513 323.5 25.99 0.1481 0.1325 0.0181 1.0629 0.1789 345.2 24.25 0.0101 0.0021 0.0092 0.0164 0.0120 335.0 25.14 0.0153 0.0065 0.0102 0.0977 0.0296 285.4 29.49Camry RE15, Cert_E15 6/7/10 128419 116389 120129 0.0380 0.0277 0.0106 0.2215 0.0530 326.1 25.79 0.1366 0.1225 0.0163 0.9842 0.1647 341.9 24.49 0.0100 0.0023 0.0088 0.0056 0.0169 341.8 24.64 0.0167 0.0084 0.0096 0.0553 0.0369 284.4 29.60Camry RE15, Cert_E15 5/28/10 128419 116357 120074 0.0391 0.0335 0.0070 0.2714 0.0518 326.7 25.74 0.1404 0.1259 0.0167 1.0306 0.1661 337.1 24.84 0.0111 0.0052 0.0068 0.0173 0.0131 338.6 24.87 0.0155 0.0155 0.0000 0.1783 0.0387 296.5 28.37Camry RE15, Cert_E15 4/20/10 128419 116166 90187 0.0341 0.0258 0.0087 0.1750 0.0355 323.5 26.03 0.1347 0.1207 0.0162 0.7582 0.1256 340.0 24.68 0.0055 0.0003 0.0061 0.0202 0.0071 336.4 25.06 0.0119 0.0051 0.0079 0.0259 0.0211 286.8 29.38Camry RE15, Cert_E15 4/19/10 128419 116161 90141 0.0303 0.0230 0.0075 0.1798 0.0560 319.5 26.35 0.1137 0.1024 0.0131 0.7760 0.1774 335.3 25.03 0.0066 0.0020 0.0053 0.0156 0.0263 331.6 25.42 0.0121 0.0058 0.0074 0.0394 0.0205 284.8 29.59Camry RE15, Cert_E15 4/18/10 128419 116155 90122 0.0308 0.0231 0.0079 0.1923 0.0383 321.1 26.22 0.1126 0.1018 0.0124 0.8706 0.1391 335.4 25.00 0.0077 0.0019 0.0067 0.0092 0.0176 335.4 25.13 0.0126 0.0067 0.0068 0.0247 0.0011 283.4 29.74Camry RE15, Cert_E15 4/17/10 128419 116152 90075 0.0373 0.0289 0.0086 0.1777 0.0361 322.0 26.15 0.1131 0.1005 0.0146 0.7370 0.1286 342.1 24.53 0.0181 0.0122 0.0068 0.0233 0.0102 333.4 25.27 0.0166 0.0101 0.0076 0.0481 0.0154 285.3 29.53Camry RE15, Cert_E15 3/11/10 128419 115950 60146 0.0325 0.0246 0.0081 0.1850 0.0373 320.0 26.31 0.1170 0.1043 0.0147 0.8074 0.1225 335.4 25.01 0.0096 0.0045 0.0059 0.0231 0.0095 332.4 25.35 0.0119 0.0056 0.0073 0.0209 0.0254 284.9 29.58Camry RE15, Cert_E15 3/11/10 128419 115945 60128 0.0346 0.0272 0.0076 0.2171 0.0400 319.0 26.39 0.1250 0.1141 0.0126 0.9479 0.1182 337.3 24.86 0.0106 0.0050 0.0065 0.0191 0.0095 330.4 25.51 0.0118 0.0067 0.0058 0.0400 0.0388 283.6 29.72Camry RE15, Cert_E15 3/9/10 128419 115937 60109 0.0474 0.0399 0.0076 0.3496 0.0310 315.4 26.67 0.1936 0.1772 0.0189 1.5930 0.1241 339.2 24.63 0.0080 0.0044 0.0041 0.0168 0.0084 323.8 26.03 0.0119 0.0068 0.0059 0.0426 0.0037 281.4 29.95Camry RE15, Cert_E15 12/18/09 128419 9115107 5691 0.0246 0.0209 0.0038 0.1199 0.0387 329.9 25.54 0.1040 0.0961 0.0092 0.5702 0.1122 349.4 24.04 0.0028 0.0014 0.0017 0.0000 0.0112 340.9 24.73 0.0061 0.0028 0.0039 0.0074 0.0354 294.2 28.65Camry RE15, Cert_E15 12/4/09 128419 9410967 5654 0.0321 0.0280 0.0045 0.1561 0.0472 319.6 26.35 0.1336 0.1224 0.0129 0.5916 0.0873 343.2 24.47 0.0050 0.0037 0.0016 0.0485 0.0313 328.2 25.68 0.0068 0.0036 0.0036 0.0303 0.0470 285.7 29.50Camry RE15, Cert_E15 11/3/09 128419 115404 5624 0.0380 0.0344 0.0036 0.1823 0.0301 323.5 26.03 0.1614 0.1502 0.0130 0.8009 0.0684 343.5 24.42 0.0055 0.0055 0.0001 0.0235 0.0130 333.6 25.27 0.0062 0.0033 0.0033 0.0158 0.0338 289.3 29.14Camry RE15, Cert_E0 6/15/10 128419 116418 120273 0.0399 0.0305 0.0096 0.2204 0.0519 322.9 27.45 0.1543 0.1385 0.0183 0.9765 0.1747 344.3 25.63 0.0069 0.0009 0.0069 0.0042 0.0183 333.0 26.65 0.0158 0.0087 0.0082 0.0589 0.0229 287.6 30.85Camry RE15, Cert_E0 6/14/10 128419 116414 120254 0.0440 0.0351 0.0091 0.2033 0.0408 324.0 27.36 0.1683 0.1558 0.0144 0.8836 0.1301 341.9 25.82 0.0096 0.0034 0.0071 0.0193 0.0120 335.4 26.47 0.0151 0.0075 0.0088 0.0370 0.0278 288.8 30.72Camry RE15, Cert_E0 6/11/10 128419 116404 120208 0.0395 0.0296 0.0101 0.2564 0.0438 322.8 27.46 0.1388 0.1240 0.0170 1.0956 0.1647 339.9 25.95 0.0120 0.0055 0.0075 0.0068 0.0067 334.2 26.56 0.0162 0.0077 0.0098 0.0923 0.0221 288.5 30.75Camry RE15, Cert_E0 4/28/10 128419 116218 90393 0.0413 0.0329 0.0086 0.1949 0.0537 323.0 27.45 0.1505 0.1370 0.0157 0.8604 0.1816 343.1 25.73 0.0120 0.0069 0.0059 0.0101 0.0125 334.5 26.54 0.0140 0.0069 0.0082 0.0407 0.0347 286.2 31.01Camry RE15, Cert_E0 4/27/10 128419 116213 90374 0.0377 0.0293 0.0086 0.1880 0.0348 321.5 27.58 0.1479 0.1351 0.0148 0.8445 0.1235 333.9 26.44 0.0070 0.0011 0.0068 0.0050 0.0053 334.6 26.53 0.0126 0.0063 0.0073 0.0384 0.0239 287.2 30.89Camry RE15, Cert_E0 4/26/10 128419 116206 90328 0.0378 0.0287 0.0093 0.1906 0.0372 323.3 27.42 0.1439 0.1309 0.0151 0.8430 0.1421 337.2 26.19 0.0093 0.0026 0.0077 0.0210 0.0070 334.7 26.52 0.0114 0.0044 0.0081 0.0181 0.0151 291.5 30.44Camry RE15, Cert_E0 3/18/10 128419 115991 60271 0.0333 0.0252 0.0083 0.2110 0.0319 306.5 28.77 0.1266 0.1143 0.0143 0.9115 0.1206 325.9 26.95 0.0076 0.0017 0.0069 0.0138 0.0113 317.1 27.84 0.0119 0.0062 0.0066 0.0576 0.0040 271.5 32.51Camry RE15, Cert_E0 3/17/10 128419 115988 60253 0.0380 0.0303 0.0079 0.1948 0.0212 309.5 28.50 0.1409 0.1289 0.0138 0.8947 0.0910 329.3 26.67 0.0113 0.0058 0.0063 0.0020 0.0037 319.7 27.62 0.0113 0.0057 0.0064 0.0331 0.0020 275.0 32.10Camry RE15, Cert_E0 3/15/10 128419 115962 60187 0.0356 0.0276 0.0082 0.2271 0.0498 320.5 27.52 0.1329 0.1198 0.0151 0.9984 0.1317 339.5 25.86 0.0097 0.0044 0.0061 0.0132 0.0340 331.4 26.65 0.0108 0.0048 0.0069 0.0472 0.0176 285.6 30.91Camry RE15, Cert_E0 7/24/09 128419 115163 4077 0.0273 0.0247 0.0026 0.1311 0.0262 329.8 26.76 0.1221 0.1161 0.0070 0.5962 0.0656 348.2 25.27 0.0023 0.0014 0.0011 0.0082 0.0091 343.7 25.69 0.0028 0.0009 0.0022 0.0119 0.0287 289.5 30.50Camry RE15, Cert_E0 7/7/09 128419 410664 4040 0.0231 0.0207 0.0026 0.2064 0.0175 320.4 27.53 0.0986 0.0919 0.0077 0.8655 0.0525 343.4 25.59 0.0030 0.0022 0.0009 0.0370 0.0037 330.1 26.75 0.0040 0.0024 0.0019 0.0287 0.0172 284.7 31.02Camry RE15, Cert_E0 7/6/09 128419 410660 4029 0.0230 0.0207 0.0025 0.1820 0.0186 320.2 27.55 0.0993 0.0930 0.0073 0.7494 0.0602 340.6 25.81 0.0027 0.0019 0.0010 0.0352 0.0036 330.4 26.72 0.0038 0.0023 0.0018 0.0306 0.0156 285.7 30.91
Camry RE20, Cert_E20 10/31/11 128423 1102684 120111 0.0479 0.0382 0.0100 0.3342 0.0481 308.0 26.64 0.1843 0.1668 0.0181 1.3802 0.1541 315.8 25.82 0.0090 0.0023 0.0069 0.0000 0.0121 322.0 25.54 0.0181 0.0087 0.0098 0.1737 0.0359 275.8 29.79Camry RE20, Cert_E20 10/28/11 128423 1102647 120093 0.0454 0.0369 0.0088 0.2586 0.0637 308.9 26.58 0.1785 0.1608 0.0184 1.1596 0.1762 320.5 25.48 0.0084 0.0025 0.0060 0.0000 0.0183 323.4 25.43 0.0149 0.0084 0.0067 0.0677 0.0645 272.9 30.12Camry RE20, Cert_E20 10/27/11 128423 1102621 120074 0.0425 0.0344 0.0084 0.2599 0.0589 307.7 26.69 0.1653 0.1481 0.0178 1.2066 0.1740 321.9 25.36 0.0082 0.0029 0.0055 0.0000 0.0173 319.8 25.72 0.0146 0.0082 0.0067 0.0377 0.0508 274.1 30.00Camry RE20, Cert_E20 9/10/11 128423 1101807 90131 0.0396 0.0314 0.0085 0.3279 0.0532 314.8 26.29 0.1508 0.1365 0.0149 1.4676 0.1193 327.3 25.12 0.0085 0.0021 0.0066 0.0000 0.0420 327.7 25.30 0.0142 0.0071 0.0073 0.0849 0.0243 281.2 29.46Camry RE20, Cert_E20 9/9/11 128423 1101776 90112 0.0481 0.0399 0.0086 0.2652 0.0454 313.7 26.39 0.1622 0.1472 0.0156 1.2425 0.1249 331.1 24.86 0.0181 0.0123 0.0061 0.0000 0.0220 324.2 25.57 0.0188 0.0111 0.0080 0.0301 0.0298 280.3 29.57Camry RE20, Cert_E20 9/8/11 128423 1101762 90094 0.0375 0.0299 0.0079 0.2460 0.0323 314.9 26.29 0.1419 0.1276 0.0149 1.1657 0.1025 328.1 25.10 0.0084 0.0029 0.0057 0.0000 0.0069 327.0 25.36 0.0136 0.0069 0.0069 0.0135 0.0271 282.3 29.36Camry RE20, Cert_E20 9/7/11 128423 1101720 90075 0.0486 0.0400 0.0090 0.3404 0.0215 318.8 25.95 0.1659 0.1475 0.0192 1.6436 0.0729 340.2 24.15 0.0176 0.0117 0.0062 0.0000 0.0069 328.3 25.25 0.0187 0.0125 0.0065 0.0000 0.0102 284.8 29.11Camry RE20, Cert_E20 7/22/11 128423 2100899 60093 0.0247 0.0200 0.0060 0.1835 0.0346 312.0 26.54 0.1038 0.0939 0.0104 0.8350 0.1039 329.2 25.07 0.0025 0.0000 0.0046 0.0125 0.0122 322.0 25.75 0.0069 0.0020 0.0052 0.0148 0.0248 280.2 29.59Camry RE20, Cert_E20 7/21/11 128423 2100886 60075 0.0192 0.0146 0.0063 0.1831 0.0378 311.7 26.58 0.0780 0.0684 0.0101 0.8361 0.0908 329.4 25.06 0.0020 0.0000 0.0048 0.0119 0.0176 322.8 25.69 0.0074 0.0016 0.0062 0.0134 0.0361 277.3 29.90Camry RE20, Cert_E20 7/20/11 128423 2100860 60056 0.0233 0.0184 0.0060 0.2287 0.0278 311.0 26.62 0.0984 0.0862 0.0129 1.0255 0.0640 322.9 25.53 0.0019 0.0000 0.0036 0.0127 0.0111 323.1 25.66 0.0070 0.0021 0.0052 0.0345 0.0320 279.3 29.68Camry RE20, Cert_E20 5/25/11 128423 117027 12387 0.0207 0.0175 0.0034 0.1242 0.0231 320.6 25.85 0.0903 0.0833 0.0081 0.6001 0.0506 335.3 24.64 0.0016 0.0000 0.0018 0.0000 0.0094 332.6 24.93 0.0042 0.0019 0.0027 0.0000 0.0282 286.5 28.94Camry RE20, Cert_E20 5/24/11 128423 117022 12368 0.0224 0.0196 0.0032 0.1138 0.0197 320.6 25.84 0.0994 0.0931 0.0073 0.5475 0.0470 336.8 24.54 0.0013 -0.0003 0.0019 0.0000 0.0102 332.4 24.95 0.0041 0.0017 0.0028 0.0000 0.0171 286.3 28.96Camry RE20, Cert_E20 5/23/11 128423 213634 12350 0.0189 0.0164 0.0026 0.1006 0.0254 323.2 25.64 0.0751 0.0688 0.0073 0.4512 0.0750 344.0 24.04 0.0032 0.0027 0.0006 0.0093 0.0116 334.3 24.80 0.0061 0.0037 0.0027 0.0092 0.0142 286.2 28.97Camry RE20, Cert_E0 11/4/11 128423 1102797 120225 0.0499 0.0413 0.0089 0.3698 0.0474 308.3 28.51 0.2000 0.1833 0.0173 1.5457 0.1580 323.3 26.99 0.0087 0.0023 0.0067 0.0104 0.0110 321.4 27.40 0.0140 0.0075 0.0068 0.1585 0.0326 272.0 32.35Camry RE20, Cert_E0 11/3/11 128423 1102773 120207 0.0488 0.0416 0.0075 0.3432 0.0599 306.4 28.68 0.1938 0.1777 0.0167 1.5025 0.1682 321.2 27.17 0.0083 0.0028 0.0057 0.0000 0.0222 321.2 27.42 0.0154 0.0117 0.0038 0.1120 0.0490 267.6 32.89Camry RE20, Cert_E0 11/1/11 128423 1102712 120159 0.0518 0.0437 0.0084 0.4800 0.0395 310.0 28.33 0.2039 0.1856 0.0190 1.9706 0.1399 324.2 26.86 0.0078 0.0033 0.0047 0.0000 0.0073 325.1 27.09 0.0197 0.0127 0.0073 0.2590 0.0246 270.7 32.49Camry RE20, Cert_E0 9/19/11 128423 1102030 90244 0.0328 0.0261 0.0070 0.1401 0.0452 316.5 27.81 0.1298 0.1191 0.0111 0.6720 0.1316 332.6 26.37 0.0057 0.0002 0.0058 0.0000 0.0131 327.5 26.89 0.0110 0.0051 0.0061 0.0045 0.0410 283.4 31.08Camry RE20, Cert_E0 9/16/11 128423 1101997 90225 0.0285 0.0226 0.0062 0.1147 0.0403 321.1 27.41 0.0993 0.0886 0.0111 0.5318 0.0942 339.9 25.83 0.0087 0.0049 0.0040 0.0000 0.0154 331.6 26.56 0.0124 0.0061 0.0066 0.0164 0.0466 287.1 30.67Camry RE20, Cert_E0 9/14/11 128423 1101941 90207 0.0341 0.0279 0.0065 0.1420 0.0409 318.2 27.66 0.1256 0.1167 0.0093 0.6860 0.1488 330.0 26.57 0.0097 0.0044 0.0055 0.0000 0.0066 329.5 26.73 0.0113 0.0052 0.0062 0.0000 0.0245 288.0 30.59Camry RE20, Cert_E0 7/29/11 128423 2101012 60274 0.0199 0.0163 0.0052 0.1690 0.0248 314.9 28.20 0.0842 0.0754 0.0093 0.7680 0.0749 335.9 26.35 0.0009 0.0000 0.0037 0.0123 0.0105 324.4 27.40 0.0074 0.0026 0.0051 0.0142 0.0142 281.2 31.61Camry RE20, Cert_E0 7/28/11 128423 2100992 60227 0.0295 0.0243 0.0055 0.1609 0.0286 316.7 28.04 0.1183 0.1099 0.0089 0.7297 0.0898 336.1 26.33 0.0049 0.0012 0.0040 0.0122 0.0104 327.0 27.19 0.0088 0.0033 0.0058 0.0126 0.0170 282.9 31.42Camry RE20, Cert_E0 7/26/11 128423 2100944 60190 0.0227 0.0168 0.0064 0.1959 0.0335 319.0 27.84 0.0865 0.0762 0.0108 0.8847 0.0844 339.3 26.07 0.0045 0.0000 0.0052 0.0171 0.0118 328.9 27.03 0.0088 0.0036 0.0055 0.0126 0.0358 284.9 31.20Camry RE20, Cert_E0 5/6/11 128423 213597 12331 0.0195 0.0168 0.0028 0.1513 0.0182 321.2 27.66 0.0755 0.0705 0.0057 0.6942 0.0512 341.4 25.94 0.0042 0.0024 0.0020 0.0085 0.0087 331.3 26.83 0.0059 0.0041 0.0021 0.0095 0.0109 286.9 30.98Camry RE20, Cert_E0 5/5/11 128423 213592 12312 0.0202 0.0183 0.0020 0.1448 0.0195 325.7 27.27 0.0816 0.0760 0.0065 0.6673 0.0531 342.3 25.88 0.0032 0.0027 0.0006 0.0077 0.0101 337.3 26.35 0.0060 0.0048 0.0014 0.0092 0.0117 291.2 30.53Camry RE20, Cert_E0 5/4/11 128423 213589 12294 0.0267 0.0239 0.0030 0.1319 0.0211 331.9 26.76 0.0851 0.0789 0.0072 0.6027 0.0435 351.4 25.21 0.0119 0.0108 0.0012 0.0091 0.0116 342.4 25.96 0.0106 0.0080 0.0030 0.0081 0.0222 297.3 29.90

Comparative Emissions Testing of Vehicles Aged on E0, E15 and E20 Fuels
49
Vehicle Model, Aging Fuel, Emissions Fuel
Test Start Date
Vehicle No. Test No.
Odometer
(Miles)
WTD Bag THC
(g/mi)
WTD Bag
NMHC (g/mi)
WTD Bag CH4
(g/mi)
WTD Bag CO (g/mi)
WTD Bag NOx
(g/mi)
WTD Bag CO2
(g/mi)
WTD Fuel Econ (mpg)
Bag PH1 THC
(g/mi)
Bag PH1
NMHC (g/mi)
Bag PH1 CH4
(g/mi)
Bag PH1 CO (g/mi)
Bag PH1 NOx
(g/mi)
Bag PH1 CO2
(g/mi)
PH1 Fuel Econ (mpg)
Bag PH2 THC
(g/mi)
Bag PH2
NMHC (g/mi)
Bag PH2 CH4
(g/mi)
Bag PH2 CO (g/mi)
Bag PH2 NOx
(g/mi)
Bag PH2 CO2
(g/mi)
PH2 Fuel Econ (mpg)
Bag PH3 THC
(g/mi)
Bag PH3
NMHC (g/mi)
Bag PH3 CH4
(g/mi)
Bag PH3 CO (g/mi)
Bag PH3 NOx
(g/mi)
Bag PH3 CO2
(g/mi)
PH3 Fuel Econ (mpg)
Outlook RE0, Cert_E0 5/25/10 128420 116346 120192 0.0613 0.0455 0.0163 1.3663 0.0346 478.0 18.48 0.1800 0.1486 0.0364 3.4888 0.1068 499.7 17.55 0.0244 0.0170 0.0086 0.8005 0.0071 490.9 18.03 0.0415 0.0280 0.0156 0.8311 0.0321 437.2 20.24Outlook RE0, Cert_E0 5/12/10 128420 116302 120174 0.0762 0.0567 0.0200 1.3558 0.0605 484.2 18.24 0.2527 0.2115 0.0476 3.5630 0.2072 518.6 16.91 0.0226 0.0138 0.0102 0.6669 0.0116 496.6 17.83 0.0440 0.0287 0.0177 0.9876 0.0418 434.7 20.34Outlook RE0, Cert_E0 5/11/10 128420 116293 120155 0.0614 0.0447 0.0172 1.2135 0.0420 477.2 18.52 0.1989 0.1650 0.0392 3.1958 0.1234 504.7 17.39 0.0198 0.0119 0.0092 0.8136 0.0072 488.5 18.12 0.0359 0.0226 0.0155 0.4684 0.0458 434.9 20.37Outlook RE0, Cert_E0 5/10/10 128420 116288 120108 0.0613 0.0441 0.0176 1.4105 0.0514 480.8 18.37 0.1821 0.1491 0.0382 2.7502 0.1421 509.3 17.26 0.0238 0.0157 0.0094 1.1091 0.0140 492.5 17.96 0.0408 0.0256 0.0176 0.9678 0.0535 437.3 20.22Outlook RE0, Cert_E0 4/3/10 128420 116094 90174 0.0624 0.0478 0.0150 0.9270 0.0625 486.7 18.18 0.1872 0.1591 0.0325 1.9255 0.1792 514.0 17.15 0.0228 0.0160 0.0078 0.6112 0.0214 498.9 17.75 0.0431 0.0298 0.0153 0.7690 0.0519 442.8 19.99Outlook RE0, Cert_E0 4/2/10 128420 116091 90155 0.0538 0.0378 0.0164 1.2462 0.0384 481.7 18.35 0.1674 0.1352 0.0372 2.7942 0.1141 498.4 17.64 0.0187 0.0110 0.0089 1.0104 0.0088 499.7 17.71 0.0346 0.0216 0.0150 0.5250 0.0373 435.0 20.36Outlook RE0, Cert_E0 4/2/10 128420 116079 90136 0.0548 0.0411 0.0140 0.8987 0.0246 479.7 18.45 0.1792 0.1509 0.0328 2.2388 0.0826 511.8 17.21 0.0176 0.0121 0.0064 0.5634 0.0001 491.9 18.01 0.0313 0.0188 0.0144 0.5211 0.0272 432.1 20.50Outlook RE0, Cert_E0 2/28/10 128420 115884 60266 0.0636 0.0493 0.0146 0.7961 0.0283 474.7 18.55 0.1917 0.1602 0.0364 2.3162 0.1065 507.9 17.24 0.0282 0.0227 0.0063 0.4295 0.0027 487.8 18.07 0.0337 0.0218 0.0138 0.3397 0.0174 424.9 20.75Outlook RE0, Cert_E0 2/27/10 128420 115877 60247 0.0661 0.0508 0.0156 0.7021 0.0485 482.0 18.27 0.1963 0.1672 0.0336 1.7221 0.1849 512.2 17.13 0.0252 0.0179 0.0085 0.3405 0.0040 496.1 17.78 0.0447 0.0313 0.0155 0.6125 0.0292 432.7 20.36Outlook RE0, Cert_E0 2/26/10 128420 115872 60229 0.0565 0.0432 0.0137 0.6705 0.0143 462.6 19.04 0.1633 0.1390 0.0281 2.0423 0.0534 482.8 18.15 0.0226 0.0159 0.0078 0.2407 0.0000 477.7 18.47 0.0402 0.0282 0.0139 0.4500 0.0118 418.9 21.04Outlook RE0, Cert_E0 7/31/09 128420 410738 4088 0.0292 0.0234 0.0063 0.2617 0.0116 490.8 17.98 0.1256 0.1078 0.0206 0.9201 0.0543 516.9 17.02 0.0026 0.0011 0.0018 0.0902 0.0000 503.9 17.52 0.0068 0.0033 0.0040 0.0889 0.0013 446.4 19.78Outlook RE0, Cert_E0 7/22/09 128420 410722 4068 0.0319 0.0258 0.0065 0.2804 0.0100 499.5 17.66 0.1343 0.1154 0.0218 0.8113 0.0481 533.0 16.52 0.0040 0.0025 0.0018 0.1248 0.0000 512.3 17.23 0.0070 0.0035 0.0040 0.1724 0.0000 450.3 19.60Outlook RE0, Cert_E0 7/12/09 128420 410680 4044 0.0235 0.0188 0.0051 0.2069 0.0081 478.8 18.43 0.0977 0.0824 0.0177 0.6516 0.0374 507.1 17.37 0.0032 0.0022 0.0011 0.0890 0.0000 487.8 18.10 0.0060 0.0033 0.0031 0.0940 0.0012 440.2 20.05Outlook RE0, Cert_E0 7/11/09 128420 410676 4033 0.0398 0.0345 0.0058 0.2336 0.0131 487.1 18.11 0.1770 0.1580 0.0219 0.7081 0.0632 517.7 17.00 0.0030 0.0023 0.0008 0.0850 0.0000 497.5 17.75 0.0057 0.0031 0.0030 0.1552 0.0000 444.3 19.86
Outlook RE15, Cert_E15 6/9/10 128421 116396 120140 0.0430 0.0308 0.0129 0.4886 0.0159 472.0 17.81 0.1654 0.1358 0.0342 1.5687 0.0745 498.2 16.81 0.0032 -0.0002 0.0040 0.1341 0.0000 484.6 17.37 0.0254 0.0138 0.0134 0.3415 0.0016 428.6 19.62Outlook RE15, Cert_E15 6/8/10 128421 116394 120121 0.0437 0.0314 0.0125 0.4263 0.0198 477.6 17.60 0.1586 0.1314 0.0314 1.1590 0.0931 508.6 16.48 0.0085 0.0043 0.0048 0.1615 0.0000 491.1 17.14 0.0228 0.0118 0.0128 0.3696 0.0017 429.0 19.60Outlook RE15, Cert_E15 6/7/10 128421 116386 120102 0.0395 0.0273 0.0125 0.3721 0.0116 478.8 17.56 0.1431 0.1184 0.0286 1.2339 0.0523 496.0 16.90 0.0088 0.0035 0.0062 0.1028 0.0000 496.6 16.95 0.0192 0.0086 0.0122 0.2294 0.0029 432.2 19.47Outlook RE15, Cert_E15 4/28/10 128421 116219 90193 0.0491 0.0358 0.0136 0.4980 0.0182 474.7 17.72 0.1774 0.1458 0.0365 1.7192 0.0868 512.1 16.36 0.0115 0.0070 0.0053 0.1160 0.0001 487.0 17.30 0.0232 0.0126 0.0122 0.2973 0.0004 423.4 19.89Outlook RE15, Cert_E15 4/27/10 128421 116215 90174 0.0371 0.0255 0.0121 0.3734 0.0226 480.4 17.52 0.1439 0.1180 0.0299 1.2478 0.1030 511.1 16.42 0.0052 0.0002 0.0058 0.1372 0.0023 493.7 17.07 0.0166 0.0076 0.0104 0.1593 0.0004 432.2 19.49Outlook RE15, Cert_E15 4/26/10 128421 116210 90155 0.0430 0.0306 0.0127 0.5303 0.0120 483.5 17.40 0.1561 0.1298 0.0304 1.9970 0.0572 508.4 16.47 0.0087 0.0037 0.0058 0.1322 0.0000 501.1 16.82 0.0224 0.0117 0.0124 0.1763 0.0007 431.4 19.52Outlook RE15, Cert_E15 3/14/10 128421 115960 60175 0.0390 0.0289 0.0104 0.3397 0.0148 489.6 17.19 0.1499 0.1274 0.0261 1.3467 0.0703 513.1 16.35 0.0073 0.0032 0.0047 0.0470 0.0000 508.3 16.58 0.0151 0.0071 0.0092 0.1306 0.0006 436.9 19.28Outlook RE15, Cert_E15 3/12/10 128421 115954 60157 0.0377 0.0291 0.0087 0.3114 0.0104 485.4 17.34 0.1284 0.1098 0.0215 1.2685 0.0403 500.9 16.75 0.0130 0.0099 0.0036 0.0666 0.0012 504.5 16.71 0.0158 0.0081 0.0088 0.0506 0.0052 438.0 19.24Outlook RE15, Cert_E15 3/11/10 128421 115946 60138 0.0395 0.0297 0.0100 0.4216 0.0200 480.0 17.54 0.1413 0.1160 0.0292 1.3935 0.0894 508.7 16.49 0.0125 0.0098 0.0031 0.1787 0.0016 491.7 17.14 0.0134 0.0060 0.0086 0.1448 0.0021 436.3 19.31Outlook RE15, Cert_E15 3/10/10 128421 115940 60119 0.0390 0.0288 0.0104 0.4526 0.0102 470.8 17.87 0.1537 0.1284 0.0293 1.4996 0.0464 490.5 17.09 0.0044 0.0016 0.0033 0.1580 0.0012 484.8 17.38 0.0175 0.0092 0.0096 0.2181 0.0000 429.6 19.61Outlook RE15, Cert_E15 12/18/09 128421 9115105 5617 0.0340 0.0268 0.0073 0.2454 0.0078 495.1 17.01 0.1303 0.1109 0.0225 0.8393 0.0363 519.1 16.19 0.0084 0.0065 0.0022 0.0671 0.0005 508.9 16.56 0.0095 0.0048 0.0055 0.1343 0.0001 451.2 18.67Outlook RE15, Cert_E15 12/14/09 128421 9115099 5598 0.0366 0.0294 0.0073 0.3092 0.0119 496.3 16.96 0.1401 0.1196 0.0237 0.7957 0.0561 515.9 16.29 0.0068 0.0056 0.0014 0.0916 0.0000 515.0 16.36 0.0142 0.0090 0.0061 0.3506 0.0009 446.4 18.86Outlook RE15, Cert_E15 11/2/09 128421 115400 5545 0.0292 0.0232 0.0062 0.2577 0.0094 501.1 16.81 0.1172 0.0991 0.0210 0.8824 0.0430 519.0 16.19 0.0057 0.0041 0.0019 0.0650 0.0008 520.9 16.18 0.0071 0.0043 0.0032 0.1487 0.0000 450.3 18.71Outlook RE15, Cert_E0 6/17/10 128421 116431 120246 0.0468 0.0336 0.0135 0.7102 0.0257 471.5 18.78 0.1593 0.1324 0.0311 1.7194 0.1191 499.3 17.66 0.0119 0.0061 0.0067 0.4158 0.0000 483.6 18.33 0.0268 0.0156 0.0129 0.4977 0.0030 427.9 20.71Outlook RE15, Cert_E0 6/16/10 128421 116428 120228 0.0447 0.0329 0.0121 0.6869 0.0160 473.6 18.69 0.1631 0.1390 0.0279 1.7621 0.0753 498.2 17.70 0.0065 0.0018 0.0055 0.4426 0.0000 487.3 18.19 0.0264 0.0156 0.0125 0.3305 0.0012 429.7 20.63Outlook RE15, Cert_E0 6/15/10 128421 116419 120181 0.0396 0.0282 0.0118 0.4741 0.0228 479.8 18.47 0.1491 0.1263 0.0264 1.1143 0.1044 508.9 17.37 0.0057 0.0008 0.0057 0.3162 0.0000 493.0 17.99 0.0206 0.0101 0.0122 0.2869 0.0041 433.1 20.47Outlook RE15, Cert_E0 5/3/10 128421 116250 90320 0.0422 0.0301 0.0124 0.7542 0.0194 481.3 18.39 0.1503 0.1218 0.0330 1.9594 0.0839 508.8 17.33 0.0099 0.0051 0.0055 0.5232 0.0000 494.7 17.91 0.0217 0.0131 0.0100 0.2819 0.0073 435.0 20.38Outlook RE15, Cert_E0 5/3/10 128421 116247 90301 0.0375 0.0270 0.0128 0.6234 0.0161 479.5 18.47 0.1426 0.1159 0.0309 1.5565 0.0775 506.2 17.44 0.0020 -0.0031 0.0058 0.3342 0.0000 492.8 18.00 0.0250 0.0145 0.0121 0.4636 0.0000 434.3 20.40Outlook RE15, Cert_E0 5/1/10 128421 116232 90236 0.0414 0.0302 0.0115 0.5700 0.0180 480.5 18.43 0.1498 0.1258 0.0278 1.6391 0.0848 504.0 17.51 0.0070 0.0023 0.0054 0.2572 0.0000 499.2 17.77 0.0241 0.0148 0.0107 0.3507 0.0013 427.9 20.71Outlook RE15, Cert_E0 3/21/10 128421 116011 60346 0.0387 0.0265 0.0125 0.4722 0.0167 486.7 18.11 0.1423 0.1163 0.0301 1.5095 0.0802 510.0 17.22 0.0065 0.0015 0.0059 0.1708 0.0000 499.2 17.68 0.0208 0.0108 0.0116 0.2557 0.0001 445.5 19.80Outlook RE15, Cert_E0 3/20/10 128421 116005 60327 0.0438 0.0342 0.0099 0.4431 0.0194 487.3 18.09 0.1624 0.1381 0.0282 1.4365 0.0905 514.1 17.09 0.0102 0.0077 0.0029 0.1500 0.0005 501.3 17.61 0.0174 0.0095 0.0092 0.2449 0.0012 440.6 20.03Outlook RE15, Cert_E0 3/19/10 128421 116001 60280 0.0348 0.0263 0.0087 0.3143 0.0130 470.2 18.76 0.1369 0.1176 0.0223 1.0017 0.0627 494.0 17.81 0.0038 0.0010 0.0032 0.0918 0.0000 482.7 18.29 0.0165 0.0088 0.0089 0.2158 0.0000 428.5 20.59Outlook RE15, Cert_E0 8/4/09 128421 410742 4087 0.0298 0.0239 0.0063 0.3179 0.0139 499.8 17.65 0.1266 0.1072 0.0224 0.9619 0.0672 536.5 16.40 0.0037 0.0023 0.0015 0.1372 0.0000 513.5 17.19 0.0061 0.0033 0.0032 0.1735 0.0000 446.4 19.77Outlook RE15, Cert_E0 7/24/09 128421 115164 4068 0.0308 0.0237 0.0073 0.3897 0.0121 496.8 17.75 0.1237 0.1026 0.0244 1.0817 0.0552 520.9 16.89 0.0052 0.0038 0.0016 0.1530 0.0013 518.0 17.04 0.0091 0.0045 0.0053 0.3128 0.0000 438.7 20.11Outlook RE15, Cert_E0 7/12/09 128421 410681 4048 0.0300 0.0252 0.0052 0.2242 0.0097 486.4 18.14 0.1290 0.1127 0.0189 0.5827 0.0468 509.9 17.27 0.0034 0.0026 0.0009 0.0917 0.0000 501.1 17.62 0.0054 0.0028 0.0031 0.2030 0.0000 440.9 20.01Outlook RE15, Cert_E0 7/12/09 128421 410677 4037 0.0353 0.0306 0.0051 0.2241 0.0101 487.4 18.10 0.1525 0.1365 0.0185 0.6601 0.0476 515.4 17.09 0.0041 0.0032 0.0010 0.0988 0.0006 500.8 17.63 0.0061 0.0037 0.0028 0.1321 0.0000 441.0 20.02
Outlook RE20, Cert_E20 11/10/11 128425 1102863 120102 0.0386 0.0275 0.0115 0.3510 0.0112 486.4 16.89 0.1495 0.1212 0.0294 1.2153 0.0537 511.0 16.02 0.0067 0.0017 0.0052 0.1210 0.0000 499.3 16.46 0.0148 0.0055 0.0097 0.1326 0.0002 443.4 18.54Outlook RE20, Cert_E20 11/9/11 128425 1102851 120083 0.0389 0.0277 0.0115 0.3829 0.0083 481.8 17.04 0.1524 0.1218 0.0318 1.4408 0.0396 502.3 16.29 0.0062 0.0017 0.0046 0.0829 0.0000 495.4 16.60 0.0150 0.0060 0.0093 0.1523 0.0005 440.8 18.65Outlook RE20, Cert_E20 11/8/11 128425 1102842 120065 0.0434 0.0329 0.0110 0.3076 0.0126 495.4 16.58 0.1656 0.1379 0.0288 1.0272 0.0589 542.2 15.11 0.0087 0.0048 0.0040 0.0907 0.0000 506.0 16.25 0.0165 0.0063 0.0106 0.1717 0.0014 440.2 18.67Outlook RE20, Cert_E20 9/22/11 128425 1102079 90155 0.0435 0.0328 0.0111 0.3934 0.0094 476.3 17.24 0.1556 0.1235 0.0334 1.6639 0.0429 502.5 16.27 0.0130 0.0091 0.0041 0.0172 0.0002 492.6 16.69 0.0162 0.0090 0.0075 0.1411 0.0012 426.0 19.29Outlook RE20, Cert_E20 9/21/11 128425 1102065 90136 0.0381 0.0284 0.0102 0.2962 0.0142 477.9 17.19 0.1416 0.1138 0.0289 1.0416 0.0656 508.0 16.12 0.0076 0.0029 0.0049 0.0436 0.0000 491.4 16.73 0.0177 0.0120 0.0060 0.2105 0.0021 429.6 19.13Outlook RE20, Cert_E20 9/16/11 128425 1101999 90080 0.0328 0.0242 0.0100 0.2614 0.0138 484.0 16.98 0.1381 0.1109 0.0283 1.1777 0.0593 519.4 15.77 0.0018 0.0000 0.0039 0.0201 0.0030 497.6 16.53 0.0124 0.0051 0.0076 0.0309 0.0001 432.1 19.03Outlook RE20, Cert_E20 7/29/11 128425 2101008 60122 0.0259 0.0167 0.0104 0.3370 0.0125 477.3 17.35 0.1018 0.0756 0.0277 1.2405 0.0602 513.8 16.07 0.0032 0.0000 0.0045 0.0808 0.0000 489.0 16.95 0.0116 0.0036 0.0084 0.1383 0.0000 427.9 19.37Outlook RE20, Cert_E20 7/28/11 128425 2100993 60103 0.0300 0.0206 0.0099 0.3536 0.0129 478.6 17.30 0.1175 0.0913 0.0277 1.4028 0.0616 505.2 16.33 0.0052 0.0013 0.0041 0.0805 0.0000 493.6 16.80 0.0105 0.0037 0.0072 0.0752 0.0004 430.5 19.25Outlook RE20, Cert_E20 7/27/11 128425 2100982 60084 0.0314 0.0223 0.0102 0.4001 0.0095 492.0 16.83 0.1293 0.1019 0.0290 1.5778 0.0447 524.1 15.73 0.0024 0.0000 0.0037 0.0538 0.0000 508.5 16.30 0.0123 0.0044 0.0084 0.1656 0.0008 436.7 18.98Outlook RE20, Cert_E20 5/25/11 128425 117030 11829 0.0297 0.0232 0.0079 0.2971 0.0140 483.2 17.14 0.1319 0.1107 0.0246 1.1563 0.0645 513.4 16.08 0.0000 -0.0020 0.0023 0.0195 0.0013 498.3 16.64 0.0086 0.0035 0.0058 0.1735 0.0000 432.1 19.18Outlook RE20, Cert_E20 5/24/11 128425 117024 11810 0.0343 0.0266 0.0086 0.2735 0.0203 483.0 17.15 0.1484 0.1270 0.0248 1.1563 0.0980 516.0 16.00 0.0025 -0.0007 0.0037 0.0052 0.0000 495.2 16.75 0.0083 0.0035 0.0055 0.1149 0.0000 435.1 19.05Outlook RE20, Cert_E20 5/23/11 128425 213636 11791 0.0315 0.0234 0.0086 0.3826 0.0152 487.4 16.99 0.1213 0.0998 0.0249 1.2040 0.0733 521.5 15.83 0.0045 0.0018 0.0031 0.0957 0.0000 497.7 16.66 0.0148 0.0092 0.0065 0.3037 0.0000 442.2 18.73Outlook RE20, Cert_E0 11/16/11 128425 1102976 120208 0.0468 0.0353 0.0120 0.7821 0.0194 482.0 18.22 0.1866 0.1533 0.0346 2.9661 0.0926 517.5 16.85 0.0081 0.0033 0.0050 0.2183 0.0000 498.0 17.68 0.0142 0.0065 0.0080 0.1945 0.0006 425.3 20.70Outlook RE20, Cert_E0 11/15/11 128425 1102932 120189 0.0407 0.0304 0.0107 0.4706 0.0301 482.1 18.24 0.1543 0.1292 0.0261 1.1604 0.1428 516.4 16.98 0.0086 0.0028 0.0060 0.3572 0.0000 496.3 17.73 0.0150 0.0075 0.0078 0.1620 0.0015 429.5 20.49Outlook RE20, Cert_E0 11/11/11 128425 1102880 120151 0.0354 0.0266 0.0108 0.5000 0.0159 488.5 18.00 0.1490 0.1204 0.0297 1.8010 0.0762 513.4 17.05 0.0015 0.0000 0.0048 0.1347 0.0000 506.7 17.38 0.0136 0.0061 0.0078 0.2080 0.0003 435.1 20.23Outlook RE20, Cert_E0 10/5/11 128425 1102289 90528 0.0482 0.0395 0.0090 0.7650 0.0210 480.8 18.27 0.1844 0.1562 0.0293 2.7410 0.1002 518.1 16.84 0.0126 0.0093 0.0035 0.2688 0.0001 491.8 17.89 0.0129 0.0087 0.0043 0.2155 0.0008 431.9 20.38Outlook RE20, Cert_E0 9/27/11 128425 1102147 90242 0.0427 0.0336 0.0106 0.8248 0.0292 479.1 18.33 0.1796 0.1476 0.0333 3.1726 0.1355 515.2 16.92 0.0025 0.0000 0.0049 0.2364 0.0016 492.9 17.86 0.0149 0.0107 0.0043 0.1560 0.0009 426.0 20.67Outlook RE20, Cert_E0 9/26/11 128425 1102131 90223 0.0547 0.0455 0.0095 0.7276 0.0321 480.9 18.27 0.2223 0.1972 0.0261 1.9053 0.1521 504.8 17.32 0.0075 0.0034 0.0042 0.5393 0.0000 499.4 17.61 0.0169 0.0101 0.0071 0.1924 0.0021 428.0 20.56Outlook RE20, Cert_E0 9/23/11 128425 1102101 90204 0.0335 0.0254 0.0093 0.3970 0.0212 480.1 18.32 0.1369 0.1119 0.0259 1.4957 0.0978 510.2 17.17 0.0033 0.0000 0.0051 0.0875 0.0010 492.8 17.87 0.0124 0.0081 0.0045 0.1519 0.0017 433.5 20.31Outlook RE20, Cert_E0 8/3/11 128425 2101099 60208 0.0327 0.0220 0.0115 0.7213 0.0158 479.1 18.51 0.1306 0.0994 0.0330 2.4606 0.0748 507.4 17.38 0.0040 0.0000 0.0044 0.3001 0.0000 494.0 17.98 0.0132 0.0051 0.0086 0.2056 0.0011 429.4 20.69Outlook RE20, Cert_E0 8/2/11 128425 2101087 60189 0.0289 0.0202 0.0100 0.4329 0.0201 481.5 18.43 0.1177 0.0929 0.0262 1.6222 0.0945 509.7 17.34 0.0032 0.0000 0.0049 0.1446 0.0000 495.7 17.92 0.0103 0.0033 0.0074 0.0790 0.0020 433.5 20.50Outlook RE20, Cert_E0 8/1/11 128425 2101060 60171 0.0343 0.0243 0.0117 0.6945 0.0090 489.4 18.12 0.1365 0.1054 0.0328 2.6587 0.0431 514.9 17.11 0.0021 0.0000 0.0042 0.0762 0.0001 509.5 17.44 0.0180 0.0087 0.0098 0.3770 0.0003 432.1 20.54Outlook RE20, Cert_E0 5/17/11 128425 213624 11754 0.0265 0.0204 0.0072 0.5527 0.0163 488.6 18.16 0.1161 0.0963 0.0230 1.4439 0.0781 518.1 17.07 0.0011 -0.0012 0.0027 0.4030 0.0002 500.7 17.73 0.0068 0.0035 0.0038 0.1626 0.0002 443.5 20.03Outlook RE20, Cert_E0 5/16/11 128425 213622 11735 0.0272 0.0215 0.0069 0.4569 0.0179 500.9 17.72 0.1216 0.1021 0.0225 1.5887 0.0864 527.2 16.77 0.0000 -0.0014 0.0017 0.1731 0.0000 515.7 17.23 0.0074 0.0030 0.0050 0.1393 0.0001 453.2 19.61Outlook RE20, Cert_E0 5/13/11 128425 213618 11716 0.0265 0.0198 0.0072 0.4353 0.0102 497.5 17.84 0.1127 0.0904 0.0258 1.3665 0.0493 518.2 17.07 0.0009 -0.0002 0.0013 0.1997 0.0000 509.8 17.43 0.0096 0.0058 0.0044 0.1764 0.0000 458.5 19.37

Comparative Emissions Testing of Vehicles Aged on E0, E15 and E20 Fuels
50
Vehicle Model, Aging Fuel, Emissions Fuel
Test Start Date
Vehicle No. Test No.
Odometer
(Miles)
WTD Bag THC
(g/mi)
WTD Bag
NMHC (g/mi)
WTD Bag CH4
(g/mi)
WTD Bag CO (g/mi)
WTD Bag NOx
(g/mi)
WTD Bag CO2
(g/mi)
WTD Fuel Econ (mpg)
Bag PH1 THC
(g/mi)
Bag PH1
NMHC (g/mi)
Bag PH1 CH4
(g/mi)
Bag PH1 CO (g/mi)
Bag PH1 NOx
(g/mi)
Bag PH1 CO2
(g/mi)
PH1 Fuel Econ (mpg)
Bag PH2 THC
(g/mi)
Bag PH2
NMHC (g/mi)
Bag PH2 CH4
(g/mi)
Bag PH2 CO (g/mi)
Bag PH2 NOx
(g/mi)
Bag PH2 CO2
(g/mi)
PH2 Fuel Econ (mpg)
Bag PH3 THC
(g/mi)
Bag PH3
NMHC (g/mi)
Bag PH3 CH4
(g/mi)
Bag PH3 CO (g/mi)
Bag PH3 NOx
(g/mi)
Bag PH3 CO2
(g/mi)
PH3 Fuel Econ (mpg)
2000 Accord RE0, Cert_E0 12/28/10 101021 213246 141628 0.1371 0.1045 0.0344 5.7415 0.1423 312.3 27.45 0.3481 0.3149 0.0384 7.3958 0.5594 332.7 25.56 0.0722 0.0402 0.0370 6.1026 0.0174 318.1 26.93 0.0998 0.0768 0.0266 3.8113 0.0626 286.0 30.212000 Accord RE0, Cert_E0 12/23/10 101021 116828 141590 0.1860 0.1416 0.0353 5.7052 0.1517 313.6 27.33 0.5624 0.4974 0.0386 7.4170 0.5967 337.9 25.14 0.0803 0.0425 0.0385 5.9604 0.0227 320.5 26.75 0.1016 0.0728 0.0267 3.9311 0.0592 282.3 30.582000 Accord RE0, Cert_E0 12/22/10 101021 116821 141570 0.1803 0.1358 0.0357 5.6795 0.1270 316.4 27.10 0.5849 0.5166 0.0410 8.1460 0.4943 338.6 25.00 0.0656 0.0287 0.0384 5.7104 0.0160 323.4 26.55 0.0922 0.0641 0.0265 3.7560 0.0601 286.2 30.212000 Accord RE0, Cert_E0 12/21/10 101021 116820 141550 0.1779 0.1377 0.0313 4.7867 0.1002 309.7 27.79 0.5772 0.5122 0.0377 7.6718 0.4046 335.2 25.30 0.0507 0.0199 0.0324 4.4091 0.0063 313.3 27.56 0.1181 0.0903 0.0245 3.3235 0.0486 283.7 30.532000 Accord RE0, Cert_E0 11/16/10 101021 116731 117316 0.1695 0.1401 0.0305 5.4125 0.1465 310.4 27.66 0.5230 0.4894 0.0388 7.6696 0.4914 331.4 25.59 0.0663 0.0398 0.0306 5.6194 0.0363 316.9 27.10 0.0987 0.0781 0.0238 3.3121 0.0958 282.0 30.732000 Accord RE0, Cert_E0 11/15/10 101021 116730 117297 0.1769 0.1458 0.0323 5.7369 0.1370 314.8 27.23 0.5268 0.4928 0.0393 8.2156 0.5206 334.9 25.28 0.0712 0.0422 0.0336 5.7354 0.0267 322.3 26.64 0.1121 0.0909 0.0245 3.8677 0.0557 285.5 30.262000 Accord RE0, Cert_E0 11/12/10 101021 116723 117277 0.1666 0.1365 0.0313 5.1270 0.1390 310.3 27.70 0.5655 0.5294 0.0417 8.3460 0.4884 330.0 25.61 0.0488 0.0219 0.0312 4.7793 0.0434 316.5 27.25 0.0896 0.0692 0.0237 3.3617 0.0570 283.6 30.542000 Accord RE0, Cert_E0 9/29/10 101021 116638 91564 0.0846 0.0692 0.0111 1.6472 0.0768 323.2 27.09 0.3309 0.2930 0.0223 4.6076 0.3270 340.3 25.34 0.0191 0.0117 0.0073 0.8984 0.0032 332.3 26.47 0.0219 0.0123 0.0097 0.8181 0.0260 293.3 29.982000 Accord RE0, Cert_E0 9/9/10 101021 212915 91545 0.0467 0.0414 0.0083 1.4354 0.0780 322.5 27.19 0.2078 0.1913 0.0191 3.9712 0.3493 342.4 25.29 0.0000 0.0000 0.0052 0.9692 0.0006 331.2 26.55 0.0138 0.0086 0.0060 0.4062 0.0202 291.0 30.292000 Accord RE0, Cert_E0 9/8/10 101021 212901 91525 0.0489 0.0410 0.0089 1.6094 0.0811 314.1 27.89 0.1848 0.1685 0.0188 3.9902 0.3466 332.2 26.05 0.0036 0.0000 0.0050 0.9881 0.0081 321.1 27.38 0.0319 0.0243 0.0087 0.9870 0.0186 287.0 30.61
2000 Accord RE15, Cert_E15 12/2/10 101015 116789 146186 0.1405 0.1071 0.0265 2.1819 0.2131 317.2 26.29 0.4583 0.4033 0.0338 3.7798 0.6558 333.9 24.73 0.0469 0.0222 0.0255 1.9730 0.0697 323.3 25.85 0.0785 0.0542 0.0230 1.3735 0.1514 293.1 28.572000 Accord RE15, Cert_E15 11/23/10 101015 116760 146166 0.1352 0.1088 0.0274 2.1038 0.2058 324.9 25.69 0.4440 0.4141 0.0346 3.7310 0.6814 342.8 24.12 0.0460 0.0226 0.0271 1.8629 0.0484 332.9 25.12 0.0712 0.0517 0.0225 1.3336 0.1453 296.3 28.272000 Accord RE15, Cert_E15 11/22/10 101015 116756 146135 0.1293 0.1054 0.0248 1.9690 0.1873 319.4 26.14 0.4364 0.4085 0.0323 3.4630 0.6341 337.6 24.51 0.0400 0.0198 0.0234 1.8189 0.0375 324.8 25.75 0.0667 0.0477 0.0219 1.1224 0.1337 295.1 28.412000 Accord RE15, Cert_E15 8/4/10 101015 116561 120397 0.1106 0.0902 0.0212 1.9225 0.0897 313.3 26.66 0.4169 0.3882 0.0333 4.2162 0.4016 333.6 24.72 0.0254 0.0090 0.0190 1.4474 0.0000 318.5 26.31 0.0405 0.0265 0.0162 1.0898 0.0239 288.0 29.132000 Accord RE15, Cert_E15 8/3/10 101015 116560 120378 0.1009 0.0818 0.0198 2.1929 0.0881 316.8 26.33 0.3795 0.3548 0.0286 3.8178 0.3977 336.1 24.59 0.0217 0.0062 0.0179 1.8857 0.0039 324.1 25.80 0.0404 0.0259 0.0167 1.5464 0.0136 288.5 29.002000 Accord RE15, Cert_E15 8/2/10 101015 116555 120359 0.0992 0.0799 0.0201 2.0682 0.0976 314.3 26.56 0.3567 0.3307 0.0301 3.6674 0.4345 333.5 24.80 0.0218 0.0062 0.0180 1.8848 0.0029 321.2 26.03 0.0514 0.0372 0.0164 1.2071 0.0226 286.7 29.232000 Accord RE15, Cert_E15 6/30/10 101015 116487 95507 0.0487 0.0416 0.0074 1.0747 0.1259 320.9 26.10 0.2036 0.1892 0.0167 2.2000 0.3568 342.6 24.29 0.0054 0.0019 0.0040 0.8586 0.0762 326.6 25.68 0.0141 0.0082 0.0068 0.6347 0.0457 293.7 28.582000 Accord RE15, Cert_E15 6/29/10 101015 116484 95488 0.0478 0.0396 0.0086 1.0956 0.0954 323.3 25.90 0.1961 0.1821 0.0161 2.0517 0.3641 343.3 24.26 0.0060 0.0014 0.0053 0.9259 0.0152 329.7 25.43 0.0146 0.0068 0.0091 0.6927 0.0435 296.3 28.322000 Accord RE15, Cert_E15 6/25/10 101015 116477 95450 0.0571 0.0499 0.0074 0.9401 0.1101 327.1 25.62 0.2391 0.2237 0.0178 2.3291 0.3910 348.0 23.90 0.0077 0.0049 0.0032 0.6088 0.0299 333.7 25.16 0.0129 0.0065 0.0074 0.5168 0.0496 298.9 28.102000 Accord RE15, Cert_E0 10/13/10 101015 212989 146039 0.1114 0.0851 0.0278 3.2377 0.1742 321.2 27.04 0.3384 0.3060 0.0375 6.5805 0.5381 347.4 24.62 0.0401 0.0172 0.0265 2.5810 0.0407 327.8 26.61 0.0750 0.0551 0.0230 1.9546 0.1521 288.9 30.232000 Accord RE15, Cert_E0 10/12/10 101015 212984 146020 0.1133 0.0874 0.0274 3.0230 0.2045 316.7 27.45 0.3564 0.3237 0.0377 6.3307 0.5994 337.2 25.36 0.0371 0.0143 0.0264 2.2731 0.0857 323.8 26.97 0.0733 0.0547 0.0216 1.9372 0.1303 287.8 30.342000 Accord RE15, Cert_E0 10/11/10 101015 212983 146000 0.1100 0.0841 0.0274 3.2560 0.1973 321.8 27.00 0.3328 0.3048 0.0324 5.4667 0.6030 343.2 25.04 0.0392 0.0147 0.0284 2.9635 0.0709 328.9 26.47 0.0756 0.0569 0.0217 2.1392 0.1300 292.1 29.882000 Accord RE15, Cert_E0 8/13/10 101015 212797 120524 0.1163 0.0858 0.0323 4.4102 0.1259 308.5 27.97 0.3438 0.3085 0.0409 7.8116 0.4466 331.2 25.63 0.0494 0.0204 0.0336 3.8739 0.0205 315.4 27.46 0.0714 0.0513 0.0232 2.8586 0.0837 278.1 31.232000 Accord RE15, Cert_E0 8/10/10 101015 116578 120497 0.1409 0.1128 0.0292 4.2608 0.1351 320.1 26.99 0.4127 0.3815 0.0361 6.5952 0.4480 337.9 25.27 0.0517 0.0262 0.0295 3.7453 0.0455 328.2 26.43 0.1047 0.0844 0.0235 3.4767 0.0689 291.6 29.712000 Accord RE15, Cert_E0 8/6/10 101015 116565 120459 0.1585 0.1292 0.0304 4.3272 0.0938 321.4 27.01 0.4894 0.4560 0.0387 6.9741 0.3609 337.8 25.34 0.0497 0.0223 0.0317 3.9913 0.0151 330.7 26.33 0.1132 0.0944 0.0218 2.9583 0.0399 291.3 29.962000 Accord RE15, Cert_E0 6/24/10 101015 116471 95378 0.0685 0.0587 0.0102 1.7537 0.0918 325.7 27.01 0.2786 0.2628 0.0182 3.7650 0.1947 340.6 25.55 0.0133 0.0058 0.0087 1.4813 0.0327 334.1 26.38 0.0137 0.0077 0.0069 0.7455 0.1255 298.5 29.622000 Accord RE15, Cert_E0 6/23/10 101015 116466 95359 0.0635 0.0545 0.0094 1.5622 0.0840 325.2 27.08 0.2705 0.2542 0.0188 3.7503 0.2841 343.7 25.33 0.0077 0.0014 0.0073 1.2245 0.0336 333.5 26.47 0.0128 0.0073 0.0064 0.5467 0.0281 295.4 29.962000 Accord RE15, Cert_E0 6/22/10 101015 116462 95340 0.0644 0.0527 0.0122 2.0085 0.0696 320.5 27.41 0.2616 0.2445 0.0198 3.6516 0.2254 332.7 26.16 0.0126 0.0020 0.0123 1.9554 0.0149 329.7 26.67 0.0135 0.0079 0.0065 0.8665 0.0553 293.7 30.08
2000 Accord RE20, Cert_E20 1/27/11 101022 116865 139759 0.0713 0.0555 0.0123 1.1499 0.1432 332.1 24.53 0.2857 0.2505 0.0222 2.3721 0.5553 351.0 23.05 0.0124 0.0047 0.0081 0.9733 0.0086 339.5 24.04 0.0210 0.0089 0.0126 0.5616 0.0872 303.9 26.892000 Accord RE20, Cert_E20 1/25/11 101022 116857 139740 0.0740 0.0586 0.0117 0.9721 0.1299 325.8 25.03 0.3053 0.2685 0.0227 2.0632 0.5185 348.7 23.23 0.0124 0.0046 0.0082 0.9196 0.0092 333.6 24.46 0.0156 0.0063 0.0098 0.2479 0.0642 293.9 27.852000 Accord RE20, Cert_E20 1/21/11 101022 116852 139721 0.0662 0.0516 0.0113 1.2293 0.1334 329.3 24.73 0.2681 0.2363 0.0194 2.0004 0.5062 352.6 22.99 0.0119 0.0036 0.0088 1.4129 0.0090 336.8 24.18 0.0165 0.0070 0.0099 0.2979 0.0871 297.5 27.512000 Accord RE20, Cert_E20 12/3/10 101022 213162 114592 0.0409 0.0326 0.0088 0.8851 0.1229 332.2 24.57 0.1588 0.1449 0.0161 1.5175 0.5191 358.4 22.69 0.0063 0.0005 0.0068 0.9310 0.0020 336.3 24.27 0.0167 0.0106 0.0071 0.3204 0.0508 304.4 26.882000 Accord RE20, Cert_E20 12/2/10 101022 116785 114570 0.0661 0.0557 0.0094 0.9091 0.1304 333.9 24.43 0.3024 0.2678 0.0203 1.8876 0.5094 357.1 22.71 0.0009 -0.0040 0.0057 0.8631 0.0016 341.1 23.94 0.0108 0.0030 0.0083 0.2555 0.0875 302.9 27.022000 Accord RE20, Cert_E20 12/1/10 101022 116782 114550 0.0606 0.0479 0.0109 0.8707 0.1127 334.3 24.41 0.2643 0.2313 0.0209 1.9975 0.4803 360.0 22.53 0.0060 -0.0013 0.0080 0.7445 0.0058 341.0 23.96 0.0107 0.0026 0.0087 0.2596 0.0382 302.1 27.102000 Accord RE20, Cert_E20 10/25/10 101022 116683 89687 0.0602 0.0482 0.0125 1.0823 0.1108 339.9 23.98 0.2325 0.2167 0.0183 1.6429 0.4480 367.3 22.12 0.0153 0.0057 0.0112 1.2929 0.0046 344.8 23.63 0.0149 0.0058 0.0105 0.2591 0.0570 309.9 26.422000 Accord RE20, Cert_E20 10/22/10 101022 116678 89669 0.0687 0.0591 0.0100 0.8688 0.1200 337.5 24.18 0.2880 0.2724 0.0181 1.5513 0.4817 356.9 22.76 0.0097 0.0036 0.0071 0.9062 0.0035 343.7 23.75 0.0146 0.0066 0.0093 0.2842 0.0668 310.9 26.322000 Accord RE20, Cert_E20 10/21/10 101022 213032 89649 0.0381 0.0300 0.0090 0.6339 0.1065 332.4 24.58 0.1495 0.1352 0.0165 1.3777 0.4366 353.3 23.03 0.0046 0.0000 0.0057 0.4350 0.0001 336.9 24.28 0.0174 0.0092 0.0095 0.4499 0.0593 307.9 26.562000 Accord RE20, Cert_E20 10/20/10 101022 213024 89630 0.0351 0.0284 0.0073 0.7615 0.1170 332.2 24.58 0.1433 0.1294 0.0160 1.7300 0.4611 356.8 22.77 0.0035 0.0000 0.0042 0.6637 0.0036 335.9 24.33 0.0130 0.0073 0.0066 0.2138 0.0718 306.7 26.702000 Accord RE20, Cert_E0 2/4/11 101022 116889 139898 0.0692 0.0563 0.0114 1.0765 0.1173 335.9 26.14 0.3018 0.2676 0.0200 2.8975 0.4863 355.1 24.48 0.0046 -0.0030 0.0085 0.7138 0.0025 344.0 25.59 0.0155 0.0057 0.0104 0.3864 0.0556 306.2 28.782000 Accord RE20, Cert_E0 2/3/11 101022 116887 139879 0.0705 0.0574 0.0111 1.0783 0.1134 333.8 26.31 0.3053 0.2719 0.0187 2.6475 0.4516 356.2 24.44 0.0053 -0.0022 0.0083 0.8396 0.0062 340.4 25.84 0.0175 0.0073 0.0106 0.3505 0.0622 304.3 28.972000 Accord RE20, Cert_E0 2/2/11 101022 116884 139860 0.0803 0.0654 0.0108 0.9961 0.1077 337.4 26.03 0.3352 0.2981 0.0211 2.6449 0.4417 351.3 24.77 0.0128 0.0062 0.0068 0.6378 0.0036 346.7 25.39 0.0155 0.0053 0.0107 0.4266 0.0525 309.0 28.522000 Accord RE20, Cert_E0 12/8/10 101022 213185 114673 0.0525 0.0446 0.0128 1.2793 0.1376 332.1 26.43 0.2254 0.2060 0.0224 2.9088 0.5885 359.3 24.23 0.0028 -0.0070 0.0114 1.1207 0.0087 337.1 26.07 0.0162 0.0091 0.0082 0.3493 0.0415 302.2 29.182000 Accord RE20, Cert_E0 12/7/10 101022 213175 114654 0.0523 0.0443 0.0096 1.2346 0.1047 333.3 26.34 0.2222 0.2026 0.0226 3.8245 0.4364 354.3 24.47 0.0029 -0.0017 0.0054 0.6604 0.0089 340.1 25.90 0.0174 0.0107 0.0077 0.3643 0.0355 304.5 28.952000 Accord RE20, Cert_E0 12/6/10 101022 213165 114634 0.0436 0.0377 0.0083 0.9341 0.1097 333.9 26.33 0.1852 0.1702 0.0173 2.4951 0.4574 358.1 24.36 0.0006 -0.0036 0.0048 0.5673 0.0056 338.5 26.03 0.0179 0.0107 0.0084 0.4491 0.0442 306.9 28.712000 Accord RE20, Cert_E0 10/19/10 101022 213020 89588 0.0408 0.0351 0.0075 0.8477 0.1120 332.4 26.46 0.1767 0.1602 0.0190 2.7381 0.3897 351.1 24.82 0.0000 0.0000 0.0029 0.2760 0.0512 339.9 25.96 0.0148 0.0083 0.0076 0.4950 0.0166 304.1 28.972000 Accord RE20, Cert_E0 10/18/10 101022 213013 89569 0.0497 0.0409 0.0094 1.0699 0.0941 335.1 26.21 0.2052 0.1870 0.0211 2.7572 0.4025 354.3 24.59 0.0054 0.0005 0.0056 0.7985 0.0000 341.8 25.75 0.0164 0.0098 0.0076 0.3102 0.0394 308.0 28.632000 Accord RE20, Cert_E0 10/16/10 101022 213007 89550 0.0519 0.0423 0.0101 0.8803 0.0886 332.5 26.44 0.1909 0.1720 0.0219 2.4575 0.3911 348.9 25.00 0.0125 0.0070 0.0064 0.5394 0.0013 340.3 25.89 0.0217 0.0146 0.0082 0.3364 0.0258 305.4 28.87

Comparative Emissions Testing of Vehicles Aged on E0, E15 and E20 Fuels
51
Vehicle Model, Aging Fuel, Emissions Fuel
Test Start Date
Vehicle No. Test No.
Odometer
(Miles)
WTD Bag THC
(g/mi)
WTD Bag
NMHC (g/mi)
WTD Bag CH4
(g/mi)
WTD Bag CO (g/mi)
WTD Bag NOx
(g/mi)
WTD Bag CO2
(g/mi)
WTD Fuel Econ (mpg)
Bag PH1 THC
(g/mi)
Bag PH1
NMHC (g/mi)
Bag PH1 CH4
(g/mi)
Bag PH1 CO (g/mi)
Bag PH1 NOx
(g/mi)
Bag PH1 CO2
(g/mi)
PH1 Fuel Econ (mpg)
Bag PH2 THC
(g/mi)
Bag PH2
NMHC (g/mi)
Bag PH2 CH4
(g/mi)
Bag PH2 CO (g/mi)
Bag PH2 NOx
(g/mi)
Bag PH2 CO2
(g/mi)
PH2 Fuel Econ (mpg)
Bag PH3 THC
(g/mi)
Bag PH3
NMHC (g/mi)
Bag PH3 CH4
(g/mi)
Bag PH3 CO (g/mi)
Bag PH3 NOx
(g/mi)
Bag PH3 CO2
(g/mi)
PH3 Fuel Econ (mpg)
2000 Focus RE0, Cert_E0 12/2/10 102001 116787 153194 0.1257 0.1044 0.0148 1.3164 0.0890 334.1 26.25 0.4993 0.4401 0.0360 4.9539 0.2964 353.4 24.35 0.0245 0.0156 0.0087 0.2263 0.0227 340.6 25.90 0.0342 0.0234 0.0103 0.6225 0.0573 307.3 28.652000 Focus RE0, Cert_E0 11/30/10 102001 116777 153175 0.1275 0.1058 0.0151 1.4290 0.0889 322.3 27.18 0.5198 0.4556 0.0404 5.5403 0.2905 343.6 24.95 0.0231 0.0150 0.0079 0.2370 0.0211 326.3 27.04 0.0274 0.0176 0.0096 0.5646 0.0640 298.9 29.462000 Focus RE0, Cert_E0 11/29/10 102001 116774 153156 0.1205 0.0998 0.0145 1.3520 0.0725 323.0 27.14 0.4778 0.4211 0.0344 4.9247 0.2366 340.4 25.26 0.0261 0.0171 0.0087 0.4352 0.0158 328.5 26.83 0.0302 0.0195 0.0104 0.3971 0.0563 299.5 29.422000 Focus RE0, Cert_E0 8/24/10 102001 212837 128092 0.0376 0.0322 0.0057 0.4135 0.1031 321.7 27.39 0.1475 0.1368 0.0124 1.5368 0.3056 346.5 25.29 0.0056 0.0026 0.0034 0.1177 0.0112 325.1 27.16 0.0150 0.0108 0.0048 0.1236 0.1237 296.9 29.732000 Focus RE0, Cert_E0 8/23/10 102001 212835 128074 0.0390 0.0339 0.0054 0.5475 0.0949 318.7 27.63 0.1543 0.1424 0.0138 1.7186 0.3097 346.6 25.26 0.0037 0.0020 0.0019 0.0654 0.0090 318.0 27.77 0.0187 0.0138 0.0057 0.5726 0.0947 299.0 29.452000 Focus RE0, Cert_E0 8/20/10 102001 212831 128055 0.0427 0.0377 0.0053 0.8165 0.0974 318.3 27.63 0.1708 0.1579 0.0149 2.7871 0.3301 345.8 25.19 0.0034 0.0024 0.0012 0.0842 0.0094 318.8 27.69 0.0204 0.0153 0.0059 0.7146 0.0882 296.4 29.682000 Focus RE0, Cert_E0 7/7/10 102001 116514 103106 0.0886 0.0788 0.0101 0.6031 0.0916 316.6 27.93 0.3243 0.3081 0.0188 1.4863 0.2957 334.2 26.30 0.0311 0.0236 0.0086 0.4029 0.0171 322.3 27.48 0.0185 0.0130 0.0063 0.3123 0.0774 292.7 30.272000 Focus RE0, Cert_E0 7/6/10 102001 116510 103087 0.0810 0.0739 0.0075 0.5557 0.0881 317.8 27.84 0.3140 0.2995 0.0168 1.5513 0.2827 331.8 26.48 0.0215 0.0170 0.0051 0.2433 0.0122 323.3 27.42 0.0165 0.0123 0.0048 0.3876 0.0829 296.9 29.842000 Focus RE0, Cert_E0 7/5/10 102001 116506 103069 0.0833 0.0764 0.0072 0.4885 0.1026 319.8 27.67 0.3193 0.3054 0.0161 1.5642 0.2729 335.4 26.19 0.0220 0.0179 0.0048 0.2351 0.0112 326.7 27.13 0.0210 0.0168 0.0049 0.1563 0.1465 294.8 30.08
2000 Focus RE15, Cert_E15 12/2/10 102015 116788 135788 0.0618 0.0443 0.0146 0.4512 0.1334 317.9 26.47 0.2134 0.1822 0.0222 1.7295 0.3677 342.8 24.38 0.0181 0.0064 0.0123 0.0082 0.0418 320.8 26.30 0.0296 0.0166 0.0130 0.3204 0.1287 293.7 28.682000 Focus RE15, Cert_E15 11/30/10 102015 116779 135769 0.0614 0.0428 0.0157 0.4786 0.1414 317.7 26.49 0.2182 0.1827 0.0269 1.9103 0.3763 341.6 24.45 0.0163 0.0046 0.0125 0.0425 0.0260 320.9 26.29 0.0276 0.0144 0.0135 0.2172 0.1809 293.8 28.692000 Focus RE15, Cert_E15 11/29/10 102015 116772 135750 0.0595 0.0412 0.0155 0.3371 0.1092 313.6 26.86 0.2043 0.1744 0.0213 1.3636 0.3398 338.3 24.75 0.0177 0.0045 0.0141 0.0414 0.0290 315.6 26.73 0.0291 0.0154 0.0139 0.1212 0.0866 291.0 28.982000 Focus RE15, Cert_E15 9/7/10 102015 212896 110542 0.0385 0.0289 0.0101 0.3088 0.1645 309.4 27.23 0.1177 0.1034 0.0165 1.3188 0.6196 335.1 25.01 0.0157 0.0087 0.0081 0.0400 0.0238 312.5 27.00 0.0218 0.0139 0.0092 0.0543 0.0868 284.2 29.692000 Focus RE15, Cert_E15 9/3/10 102015 212887 110523 0.0378 0.0274 0.0110 0.3461 0.2098 309.5 27.21 0.1148 0.1011 0.0158 1.5150 0.3352 337.4 24.82 0.0143 0.0063 0.0092 0.0300 0.0634 309.6 27.26 0.0241 0.0149 0.0107 0.0610 0.3918 288.3 29.262000 Focus RE15, Cert_E15 8/31/10 102015 212869 110470 0.0439 0.0297 0.0149 0.3685 0.1609 310.5 27.12 0.1370 0.1110 0.0301 1.5448 0.3384 339.1 24.69 0.0170 0.0077 0.0107 0.0308 0.0879 309.5 27.26 0.0245 0.0146 0.0114 0.1199 0.1651 290.9 28.992000 Focus RE15, Cert_E15 7/28/10 102015 116542 85691 0.0643 0.0540 0.0108 0.3085 0.0944 311.9 27.00 0.2383 0.2250 0.0153 1.1255 0.2855 338.5 24.75 0.0173 0.0092 0.0094 0.0332 0.0287 313.3 26.93 0.0212 0.0127 0.0099 0.2083 0.0734 289.2 29.152000 Focus RE15, Cert_E15 7/26/10 102015 212721 85654 0.0393 0.0292 0.0103 0.5100 0.0824 309.8 27.07 0.1440 0.1227 0.0216 2.0658 0.2586 332.8 25.00 0.0082 0.0012 0.0071 0.0360 0.0295 313.4 26.84 0.0193 0.0116 0.0078 0.2327 0.0495 285.8 29.402000 Focus RE15, Cert_E15 7/23/10 102015 212717 85635 0.0436 0.0333 0.0104 0.4225 0.0917 305.2 27.59 0.1354 0.1205 0.0173 1.6806 0.2630 328.4 25.46 0.0170 0.0097 0.0084 0.0729 0.0221 307.6 27.43 0.0242 0.0164 0.0090 0.1296 0.0931 283.1 29.782000 Focus RE15, Cert_E0 10/25/10 102015 116685 135646 0.0599 0.0477 0.0126 0.4679 0.1242 330.0 26.69 0.1954 0.1799 0.0180 1.8133 0.3171 351.8 24.87 0.0215 0.0124 0.0105 0.0563 0.0365 334.6 26.39 0.0292 0.0184 0.0125 0.2206 0.1422 305.2 28.912000 Focus RE15, Cert_E0 10/21/10 102015 213033 135608 0.0443 0.0326 0.0124 0.5112 0.1207 315.5 27.92 0.1321 0.1168 0.0176 1.9915 0.3189 338.8 25.80 0.0190 0.0091 0.0114 0.0753 0.0587 317.9 27.77 0.0260 0.0171 0.0102 0.2210 0.0887 293.3 30.082000 Focus RE15, Cert_E0 10/20/10 102015 213027 135589 0.0433 0.0325 0.0114 0.5349 0.1057 320.0 27.52 0.1383 0.1227 0.0180 1.8788 0.3380 342.9 25.51 0.0139 0.0069 0.0081 0.0637 0.0265 322.9 27.35 0.0271 0.0162 0.0125 0.4096 0.0797 297.3 29.642000 Focus RE15, Cert_E0 9/15/10 102015 212928 110677 0.0422 0.0305 0.0124 0.5835 0.0913 311.4 28.28 0.1299 0.1119 0.0208 2.0598 0.2969 337.9 25.86 0.0150 0.0067 0.0096 0.0843 0.0150 313.0 28.21 0.0273 0.0176 0.0112 0.4092 0.0797 288.4 30.562000 Focus RE15, Cert_E0 9/14/10 102015 212925 110658 0.0407 0.0296 0.0117 0.6770 0.0889 313.8 28.04 0.1350 0.1185 0.0191 2.3587 0.2733 340.2 25.66 0.0118 0.0037 0.0094 0.1013 0.0294 316.1 27.93 0.0241 0.0150 0.0105 0.4980 0.0625 289.7 30.412000 Focus RE15, Cert_E0 9/13/10 102015 212923 110639 0.0405 0.0297 0.0114 0.5105 0.1003 313.4 28.10 0.1292 0.1133 0.0184 2.0525 0.3020 334.3 26.14 0.0132 0.0050 0.0094 0.0588 0.0148 316.4 27.91 0.0252 0.0168 0.0097 0.2042 0.1101 291.9 30.222000 Focus RE15, Cert_E0 7/15/10 102015 116533 85518 0.0855 0.0755 0.0103 0.4029 0.0737 313.7 28.22 0.3300 0.3171 0.0150 1.2058 0.2672 336.9 26.12 0.0215 0.0135 0.0092 0.0922 0.0122 316.6 28.02 0.0210 0.0133 0.0089 0.3813 0.0433 290.5 30.492000 Focus RE15, Cert_E0 7/14/10 102015 116529 85499 0.0645 0.0553 0.0096 0.4764 0.0769 314.7 28.13 0.2365 0.2212 0.0177 1.8266 0.2467 338.6 25.93 0.0190 0.0131 0.0068 0.0417 0.0144 317.6 27.94 0.0205 0.0128 0.0089 0.2749 0.0666 291.0 30.452000 Focus RE15, Cert_E0 7/13/10 102015 116524 85481 0.0866 0.0784 0.0085 0.2778 0.0846 317.3 27.92 0.3496 0.3360 0.0158 1.0183 0.2900 338.3 26.03 0.0158 0.0112 0.0053 0.0545 0.0147 321.3 27.62 0.0213 0.0135 0.0091 0.1389 0.0612 293.7 30.19
2000 Focus RE20, Cert_E20 1/21/11 102021 116853 120097 0.0719 0.0556 0.0127 1.1633 0.1735 313.1 26.01 0.2679 0.2341 0.0217 2.6246 0.5062 333.6 24.21 0.0172 0.0081 0.0094 0.6786 0.0340 317.7 25.71 0.0263 0.0145 0.0120 0.9701 0.1842 289.0 28.212000 Focus RE20, Cert_E20 1/19/11 102021 213328 120066 0.0589 0.0476 0.0120 1.0698 0.2070 311.6 26.16 0.1970 0.1773 0.0227 2.8533 0.5372 330.9 24.40 0.0184 0.0120 0.0074 0.4407 0.0646 314.5 26.00 0.0309 0.0200 0.0126 0.9065 0.2257 291.3 28.002000 Focus RE20, Cert_E20 1/18/11 102021 213324 120048 0.0576 0.0464 0.0119 0.8072 0.1901 309.4 26.37 0.1966 0.1756 0.0242 2.3262 0.5178 331.0 24.46 0.0167 0.0103 0.0074 0.2443 0.0570 312.5 26.19 0.0298 0.0203 0.0110 0.7202 0.1932 287.2 28.422000 Focus RE20, Cert_E20 12/3/10 102021 213163 95022 0.0473 0.0402 0.0075 0.3852 0.2024 313.4 26.09 0.1779 0.1633 0.0169 1.5425 0.3977 334.2 24.31 0.0078 0.0045 0.0038 0.0603 0.0227 316.3 25.91 0.0231 0.0169 0.0072 0.1248 0.3943 292.3 28.022000 Focus RE20, Cert_E20 12/1/10 102021 116783 94985 0.0691 0.0575 0.0080 0.3447 0.1713 314.4 26.01 0.2886 0.2555 0.0195 1.4211 0.3623 331.1 24.53 0.0071 0.0039 0.0033 0.0280 0.0215 318.6 25.73 0.0196 0.0114 0.0082 0.1262 0.3078 293.9 27.872000 Focus RE20, Cert_E20 11/30/10 102021 116776 94965 0.0743 0.0617 0.0087 0.4768 0.1418 313.5 26.07 0.3221 0.2843 0.0228 1.8507 0.4717 335.5 24.16 0.0054 0.0017 0.0039 0.0485 0.0337 316.3 25.91 0.0163 0.0091 0.0072 0.2424 0.0953 291.8 28.052000 Focus RE20, Cert_E20 10/15/10 102021 213000 70100 0.0451 0.0389 0.0067 0.4682 0.1729 314.3 26.01 0.1664 0.1509 0.0179 1.6318 0.3281 330.3 24.59 0.0090 0.0076 0.0015 0.0606 0.0249 319.9 25.62 0.0214 0.0147 0.0077 0.3534 0.3332 291.8 28.032000 Focus RE20, Cert_E20 10/14/10 102021 212991 70081 0.0401 0.0345 0.0071 0.5682 0.1468 315.6 25.89 0.1788 0.1620 0.0194 2.3385 0.2964 335.3 24.14 0.0000 0.0000 0.0023 0.0363 0.0182 319.0 25.69 0.0107 0.0048 0.0069 0.2309 0.2756 294.4 27.812000 Focus RE20, Cert_E20 10/13/10 102021 212988 70063 0.0400 0.0346 0.0067 0.3698 0.1514 316.6 25.83 0.1768 0.1618 0.0173 1.5129 0.3283 336.6 24.15 0.0000 0.0000 0.0018 0.0603 0.0247 321.3 25.51 0.0117 0.0050 0.0077 0.0862 0.2542 292.9 27.982000 Focus RE20, Cert_E20 10/12/10 102021 212985 70044 0.0378 0.0322 0.0060 0.4500 0.1494 318.6 25.66 0.1583 0.1442 0.0163 1.8174 0.3320 339.2 23.93 0.0017 0.0002 0.0018 0.0448 0.0164 322.5 25.41 0.0150 0.0096 0.0062 0.1815 0.2619 295.8 27.682000 Focus RE20, Cert_E0 2/1/11 102021 116882 120226 0.0849 0.0669 0.0137 1.7161 0.2331 321.6 27.21 0.3277 0.2884 0.0242 3.6378 0.5942 341.4 25.36 0.0178 0.0077 0.0105 1.1978 0.0874 326.1 26.92 0.0277 0.0160 0.0118 1.2398 0.2346 298.2 29.422000 Focus RE20, Cert_E0 1/28/11 102021 116873 120200 0.0873 0.0694 0.0135 1.9915 0.2387 316.6 27.60 0.3238 0.2864 0.0222 3.6642 0.5660 334.5 25.87 0.0208 0.0105 0.0105 1.6016 0.1202 321.0 27.29 0.0333 0.0206 0.0125 1.4570 0.2138 294.8 29.722000 Focus RE20, Cert_E0 1/27/11 102021 116866 120181 0.0891 0.0715 0.0131 1.9604 0.2453 314.5 27.79 0.3359 0.2965 0.0237 3.6734 0.5147 333.0 25.99 0.0198 0.0108 0.0090 1.5746 0.1430 319.0 27.47 0.0333 0.0205 0.0126 1.3936 0.2345 292.0 30.012000 Focus RE20, Cert_E0 12/9/10 102021 213190 95101 0.0530 0.0433 0.0115 1.0376 0.1384 314.8 27.91 0.2174 0.1944 0.0266 3.1772 0.3928 334.3 25.98 0.0038 -0.0018 0.0065 0.3887 0.0283 317.2 27.80 0.0215 0.0133 0.0095 0.6459 0.1539 295.4 29.792000 Focus RE20, Cert_E0 12/7/10 102021 213176 95084 0.0496 0.0418 0.0096 0.7622 0.1407 314.1 28.00 0.2069 0.1876 0.0223 2.5996 0.3764 333.6 26.11 0.0021 -0.0022 0.0050 0.1943 0.0249 317.9 27.77 0.0202 0.0126 0.0088 0.4430 0.1804 292.3 30.142000 Focus RE20, Cert_E0 12/6/10 102021 213166 95063 0.0494 0.0412 0.0087 0.7237 0.1326 314.1 28.01 0.1980 0.1794 0.0215 2.4602 0.3707 335.3 26.00 0.0038 0.0003 0.0040 0.1428 0.0232 317.2 27.83 0.0230 0.0163 0.0077 0.5039 0.1583 292.4 30.122000 Focus RE20, Cert_E0 8/30/10 102021 212858 70003 0.0398 0.0354 0.0061 0.5984 0.1022 319.4 27.57 0.1718 0.1584 0.0155 2.2179 0.3089 335.8 26.00 0.0000 0.0000 0.0028 0.0998 0.0127 322.5 27.38 0.0155 0.0111 0.0052 0.3185 0.1154 301.1 29.282000 Focus RE20, Cert_E0 8/27/10 102021 212855 69984 0.0413 0.0375 0.0050 0.4814 0.0774 317.1 27.78 0.1795 0.1675 0.0139 1.9474 0.3097 336.0 26.01 0.0000 0.0000 0.0019 0.0622 0.0063 320.5 27.55 0.0150 0.0114 0.0042 0.1661 0.0361 296.3 29.782000 Focus RE20, Cert_E0 8/26/10 102021 212850 69965 0.0455 0.0400 0.0058 0.5326 0.0778 316.8 27.80 0.1872 0.1726 0.0169 2.0764 0.3356 336.4 25.96 0.0048 0.0028 0.0023 0.0983 0.0028 320.3 27.57 0.0152 0.0117 0.0040 0.1843 0.0244 295.5 29.86

Comparative Emissions Testing of Vehicles Aged on E0, E15 and E20 Fuels
52
10.2 Cylinder Compression and Leak-Down Reports
128414-E0 Honda Odyssey (VIN: 5FNRL38229B024871)
CYLINDER RESULTS CYLINDER RESULTS CYLINDER RESULTS CYLINDER RESULTS CYLINDER RESULTS CYLINDER RESULTS1 179 psi 1 180 psi 1 180 psi 1 0% 1 0% 1 0%2 180 psi 2 180 psi 2 180 psi 2 0% 2 0% 2 0%3 180 psi 3 180 psi 3 180 psi 3 0% 3 0% 3 0%4 180 psi 4 180 psi 4 180 psi 4 0% 4 0% 4 0%5 180 psi 5 180 psi 5 180 psi 5 0% 5 0% 5 0%6 180 psi 6 180 psi 6 180 psi 6 0% 6 0% 6 0%
CYLINDER RESULTS CYLINDER RESULTS CYLINDER RESULTS CYLINDER RESULTS CYLINDER RESULTS CYLINDER RESULTS1 190 psi 1 190 psi 1 190 psi 1 0% 1 0% 1 0%2 190 psi 2 190 psi 2 190 psi 2 0% 2 0% 2 0%3 190 psi 3 190 psi 3 190 psi 3 0% 3 0% 3 0%4 190 psi 4 190 psi 4 190 psi 4 0% 4 0% 4 0%5 190 psi 5 190 psi 5 190 psi 5 0% 5 0% 5 0%6 190 psi 6 190 psi 6 190 psi 6 0% 6 0% 6 0%
CYLINDER RESULTS CYLINDER RESULTS CYLINDER RESULTS CYLINDER RESULTS CYLINDER RESULTS CYLINDER RESULTS1 190 psi 1 190 psi 1 190 psi 1 0% 1 0% 1 0%2 190 psi 2 190 psi 2 190 psi 2 0% 2 0% 2 0%3 190 psi 3 190 psi 3 190 psi 3 0% 3 0% 3 0%4 190 psi 4 190 psi 4 190 psi 4 0% 4 0% 4 0%5 190 psi 5 190 psi 5 190 psi 5 0% 5 0% 5 0%6 190 psi 6 190 psi 6 190 psi 6 0% 6 0% 6 0%
CYLINDER RESULTS CYLINDER RESULTS CYLINDER RESULTS CYLINDER RESULTS CYLINDER RESULTS CYLINDER RESULTS1 200 psi 1 205 psi 1 205 psi 1 0% 1 0% 1 0%2 205 psi 2 205 psi 2 200 psi 2 0% 2 0% 2 0%3 205 psi 3 205 psi 3 200 psi 3 0% 3 0% 3 0%4 200 psi 4 200 psi 4 205 psi 4 0% 4 0% 4 0%5 205 psi 5 200 psi 5 205 psi 5 0% 5 0% 5 0%6 200 psi 6 205 psi 6 200 psi 6 0% 6 0% 6 0%
COMPRESSION TEST AT 120158 MILES CYLINDER LEAK DOWN TEST AT 120158 MILESTEST #1 TEST #2 TEST #3 TEST #1 TEST #2 TEST #3
COMPRESSION TEST AT 90309 MILES CYLINDER LEAK DOWN TEST AT 90309 MILESTEST #1 TEST #2 TEST #3 TEST #1 TEST #2 TEST #3
COMPRESSION TEST AT 60286 MILES CYLINDER LEAK DOWN TEST AT 60286 MILESTEST #1 TEST #2 TEST #3 TEST #1 TEST #2 TEST #3
CYLINDER LEAK DOWN TEST AT 4126 MILESTEST #1 TEST #2 TEST #3
COMPRESSION TEST AT 4126 MILESTEST #1 TEST #2 TEST #3

Comparative Emissions Testing of Vehicles Aged on E0, E15 and E20 Fuels
53
128415-E15 Honda Odyssey (VIN: 5FNRL38219B024876)
CYLINDER RESULTS CYLINDER RESULTS CYLINDER RESULTS CYLINDER RESULTS CYLINDER RESULTS CYLINDER RESULTS1 180 psi 1 180 psi 1 180 psi 1 0% 1 0% 1 0%2 180 psi 2 180 psi 2 180 psi 2 0% 2 0% 2 0%3 180 psi 3 180 psi 3 180 psi 3 0% 3 0% 3 0%4 180 psi 4 180 psi 4 180 psi 4 0% 4 0% 4 0%5 180 psi 5 180 psi 5 180 psi 5 0% 5 0% 5 0%6 180 psi 6 180 psi 6 180 psi 6 0% 6 0% 6 0%
CYLINDER RESULTS CYLINDER RESULTS CYLINDER RESULTS CYLINDER RESULTS CYLINDER RESULTS CYLINDER RESULTS1 190 psi 1 190 psi 1 190 psi 1 0% 1 0% 1 0%2 190 psi 2 190 psi 2 190 psi 2 0% 2 0% 2 0%3 190 psi 3 190 psi 3 190 psi 3 0% 3 0% 3 0%4 190 psi 4 190 psi 4 190 psi 4 0% 4 0% 4 0%5 190 psi 5 190 psi 5 190 psi 5 0% 5 0% 5 0%6 190 psi 6 190 psi 6 190 psi 6 0% 6 0% 6 0%
CYLINDER RESULTS CYLINDER RESULTS CYLINDER RESULTS CYLINDER RESULTS CYLINDER RESULTS CYLINDER RESULTS1 190 psi 1 190 psi 1 190 psi 1 0% 1 0% 1 0%2 190 psi 2 190 psi 2 190 psi 2 0% 2 0% 2 0%3 190 psi 3 190 psi 3 190 psi 3 0% 3 0% 3 0%4 190 psi 4 190 psi 4 190 psi 4 0% 4 0% 4 0%5 190 psi 5 190 psi 5 190 psi 5 0% 5 0% 5 0%6 190 psi 6 190 psi 6 190 psi 6 0% 6 0% 6 0%
CYLINDER RESULTS CYLINDER RESULTS CYLINDER RESULTS CYLINDER RESULTS CYLINDER RESULTS CYLINDER RESULTS1 190 psi 1 190 psi 1 190 psi 1 0% 1 0% 1 0%2 185 psi 2 185 psi 2 185 psi 2 0% 2 0% 2 0%3 185 psi 3 185 psi 3 185 psi 3 0% 3 0% 3 0%4 190 psi 4 190 psi 4 190 psi 4 0% 4 0% 4 0%5 185 psi 5 185 psi 5 185 psi 5 0% 5 0% 5 0%6 185 psi 6 185 psi 6 185 psi 6 0% 6 0% 6 0%
COMPRESSION TEST AT 120408 MILES CYLINDER LEAK DOWN TEST AT 120408 MILESTEST #1 TEST #2 TEST #3 TEST #1 TEST #2 TEST #3
COMPRESSION TEST AT 90326 MILES CYLINDER LEAK DOWN TEST AT 90326 MILESTEST #1 TEST #2 TEST #3 TEST #1 TEST #2 TEST #3
COMPRESSION TEST AT 60341 MILES CYLINDER LEAK DOWN TEST AT 60341 MILESTEST #1 TEST #2 TEST #3 TEST #1 TEST #2 TEST #3
COMPRESSION TEST AT 5619 MILES CYLINDER LEAK DOWN TEST AT 5619 MILESTEST #1 TEST #2 TEST #3 TEST #1 TEST #2 TEST #3

Comparative Emissions Testing of Vehicles Aged on E0, E15 and E20 Fuels
54
128424-E20 Honda Odyssey (VIN: 5FNRL38289B033459)
CYLINDER RESULTS CYLINDER RESULTS CYLINDER RESULTS CYLINDER RESULTS CYLINDER RESULTS CYLINDER RESULTS1 170 1 170 1 170 1 5% 1 5% 1 5%2 170 2 165 2 165 2 10% 2 10% 2 10%3 170 3 165 3 170 3 5% 3 5% 3 5%4 170 4 170 4 170 4 5% 4 5% 4 5%5 165 5 165 5 170 5 10% 5 10% 5 10%6 170 6 170 6 170 6 5% 6 5% 6 5%
CYLINDER RESULTS CYLINDER RESULTS CYLINDER RESULTS CYLINDER RESULTS CYLINDER RESULTS CYLINDER RESULTS1 180 1 180 1 180 1 5% 1 5% 1 5%2 180 2 180 2 180 2 5% 2 5% 2 5%3 180 3 180 3 180 3 5% 3 5% 3 5%4 180 4 180 4 180 4 5% 4 5% 4 5%5 180 5 180 5 180 5 5% 5 5% 5 5%6 180 6 180 6 180 6 5% 6 5% 6 5%
CYLINDER RESULTS CYLINDER RESULTS CYLINDER RESULTS CYLINDER RESULTS CYLINDER RESULTS CYLINDER RESULTS1 175 1 170 1 170 1 5% 1 5% 1 5%2 175 2 175 2 175 2 5% 2 5% 2 5%3 175 3 170 3 175 3 10% 3 10% 3 10%4 170 4 175 4 175 4 10% 4 10% 4 10%5 175 5 175 5 170 5 5% 5 5% 5 5%6 170 6 175 6 170 6 10% 6 10% 6 10%
CYLINDER RESULTS CYLINDER RESULTS CYLINDER RESULTS CYLINDER RESULTS CYLINDER RESULTS CYLINDER RESULTS1 185 1 185 1 180 1 5% 1 5% 1 5%2 180 2 180 2 180 2 5% 2 5% 2 5%3 180 3 180 3 180 3 5% 3 5% 3 5%4 180 4 185 4 185 4 10% 4 10% 4 10%5 180 5 180 5 180 5 5% 5 5% 5 5%6 185 6 185 6 180 6 5% 6 5% 6 5%
COMPRESSION TEST AT 120309 MILES CYLINDER LEAK DOWN TEST AT 120309 MILESTEST #1 TEST #2 TEST #3 TEST #1 TEST #2 TEST #3
TEST #3TEST #2TEST #1TEST #3TEST #2TEST #1COMPRESSION TEST AT 90205 MILES CYLINDER LEAK DOWN TEST AT 90205 MILES
COMPRESSION TEST AT 60249 MILES CYLINDER LEAK DOWN TEST AT 60249 MILESTEST #1 TEST #2 TEST #3 TEST #1 TEST #2 TEST #3
COMPRESSION TEST AT 25144 MILES CYLINDER LEAK DOWN TEST AT 25144 MILESTEST #1 TEST #2 TEST #3 TEST #1 TEST #2 TEST #3

Comparative Emissions Testing of Vehicles Aged on E0, E15 and E20 Fuels
55
128416-E0 Ford Focus (VIN: 1FAHP35N29W172017)
CYLINDER RESULTS CYLINDER RESULTS CYLINDER RESULTS CYLINDER RESULTS CYLINDER RESULTS CYLINDER RESULTS1 170 psi 1 170 psi 1 170 psi 1 0% 1 0% 1 0%2 170 psi 2 170 psi 2 170 psi 2 0% 2 0% 2 0%3 170 psi 3 170 psi 3 170 psi 3 0% 3 0% 3 0%4 170 psi 4 170 psi 4 170 psi 4 0% 4 0% 4 0%
CYLINDER RESULTS CYLINDER RESULTS CYLINDER RESULTS CYLINDER RESULTS CYLINDER RESULTS CYLINDER RESULTS1 165 psi 1 165 psi 1 165 psi 1 0% 1 0% 1 0%2 165 psi 2 165 psi 2 165 psi 2 0% 2 0% 2 0%3 165 psi 3 165 psi 3 165 psi 3 0% 3 0% 3 0%4 165 psi 4 165 psi 4 165 psi 4 0% 4 0% 4 0%
CYLINDER RESULTS CYLINDER RESULTS CYLINDER RESULTS CYLINDER RESULTS CYLINDER RESULTS CYLINDER RESULTS1 170 psi 1 170 psi 1 170 psi 1 0% 1 0% 1 0%2 170 psi 2 170 psi 2 170 psi 2 0% 2 0% 2 0%3 170 psi 3 170 psi 3 170 psi 3 0% 3 0% 3 0%4 170 psi 4 170 psi 4 170 psi 4 0% 4 0% 4 0%
CYLINDER RESULTS CYLINDER RESULTS CYLINDER RESULTS CYLINDER RESULTS CYLINDER RESULTS CYLINDER RESULTS1 175 psi 1 175 psi 1 175 psi 1 0% 1 0% 1 0%2 175 psi 2 175 psi 2 175 psi 2 0% 2 0% 2 0%3 175 psi 3 175 psi 3 175 psi 3 0% 3 0% 3 0%4 175 psi 4 175 psi 4 175 psi 4 5% 4 5% 4 5%
COMPRESSION TEST AT 120142 MILES CYLINDER LEAK DOWN TEST AT 120142 MILESTEST #1 TEST #2 TEST #3 TEST #1 TEST #2 TEST #3
COMPRESSION TEST AT 90233 MILES CYLINDER LEAK DOWN TEST AT 90233 MILESTEST #1 TEST #2 TEST #3 TEST #1 TEST #2 TEST #3
COMPRESSION TEST AT 60225 MILES CYLINDER LEAK DOWN TEST AT 60225 MILESTEST #1 TEST #2 TEST #3 TEST #1 TEST #2 TEST #3
COMPRESSION TEST AT 4129 MILES CYLINDER LEAK DOWN TEST AT 4129 MILESTEST #1 TEST #2 TEST #3 TEST #1 TEST #2 TEST #3

Comparative Emissions Testing of Vehicles Aged on E0, E15 and E20 Fuels
56
128417-E15 Ford Focus (VIN: 1FAHP35NX9W178664)
CYLINDER RESULTS CYLINDER RESULTS CYLINDER RESULTS CYLINDER RESULTS CYLINDER RESULTS CYLINDER RESULTS1 170 psi 1 170 psi 1 170 psi 1 0% 1 0% 1 0%2 170 psi 2 170 psi 2 170 psi 2 0% 2 0% 2 0%3 170 psi 3 170 psi 3 170 psi 3 0% 3 0% 3 0%4 170 psi 4 170 psi 4 170 psi 4 0% 4 0% 4 0%
CYLINDER RESULTS CYLINDER RESULTS CYLINDER RESULTS CYLINDER RESULTS CYLINDER RESULTS CYLINDER RESULTS1 170 psi 1 170 psi 1 170 psi 1 0% 1 0% 1 0%2 170 psi 2 170 psi 2 170 psi 2 0% 2 0% 2 0%3 170 psi 3 170 psi 3 170 psi 3 0% 3 0% 3 0%4 170 psi 4 170 psi 4 170 psi 4 0% 4 0% 4 0%
CYLINDER RESULTS CYLINDER RESULTS CYLINDER RESULTS CYLINDER RESULTS CYLINDER RESULTS CYLINDER RESULTS1 170 psi 1 170 psi 1 170 psi 1 0% 1 0% 1 0%2 170 psi 2 170 psi 2 170 psi 2 0% 2 0% 2 0%3 170 psi 3 170 psi 3 170 psi 3 0% 3 0% 3 0%4 170 psi 4 170 psi 4 170 psi 4 0% 4 0% 4 0%
CYLINDER RESULTS CYLINDER RESULTS CYLINDER RESULTS CYLINDER RESULTS CYLINDER RESULTS CYLINDER RESULTS1 180 psi 1 170 psi 1 170 psi 1 0% 1 0% 1 0%2 180 psi 2 170 psi 2 170 psi 2 0% 2 0% 2 0%3 180 psi 3 170 psi 3 170 psi 3 0% 3 0% 3 0%4 180 psi 4 170 psi 4 170 psi 4 0% 4 0% 4 0%
COMPRESSION TEST AT 5548 MILES CYLINDER LEAK DOWN TEST AT 5548 MILESTEST #1 TEST #2 TEST #3 TEST #1 TEST #2 TEST #3
COMPRESSION TEST AT 60288 MILES CYLINDER LEAK DOWN TEST AT 60288 MILESTEST #1 TEST #2 TEST #3 TEST #1 TEST #2 TEST #3
COMPRESSION TEST AT 90309 MILES CYLINDER LEAK DOWN TEST AT 90309 MILESTEST #1 TEST #2 TEST #3 TEST #1 TEST #2 TEST #3
COMPRESSION TEST AT 120259 CYLINDER LEAK DOWN TEST 120259TEST #1 TEST #2 TEST #3 TEST #1 TEST #2 TEST #3

Comparative Emissions Testing of Vehicles Aged on E0, E15 and E20 Fuels
57
128422-E20 Ford Focus (VIN: 1FAHP36N89W168617)
CYLINDER RESULTS CYLINDER RESULTS CYLINDER RESULTS CYLINDER RESULTS CYLINDER RESULTS CYLINDER RESULTS1 150 1 155 1 155 1 10% 1 10% 1 10%2 150 2 150 2 150 2 5% 2 5% 2 5%3 150 3 150 3 155 3 5% 3 5% 3 5%4 150 4 150 4 155 4 5% 4 5% 4 5%
CYLINDER RESULTS CYLINDER RESULTS CYLINDER RESULTS CYLINDER RESULTS CYLINDER RESULTS CYLINDER RESULTS1 140 1 145 1 150 1 5% 1 5% 1 5%2 150 2 140 2 145 2 5% 2 5% 2 5%3 145 3 150 3 145 3 5% 3 5% 3 5%4 145 4 145 4 140 4 5% 4 5% 4 5%
CYLINDER RESULTS CYLINDER RESULTS CYLINDER RESULTS CYLINDER RESULTS CYLINDER RESULTS CYLINDER RESULTS1 165 1 170 1 160 1 5% 1 5% 1 5%2 165 2 170 2 165 2 5% 2 5% 2 5%3 165 3 165 3 170 3 5% 3 5% 3 5%4 170 4 165 4 165 4 5% 4 5% 4 5%
CYLINDER RESULTS CYLINDER RESULTS CYLINDER RESULTS CYLINDER RESULTS CYLINDER RESULTS CYLINDER RESULTS1 160 1 165 1 165 1 5% 1 5% 1 5%2 155 2 155 2 155 2 5% 2 5% 2 5%3 160 3 160 3 160 3 5% 3 5% 3 5%4 160 4 160 4 160 4 5% 4 5% 4 5%
COMPRESSION TEST AT 120266 MILES CYLINDER LEAK DOWN TEST AT 120266 MILESTEST #1 TEST #2 TEST #3 TEST #1 TEST #2 TEST #3
TEST #3TEST #2TEST #1TEST #3TEST #2TEST #1COMPRESSION TEST AT 90286 MILES CYLINDER LEAK DOWN TEST AT 90286 MILES
COMPRESSION TEST AT 60277 MILES CYLINDER LEAK DOWN TEST AT 60277 MILESTEST #1 TEST #2 TEST #3 TEST #1 TEST #2 TEST #3
COMPRESSION TEST AT 21837 MILES CYLINDER LEAK DOWN TEST AT 21837 MILESTEST #1 TEST #2 TEST #3 TEST #1 TEST #2 TEST #3

Comparative Emissions Testing of Vehicles Aged on E0, E15 and E20 Fuels
58
128418-E0 Toyota Camry (VIN: 4T1BE46K89U375470)
CYLINDER RESULTS CYLINDER RESULTS CYLINDER RESULTS CYLINDER RESULTS CYLINDER RESULTS CYLINDER RESULTS1 155 psi 1 155 psi 1 155 psi 1 0% 1 0% 1 0%2 155 psi 2 155 psi 2 155 psi 2 0% 2 0% 2 0%3 155 psi 3 155 psi 3 155 psi 3 0% 3 0% 3 0%4 155 psi 4 155 psi 4 155 psi 4 0% 4 0% 4 0%
CYLINDER RESULTS CYLINDER RESULTS CYLINDER RESULTS CYLINDER RESULTS CYLINDER RESULTS CYLINDER RESULTS1 155 psi 1 155 psi 1 155 psi 1 0% 1 0% 1 0%2 155 psi 2 155 psi 2 155 psi 2 0% 2 0% 2 0%3 155 psi 3 155 psi 3 155 psi 3 0% 3 0% 3 0%4 155 psi 4 155 psi 4 155 psi 4 0% 4 0% 4 0%
CYLINDER RESULTS CYLINDER RESULTS CYLINDER RESULTS CYLINDER RESULTS CYLINDER RESULTS CYLINDER RESULTS1 155 psi 1 155 psi 1 155 psi 1 0% 1 0% 1 0%2 155 psi 2 155 psi 2 155 psi 2 0% 2 0% 2 0%3 155 psi 3 155 psi 3 155 psi 3 0% 3 0% 3 0%4 155 psi 4 155 psi 4 155 psi 4 0% 4 0% 4 0%
CYLINDER RESULTS CYLINDER RESULTS CYLINDER RESULTS CYLINDER RESULTS CYLINDER RESULTS CYLINDER RESULTS1 155 psi 1 155 psi 1 155 psi 1 5% 1 5% 1 5%2 155 psi 2 155 psi 2 155 psi 2 5% 2 5% 2 5%3 155 psi 3 155 psi 3 155 psi 3 5% 3 5% 3 5%4 155 psi 4 155 psi 4 155 psi 4 10% 4 10% 4 10%
COMPRESSION TEST AT 4200 MILES CYLINDER LEAK DOWN TEST AT 4200 MILESTEST #1 TEST #2 TEST #3 TEST #1 TEST #2 TEST #3
COMPRESSION TEST AT 60166 MILES CYLINDER LEAK DOWN TEST AT 60166 MILESTEST #1 TEST #2 TEST #3 TEST #1 TEST #2 TEST #3
COMPRESSION TEST AT 90143 MILES CYLINDER LEAK DOWN TEST AT 90143 MILESTEST #1 TEST #2 TEST #3 TEST #1 TEST #2 TEST #3
COMPRESSION TEST AT 120142 MILES CYLINDER LEAK DOWN TEST AT 120142 MILESTEST #1 TEST #2 TEST #3 TEST #1 TEST #2 TEST #3

Comparative Emissions Testing of Vehicles Aged on E0, E15 and E20 Fuels
59
128419-E15 Toyota Camry (VIN: 4T1BE46K79U892484)
CYLINDER RESULTS CYLINDER RESULTS CYLINDER RESULTS CYLINDER RESULTS CYLINDER RESULTS CYLINDER RESULTS1 155 psi 1 155 psi 1 155 psi 1 0% 1 0% 1 0%2 155 psi 2 155 psi 2 155 psi 2 0% 2 0% 2 0%3 155 psi 3 155 psi 3 155 psi 3 0% 3 0% 3 0%4 155 psi 4 155 psi 4 155 psi 4 0% 4 0% 4 0%
CYLINDER RESULTS CYLINDER RESULTS CYLINDER RESULTS CYLINDER RESULTS CYLINDER RESULTS CYLINDER RESULTS1 155 psi 1 155 psi 1 155 psi 1 0% 1 0% 1 0%2 155 psi 2 155 psi 2 155 psi 2 0% 2 0% 2 0%3 155 psi 3 155 psi 3 155 psi 3 0% 3 0% 3 0%4 155 psi 4 155 psi 4 155 psi 4 0% 4 0% 4 0%
CYLINDER RESULTS CYLINDER RESULTS CYLINDER RESULTS CYLINDER RESULTS CYLINDER RESULTS CYLINDER RESULTS1 155 psi 1 155 psi 1 155 psi 1 0% 1 0% 1 0%2 155 psi 2 155 psi 2 155 psi 2 0% 2 0% 2 0%3 155 psi 3 155 psi 3 155 psi 3 0% 3 0% 3 0%4 155 psi 4 155 psi 4 155 psi 4 0% 4 0% 4 0%
CYLINDER RESULTS CYLINDER RESULTS CYLINDER RESULTS CYLINDER RESULTS CYLINDER RESULTS CYLINDER RESULTS1 150 psi 1 155 psi 1 155 psi 1 0% 1 0% 1 0%2 155 psi 2 155 psi 2 155 psi 2 0% 2 0% 2 0%3 160 psi 3 160 psi 3 160 psi 3 5% 3 5% 3 5%4 130 psi 4 140 psi 4 150 psi 4 20% 4 20% 4 35%
COMPRESSION TEST AT 5810 MILES CYLINDER LEAK DOWN TEST AT 5810 MILESTEST #1 TEST #2 TEST #3 TEST #1 TEST #2 TEST #3
COMPRESSION TEST AT 60283 MILES CYLINDER LEAK DOWN TEST AT 60283 MILESTEST #1 TEST #2 TEST #3 TEST #1 TEST #2 TEST #3
COMPRESSION TEST AT 90404 MILES CYLINDER LEAK DOWN TEST AT 90404 MILESTEST #1 TEST #2 TEST #3 TEST #1 TEST #2 TEST #3
COMPRESSION TEST AT 120284 MILES CYLINDER LEAK DOWN TEST AT 120284 MILESTEST #1 TEST #2 TEST #3 TEST #1 TEST #2 TEST #3

Comparative Emissions Testing of Vehicles Aged on E0, E15 and E20 Fuels
60
128423-E20 Toyota Camry (VIN: 4T1BE46K79U288823)
CYLINDER RESULTS CYLINDER RESULTS CYLINDER RESULTS CYLINDER RESULTS CYLINDER RESULTS CYLINDER RESULTS1 140 1 140 1 140 1 5% 1 5% 1 5%2 140 2 140 2 145 2 5% 2 5% 2 5%3 140 3 145 3 145 3 5% 3 5% 3 5%4 140 4 140 4 140 4 5% 4 5% 4 5%
CYLINDER RESULTS CYLINDER RESULTS CYLINDER RESULTS CYLINDER RESULTS CYLINDER RESULTS CYLINDER RESULTS1 145 1 140 1 145 1 5% 1 5% 1 5%2 140 2 140 2 140 2 5% 2 5% 2 5%3 140 3 140 3 140 3 5% 3 5% 3 5%4 140 4 145 4 145 4 5% 4 5% 4 5%
CYLINDER RESULTS CYLINDER RESULTS CYLINDER RESULTS CYLINDER RESULTS CYLINDER RESULTS CYLINDER RESULTS1 155 1 155 1 155 1 10% 1 10% 1 10%2 150 2 150 2 150 2 10% 2 10% 2 10%3 150 3 150 3 150 3 10% 3 10% 3 10%4 155 4 155 4 155 4 10% 4 10% 4 10%
CYLINDER RESULTS CYLINDER RESULTS CYLINDER RESULTS CYLINDER RESULTS CYLINDER RESULTS CYLINDER RESULTS1 150 1 150 1 150 1 5% 1 5% 1 5%2 150 2 150 2 155 2 5% 2 5% 2 5%3 150 3 155 3 155 3 10% 3 10% 3 10%4 155 4 155 4 155 4 5% 4 5% 4 5%
COMPRESSION TEST AT 120263 MILES CYLINDER LEAK DOWN TEST AT 120263 MILESTEST #1 TEST #2 TEST #3 TEST #1 TEST #2 TEST #3
TEST #3TEST #2TEST #1TEST #3TEST #2TEST #1COMPRESSION TEST AT 90301 MILES CYLINDER LEAK DOWN TEST AT 90301 MILES
COMPRESSION TEST AT 60285 MILES CYLINDER LEAK DOWN TEST AT 60285 MILESTEST #1 TEST #2 TEST #3 TEST #1 TEST #2 TEST #3
COMPRESSION TEST AT 19040 MILES CYLINDER LEAK DOWN TEST AT 19040 MILESTEST #1 TEST #2 TEST #3 TEST #1 TEST #2 TEST #3

Comparative Emissions Testing of Vehicles Aged on E0, E15 and E20 Fuels
61
128420-E0 Saturn Outlook (VIN: 5GZER13D59J180937)
CYLINDER RESULTS CYLINDER RESULTS CYLINDER RESULTS CYLINDER RESULTS CYLINDER RESULTS CYLINDER RESULTS1 165 psi 1 165 psi 1 165 psi 1 0% 1 0% 1 0%2 165 psi 2 165 psi 2 165 psi 2 0% 2 0% 2 0%3 165 psi 3 165 psi 3 165 psi 3 0% 3 0% 3 0%4 165 psi 4 165 psi 4 165 psi 4 0% 4 0% 4 0%5 165 psi 5 165 psi 5 165 psi 5 0% 5 0% 5 0%6 165 psi 6 165 psi 6 165 psi 6 0% 6 0% 6 0%
CYLINDER RESULTS CYLINDER RESULTS CYLINDER RESULTS CYLINDER RESULTS CYLINDER RESULTS CYLINDER RESULTS1 165 psi 1 165 psi 1 165 psi 1 0% 1 0% 1 0%2 165 psi 2 165 psi 2 165 psi 2 0% 2 0% 2 0%3 165 psi 3 165 psi 3 165 psi 3 0% 3 0% 3 0%4 165 psi 4 165 psi 4 165 psi 4 0% 4 0% 4 0%5 165 psi 5 165 psi 5 165 psi 5 0% 5 0% 5 0%6 165 psi 6 165 psi 6 165 psi 6 0% 6 0% 6 0%
CYLINDER RESULTS CYLINDER RESULTS CYLINDER RESULTS CYLINDER RESULTS CYLINDER RESULTS CYLINDER RESULTS1 165 psi 1 165 psi 1 165 psi 1 0% 1 0% 1 0%2 165 psi 2 165 psi 2 165 psi 2 0% 2 0% 2 0%3 165 psi 3 165 psi 3 165 psi 3 0% 3 0% 3 0%4 165 psi 4 165 psi 4 165 psi 4 0% 4 0% 4 0%5 165 psi 5 165 psi 5 165 psi 5 0% 5 0% 5 0%6 165 psi 6 165 psi 6 165 psi 6 0% 6 0% 6 0%
CYLINDER RESULTS CYLINDER RESULTS CYLINDER RESULTS CYLINDER RESULTS CYLINDER RESULTS CYLINDER RESULTS1 160 psi 1 160 psi 1 160 psi 1 0% 1 0% 1 0%2 160 psi 2 165 psi 2 160 psi 2 0% 2 0% 2 5%3 165 psi 3 160 psi 3 165 psi 3 0% 3 0% 3 0%4 160 psi 4 160 psi 4 160 psi 4 5% 4 0% 4 0%5 165 psi 5 165 psi 5 165 psi 5 0% 5 5% 5 0%6 160 psi 6 165 psi 6 160 psi 6 0% 6 0% 6 0%
COMPRESSION TEST AT 4126 MILES CYLINDER LEAK DOWN TEST AT 4126 MILESTEST #1 TEST #2 TEST #3 TEST #1 TEST #2 TEST #3
COMPRESSION TEST AT 60277 MILES CYLINDER LEAK DOWN TEST AT 60277 MILESTEST #1 TEST #2 TEST #3 TEST #1 TEST #2 TEST #3
COMPRESSION TEST AT 90233 MILES CYLINDER LEAK DOWN TEST AT 90233 MILESTEST #1 TEST #2 TEST #3 TEST #1 TEST #2 TEST #3
COMPRESSION TEST AT 120204 MILES CYLINDER LEAK DOWN TEST AT 120204 MILESTEST #1 TEST #2 TEST #3 TEST #1 TEST #2 TEST #3

Comparative Emissions Testing of Vehicles Aged on E0, E15 and E20 Fuels
62
128421-E15 Saturn Outlook (VIN: 5GZER13D49J181741)
CYLINDER RESULTS CYLINDER RESULTS CYLINDER RESULTS CYLINDER RESULTS CYLINDER RESULTS CYLINDER RESULTS1 165 psi 1 165 psi 1 165 psi 1 0% 1 0% 1 0%2 165 psi 2 165 psi 2 165 psi 2 0% 2 0% 2 0%3 165 psi 3 165 psi 3 165 psi 3 0% 3 0% 3 0%4 165 psi 4 165 psi 4 165 psi 4 0% 4 0% 4 0%5 165 psi 5 165 psi 5 165 psi 5 0% 5 0% 5 0%6 165 psi 6 165 psi 6 165 psi 6 0% 6 0% 6 0%
CYLINDER RESULTS CYLINDER RESULTS CYLINDER RESULTS CYLINDER RESULTS CYLINDER RESULTS CYLINDER RESULTS1 160 psi 1 160 psi 1 160 psi 1 0% 1 0% 1 0%2 160 psi 2 160 psi 2 160 psi 2 0% 2 0% 2 0%3 160 psi 3 160 psi 3 160 psi 3 0% 3 0% 3 0%4 160 psi 4 160 psi 4 160 psi 4 0% 4 0% 4 0%5 160 psi 5 160 psi 5 160 psi 5 0% 5 0% 5 0%6 160 psi 6 160 psi 6 160 psi 6 0% 6 0% 6 0%
CYLINDER RESULTS CYLINDER RESULTS CYLINDER RESULTS CYLINDER RESULTS CYLINDER RESULTS CYLINDER RESULTS1 160 psi 1 160 psi 1 160 psi 1 0% 1 0% 1 0%2 160 psi 2 160 psi 2 160 psi 2 0% 2 0% 2 0%3 160 psi 3 160 psi 3 160 psi 3 0% 3 0% 3 0%4 160 psi 4 160 psi 4 160 psi 4 0% 4 0% 4 0%5 160 psi 5 160 psi 5 160 psi 5 0% 5 0% 5 0%6 160 psi 6 160 psi 6 160 psi 6 0% 6 0% 6 0%
CYLINDER RESULTS CYLINDER RESULTS CYLINDER RESULTS CYLINDER RESULTS CYLINDER RESULTS CYLINDER RESULTS1 160 psi 1 160 psi 1 160 psi 1 0% 1 0% 1 0%2 160 psi 2 165 psi 2 160 psi 2 0% 2 0% 2 0%3 160 psi 3 160 psi 3 160 psi 3 0% 3 0% 3 0%4 165 psi 4 160 psi 4 165 psi 4 0% 4 0% 4 0%5 160 psi 5 160 psi 5 160 psi 5 0% 5 0% 5 0%6 160 psi 6 165 psi 6 160 psi 6 0% 6 0% 6 0%
COMPRESSION TEST AT 5717 MILES CYLINDER LEAK DOWN TEST AT 5717 MILESTEST #1 TEST #2 TEST #3 TEST #1 TEST #2 TEST #3
COMPRESSION TEST AT 60357 MILES CYLINDER LEAK DOWN TEST AT 60357 MILESTEST #1 TEST #2 TEST #3 TEST #1 TEST #2 TEST #3
COMPRESSION TEST AT 90339 MILES CYLINDER LEAK DOWN TEST AT 90339 MILESTEST #1 TEST #2 TEST #3 TEST #1 TEST #2 TEST #3
COMPRESSION TEST AT 120258 MILES CYLINDER LEAK DOWN TEST AT 120258 MILESTEST #1 TEST #2 TEST #3 TEST #1 TEST #2 TEST #3

Comparative Emissions Testing of Vehicles Aged on E0, E15 and E20 Fuels
63
128425-E20 Saturn Outlook (VIN: 5GZER13D39J197980)
CYLINDER RESULTS CYLINDER RESULTS CYLINDER RESULTS CYLINDER RESULTS CYLINDER RESULTS CYLINDER RESULTS1 140 1 145 1 140 1 5% 1 5% 1 5%2 145 2 145 2 145 2 5% 2 5% 2 5%3 145 3 145 3 145 3 5% 3 5% 3 5%4 145 4 145 4 145 4 5% 4 5% 4 5%5 145 5 145 5 145 5 5% 5 5% 5 5%6 145 6 145 6 145 6 5% 6 5% 6 5%
CYLINDER RESULTS CYLINDER RESULTS CYLINDER RESULTS CYLINDER RESULTS CYLINDER RESULTS CYLINDER RESULTS1 145 1 145 1 145 1 5% 1 5% 1 5%2 145 2 145 2 150 2 5% 2 5% 2 5%3 145 3 145 3 140 3 5% 3 5% 3 5%4 150 4 150 4 150 4 5% 4 5% 4 5%5 140 5 145 5 140 5 5% 5 5% 5 5%6 145 6 145 6 145 6 5% 6 5% 6 5%
CYLINDER RESULTS CYLINDER RESULTS CYLINDER RESULTS CYLINDER RESULTS CYLINDER RESULTS CYLINDER RESULTS1 140 1 145 1 145 1 5% 1 5% 1 5%2 145 2 145 2 145 2 5% 2 5% 2 5%3 140 3 145 3 145 3 5% 3 5% 3 5%4 145 4 140 4 145 4 5% 4 5% 4 5%5 145 5 145 5 145 5 5% 5 5% 5 5%6 145 6 140 6 140 6 5% 6 5% 6 5%
CYLINDER RESULTS CYLINDER RESULTS CYLINDER RESULTS CYLINDER RESULTS CYLINDER RESULTS CYLINDER RESULTS1 155 1 150 1 150 1 5% 1 5% 1 5%2 155 2 155 2 155 2 5% 2 5% 2 5%3 150 3 150 3 150 3 5% 3 5% 3 5%4 155 4 155 4 155 4 5% 4 5% 4 5%5 150 5 150 5 150 5 5% 5 5% 5 5%6 155 6 150 6 155 6 5% 6 5% 6 5%
COMPRESSION TEST AT 120283 MILES CYLINDER LEAK DOWN TEST AT 120283 MILESTEST #1 TEST #2 TEST #3 TEST #1 TEST #2 TEST #3
TEST #3TEST #2TEST #1TEST #3TEST #2TEST #1COMPRESSION TEST AT 90566 MILES CYLINDER LEAK DOWN TEST AT 90566 MILES
COMPRESSION TEST AT 60249 MILES CYLINDER LEAK DOWN TEST AT 60249 MILESTEST #1 TEST #2 TEST #3 TEST #1 TEST #2 TEST #3
COMPRESSION TEST AT 17798 MILES CYLINDER LEAK DOWN TEST AT 17798 MILESTEST #1 TEST #2 TEST #3 TEST #1 TEST #2 TEST #3

Comparative Emissions Testing of Vehicles Aged on E0, E15 and E20 Fuels
64
101021-E0 Honda Accord (VIN: 1HGCG5649YA027642)
CYLINDER RESULTS CYLINDER RESULTS CYLINDER RESULTS CYLINDER RESULTS CYLINDER RESULTS CYLINDER RESULTS1 165 psi 1 165 psi 1 165 psi 1 10% 1 10% 1 10%2 160 psi 2 165 psi 2 160 psi 2 0% 2 0% 2 0%3 165 psi 3 160 psi 3 160 psi 3 0% 3 0% 3 0%4 165 psi 4 165 psi 4 160 psi 4 10% 4 10% 4 10%
CYLINDER RESULTS CYLINDER RESULTS CYLINDER RESULTS CYLINDER RESULTS CYLINDER RESULTS CYLINDER RESULTS1 165 psi 1 165 psi 1 165 psi 1 0% 1 0% 1 0%2 160 psi 2 165 psi 2 165 psi 2 5% 2 5% 2 5%3 165 psi 3 170 psi 3 170 psi 3 5% 3 5% 3 5%4 165 psi 4 170 psi 4 170 psi 4 0% 4 0% 4 0%
TEST #1 TEST #2 TEST #3 TEST #1 TEST #2 TEST #3CYLINDER RESULTS CYLINDER RESULTS CYLINDER RESULTS CYLINDER RESULTS CYLINDER RESULTS CYLINDER RESULTS
1 155 psi 1 160 psi 1 160 psi 1 5% 1 5% 1 5%2 160 psi 2 160 psi 2 160 psi 2 5% 2 5% 2 5%3 160 psi 3 160 psi 3 160 psi 3 5% 3 5% 3 5%4 160 psi 4 160 psi 4 160 psi 4 0% 4 0% 4 0%
COMPRESSION TEST AT 91575 MILES CYLINDER LEAK DOWN TEST AT 91575 MILESTEST #1 TEST #2 TEST #3 TEST #1 TEST #2 TEST #3
COMPRESSION TEST AT 141670 MILES CYLINDER LEAK DOWN TEST AT 141670 MILES
COMPRESSION TEST AT 117327 MILES CYLINDER LEAK DOWN TEST AT 117327 MILESTEST #1 TEST #2 TEST #3 TEST #1 TEST #2 TEST #3

Comparative Emissions Testing of Vehicles Aged on E0, E15 and E20 Fuels
65
101015-E15 Honda Accord (VIN: 1HGCG5647YA153420)
CYLINDER RESULTS CYLINDER RESULTS CYLINDER RESULTS CYLINDER RESULTS CYLINDER RESULTS CYLINDER RESULTS1 160 psi 1 160 psi 1 160 psi 1 5% 1 5% 1 5%2 160 psi 2 160 psi 2 160 psi 2 15% 2 15% 2 15%3 165 psi 3 165 psi 3 165 psi 3 5% 3 5% 3 5%4 160 psi 4 160 psi 4 160 psi 4 5% 4 5% 4 5%
CYLINDER RESULTS CYLINDER RESULTS CYLINDER RESULTS CYLINDER RESULTS CYLINDER RESULTS CYLINDER RESULTS1 160 psi 1 160 psi 1 160 psi 1 0% 1 0% 1 0%2 160 psi 2 160 psi 2 160 psi 2 15% 2 15% 2 15%3 160 psi 3 160 psi 3 160 psi 3 5% 3 5% 3 5%4 160 psi 4 160 psi 4 160 psi 4 0% 4 0% 4 0%
TEST #1 TEST #2 TEST #3 TEST #1 TEST #2 TEST #3CYLINDER RESULTS CYLINDER RESULTS CYLINDER RESULTS CYLINDER RESULTS CYLINDER RESULTS CYLINDER RESULTS
1 155 psi 1 155 psi 1 155 psi 1 10% 1 10% 1 10%2 155 psi 2 155 psi 2 155 psi 2 20% 2 15% 2 15%3 160 psi 3 160 psi 3 160 psi 3 5% 3 5% 3 5%4 160 psi 4 160 psi 4 160 psi 4 5% 4 5% 4 5%
COMPRESSION TEST AT 95584 MILES CYLINDER LEAK DOWN TEST AT 95584 MILESTEST #1 TEST #2 TEST #3 TEST #1 TEST #2 TEST #3
COMPRESSION TEST AT 146082 MILES CYLINDER LEAK DOWN TEST AT 146082 MILES
COMPRESSION TEST AT 120565 MILES CYLINDER LEAK DOWN TEST AT 120565 MILESTEST #1 TEST #2 TEST #3 TEST #1 TEST #2 TEST #3

Comparative Emissions Testing of Vehicles Aged on E0, E15 and E20 Fuels
66
101022-E20 Honda Accord (VIN: 1HGCG5649YA049592)
CYLINDER RESULTS CYLINDER RESULTS CYLINDER RESULTS CYLINDER RESULTS CYLINDER RESULTS CYLINDER RESULTS1 155 psi 1 155 psi 1 155 psi 1 10% 1 10% 1 10%2 155 psi 2 155 psi 2 155 psi 2 10% 2 10% 2 10%3 160 psi 3 160 psi 3 160 psi 3 10% 3 10% 3 10%4 160 psi 4 160 psi 4 160 psi 4 10% 4 10% 4 10%
CYLINDER RESULTS CYLINDER RESULTS CYLINDER RESULTS CYLINDER RESULTS CYLINDER RESULTS CYLINDER RESULTS1 160 psi 1 160 psi 1 160 psi 1 15% 1 15% 1 15%2 155 psi 2 160 psi 2 160 psi 2 10% 2 10% 2 10%3 160 psi 3 160 psi 3 160 psi 3 10% 3 10% 3 10%4 160 psi 4 160 psi 4 160 psi 4 15% 4 15% 4 15%
TEST #1 TEST #2 TEST #3 TEST #1 TEST #2 TEST #3CYLINDER RESULTS CYLINDER RESULTS CYLINDER RESULTS CYLINDER RESULTS CYLINDER RESULTS CYLINDER RESULTS
1 150 psi 1 150 psi 1 155 psi 1 15% 1 15% 1 15%2 150 psi 2 155 psi 2 150 psi 2 10% 2 10% 2 10%3 160 psi 3 160 psi 3 160 psi 3 5% 3 5% 3 5%4 155 psi 4 160 psi 4 155 psi 4 10% 4 10% 4 10%
COMPRESSION TEST AT 89728 MILES CYLINDER LEAK DOWN TEST AT 89728 MILESTEST #1 TEST #2 TEST #3 TEST #1 TEST #2 TEST #3
COMPRESSION TEST AT 139939 MILES CYLINDER LEAK DOWN TEST AT 139939 MILES
COMPRESSION TEST AT 114715 MILES CYLINDER LEAK DOWN TEST AT 114715 MILESTEST #1 TEST #2 TEST #3 TEST #1 TEST #2 TEST #3

Comparative Emissions Testing of Vehicles Aged on E0, E15 and E20 Fuels
67
102001-E0 Ford Focus (VIN: 1FAFP34P3YW412653)
CYLINDER RESULTS CYLINDER RESULTS CYLINDER RESULTS CYLINDER RESULTS CYLINDER RESULTS CYLINDER RESULTS1 150 psi 1 150 psi 1 150 psi 1 < 5% 1 < 5% 1 < 5%2 140 psi 2 145 psi 2 145 psi 2 < 5% 2 < 5% 2 < 5%3 150 psi 3 150 psi 3 150 psi 3 5% 3 5% 3 5%4 145 psi 4 145 psi 4 145 psi 4 < 5% 4 < 5% 4 < 5%
CYLINDER RESULTS CYLINDER RESULTS CYLINDER RESULTS CYLINDER RESULTS CYLINDER RESULTS CYLINDER RESULTS1 150 psi 1 150 psi 1 155 psi 1 < 5% 1 < 5% 1 < 5%2 150 psi 2 150 psi 2 150 psi 2 10% 2 10% 2 10%3 145 psi 3 145 psi 3 145 psi 3 15% 3 20% 3 20%4 150 psi 4 150 psi 4 150 psi 4 10% 4 10% 4 10%
TEST #1 TEST #2 TEST #3 TEST #1 TEST #2 TEST #3CYLINDER RESULTS CYLINDER RESULTS CYLINDER RESULTS CYLINDER RESULTS CYLINDER RESULTS CYLINDER RESULTS
1 145 psi 1 150 psi 1 150 psi 1 10% 1 10% 1 10%2 150 psi 2 150 psi 2 150 psi 2 10% 2 10% 2 10%3 150 psi 3 150 psi 3 150 psi 3 5% 3 5% 3 5%4 145 psi 4 150 psi 4 145 psi 4 15% 4 15% 4 15%
COMPRESSION TEST AT 103281 MILES CYLINDER LEAK DOWN TEST AT 103281 MILESTEST #1 TEST #2 TEST #3 TEST #1 TEST #2 TEST #3
COMPRESSION TEST AT 153141 MILES CYLINDER LEAK DOWN TEST AT 153141 MILES
COMPRESSION TEST AT 128106 MILES CYLINDER LEAK DOWN TEST AT 128106 MILESTEST #1 TEST #2 TEST #3 TEST #1 TEST #2 TEST #3

Comparative Emissions Testing of Vehicles Aged on E0, E15 and E20 Fuels
68
102015-E15 Ford Focus (VIN: 1FAFP34P9YW400216)
CYLINDER RESULTS CYLINDER RESULTS CYLINDER RESULTS CYLINDER RESULTS CYLINDER RESULTS CYLINDER RESULTS1 140 psi 1 140 psi 1 140 psi 1 20% 1 20% 1 20%2 140 psi 2 140 psi 2 140 psi 2 15% 2 15% 2 15%3 140 psi 3 140 psi 3 140 psi 3 35% 3 35% 3 35%4 140 psi 4 140 psi 4 140 psi 4 20% 4 20% 4 20%
CYLINDER RESULTS CYLINDER RESULTS CYLINDER RESULTS CYLINDER RESULTS CYLINDER RESULTS CYLINDER RESULTS1 140 psi 1 140 psi 1 140 psi 1 15% 1 15% 1 15%2 145 psi 2 145 psi 2 145 psi 2 25% 2 25% 2 25%3 140 psi 3 140 psi 3 140 psi 3 15% 3 15% 3 15%4 145 psi 4 145 psi 4 145 psi 4 10% 4 10% 4 10%
COMPRESSION TEST AT 85768 MILES CYLINDER LEAK DOWN TEST AT 85768 MILESTEST #1 TEST #2 TEST #3 TEST #1 TEST #2 TEST #3
COMPRESSION TEST AT 110718 MILES CYLINDER LEAK DOWN TEST AT 110718 MILESTEST #1 TEST #2 TEST #3 TEST #1 TEST #2 TEST #3

Comparative Emissions Testing of Vehicles Aged on E0, E15 and E20 Fuels
69
102021-E20 Ford Focus (VIN: 1FAFP34P4YW422950)
CYLINDER RESULTS CYLINDER RESULTS CYLINDER RESULTS CYLINDER RESULTS CYLINDER RESULTS CYLINDER RESULTS1 140 psi 1 140 psi 1 140 psi 1 5% 1 5% 1 5%2 140 psi 2 140 psi 2 140 psi 2 10% 2 10% 2 10%3 140 psi 3 140 psi 3 140 psi 3 5% 3 5% 3 5%4 140 psi 4 140 psi 4 140 psi 4 20% 4 20% 4 20%
CYLINDER RESULTS CYLINDER RESULTS CYLINDER RESULTS CYLINDER RESULTS CYLINDER RESULTS CYLINDER RESULTS1 145 psi 1 150 psi 1 150 psi 1 < 5% 1 < 5% 1 < 5%2 150 psi 2 150 psi 2 150 psi 2 10% 2 10% 2 10%3 150 psi 3 150 psi 3 150 psi 3 10% 3 10% 3 10%4 150 psi 4 150 psi 4 150 psi 4 < 5% 4 < 5% 4 < 5%
TEST #1 TEST #2 TEST #3 TEST #1 TEST #2 TEST #3CYLINDER RESULTS CYLINDER RESULTS CYLINDER RESULTS CYLINDER RESULTS CYLINDER RESULTS CYLINDER RESULTS
1 140 psi 1 145 psi 1 150 psi 1 5% 1 5% 1 5%2 150 psi 2 150 psi 2 145 psi 2 10% 2 10% 2 10%3 140 psi 3 140 psi 3 145 psi 3 10% 3 10% 3 10%4 150 psi 4 145 psi 4 145 psi 4 5% 4 5% 4 5%
COMPRESSION TEST AT 70142 MILES CYLINDER LEAK DOWN TEST AT 70142 MILESTEST #1 TEST #2 TEST #3 TEST #1 TEST #2 TEST #3
COMPRESSION TEST AT 120269 MILES CYLINDER LEAK DOWN TEST AT 120269 MILES
COMPRESSION TEST AT 95144 MILES CYLINDER LEAK DOWN TEST AT 95144 MILESTEST #1 TEST #2 TEST #3 TEST #1 TEST #2 TEST #3