Comparative Child Well-being across the OECD · Chapter 2 Comparative Child Well-being across the...
43
ISBN 978-92-64-05933-7 Doing Better for Children © OECD 2009 21 Chapter 2 Comparative Child Well-being across the OECD This chapter offers an overview of child well-being across the OECD. It compares policy-focussed measures of child well-being in six dimensions, chosen to cover the major aspects of children’s lives: material well-being; housing and environment; education; health and safety; risk behaviours; and quality of school life. Each dimension is a composite of several indicators, which in turn have been selected in part because they are relatively amenable to policy choices. This chapter presents the theory, methodology and data sources behind the measures, as well as the indicators for each member country in a comparable fashion. It is at the individual level that the indicators can best inform policy and comparisons can be most readily made. The data is reported by country and, where possible, by sex, age and migrant status. All indicators presented in the framework are already publically available. There has been no attempt to collect new data. Note that no single aggregate score or overall country ranking for child well-being is presented. Nevertheless, it is clear that no OECD country performs well on all fronts.
-
Upload
phungkhanh -
Category
Documents
-
view
215 -
download
0
Transcript of Comparative Child Well-being across the OECD · Chapter 2 Comparative Child Well-being across the...
ISBN 978-92-64-05933-7
Doing Better for Children
© OECD 2009
21
Chapter 2
Comparative Child Well-being across the OECD
This chapter offers an overview of child well-being across the OECD. It comparespolicy-focussed measures of child well-being in six dimensions, chosen to cover themajor aspects of children’s lives: material well-being; housing and environment;education; health and safety; risk behaviours; and quality of school life. Eachdimension is a composite of several indicators, which in turn have been selected inpart because they are relatively amenable to policy choices. This chapter presentsthe theory, methodology and data sources behind the measures, as well as theindicators for each member country in a comparable fashion. It is at the individuallevel that the indicators can best inform policy and comparisons can be most readilymade. The data is reported by country and, where possible, by sex, age and migrantstatus. All indicators presented in the framework are already publically available.There has been no attempt to collect new data. Note that no single aggregate scoreor overall country ranking for child well-being is presented. Nevertheless, it is clearthat no OECD country performs well on all fronts.
2. COMPARATIVE CHILD WELL-BEING ACROSS THE OECD
DOING BETTER FOR CHILDREN – ISBN 978-92-64-05933-7 – © OECD 200922
IntroductionHow does child well-being compare across OECD countries? This chapter presents
a child well-being framework and compares outcome indicators for children in OECD
countries across six dimensions: material well-being; housing and environment;
education; health; risk behaviours; and quality of school life.
The first section of this chapter presents a multi-dimensional child well-being
framework for OECD countries, before going on to review the theoretical and empirical
literature on child well-being from a policy perspective in the second section. The third
section explains the dimensions and indicator selection criteria used in the OECD child
well-being framework. The fourth and final section presents and discusses the child well-
being indicators one by one. It is at this level that the indicators can best inform policy and
that countries can be most readily compared. Where data is available, the country
indicators are also broken down to look at variations by age, sex and migrant status.
No one country performs well on all indicators or dimensions of child well-being.
Where indicators can be compared by sex, age and migrant status, boys often have worse
outcomes than girls and non-native children have worse outcomes than native children.
However girls’ health behaviours are sometimes worse, as they exercise less and smoke
more than boys. Results shown by age are mixed; children smoke and drink more and
exercise less with age, but rates of bullying decline.
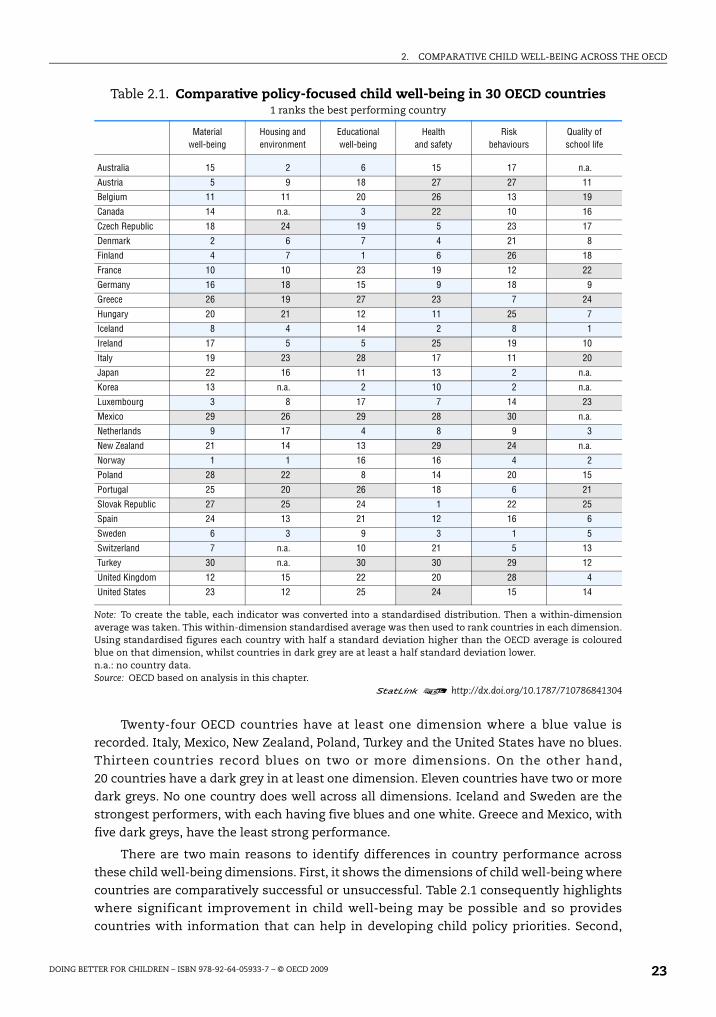
An overview of child well-being across OECD member countriesThe policy-focused measures of child well-being are summarised in Table 2.1. The table
provides a country-comparison of child well-being measured across dimensions of material
well-being, housing and environment, educational well-being, health, risk behaviours, and
quality of school life. Each of the six dimensions is a composite of several core indicators. Each
country has a colour and rank assigned for each well-being dimension. Blue or dark grey
colours are assigned when countries are respectively well above or well below the average for
the OECD area. White values indicate countries around the OECD average. The greater the
number of white values in a dimension, the closer the clustering of OECD countries across that
dimension. Ranks are also assigned that give an order to the countries, with lower numbers
reflecting a better child well-being performance along each of the six dimensions. Though
more statistically sophisticated algorithms are possible, the clustering of countries into three
groups using this simple approach is robust to alternatives.
The well-being indicators are presented in an index by dimensions, but not aggregated
into a single over-arching child well-being index. No over-arching index is presented due in
part to the limitations in the coverage of available data. In addition there is little theory to
guide which aggregation method to use. Given a lack of good theory and data, it was
considered that creating an over-arching index would distract the focus towards discussion
of the aggregation method, and away from more important practical issues of improving
child well-being.
2. COMPARATIVE CHILD WELL-BEING ACROSS THE OECD
DOING BETTER FOR CHILDREN – ISBN 978-92-64-05933-7 – © OECD 2009 23
Twenty-four OECD countries have at least one dimension where a blue value is
recorded. Italy, Mexico, New Zealand, Poland, Turkey and the United States have no blues.
Thirteen countries record blues on two or more dimensions. On the other hand,
20 countries have a dark grey in at least one dimension. Eleven countries have two or more
dark greys. No one country does well across all dimensions. Iceland and Sweden are the
strongest performers, with each having five blues and one white. Greece and Mexico, with
five dark greys, have the least strong performance.
There are two main reasons to identify differences in country performance across
these child well-being dimensions. First, it shows the dimensions of child well-being where
countries are comparatively successful or unsuccessful. Table 2.1 consequently highlights
where significant improvement in child well-being may be possible and so provides
countries with information that can help in developing child policy priorities. Second,
Table 2.1. Comparative policy-focused child well-being in 30 OECD countries1 ranks the best performing country
Material well-being
Housing and environment
Educationalwell-being
Health and safety
Riskbehaviours
Quality ofschool life
Australia 15 2 6 15 17 n.a.
Austria 5 9 18 27 27 11
Belgium 11 11 20 26 13 19
Canada 14 n.a. 3 22 10 16
Czech Republic 18 24 19 5 23 17
Denmark 2 6 7 4 21 8
Finland 4 7 1 6 26 18
France 10 10 23 19 12 22
Germany 16 18 15 9 18 9
Greece 26 19 27 23 7 24
Hungary 20 21 12 11 25 7
Iceland 8 4 14 2 8 1
Ireland 17 5 5 25 19 10
Italy 19 23 28 17 11 20
Japan 22 16 11 13 2 n.a.
Korea 13 n.a. 2 10 2 n.a.
Luxembourg 3 8 17 7 14 23
Mexico 29 26 29 28 30 n.a.
Netherlands 9 17 4 8 9 3
New Zealand 21 14 13 29 24 n.a.
Norway 1 1 16 16 4 2
Poland 28 22 8 14 20 15
Portugal 25 20 26 18 6 21
Slovak Republic 27 25 24 1 22 25
Spain 24 13 21 12 16 6
Sweden 6 3 9 3 1 5
Switzerland 7 n.a. 10 21 5 13
Turkey 30 n.a. 30 30 29 12
United Kingdom 12 15 22 20 28 4
United States 23 12 25 24 15 14
Note: To create the table, each indicator was converted into a standardised distribution. Then a within-dimensionaverage was taken. This within-dimension standardised average was then used to rank countries in each dimension.Using standardised figures each country with half a standard deviation higher than the OECD average is colouredblue on that dimension, whilst countries in dark grey are at least a half standard deviation lower.n.a.: no country data.Source: OECD based on analysis in this chapter.
1 2 http://dx.doi.org/10.1787/710786841304
2. COMPARATIVE CHILD WELL-BEING ACROSS THE OECD
DOING BETTER FOR CHILDREN – ISBN 978-92-64-05933-7 – © OECD 200924
Table 2.1 allows comparative leaders and laggards to be identified. The question of how
leaders arise, and why laggards fall behind can then begin to be addressed, and examples
of best country practices can be drawn for future policy changes.
What is child well-being?Child well-being measures the quality of children’s lives. However, as simple as the
concept sounds, there is no unique, universally accepted way of actually measuring child
well-being that emerges from the academic literature.
There are two broad approaches to defining and measuring child well-being. The first
approach is to consider well-being as a multi-dimensional concept. Researchers decide on
the important life dimensions and populate these dimensions with indicators. The second
approach is to directly ask children about how they view their well-being.
In a recent literature survey, child well-being is defined as “a multi-dimensional
construct incorporating mental/psychological, physical and social dimensions” (Columbo,
cited in Pollard and Lee, 2003, p. 65). This definition, however, omits a material aspect,
which is important in many other studies which consider child poverty or child material
deprivation. More recently, Ben-Arieh and Frones (2007a, p. 1) have offered the following
definition, also indicators-based: “Child well-being encompasses quality of life in a broad
sense. It refers to a child’s economic conditions, peer relations, political rights, and
opportunities for development. Most studies focus on certain aspects of children’s well-being,
often emphasising social and cultural variations. Thus, any attempts to grasp well-being in its
entirety must use indicators on a variety of aspects of well-being.”
Alternatively, child well-being can be expressed in terms of the over-arching self-
reported subjective well-being of the child. This approach not only allows children to
express their own well-being, but avoids decisions about which life dimensions are
covered, which indicators are included, and if aggregation takes place which weights are
assigned to each dimension. Some of the multi-dimensional approaches have used over-
arching subjective measures as component indicators, rather than as part of a conceptually
different approach. A limitation of the subjective approach is that younger children cannot
respond to such questions. From a policy perspective a second limitation is that little is
known about policy amenability of child measures of subjective well-being.
For the purposes of this report, child well-being is measured using multiple, policy-
amenable measures. In practice, and partly for pragmatic reasons, child well-being is
usually considered as a multi-dimensional concept. This pragmatism is determined by the
limited theory and data and by an understandable scepticism regarding the ability of
younger children to respond to questions about their global subjective well-being. The
dimensions are identified by consensus, with justifications drawn from the child research
literature and the United Nations Convention on the Rights of Children.
Cross-national comparisons of child well-being require decisions about how many and
which dimensions to include, how many indicators in each dimension, and the placement
of which indicators in what dimensions. There are also aggregation decisions to be made.
Various methods can be used to add up indicators within dimensions and then add up
dimensions to arrive at country aggregate measures of child well-being. A problem with
aggregation approaches is that they infer common priorities for all countries across all
dimensions by placing the same country valuation on outcomes.

2. COMPARATIVE CHILD WELL-BEING ACROSS THE OECD
DOING BETTER FOR CHILDREN – ISBN 978-92-64-05933-7 – © OECD 2009 25
A closer look at child well-beingThis section locates the OECD work by taking a closer look at some critical issues
behind existing multi-dimensional measures of child well-being. It starts with a review of
positions in the academic literature on child well-being before moving on to review the
empirical research undertaken in the cross-country field.
Review of the child well-being literature
There are two prominent divides in the literature on child well-being. The first divide
is between what might be termed a “developmentalist perspective” and a “child rights
perspective”. The second is between those who consider well-being outcomes from the
point of view of socially and individually costly outcomes (that is to say, indicators that
measure undesirable things like poverty, ignorance and sickness) and those who wish to
take a more positive perspective. The developmentalist perspective is more likely to be
associated with a greater focus on poor child outcomes and the child rights perspective
with a focus on the positive side of child well-being.
Child well-being today and tomorrow
The developmentalist perspective focuses on the accumulation of human capital
and social skills for tomorrow. This long view of child well-being has been described as
focusing on “well-becoming”. The child rights perspective, on the other hand, places a
strong rights-based emphasis on children as human beings who experience well-being in
the here-and-now. The rights perspective also seeks the input of children in the process
of deciding what their well-being might be and how it might be best measured (Casas, 1997;
Ben-Arieh, 2007a).
In some cases, the differences between the two perspectives are more apparent than
real, since what is self-evidently good for the child’s current well-being may also be
important for the child’s future. For example, child abuse harms the well-being of children
in the here-and-now, as well as damaging their longer-term well-being outcomes as adults
(Hood, 2007; Currie and Tekin, 2006). However, in other situations there are clear trade-offs.
A child may favour his or her current well-being, for example playing with their friends
(which a child rights perspective might support), over learning in school to improve future
life-time prospects (which a developmentalist perspective might support).
The indicators chosen in this report place a strong focus on future well-being for
children. A future focus is reasonable in child policy given that children have the longest
futures of any age group. Nonetheless, the well-being of children today should not be
neglected. Childhood is a considerable period of time. If the United Nations age definition
of a child as a person under age 18 is used, then during a typical life cycle people in OECD
countries spend about one-quarter of their lives as children.
Positive versus negative measures of child well-being
A second divide in the child well-being literature is between those who place a focus
on poor child well-being outcomes and those who prefer to conceive of child well-being as
a positive continuous variable. The latter group sometimes describe the former approach
as a “deficit approach” and their own approach as a “strengths-based” one (Ben-Arieh and
Goerge, 2001; Pollard and Lee, 2003; Fattore et al., 2007).
2. COMPARATIVE CHILD WELL-BEING ACROSS THE OECD
DOING BETTER FOR CHILDREN – ISBN 978-92-64-05933-7 – © OECD 200926
Historically, the measurement of child well-being has focused on children with
behaviour problems, disorders, and disabilities rather than attempting to measure a
continuum of well-being for all children. A focus on deficits is often criticised in the
academic literature. Taking a “deficit approach” is used pejoratively. However, there are
some very good reasons why policy makers may choose to focus on well-being for children
in terms of so-called deficit measures. These policy reasons encompass both efficiency and
equity rationales.
An efficiency rationale for a policy focus on child deficits is that they often generate
high costs for the rest of society. These include the monetary and non-monetary costs of
crime and anti-social behaviour. These costs can be large for example in countries such as
the United States where crime rates are high compared to the OECD average. Preventing
the multifarious costs of crime is one of the strong arguments behind intervention early in
the life cycle of socially disadvantaged children. Similarly, deficits in terms of human
capital formation or health create third-party costs via raising claims made on the welfare
state, thus necessitating higher average tax rates (Currie and Stabile, 2007).
A focus on deficits can also be rationalised by equity concerns for the more
disadvantaged in society. For example, including indicators of child abuse or child
mortality in the measure of well-being may be important in an equity sense, even though
such problems do not affect a sizeable majority of children. Considering child well-being as
a positive continuous variable directs policy attention away from the less well-off children
who are picked up by deficit measures.
However, it certainly remains the case that relying only on deficit measures misses the
positive strengths and abilities that children possess, and on which society must build to
enhance child well-being.
Child participation in measuring well-being
Theory and measurement work on child indicators has moved to viewing children as
acting subjects with their own perspectives. One view is that, “if we are to adequately measure
children’s well-being, then children need to be involved in all stages of research efforts to
measure and monitor their well-being” (Fattore et al., 2007, p. 5). Such an approach, although
well-intentioned, raises serious issues. First, it treats childhood as a lump, as if an 8-month-old
were the same as an 8-year-old, and voids childhood of a developmental focus. Second, it does
not address the problem of how to involve a newborn, or the youngest children.
In addition, participation is conceived of as taking place only between the researcher
and the child. This fails to recognise that children typically have parents who bear the
primary legal responsibility for them and, by implication, for their safety and their material,
social and emotional well-being. Parents have known their child since birth, across multiple
environments. Yet parental participation receives limited consideration in this approach.
Cross-country comparisons of child well-being
In recent years the measurement of child well-being in terms of aggregate international
comparisons and country studies has grown rapidly (Ben-Arieh and Goerge, 2001). In addition
to the international comparative level, child well-being has also been examined at a national
and sub-national level (see Hanifin et al., 2007 for Ireland; Land, 2007a for the United States;
and at city level, see Hood, 2007 for London). There is a small literature that combines multiple,
dimension-based outcomes into an aggregate overall well-being at a country level and
2. COMPARATIVE CHILD WELL-BEING ACROSS THE OECD
DOING BETTER FOR CHILDREN – ISBN 978-92-64-05933-7 – © OECD 2009 27
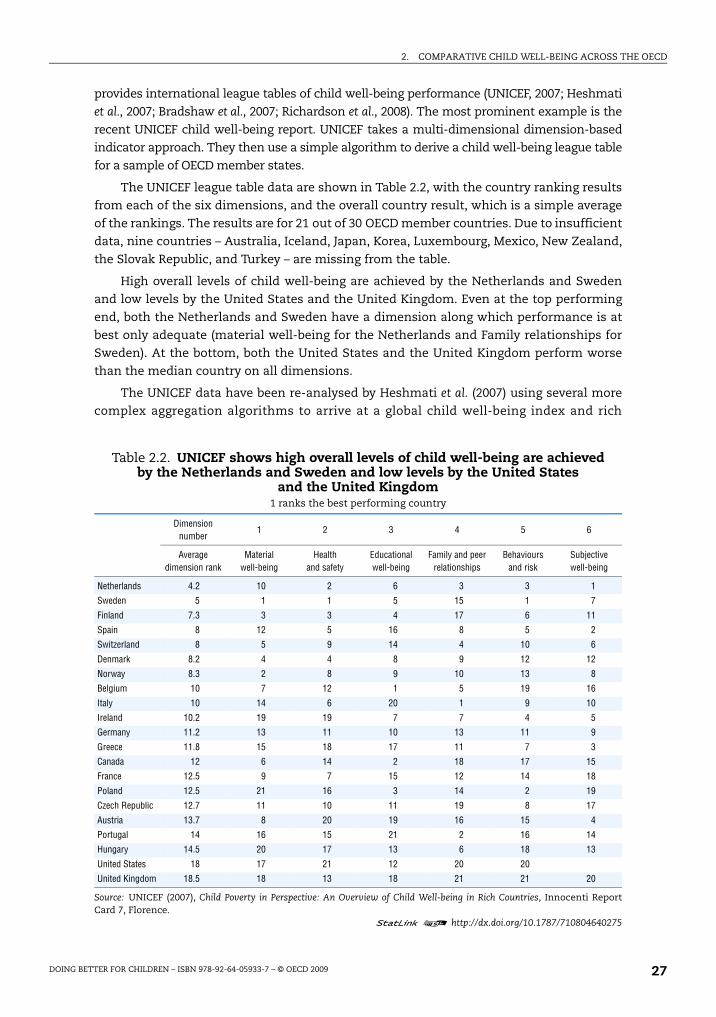
provides international league tables of child well-being performance (UNICEF, 2007; Heshmati
et al., 2007; Bradshaw et al., 2007; Richardson et al., 2008). The most prominent example is the
recent UNICEF child well-being report. UNICEF takes a multi-dimensional dimension-based
indicator approach. They then use a simple algorithm to derive a child well-being league table
for a sample of OECD member states.
The UNICEF league table data are shown in Table 2.2, with the country ranking results
from each of the six dimensions, and the overall country result, which is a simple average
of the rankings. The results are for 21 out of 30 OECD member countries. Due to insufficient
data, nine countries – Australia, Iceland, Japan, Korea, Luxembourg, Mexico, New Zealand,
the Slovak Republic, and Turkey – are missing from the table.
High overall levels of child well-being are achieved by the Netherlands and Sweden
and low levels by the United States and the United Kingdom. Even at the top performing
end, both the Netherlands and Sweden have a dimension along which performance is at
best only adequate (material well-being for the Netherlands and Family relationships for
Sweden). At the bottom, both the United States and the United Kingdom perform worse
than the median country on all dimensions.
The UNICEF data have been re-analysed by Heshmati et al. (2007) using several more
complex aggregation algorithms to arrive at a global child well-being index and rich
Table 2.2. UNICEF shows high overall levels of child well-being are achieved by the Netherlands and Sweden and low levels by the United States
and the United Kingdom1 ranks the best performing country
Dimension number
1 2 3 4 5 6
Average dimension rank
Material well-being
Health and safety
Educational well-being
Family and peer relationships
Behaviours and risk
Subjective well-being
Netherlands 4.2 10 2 6 3 3 1
Sweden 5 1 1 5 15 1 7
Finland 7.3 3 3 4 17 6 11
Spain 8 12 5 16 8 5 2
Switzerland 8 5 9 14 4 10 6
Denmark 8.2 4 4 8 9 12 12
Norway 8.3 2 8 9 10 13 8
Belgium 10 7 12 1 5 19 16
Italy 10 14 6 20 1 9 10
Ireland 10.2 19 19 7 7 4 5
Germany 11.2 13 11 10 13 11 9
Greece 11.8 15 18 17 11 7 3
Canada 12 6 14 2 18 17 15
France 12.5 9 7 15 12 14 18
Poland 12.5 21 16 3 14 2 19
Czech Republic 12.7 11 10 11 19 8 17
Austria 13.7 8 20 19 16 15 4
Portugal 14 16 15 21 2 16 14
Hungary 14.5 20 17 13 6 18 13
United States 18 17 21 12 20 20
United Kingdom 18.5 18 13 18 21 21 20
Source: UNICEF (2007), Child Poverty in Perspective: An Overview of Child Well-being in Rich Countries, Innocenti ReportCard 7, Florence.
1 2 http://dx.doi.org/10.1787/710804640275
2. COMPARATIVE CHILD WELL-BEING ACROSS THE OECD
DOING BETTER FOR CHILDREN – ISBN 978-92-64-05933-7 – © OECD 200928
country league table. The different approaches change the league table somewhat, but not
greatly. A further feature of Heshmati et al.’s approach is that more countries are included as a
consequence of relaxing some of the data requirements of the UNICEF Report. The additional
four OECD countries included are Australia, Iceland, Japan, and New Zealand. Of these
countries, Iceland ranks well, Australia and Japan rank moderately well, and New Zealand
ranks poorly.
Dijkstra (2009) also recalculates the child well-being ranks produced by UNICEF, using
both new weightings and harmonic means aggregation. Djikstra finds that the methods
applied by UNICEF to group countries (and assign ranks at the higher and lower level) are
sufficiently robust.
Overall, while these studies have added considerably to the sum of knowledge on child
well-being in rich countries, they share certain problems:
● There is little analytical argument regarding which indicators and what number of
indicators are suitable for each dimension. In fact, rather than a comprehensive theory
of well-being, the availability of data is a primary driver behind these reports.
● Most approaches rely on surveys that are not designed to monitor child well-being
overall. These surveys focus on specific well-being dimensions like health, income and
education. These surveys typically also have less-than-full OECD coverage.
● In the absence of any good theory pointing the way, aggregation methods weight
indicators and dimensions on statistical or ad hoc grounds.
● The indicator data is sometimes out-dated and dates can vary across countries and
dimensions.
● The indicator data are mainly adolescent-focused. Additionally, it is often impossible to
disaggregate within countries by social grouping (by sex, ethnicity, socio-economic
status and so on).
● Lastly, these indexes do not allow a ready disaggregation of child well-being at different
points in the child life cycle, a result again reflecting the paucity of purpose-collected
information.
Until new data designed for the purposes of monitoring child well-being across countries
is collected, not all of the problems identified in previous work can be addressed. However, for
the purposes of the analysis undertaken here, some improvements can be made.
Selecting child well-being dimensions and indicatorsThis section addresses the rationale for selecting the child well-being dimensions and
indicators to consider in relation to child policy choices. As discussed above, because there is
no obvious rationale for aggregating across dimensions and because of limited data, this report
does not present a single aggregate score or overall country ranking for child well-being.
The six dimensions
Six dimensions of child well-being have been identified here to cover the major
aspects of children’s lives: material well-being, housing and the environment, education,
health, risk behaviours, and quality of school life.
Each dimension has roots in the international standards agreed for children in the
United Nations Convention on the Rights of the Child (United Nations, 1989). All previous
cross-country research uses the UNCRC as a defining text in determining the framework in

2. COMPARATIVE CHILD WELL-BEING ACROSS THE OECD
DOING BETTER FOR CHILDREN – ISBN 978-92-64-05933-7 – © OECD 2009 29
which to assess child well-being outcomes (UNICEF, 2007; Bradshaw et al., 2007). The work
presented here is no exception. To a large extent, the dimensions covered within the OECD
framework follow influential research by UNICEF (2007) and Bradshaw et al. (2007).
The advantage of applying the UNCRC to cross-country analysis of child well-being, and
specifically to the selection of dimensions within a multidimensional framework, is that
disagreements as to which dimensions of children’s lives require policy support are reduced.
As signatories to the UNCRC, each OECD member country agrees in principle to meet the
standards set for children by the Convention. Without the Convention, finding a consensus
on a cross-national set of standards for children would be a more complex task, with each
country potentially prioritising certain national-specific factors over others.
The approach here contains the same number of dimensions as the UNICEF report.
Four of the six dimensions are effectively the same. The “family and peer relationships”
and “subjective well-being” dimensions included in the UNICEF report are omitted. The
reason is not because they are unimportant for child well-being, but because this report
has a strong policy focus. It is unclear how governments concerned with family and peer
relationships and subjective well-being would go about designing policies to improve
outcomes in these dimensions. On the other hand, the newly included dimensions of
“housing and the environment” and “quality of school life” are much more influenced by
policy. Governments typically intervene considerably in the housing market, especially for
families with children, and fund, provide and regulate the schooling system, with direct
implications for child well-being (Box 2.1).
Selection of indicators
Each of these six dimensions of child well-being must be populated with indicators.
Across the six dimensions, 21 indicators of child well-being have been selected. A number of
ideal selection requirements were borne in mind in choosing indicators.
● The child is taken as the desirable unit of analysis, rather than the family. A child-centered
approach is now the norm in studies of child poverty and child well-being.
● Indicators should be as up-to-date as possible. Indicators cannot reliably inform comparative
policy unless they paint a picture of child well-being reasonably close to the here-and-now.
● Indicators should be taken from standardised data collections which collect comparable cross-country
information. If data is not reasonably comparable, it will fail to meet one of the most basic
needs of a cross-country, data-driven study.
● Indicators should cover all children from birth to 17 years inclusive. The United Nations definition
of a child as a person under age 18 is used here. Given evidence about the importance of the
in-utero environment for the child’s future health and development and the fact that in
most countries a foetus legally becomes a child in utero, it may also be desirable to extend
the definition of childhood to the period before birth.
● Indicators need a policy focus. As child well-being measures in this chapter are policy-focused,
indicators with a relatively short causal chain from government action to improvements in
well-being are favoured over indicators for which relationships between policy actions and
outcomes were more speculative and the causal chain was longer.
● Indicators should cover as many OECD member countries as possible.
2. COMPARATIVE CHILD WELL-BEING ACROSS THE OECD
DOING BETTER FOR CHILDREN – ISBN 978-92-64-05933-7 – © OECD 200930
Within each of the six child well-being dimensions, the selection of indicators
emphasises complementarity. This complementarity comes in a number of distinct forms.
● Child age. If one indicator focuses on children of a certain age, other indicators within the
dimension should provide information about children of other ages.
● Efficiency and equity considerations. Indicators within a dimension should use some measure
of the spread of outcomes within a country, which gives an indication of equity, but also
provide average country outcomes, which gives a complementary indication of efficiency.
● Child well-being for today and development for the future. Indicators within each dimension
should have regard to both current child well-being and developmentalist perspectives of
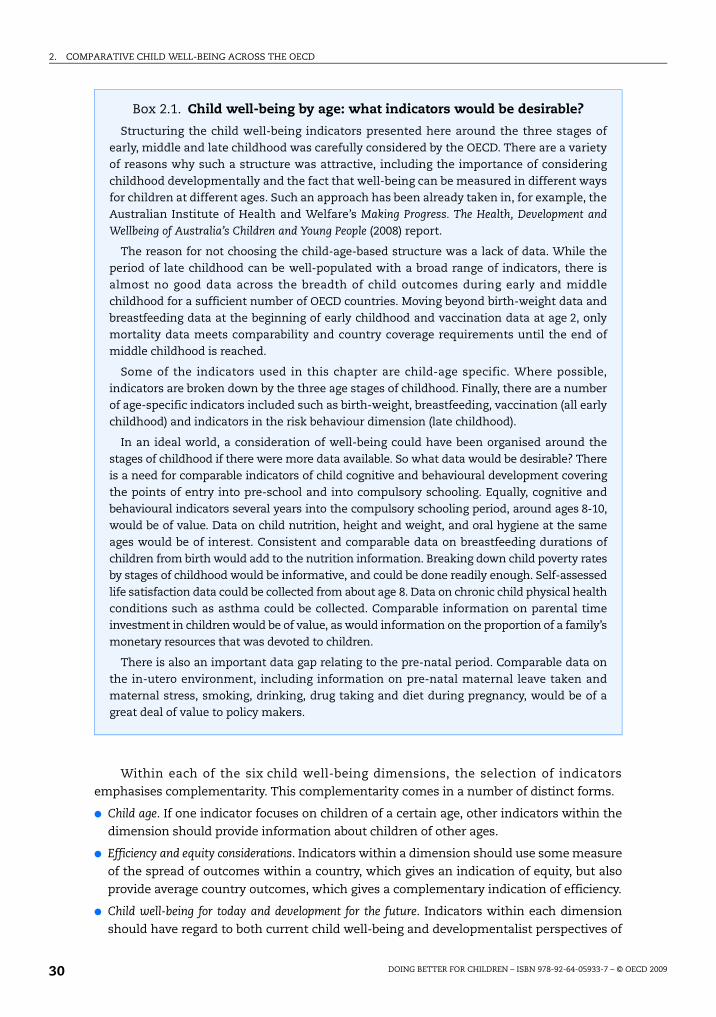
Box 2.1. Child well-being by age: what indicators would be desirable?
Structuring the child well-being indicators presented here around the three stages ofearly, middle and late childhood was carefully considered by the OECD. There are a varietyof reasons why such a structure was attractive, including the importance of consideringchildhood developmentally and the fact that well-being can be measured in different waysfor children at different ages. Such an approach has been already taken in, for example, theAustralian Institute of Health and Welfare’s Making Progress. The Health, Development and
Wellbeing of Australia’s Children and Young People (2008) report.
The reason for not choosing the child-age-based structure was a lack of data. While theperiod of late childhood can be well-populated with a broad range of indicators, there isalmost no good data across the breadth of child outcomes during early and middlechildhood for a sufficient number of OECD countries. Moving beyond birth-weight data andbreastfeeding data at the beginning of early childhood and vaccination data at age 2, onlymortality data meets comparability and country coverage requirements until the end ofmiddle childhood is reached.
Some of the indicators used in this chapter are child-age specific. Where possible,indicators are broken down by the three age stages of childhood. Finally, there are a numberof age-specific indicators included such as birth-weight, breastfeeding, vaccination (all earlychildhood) and indicators in the risk behaviour dimension (late childhood).
In an ideal world, a consideration of well-being could have been organised around thestages of childhood if there were more data available. So what data would be desirable? Thereis a need for comparable indicators of child cognitive and behavioural development coveringthe points of entry into pre-school and into compulsory schooling. Equally, cognitive andbehavioural indicators several years into the compulsory schooling period, around ages 8-10,would be of value. Data on child nutrition, height and weight, and oral hygiene at the sameages would be of interest. Consistent and comparable data on breastfeeding durations ofchildren from birth would add to the nutrition information. Breaking down child poverty ratesby stages of childhood would be informative, and could be done readily enough. Self-assessedlife satisfaction data could be collected from about age 8. Data on chronic child physical healthconditions such as asthma could be collected. Comparable information on parental timeinvestment in children would be of value, as would information on the proportion of a family’smonetary resources that was devoted to children.
There is also an important data gap relating to the pre-natal period. Comparable data onthe in-utero environment, including information on pre-natal maternal leave taken andmaternal stress, smoking, drinking, drug taking and diet during pregnancy, would be of agreat deal of value to policy makers.
2. COMPARATIVE CHILD WELL-BEING ACROSS THE OECD
DOING BETTER FOR CHILDREN – ISBN 978-92-64-05933-7 – © OECD 2009 31
child well-being, to assess both living standards today and how well a society is preparing
for its children’s futures.
● Coverage of outcomes within a dimension. It is desirable to cover a range of important sub-
dimensions within each dimension, such as both mental and physical health within the
health dimension. There is little point in having several very good indicators of almost the
same outcome.
Practical limitations
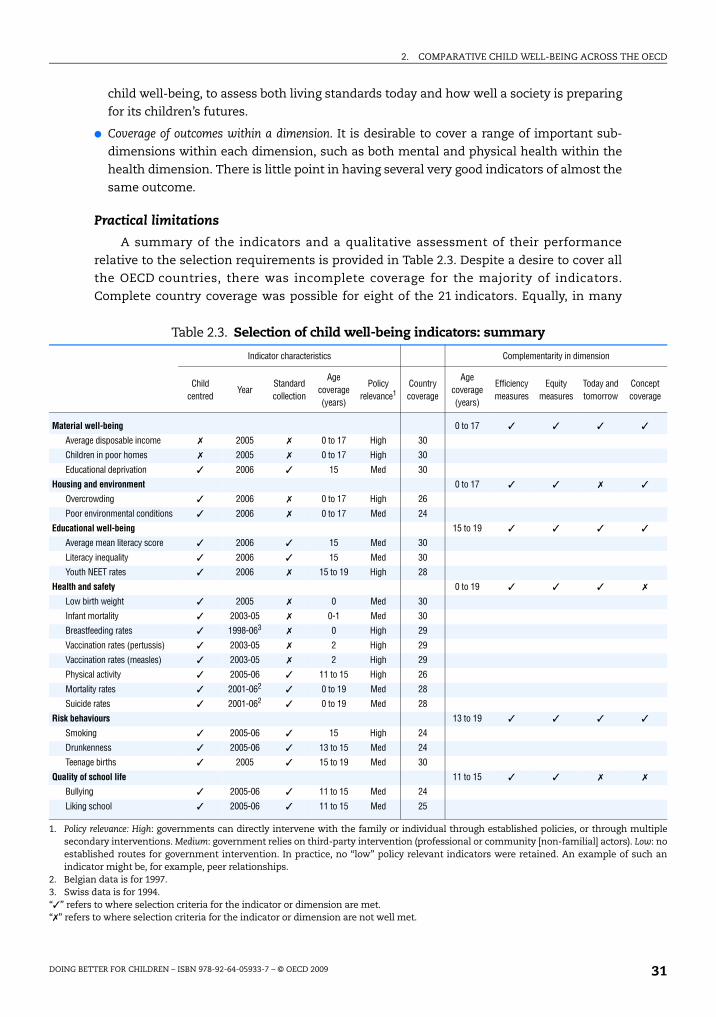
A summary of the indicators and a qualitative assessment of their performance
relative to the selection requirements is provided in Table 2.3. Despite a desire to cover all
the OECD countries, there was incomplete coverage for the majority of indicators.
Complete country coverage was possible for eight of the 21 indicators. Equally, in many
Table 2.3. Selection of child well-being indicators: summary
Indicator characteristics Complementarity in dimension
Child centred
YearStandard collection
Age coverage (years)
Policy relevance1
Country coverage
Age coverage (years)
Efficiency measures
Equity measures
Today and tomorrow
Concept coverage
Material well-being 0 to 17 ✓ ✓ ✓ ✓
Average disposable income ✗ 2005 ✗ 0 to 17 High 30
Children in poor homes ✗ 2005 ✗ 0 to 17 High 30
Educational deprivation ✓ 2006 ✓ 15 Med 30
Housing and environment 0 to 17 ✓ ✓ ✗ ✓
Overcrowding ✓ 2006 ✗ 0 to 17 High 26
Poor environmental conditions ✓ 2006 ✗ 0 to 17 Med 24
Educational well-being 15 to 19 ✓ ✓ ✓ ✓
Average mean literacy score ✓ 2006 ✓ 15 Med 30
Literacy inequality ✓ 2006 ✓ 15 Med 30
Youth NEET rates ✓ 2006 ✗ 15 to 19 High 28
Health and safety 0 to 19 ✓ ✓ ✓ ✗
Low birth weight ✓ 2005 ✗ 0 Med 30
Infant mortality ✓ 2003-05 ✗ 0-1 Med 30
Breastfeeding rates ✓ 1998-063 ✗ 0 High 29
Vaccination rates (pertussis) ✓ 2003-05 ✗ 2 High 29
Vaccination rates (measles) ✓ 2003-05 ✗ 2 High 29
Physical activity ✓ 2005-06 ✓ 11 to 15 High 26
Mortality rates ✓ 2001-062 ✓ 0 to 19 Med 28
Suicide rates ✓ 2001-062 ✓ 0 to 19 Med 28
Risk behaviours 13 to 19 ✓ ✓ ✓ ✓
Smoking ✓ 2005-06 ✓ 15 High 24
Drunkenness ✓ 2005-06 ✓ 13 to 15 Med 24
Teenage births ✓ 2005 ✓ 15 to 19 Med 30
Quality of school life 11 to 15 ✓ ✓ ✗ ✗
Bullying ✓ 2005-06 ✓ 11 to 15 Med 24
Liking school ✓ 2005-06 ✓ 11 to 15 Med 25
1. Policy relevance: High: governments can directly intervene with the family or individual through established policies, or through multiplesecondary interventions. Medium: government relies on third-party intervention (professional or community [non-familial] actors). Low: noestablished routes for government intervention. In practice, no “low” policy relevant indicators were retained. An example of such anindicator might be, for example, peer relationships.
2. Belgian data is for 1997.3. Swiss data is for 1994.“✓” refers to where selection criteria for the indicator or dimension are met.“✗” refers to where selection criteria for the indicator or dimension are not well met.
2. COMPARATIVE CHILD WELL-BEING ACROSS THE OECD
DOING BETTER FOR CHILDREN – ISBN 978-92-64-05933-7 – © OECD 200932
cases it was not possible to find indicators that gave good coverage of child outcomes
across the child life cycle. Only 6 out of 21 indicators cover all children from birth to age 17.
No indicators of well-being were available for the pre-natal period on any dimension, few
for the period of early childhood (from birth to 5 years) and even fewer for middle
childhood (from 6 to 11 years). For good reasons, the available international survey-based
data collections tend to follow children during late childhood, with a strong educational
emphasis or health emphasis. Unfortunately, this focus creates considerable difficulties for
good child age coverage across many dimensions.
Another practical limitation concerns the complementarity of coverage within some
dimensions, for example health. Despite acceptable coverage of physical health indicators,
there was a lack of complementary mental health indicators available for children.
An ability to break down national indicators by sub-categories was not an explicit
criterion for indicator selection in Table 2.4. Nevertheless, such breakdowns can be
interesting. Finding common sub-categories to compare, say, differences by child ethnic
origin across countries is obviously impossible. More readily available were breakdowns by
child age and sex. The indicators able to be broken down by child age, sex, and migrant
status are shown in Table 2.4. Age breakdowns in terms of the risk behaviour and quality
of school life dimensions are not available across the entire child life course, but just across
parts of middle and late childhood (ages 11, 13 and 15).
Table 2.4. Breakdown of child well-being indicators by sex, age and migrant status
Reported by sex Reported by age Reported by migrant status
Material well-being
Average disposable income No No No
Children in poor homes No No No
Educational deprivation Yes No Yes
Housing and environment
Overcrowding No Yes No
Poor environmental conditions No Yes No
Educational well-being
Average mean literacy score Yes No Yes
Literacy inequality Yes No Yes
Youth NEET rates Yes No No
Health and safety
Infant mortality No … No
Low birth weight No … No
Breastfeeding rates No No No
Vaccination rates (pertussis) No No No
Vaccination rates (measles) No No No
Physical activity Yes Yes No
Mortality rates Yes Yes No
Suicide rates Yes No No
Risk behaviours
Smoking Yes No No
Drunkenness Yes Yes No
Teenage births … No No
Quality of school life
Bullying Yes Yes No
Liking school Yes Yes No
“...” denotes that the breakdown is not applicable to that indicator.
2. COMPARATIVE CHILD WELL-BEING ACROSS THE OECD
DOING BETTER FOR CHILDREN – ISBN 978-92-64-05933-7 – © OECD 2009 33
The OECD child well-being indicator rationalised and comparedThe following analysis compares child well-being indicators across OECD member
countries by well-being dimension. Each dimension is introduced and rationalised in light
of the commitments taken on by signatories of the United Nations Convention on the
Rights of the Child (UNCRC). Next, the indicators included are discussed in terms of the
selection requirements outlined above. Finally, the cross-country patterns of indicators are
considered, indicator by indicator.
Material well-being
The children’s rights outlined in the UNCRC commit governments to ensuring that
children have a standard of living adequate to ensure physical, mental, spiritual, moral and
social development. To this end, governments are not only committed to supplementing
the family income, but “in case of need” to provide material assistance (UNCRC art. 27).
Further parts of the convention define the right of children to access diverse material for
their development, such as educational items, like children’s books (art. 17).
Three indicators are chosen to measure the material well-being of children. The first is the
average disposable income in families with children under age 18 (median family income
would have been more desirable than average family income as a measure, but was not
available). The second is a relative poverty rate for children under 18. The third is the
proportion of 15-year-old children deprived of the basic necessities for education relevant to
school performance.
All three indicators are child-centred, in that the child is the unit of analysis. However,
in the case of both the disposable income and poverty measures, it is the family income
that is attributed to the individual child. Ideally, it is the material living standards of the
child, rather than that of his or her family, which is of interest. In the case of the
educational items, the child is asked directly about his or her material situation. This
indicator is thus more strongly child-focused than the income and poverty measures.
The material well-being indicators are comparatively up-to-date. Income and poverty
data come from national household surveys from 2005 or thereabouts. These surveys,
while measuring broadly the same concepts, are not highly standardised across countries.
The data on educational items comes from a 2006 international survey, and is thus well-
standardised across countries.
The first two indicators cover children in all age groups, whereas educational items
data is for 15-year-old children only, which represents an unavoidable compromise.
All OECD countries have cash transfer policies for families with children, providing a
short causal chain for reducing income poverty for families with children. In addition, the
design of the tax-benefit system and work-related incentives, and the provision of child care
and active labour market policies provide other direct routes for governments to influence
parental employment, which is in turn strongly related to child poverty. As for educational
items, in many cases these can be supplied in schools, or offset in other ways through the
school environment, again providing a short causal chain for public policy intervention.
Country coverage of the indicators in the material well-being dimension is excellent.
All countries are included in each indicator.
Complementary equity and efficiency indicators are covered by including average
family income as a measure of efficiency and child poverty as a measure of equity. The

2. COMPARATIVE CHILD WELL-BEING ACROSS THE OECD
DOING BETTER FOR CHILDREN – ISBN 978-92-64-05933-7 – © OECD 200934
former identifies how countries achieve good incomes for families with children overall,
whilst the latter identifies children in families at the lower end of the income distribution.
The indicators within the dimension are also complementary in terms of a child rights
versus a developmentalist perspective. Income and poverty matter for children’s current
well-being, but they also affect the amount of resources parents have available to invest in
the futures of their children, especially their educational futures. The educational items
may reflect child well-being in terms of social inclusion in school and peer environments.
But more importantly, they give an indication of the future educational development of the
child and the degree of parental support for longer-term child outcomes.
The average income of children’s families
There is considerable variation in children’s average family income across OECD
countries (Figure 2.1). Much of the differences in average family income reflects differences
in per capita gross domestic product (GDP) (the correlation of family income with per
capita GDP is 0.92). Turkey and Mexico are at the lowest income end, while children in
Luxembourg and the United States enjoy average family incomes six or seven times higher.
Child income poverty
Child poverty is measured here by the proportion of children who have an equivalised
family income below 50% of the median family income of the total population. Child
poverty rates across OECD countries vary considerably. Denmark has the lowest proportion
of children living in poor families, with around one in 40 children being poor. The other
Nordic countries – Sweden, Finland, and Norway – are also outstanding performers on this
indicator. On the other hand, as many as one in five or more children in the United States,
Figure 2.1. Average income of children is seven times higher in Luxembourg than in Turkey
Average equivalised household disposable income (0-17 year-olds), USD PPP thousands, circa 2005
Note: Income data is average family income for children aged 0-17 years. Data is for various years between 2003and 2005. It is drawn from national household panel surveys of all OECD countries. Data is converted to common USDusing OECD purchasing power parity exchange rates, and equivalised using the square root of the family size.
Source: OECD Income Distribution database, developed for OECD (2008b), Growing Unequal: Income Distribution and Povertyin OECD Countries
1 2 http://dx.doi.org/10.1787/710807057147
40
35
30
25
20
15
10
5
0
34.2
29.2
28.6
25.6
25.0
24.7
23.2
22.7
22.5
22.4
22.3
22.2
22.0
21.7
21.4
20.8
19.9
19.9
19.0
17.2
17.2
17.2
16.4
13.8
10.8
9.5
7.9
7.8
5.3
5.1
19.2
Thousands USD PPP
Luxe
mbourg
United
States
Norway
Canad
a
Netherl
ands
Switzerl
and
Denmark
United
Kingdo
mJa
pan
Irelan
d
Icelan
d
Austri
a
Finlan
dKor
ea
Belgium
Austra
lia
Sweden
German
y
Franc
e
New Ze
aland
Greece Ita
lySpa
in
Portug
al
Czech
Rep
ublic
Hunga
ry
Poland
Slovak
Rep
ublic
Mexico
Turke
yOEC
D
2. COMPARATIVE CHILD WELL-BEING ACROSS THE OECD
DOING BETTER FOR CHILDREN – ISBN 978-92-64-05933-7 – © OECD 2009 35
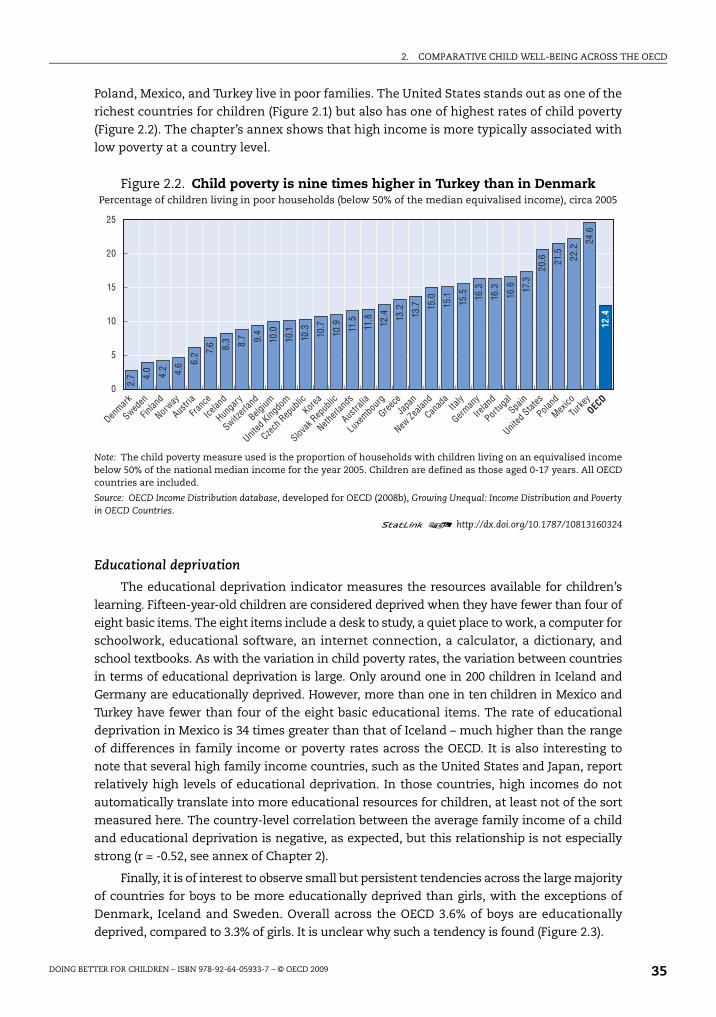
Poland, Mexico, and Turkey live in poor families. The United States stands out as one of the
richest countries for children (Figure 2.1) but also has one of highest rates of child poverty
(Figure 2.2). The chapter’s annex shows that high income is more typically associated with
low poverty at a country level.
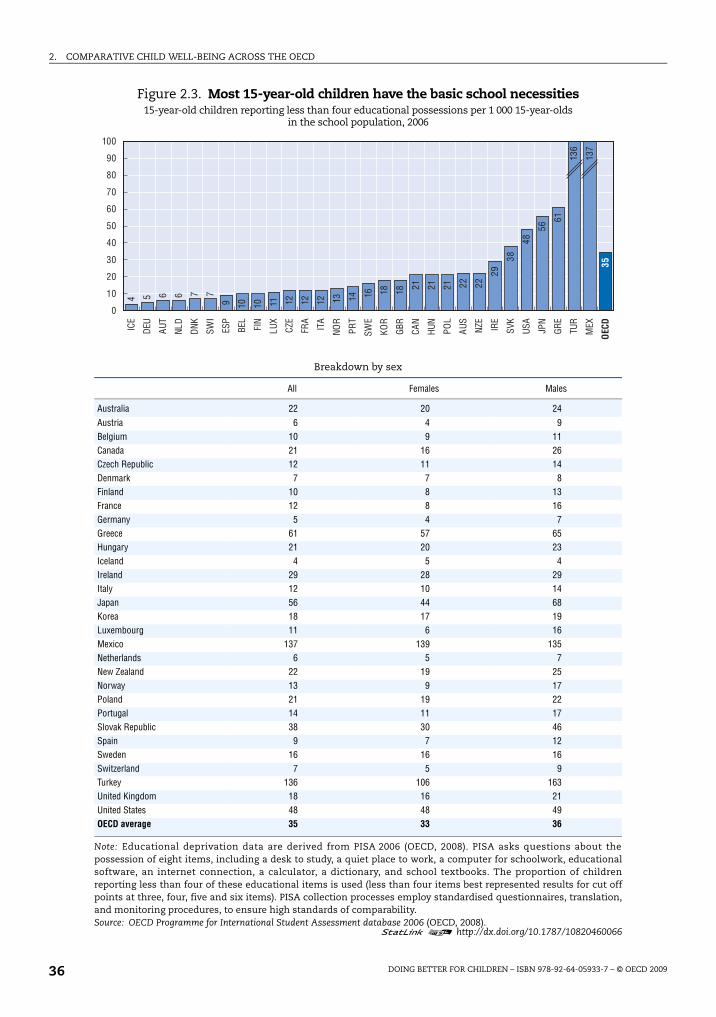
Educational deprivation
The educational deprivation indicator measures the resources available for children’s
learning. Fifteen-year-old children are considered deprived when they have fewer than four of
eight basic items. The eight items include a desk to study, a quiet place to work, a computer for
schoolwork, educational software, an internet connection, a calculator, a dictionary, and
school textbooks. As with the variation in child poverty rates, the variation between countries
in terms of educational deprivation is large. Only around one in 200 children in Iceland and
Germany are educationally deprived. However, more than one in ten children in Mexico and
Turkey have fewer than four of the eight basic educational items. The rate of educational
deprivation in Mexico is 34 times greater than that of Iceland – much higher than the range
of differences in family income or poverty rates across the OECD. It is also interesting to
note that several high family income countries, such as the United States and Japan, report
relatively high levels of educational deprivation. In those countries, high incomes do not
automatically translate into more educational resources for children, at least not of the sort
measured here. The country-level correlation between the average family income of a child
and educational deprivation is negative, as expected, but this relationship is not especially
strong (r = -0.52, see annex of Chapter 2).
Finally, it is of interest to observe small but persistent tendencies across the large majority
of countries for boys to be more educationally deprived than girls, with the exceptions of
Denmark, Iceland and Sweden. Overall across the OECD 3.6% of boys are educationally
deprived, compared to 3.3% of girls. It is unclear why such a tendency is found (Figure 2.3).
Figure 2.2. Child poverty is nine times higher in Turkey than in DenmarkPercentage of children living in poor households (below 50% of the median equivalised income), circa 2005
Note: The child poverty measure used is the proportion of households with children living on an equivalised incomebelow 50% of the national median income for the year 2005. Children are defined as those aged 0-17 years. All OECDcountries are included.
Source: OECD Income Distribution database, developed for OECD (2008b), Growing Unequal: Income Distribution and Povertyin OECD Countries.
1 2 http://dx.doi.org/10.1787/10813160324
25
20
15
10
5
0
2.7 4.
0
4.2 4.6 6.
2 7.6 8.3 8.7 9.
4
10.0
10.1
10.3 10.7
10.9 11.5
11.8 12.4 13
.2
13.7 15
.0
15.1
15.5 16
.3
16.3
16.6 17
.3
20.6 21
.5 22.2
24.6
12.4
Denmark
Sweden
Finlan
d
Norway
Austri
a
Franc
e
Icelan
d
Hunga
ry
Switzerl
and
Belgium
United
Kingdo
m
Czech
Rep
ublic
Korea
Slovak
Rep
ublic
Netherl
ands
Austra
lia
Luxe
mbourg
Greece
Japa
n
New Ze
aland
Canad
aIta
ly
German
y
Irelan
d
Portug
alSpa
in
United
States
Poland
Mexico
Turke
yOEC
D
2. COMPARATIVE CHILD WELL-BEING ACROSS THE OECD
DOING BETTER FOR CHILDREN – ISBN 978-92-64-05933-7 – © OECD 200936
Figure 2.3. Most 15-year-old children have the basic school necessities15-year-old children reporting less than four educational possessions per 1 000 15-year-olds
in the school population, 2006
Breakdown by sex
All Females Males
Australia 22 20 24Austria 6 4 9Belgium 10 9 11Canada 21 16 26Czech Republic 12 11 14Denmark 7 7 8Finland 10 8 13France 12 8 16Germany 5 4 7Greece 61 57 65Hungary 21 20 23Iceland 4 5 4Ireland 29 28 29Italy 12 10 14Japan 56 44 68Korea 18 17 19Luxembourg 11 6 16Mexico 137 139 135Netherlands 6 5 7New Zealand 22 19 25Norway 13 9 17Poland 21 19 22Portugal 14 11 17Slovak Republic 38 30 46Spain 9 7 12Sweden 16 16 16Switzerland 7 5 9Turkey 136 106 163United Kingdom 18 16 21United States 48 48 49OECD average 35 33 36
Note: Educational deprivation data are derived from PISA 2006 (OECD, 2008). PISA asks questions about thepossession of eight items, including a desk to study, a quiet place to work, a computer for schoolwork, educationalsoftware, an internet connection, a calculator, a dictionary, and school textbooks. The proportion of childrenreporting less than four of these educational items is used (less than four items best represented results for cut offpoints at three, four, five and six items). PISA collection processes employ standardised questionnaires, translation,and monitoring procedures, to ensure high standards of comparability.Source: OECD Programme for International Student Assessment database 2006 (OECD, 2008).
1 2 http://dx.doi.org/10.1787/10820460066
0
10
20
30
40
50
60
70
80
90
100IC
E
DEU
AUT
NLD
DNK
SWI
ESP
BEL
FIN
LUX
CZE
FRA
ITA
NOR
PRT
SWE
KOR
GBR
CAN
HUN
POL
AUS
NZE
IRE
SVK
USA
JPN
GRE
TUR
MEX
OEC
D
4 5 6 6 7 7
9 10 10 11 12 12 12 13 14 16 18 18 21 21 21 22 22
29
38
48
56
61
136
137
35
2. COMPARATIVE CHILD WELL-BEING ACROSS THE OECD
DOING BETTER FOR CHILDREN – ISBN 978-92-64-05933-7 – © OECD 2009 37
Housing and environment
As part of recognising each child’s right to a living standard adequate for physical,
mental, spiritual, moral and social development, the UNCRC gives a specific role to
governments in regard to children’s housing conditions (art. 27.3).
Two indicators are included in the housing and environment dimension. The first
indicator is a simple measure of the quality of housing for children, recording the number
of children living in overcrowded conditions. The second indicator records how many
children experience noise in their house and dirt and grime in their local area.
Housing and environment indicators are child-centred insofar as they refer to a child’s
experienced conditions. The data themselves are not directly collected from the children.
The collection of data for the EU countries is standardised. For additional countries, similar
items have been drawn from nationally representative surveys and reported for the same
age groups. Although the best efforts have been made to ensure comparability, a cautious
interpretation of the results is required.
The indicators in the housing and environment dimension are for children aged 0 to 17.
Data are representative for all families with children in each country.
Housing and environmental conditions are the defining aspects of the living
conditions of children and their families. They are directly amenable to policy, for example
through ownership and maintenance of public housing stock, the availability of housing
benefits, and laws against local pollution.
Both efficiency and equity are addressed in the housing and environment dimension.
While the measures deal with the bottom tail of a distribution, the size of this tail likely
correlates strongly with the average child experience of housing and environmental
conditions. While Housing and environment indicators may relate to some child
developmental outcomes, the dimension has a strong focus on the here-and-now and is
not primarily future-focused.
Overcrowding
Children live in overcrowded conditions when the number of people living in their homes
exceeds the number of rooms in the household (excluding kitchens and bathrooms). Though
the extent of crowded housing for children varies considerably between OECD countries, in
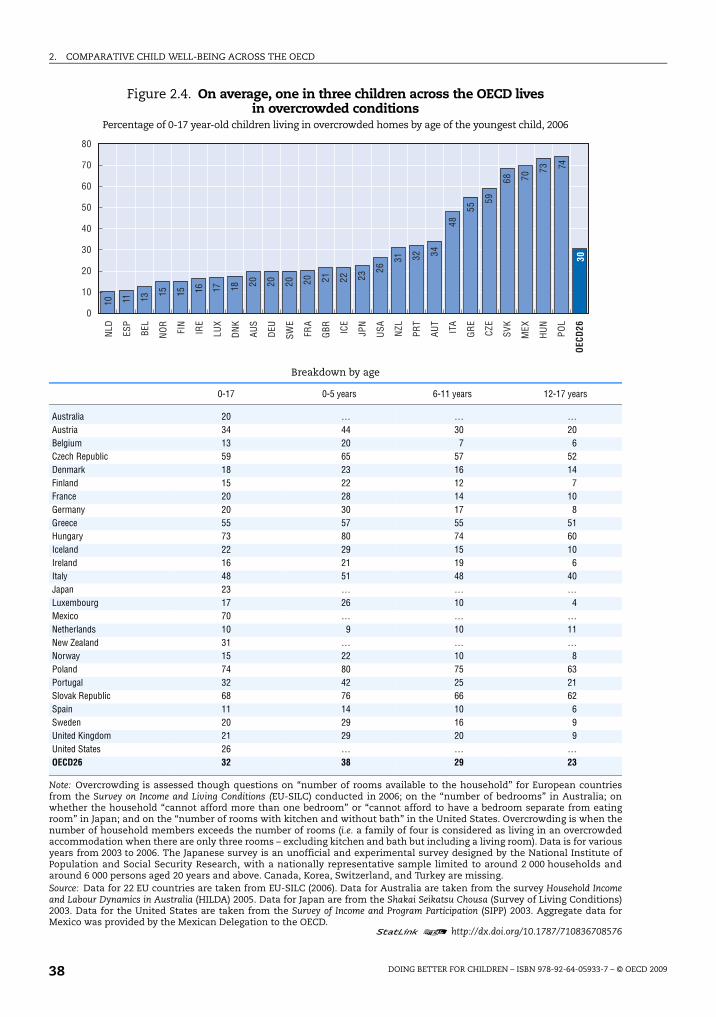
every country at least one in ten children lives in an overcrowded home. Overall, on average
around one in three OECD children live in crowded conditions. Children in eastern Europe
experience overcrowding the most, and crowding is also high in Italy and Greece, while
children in the Netherlands and Spain are least likely to suffer from overcrowding.
Overcrowding varies by child age. It is highest in families where the youngest child is
in early childhood and lowest during late childhood. It is generally more acceptable for
younger children (especially infants) to share a room with parents or siblings. Where the
focal child is older, siblings are also more likely to be older and have left home, freeing up
space. Equally, where the focal child is older, parental labour supply and earnings are also
likely to be higher, also leading to better housing and thus less crowding (Figure 2.4).
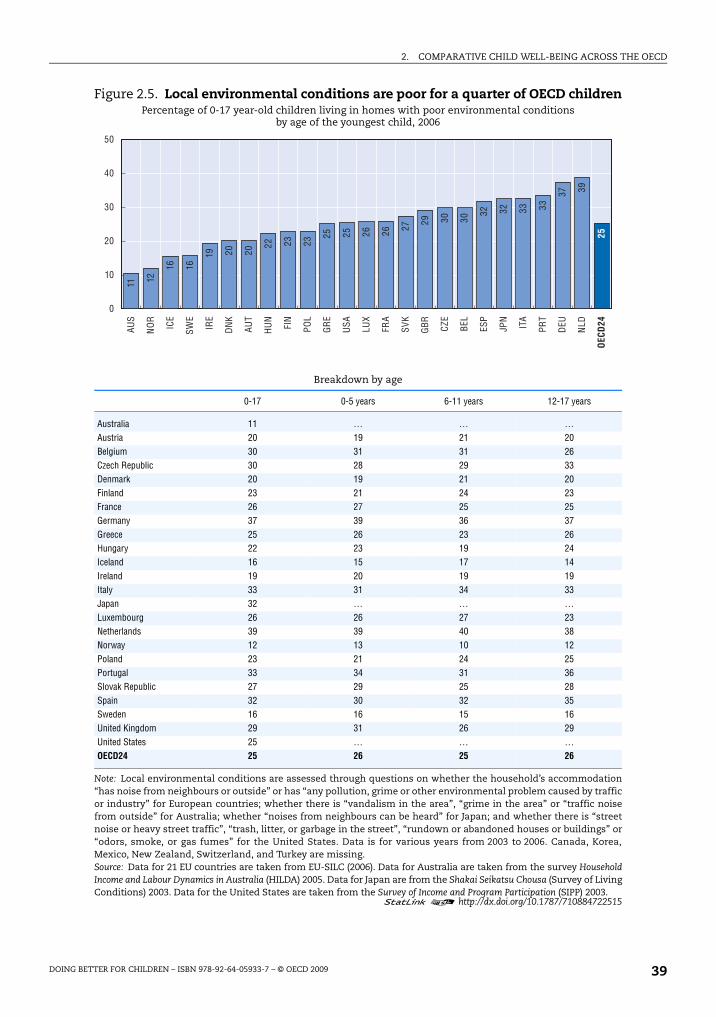
Quality of the local environment
The quality of the local environment is measured using indicators of noisy conditions
at home and in the local area, and dirt, grime, pollution or litter around the home and
in the area. On average one in four children in the OECD experiences poor local
2. COMPARATIVE CHILD WELL-BEING ACROSS THE OECD
DOING BETTER FOR CHILDREN – ISBN 978-92-64-05933-7 – © OECD 200938
Figure 2.4. On average, one in three children across the OECD lives in overcrowded conditions
Percentage of 0-17 year-old children living in overcrowded homes by age of the youngest child, 2006
Breakdown by age
0-17 0-5 years 6-11 years 12-17 years
Australia 20 … … …Austria 34 44 30 20Belgium 13 20 7 6Czech Republic 59 65 57 52Denmark 18 23 16 14Finland 15 22 12 7France 20 28 14 10Germany 20 30 17 8Greece 55 57 55 51Hungary 73 80 74 60Iceland 22 29 15 10Ireland 16 21 19 6Italy 48 51 48 40Japan 23 … … …Luxembourg 17 26 10 4Mexico 70 … … …Netherlands 10 9 10 11New Zealand 31 … … …Norway 15 22 10 8Poland 74 80 75 63Portugal 32 42 25 21Slovak Republic 68 76 66 62Spain 11 14 10 6Sweden 20 29 16 9United Kingdom 21 29 20 9United States 26 … … …OECD26 32 38 29 23
Note: Overcrowding is assessed though questions on “number of rooms available to the household” for European countriesfrom the Survey on Income and Living Conditions (EU-SILC) conducted in 2006; on the “number of bedrooms” in Australia; onwhether the household “cannot afford more than one bedroom” or “cannot afford to have a bedroom separate from eatingroom” in Japan; and on the “number of rooms with kitchen and without bath” in the United States. Overcrowding is when thenumber of household members exceeds the number of rooms (i.e. a family of four is considered as living in an overcrowdedaccommodation when there are only three rooms – excluding kitchen and bath but including a living room). Data is for variousyears from 2003 to 2006. The Japanese survey is an unofficial and experimental survey designed by the National Institute ofPopulation and Social Security Research, with a nationally representative sample limited to around 2 000 households andaround 6 000 persons aged 20 years and above. Canada, Korea, Switzerland, and Turkey are missing.Source: Data for 22 EU countries are taken from EU-SILC (2006). Data for Australia are taken from the survey Household Incomeand Labour Dynamics in Australia (HILDA) 2005. Data for Japan are from the Shakai Seikatsu Chousa (Survey of Living Conditions)2003. Data for the United States are taken from the Survey of Income and Program Participation (SIPP) 2003. Aggregate data forMexico was provided by the Mexican Delegation to the OECD.
1 2 http://dx.doi.org/10.1787/710836708576
0
10
20
30
40
50
60
70
80
NLD ES
P
BEL
NO
R
FIN
IRE
LUX
DN
K
AUS
DEU
SWE
FRA
GBR IC
E
JPN
USA NZL
PRT
AUT
ITA
GR
E
CZE
SVK
MEX
HU
N
POL
OEC
D26
10 11 13 15 15 16 17 18 20 20 20 20 21 22 23
26
31 32 34
48
55
59
68 70
73
30
74
2. COMPARATIVE CHILD WELL-BEING ACROSS THE OECD
DOING BETTER FOR CHILDREN – ISBN 978-92-64-05933-7 – © OECD 2009 39
Figure 2.5. Local environmental conditions are poor for a quarter of OECD childrenPercentage of 0-17 year-old children living in homes with poor environmental conditions
by age of the youngest child, 2006
Breakdown by age
0-17 0-5 years 6-11 years 12-17 years
Australia 11 … … …Austria 20 19 21 20Belgium 30 31 31 26Czech Republic 30 28 29 33Denmark 20 19 21 20Finland 23 21 24 23France 26 27 25 25Germany 37 39 36 37Greece 25 26 23 26Hungary 22 23 19 24Iceland 16 15 17 14Ireland 19 20 19 19Italy 33 31 34 33Japan 32 … … …Luxembourg 26 26 27 23Netherlands 39 39 40 38Norway 12 13 10 12Poland 23 21 24 25Portugal 33 34 31 36Slovak Republic 27 29 25 28Spain 32 30 32 35Sweden 16 16 15 16United Kingdom 29 31 26 29United States 25 … … …OECD24 25 26 25 26
Note: Local environmental conditions are assessed through questions on whether the household’s accommodation“has noise from neighbours or outside” or has “any pollution, grime or other environmental problem caused by trafficor industry” for European countries; whether there is “vandalism in the area”, “grime in the area” or “traffic noisefrom outside” for Australia; whether “noises from neighbours can be heard” for Japan; and whether there is “streetnoise or heavy street traffic”, “trash, litter, or garbage in the street”, “rundown or abandoned houses or buildings” or“odors, smoke, or gas fumes” for the United States. Data is for various years from 2003 to 2006. Canada, Korea,Mexico, New Zealand, Switzerland, and Turkey are missing.Source: Data for 21 EU countries are taken from EU-SILC (2006). Data for Australia are taken from the survey HouseholdIncome and Labour Dynamics in Australia (HILDA) 2005. Data for Japan are from the Shakai Seikatsu Chousa (Survey of LivingConditions) 2003. Data for the United States are taken from the Survey of Income and Program Participation (SIPP) 2003.
1 2 http://dx.doi.org/10.1787/710884722515
0
10
20
30
40
50AU
S
NO
R
ICE
SWE
IRE
DN
K
AUT
HU
N
FIN
POL
GR
E
USA LU
X
FRA
SVK
GBR CZ
E
BEL
ESP
JPN
ITA
PRT
DEU
NLD
OEC
D24
11 12
16 16
19 20 20
22 23 23
25 25 26 26 27 29 30 30
32 32 33 33
37 39
25
2. COMPARATIVE CHILD WELL-BEING ACROSS THE OECD
DOING BETTER FOR CHILDREN – ISBN 978-92-64-05933-7 – © OECD 200940
environmental conditions. Australia and several Nordics perform well, with between one
in ten and two in ten children experiencing problems. However, over one-third of children
in the Netherlands and in Germany live in homes that report experiencing poor
environmental conditions (both countries have comparatively low crowding within the
home). There is no systematic pattern pointing to differences in local environmental
conditions for children in different age groups (Figure 2.5).
Education
The UNCRC states that each child has the right to an education, and that this right
should be developed on the basis of equal opportunity (art. 28). The UNCRC also commits
signatories to providing an education system to develop the child’s personality, talents and
mental and physical abilities to their fullest potential (art. 29a). Ensuring the highest
possible levels of educational achievement for all children addresses this commitment.
Three indicators are chosen to make up the educational well-being dimension. The first
indicator is the PISA 2006 country score for education performance, averaged across reading,
mathematics and science literacy test scores. The second explores inequality in achievement
around these scores using the ratio of the score at the 90th percentile to the 10th percentile
averaged across the three PISA literacy measures. The final indicator identifies the
proportions of 15-19 year-olds not in education and not in employment or training (NEET).
All three indicators are child centred in that the child is the unit of analysis, and
outcomes are directly those of the child. Data for educational achievement is collected
directly from children. However coverage is limited to children attending schools and those
without physical or learning disabilities. Data is up-to-date. Additionally, PISA data is
standardised, as it comes from an international survey. The NEET data come from national
labour force surveys, which are intended to be internationally comparable but typically have
their own national idiosyncrasies.
Unfortunately, however, the age spectrum covered is only one point in late childhood.
PISA surveys only children at age 15. It is not possible to assess educational achievement
across the child’s life cycle. Nonetheless, the timing of the survey in the child’s life cycle
means that accumulated learning from a compulsory school career is well represented by
this cohort.
Although family factors are predominantly associated with variation in educational
achievement in most OECD countries, there are a number of intervention points for
governments to address both average educational achievement and educational inequality.
Schools provide an important environment for children to prepare for adult life, both socially
and economically. School environments are strongly influenced by government policy. In all
OECD countries, by the time a child reaches age 15, a considerable amount of government
investment has been spent on a child’s education. There is a very short chain of causal logic
from government educational policy to child educational outcomes. In terms of the policy
amenability of NEET, all OECD countries have made policy decisions about the age of
compulsory school completion and about the provision of post-compulsory education and
training and active labour market policies regarding youth. Furthermore, family benefits may
continue for youth, conditional on their taking up post-compulsory education and training.
The country coverage in PISA data is excellent, with all OECD countries being included.
NEET data is available for 28 countries, with only Iceland and Korea missing.

2. COMPARATIVE CHILD WELL-BEING ACROSS THE OECD
DOING BETTER FOR CHILDREN – ISBN 978-92-64-05933-7 – © OECD 2009 41
The education dimension contains indicators that complement each other in terms of
efficiency and equity. The inclusion of two indicators derived from PISA cover efficiency via
the average country performance and also equity, by looking at the inequality of outcomes
within the country. Complementarity between the well-being of children today and in the
future is achieved by including school performance and measures of NEET immediately
following post-compulsory education. That said, education data is predominantly focused
on children’s future well-being.
Educational achievement
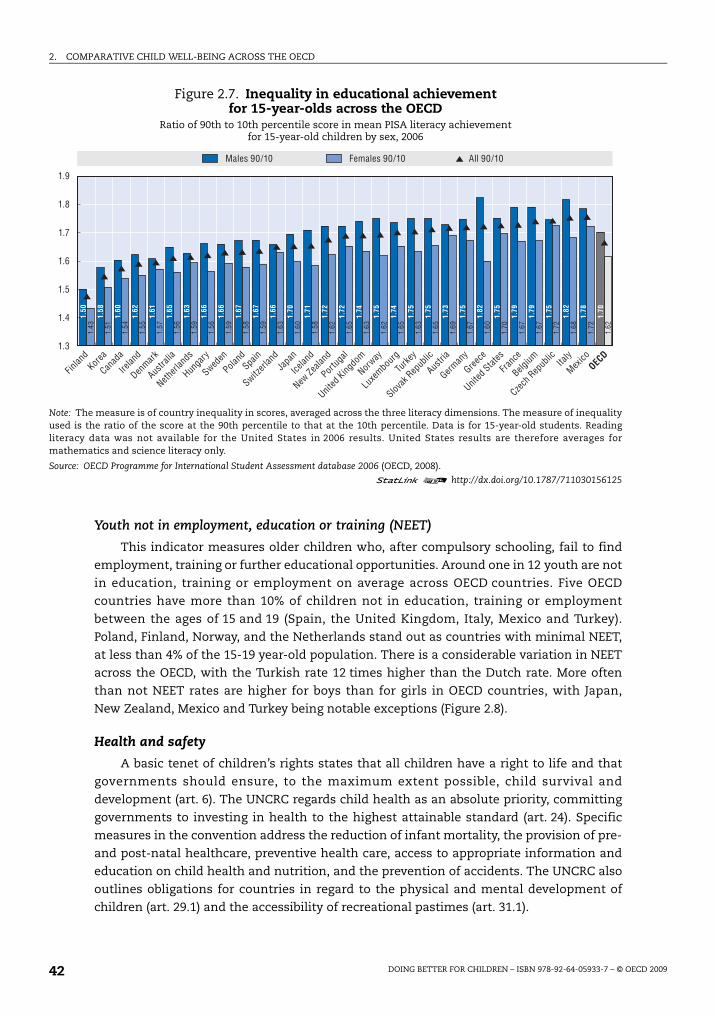
Compared to other indicators, country variation in educational achievement is
comparatively low. High-scoring countries on average literacy performance include
Finland, Korea and Canada, whilst Greece, Italy, Mexico and Italy score poorly. Turning to
inequality, Finland, Korea, and Canada are the most educationally equal countries. The
Czech Republic, Mexico and Italy are the least equal countries. The three top performing
countries in literacy – Finland, Korea, and Canada – have the most compressed distribution
of educational outcomes, indicating it is possible to be both equitable and efficient in
educational outcomes at age 15. There is a strong negative relationship between average
country educational performance and inequality in educational outcomes
(see Annex 2.A1, r = -0.61). High country educational performance is thus strongly
associated with low educational inequality (Figure 2.6).
The average educational performance for girls is systematically better than for boys in
29 OECD countries (the one exception is the United States, where reading was not tested.
Reading is an outcome where there is typically a strong female advantage). At the same
time, inequality in boys’ scores is considerably higher than inequality in girls’ scores in all
OECD countries (Figure 2.7).
Figure 2.6. Average educational achievement of 15-year-olds across the OECDMean PISA literacy achievement for 15-year-olds by sex, 2006
Note: Mean literacy performance is the average of mathematics, reading and science literacy scores. Data is for 15-year-oldstudents. Reading literacy data was not available for the United States in 2006 results. United States results are thereforeaverages for mathematics and science literacy only.
Source: OECD Programme for International Student Assessment database 2006 (OECD, 2008).
1 2 http://dx.doi.org/10.1787/711016460350
350
400
450
500
550
600
542
529
524
521
520
517
514
510
509
505
504
502
502
502
501
500
494
493
492
487
485
482
482
476
471
469
464
432
409
496
553
546
537
527
519
520
516
516
512
505
505
502
499
500
497
501
499
496
484
488
489
480
484
479
484
473
469
465
454
424
405
492
560
547
532
529
521
524
519
516
516
513
507
510
505
508
502
503
505
504
497
496
494
486
486
479
480
473
472
475
441
411
501
TotalMales Females
Finlan
dKor
ea
Canad
a
New Ze
aland
Netherl
ands
Austra
liaJa
pan
Switzerl
and
Belgium
Irelan
d
German
y
Sweden
Austri
a
Czech
Rep
ublic
United
Kingdo
m
Denmark
Poland
Icelan
d
Franc
e
Hunga
ry
Norway
Luxe
mbourg
Slovak
Rep
ublic
United
States
Spain
Portug
alIta
ly
Greece
Turke
y
Mexico
OECD
2. COMPARATIVE CHILD WELL-BEING ACROSS THE OECD
DOING BETTER FOR CHILDREN – ISBN 978-92-64-05933-7 – © OECD 200942
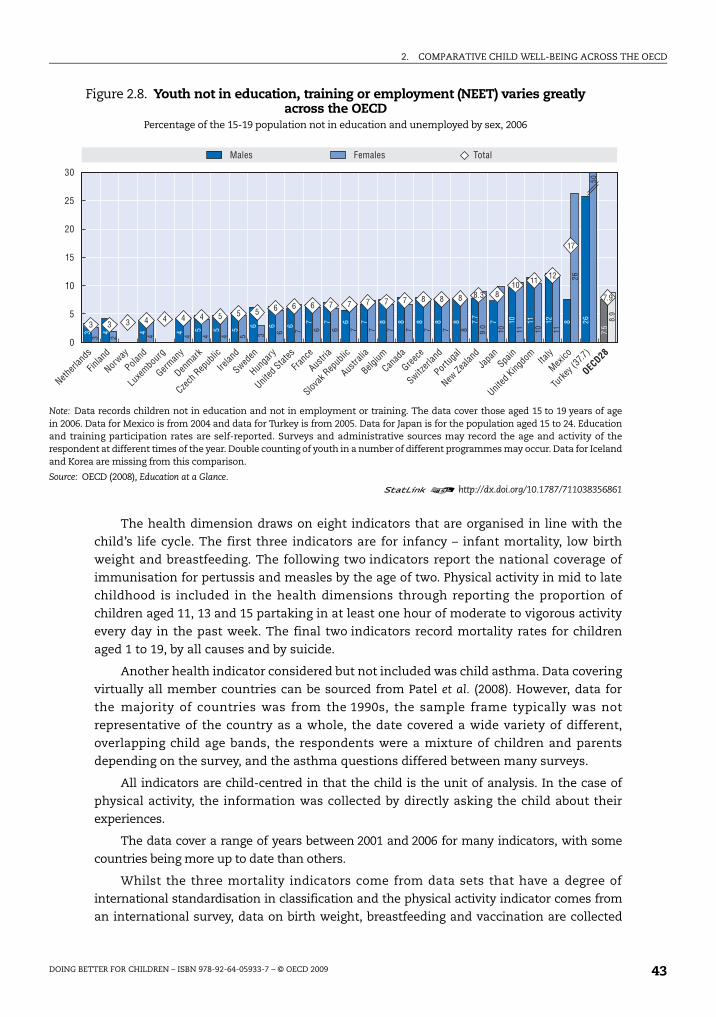
Youth not in employment, education or training (NEET)
This indicator measures older children who, after compulsory schooling, fail to find
employment, training or further educational opportunities. Around one in 12 youth are not
in education, training or employment on average across OECD countries. Five OECD
countries have more than 10% of children not in education, training or employment
between the ages of 15 and 19 (Spain, the United Kingdom, Italy, Mexico and Turkey).
Poland, Finland, Norway, and the Netherlands stand out as countries with minimal NEET,
at less than 4% of the 15-19 year-old population. There is a considerable variation in NEET
across the OECD, with the Turkish rate 12 times higher than the Dutch rate. More often
than not NEET rates are higher for boys than for girls in OECD countries, with Japan,
New Zealand, Mexico and Turkey being notable exceptions (Figure 2.8).
Health and safety
A basic tenet of children’s rights states that all children have a right to life and that
governments should ensure, to the maximum extent possible, child survival and
development (art. 6). The UNCRC regards child health as an absolute priority, committing
governments to investing in health to the highest attainable standard (art. 24). Specific
measures in the convention address the reduction of infant mortality, the provision of pre-
and post-natal healthcare, preventive health care, access to appropriate information and
education on child health and nutrition, and the prevention of accidents. The UNCRC also
outlines obligations for countries in regard to the physical and mental development of
children (art. 29.1) and the accessibility of recreational pastimes (art. 31.1).
Figure 2.7. Inequality in educational achievementfor 15-year-olds across the OECD
Ratio of 90th to 10th percentile score in mean PISA literacy achievementfor 15-year-old children by sex, 2006
Note: The measure is of country inequality in scores, averaged across the three literacy dimensions. The measure of inequalityused is the ratio of the score at the 90th percentile to that at the 10th percentile. Data is for 15-year-old students. Readingliteracy data was not available for the United States in 2006 results. United States results are therefore averages formathematics and science literacy only.
Source: OECD Programme for International Student Assessment database 2006 (OECD, 2008).
1 2 http://dx.doi.org/10.1787/711030156125
1.50
1.43
1.58
1.51
1.60
1.54
1.62
1.55
1.61
1.57
1.65
1.56
1.63
1.59
1.66
1.56
1.66
1.59
1.67
1.58
1.67
1.59
1.66
1.63
1.70
1.60
1.71
1.58
1.72
1.62
1.72
1.65
1.74
1.63
1.75
1.62
1.74
1.65
1.75
1.63
1.75
1.65
1.73
1.69
1.75
1.67
1.82
1.60
1.75
1.70
1.79
1.67
1.79
1.67
1.75
1.72
1.82
1.68
1.78
1.72
1.70
1.62
1.3
1.4
1.5
1.6
1.7
1.8
1.9
All 90/10Males 90/10 Females 90/10
Finlan
dKor
ea
Canad
a
Irelan
d
Denmark
Austra
lia
Netherl
ands
Hunga
ry
Sweden
Poland
Spain
Switzerl
and
Japa
n
Icelan
d
New Ze
aland
Portug
al
United
Kingdo
m
Norway
Luxe
mbourg
Turke
y
Slovak
Rep
ublic
Austri
a
German
y
Greece
United
States
Franc
e
Belgium
Czech
Rep
ublic Ita
ly
Mexico
OECD
2. COMPARATIVE CHILD WELL-BEING ACROSS THE OECD
DOING BETTER FOR CHILDREN – ISBN 978-92-64-05933-7 – © OECD 2009 43
The health dimension draws on eight indicators that are organised in line with the
child’s life cycle. The first three indicators are for infancy – infant mortality, low birth
weight and breastfeeding. The following two indicators report the national coverage of
immunisation for pertussis and measles by the age of two. Physical activity in mid to late
childhood is included in the health dimensions through reporting the proportion of
children aged 11, 13 and 15 partaking in at least one hour of moderate to vigorous activity
every day in the past week. The final two indicators record mortality rates for children
aged 1 to 19, by all causes and by suicide.
Another health indicator considered but not included was child asthma. Data covering
virtually all member countries can be sourced from Patel et al. (2008). However, data for
the majority of countries was from the 1990s, the sample frame typically was not
representative of the country as a whole, the date covered a wide variety of different,
overlapping child age bands, the respondents were a mixture of children and parents
depending on the survey, and the asthma questions differed between many surveys.
All indicators are child-centred in that the child is the unit of analysis. In the case of
physical activity, the information was collected by directly asking the child about their
experiences.
The data cover a range of years between 2001 and 2006 for many indicators, with some
countries being more up to date than others.
Whilst the three mortality indicators come from data sets that have a degree of
international standardisation in classification and the physical activity indicator comes from
an international survey, data on birth weight, breastfeeding and vaccination are collected
Figure 2.8. Youth not in education, training or employment (NEET) varies greatly across the OECD
Percentage of the 15-19 population not in education and unemployed by sex, 2006
Note: Data records children not in education and not in employment or training. The data cover those aged 15 to 19 years of agein 2006. Data for Mexico is from 2004 and data for Turkey is from 2005. Data for Japan is for the population aged 15 to 24. Educationand training participation rates are self-reported. Surveys and administrative sources may record the age and activity of therespondent at different times of the year. Double counting of youth in a number of different programmes may occur. Data for Icelandand Korea are missing from this comparison.
Source: OECD (2008), Education at a Glance.1 2 http://dx.doi.org/10.1787/711038356861
0
5
10
15
20
25
30
3 3 3 4 4 4 4 5 5 5 6 6 6 7 7 7 7 7 8 8 8 8.3 810 11 12
17
7.9
3 4 4 4 5 5 5 6 6 6 7 7 6 7 8 8 8 8 8 7.7
7 10 11 12 8 26
7.5
3 2 4 4 4 4 5 3 6 7 6 6 7 7 7 7 7 7 8 9.0 10 11 10 11
26
50
8.9
TotalMales Females
Netherl
ands
Finlan
d
Norway
Poland
Luxe
mbourg
German
y
Denmark
Czech
Rep
ublic
Irelan
d
Sweden
Hunga
ry
United
States
Franc
e
Austri
a
Slovak
Rep
ublic
Austra
lia
Belgium
Canad
a
Greece
Switzerl
and
Portug
al
New Ze
aland
Japa
nSpa
in
United
Kingdo
mIta
ly
Mexico
Turke
y (37
.7)
OECD28
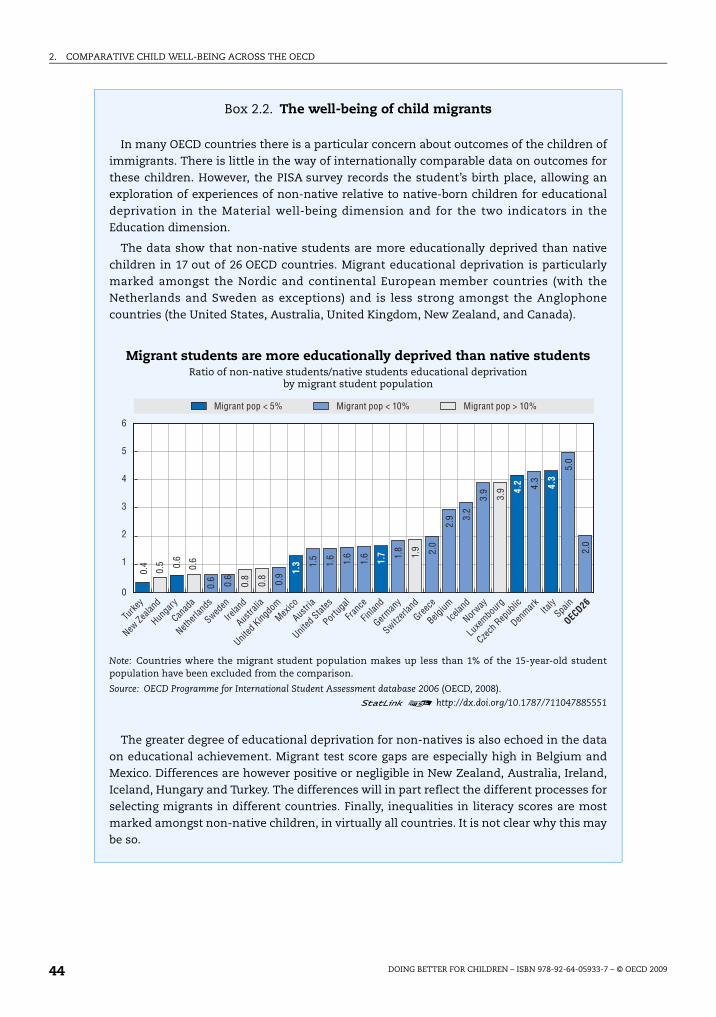
2. COMPARATIVE CHILD WELL-BEING ACROSS THE OECD
DOING BETTER FOR CHILDREN – ISBN 978-92-64-05933-7 – © OECD 200944
Box 2.2. The well-being of child migrants
In many OECD countries there is a particular concern about outcomes of the children ofimmigrants. There is little in the way of internationally comparable data on outcomes forthese children. However, the PISA survey records the student’s birth place, allowing anexploration of experiences of non-native relative to native-born children for educationaldeprivation in the Material well-being dimension and for the two indicators in theEducation dimension.
The data show that non-native students are more educationally deprived than nativechildren in 17 out of 26 OECD countries. Migrant educational deprivation is particularlymarked amongst the Nordic and continental European member countries (with theNetherlands and Sweden as exceptions) and is less strong amongst the Anglophonecountries (the United States, Australia, United Kingdom, New Zealand, and Canada).
Migrant students are more educationally deprived than native studentsRatio of non-native students/native students educational deprivation
by migrant student population
Note: Countries where the migrant student population makes up less than 1% of the 15-year-old studentpopulation have been excluded from the comparison.
Source: OECD Programme for International Student Assessment database 2006 (OECD, 2008).
1 2 http://dx.doi.org/10.1787/711047885551
The greater degree of educational deprivation for non-natives is also echoed in the dataon educational achievement. Migrant test score gaps are especially high in Belgium andMexico. Differences are however positive or negligible in New Zealand, Australia, Ireland,Iceland, Hungary and Turkey. The differences will in part reflect the different processes forselecting migrants in different countries. Finally, inequalities in literacy scores are mostmarked amongst non-native children, in virtually all countries. It is not clear why this maybe so.
6
5
4
3
2
1
0
0.4
0.5 0.
6
0.6
0.6 0.6
0.8
0.8
0.9
1.5
1.6 1.6
1.6 1.
8
1.9 2.0
2.9 3.
2
3.9
3.9 4.
3
5.0
2.0
1.3 1.
7
4.2 4.3
Migrant pop < 5% Migrant pop < 10% Migrant pop > 10%
Turke
y
New Ze
aland
Hunga
ry
Canad
a
Netherl
ands
Sweden
Irelan
d
Austra
lia
United
Kingdo
mMex
ico
Austri
a
United
States
Portug
al
Franc
e
Finlan
d
German
y
Switzerl
and
Greece
Belgium
Icelan
d
Norway
Luxe
mbourg
Czech
Rep
ublic
Denmark Ita
lySpa
in
OECD26

2. COMPARATIVE CHILD WELL-BEING ACROSS THE OECD
DOING BETTER FOR CHILDREN – ISBN 978-92-64-05933-7 – © OECD 2009 45
Box 2.2. The well-being of child migrants (cont.)
Migrant students often perform worse than their native-born peersMean PISA literacy achievement for 15-year-old children by migrant status, 2006
Note: Countries where the migrant student population makes up less than 1% of the 15-year-old studentpopulation have been excluded from the comparison.
Source: OECD Programme for International Student Assessment database 2006 (OECD, 2008).
1 2 http://dx.doi.org/10.1787/711062645363
Inequalities in literacy scores are most marked in the migrant populationRatio of 90th to 10th percentile score in mean PISA literacy achievement for 15-year-old children
by migrant status, 2006
Note: Countries where the migrant student population makes up less than 1% of the 15-year-old studentpopulation have been excluded from the comparison.
Source: OECD Programme for International Student Assessment database 2006 (OECD, 2008).
1 2 http://dx.doi.org/10.1787/711088506346
600
550
500
450
400
350
300
Finlan
d
Canad
a
New Ze
aland
Netherl
ands
Switzerl
and
Austra
lia
Belgium
German
y
Irelan
d
Sweden
Austri
a
Denmark
United
Kingdo
m
Czech
Rep
ublic
Franc
e
Icelan
d
Luxe
mbourg
Hunga
ry
Norway
United
States
Spain
Portug
alIta
ly
Greece
Turke
y
Mexico
OECD26
555
533
527
524
524
521
519
513
510
510
508
505
505
504
497
496
495
493
492
486
481
475
472
468
432
414
498
498 51
9
525
482
452
523
437 45
2
513
454
453
454
481
453
455
490
452
495
449
444
429
441
427
435 44
2
342
461
Native born Non-native born
1.3
1.4
1.5
1.6
1.7
1.8
1.9
2.0
2.1
2.2
1.62
1.58
1.47
1.59
1.55
1.70
1.65
1.57
1.70
1.67
1.63
1.70
1.61
1.59
1.59
1.67
1.73
1.68
1.66
1.58 1.
63
1.70
1.67 1.68 1.
72 1.73
1.64
1.60 1.
63 1.66 1.67 1.
70 1.71 1.
74
1.75 1.
78 1.79
1.79
1.79 1.
83 1.86
1.86
1.86 1.88 1.
89
1.90 1.91
1.92 1.93
1.93 1.
97
2.03
2.17
1.83
Native 90/10 Non-native 90/10
Hunga
ry
Irelan
d
Finlan
d
Austra
lia
Canad
a
Turke
y
New Ze
aland
Denmark
Greece
Portug
al
Icelan
d
United
States
Spain
Netherl
ands
Sweden
United
Kingdo
mIta
ly
Austri
a
Norway
Switzerl
and
Luxe
mbourg
Franc
e
German
y
Belgium
Mexico
Czech
Rep
ublic
OECD26

2. COMPARATIVE CHILD WELL-BEING ACROSS THE OECD
DOING BETTER FOR CHILDREN – ISBN 978-92-64-05933-7 – © OECD 200946
differently in different countries. However, the outcomes are reasonably standardised and
unambiguous.
The health dimension has more indicators than any other dimension. Health also
provides the best coverage of all the child age groups, with early childhood covered by low
birth weights, infant mortality, breastfeeding and immunisations, and with data on physical
health for late-middle and late childhood. Avoidable death rates cover the whole of
childhood from age 1 to 19.
Country coverage is mixed. Data is complete for birth weight and infant mortality, and
coverage is high for breastfeeding and the other mortality outcomes. Physical activity data
covers just 25 countries.
Whilst in some cases the measures chosen are from the left tail of a distribution, these
measures are likely to correlate highly with the average and thus also provide a good
representation of efficiency. For example, the proportion of low birth weight children correlates
strongly with average birth weight by country, where such data is readily available. In terms of
complementarity, it is noteworthy that all indicators, with the potential exception of suicide,
deal with physical health. Apart from youth suicides, there is almost nothing in the way of
cross-country comparative data on the state of children’s mental health.
All OECD governments provide a range of interventions before, during and after birth
during infancy, which are designed to offer the healthiest start in life. A wide range of
regulations are in place to promote safe environments for children in order to minimise
accidents. In all countries immunisation is highly subsidised or free. Thus immunisation
rates also measure the extent to which parents act to promote the well-being of their young
children. Primary health care for children is typically highly subsidised or free. Children’s
physical activity can be changed by changing the school curriculum. Direct public policy
mechanisms exist to provide children with the time and space for physical activity during
school time, and to provide venues for physical activity like parks and green spaces.
Mechanisms also exist to inform parents of basic exercise requirements for children,
through primary health care services.
Infant mortality rates
Infant mortality is low or extremely low in most OECD countries. Japan, along with a
group of Northern European countries, had the lowest rate of infant deaths in 2005
(2 to 3 per 1 000). Mexico and Turkey are outliers and had substantially higher infant
mortality rates than other OECD countries. The United States is a higher-income country
that has infant mortality rates above the OECD average. As with most previous indicators,
there is a considerable variation between top and bottom performers, with the Turkish
mortality rate being ten times the rate of Iceland (Figure 2.9).
Low birth weight
Low birth weight data for the years 2003 to 2005 shows a number of Nordic countries
among the countries with the lowest rates. On the other hand, Japan, a good performer in
terms of infant mortality, switches position to become one of the countries with a high rate of
low birth weight children. Taken together, these results may reflect successful medical care for
low birth weight newborns (OECD, 2007, p. 36). Only Turkey reports more than 10% of infants
having low birth weight. Compared to a number of other indicators used here, variation in the
proportion of low birth weight babies is relatively small across the OECD (Figure 2.10).
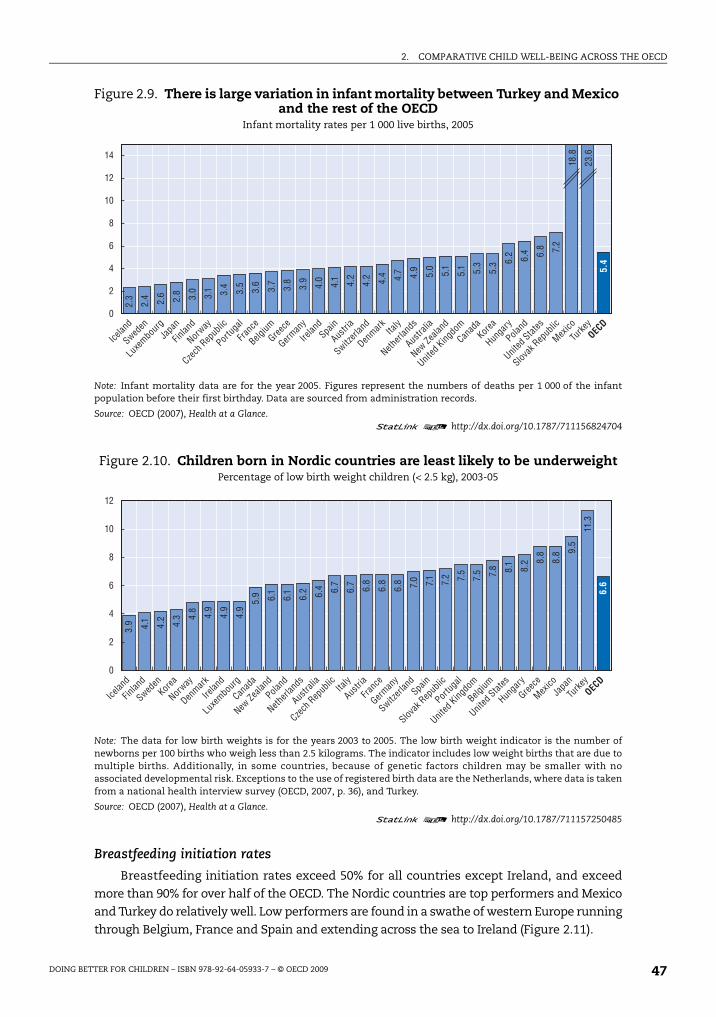
2. COMPARATIVE CHILD WELL-BEING ACROSS THE OECD
DOING BETTER FOR CHILDREN – ISBN 978-92-64-05933-7 – © OECD 2009 47
Breastfeeding initiation rates
Breastfeeding initiation rates exceed 50% for all countries except Ireland, and exceed
more than 90% for over half of the OECD. The Nordic countries are top performers and Mexico
and Turkey do relatively well. Low performers are found in a swathe of western Europe running
through Belgium, France and Spain and extending across the sea to Ireland (Figure 2.11).
Figure 2.9. There is large variation in infant mortality between Turkey and Mexico and the rest of the OECD
Infant mortality rates per 1 000 live births, 2005
Note: Infant mortality data are for the year 2005. Figures represent the numbers of deaths per 1 000 of the infantpopulation before their first birthday. Data are sourced from administration records.
Source: OECD (2007), Health at a Glance.1 2 http://dx.doi.org/10.1787/711156824704
Figure 2.10. Children born in Nordic countries are least likely to be underweightPercentage of low birth weight children (< 2.5 kg), 2003-05
Note: The data for low birth weights is for the years 2003 to 2005. The low birth weight indicator is the number ofnewborns per 100 births who weigh less than 2.5 kilograms. The indicator includes low weight births that are due tomultiple births. Additionally, in some countries, because of genetic factors children may be smaller with noassociated developmental risk. Exceptions to the use of registered birth data are the Netherlands, where data is takenfrom a national health interview survey (OECD, 2007, p. 36), and Turkey.
Source: OECD (2007), Health at a Glance.1 2 http://dx.doi.org/10.1787/711157250485
0
2
4
6
8
10
12
14
18.8
23.6
2.3
2.4 2.6 2.8 3.0
3.1 3.4
3.5
3.6
3.7
3.8
3.9
4.0
4.1 4.2
4.2 4.4 4.7 4.9
5.0
5.1
5.1 5.3
5.3 6.
2 6.4 6.8 7.2
5.4
Icelan
d
Sweden
Luxe
mbourg
Japa
n
Finlan
d
Norway
Czech
Rep
ublic
Portug
al
Franc
e
Belgium
Greece
German
y
Irelan
dSpa
in
Austri
a
Switzerl
and
Denmark Ita
ly
Netherl
ands
Austra
lia
New Ze
aland
United
Kingdo
m
Canad
aKor
ea
Hunga
ry
Poland
United
States
Slovak
Rep
ublic
Mexico
Turke
yOEC
D
0
2
4
6
8
10
12
3.9 4.1
4.2
4.3 4.
8
4.9
4.9
4.9
5.9 6.1
6.1
6.2 6.4 6.7
6.7
6.8
6.8
6.8 7.0 7.1 7.2 7.5
7.5 7.8 8.1
8.2 8.
8
8.8 9.
5
11.3
6.6
Icelan
d
Finlan
d
Sweden
Korea
Norway
Denmark
Irelan
d
Luxe
mbourg
Canad
a
New Ze
aland
Poland
Netherl
ands
Austra
lia
Czech
Rep
ublic Ita
ly
Austri
a
Franc
e
German
y
Switzerl
andSpa
in
Slovak
Rep
ublic
Portug
al
United
Kingdo
m
Belgium
United
States
Hunga
ry
Greece
Mexico
Japa
n
Turke
yOEC
D
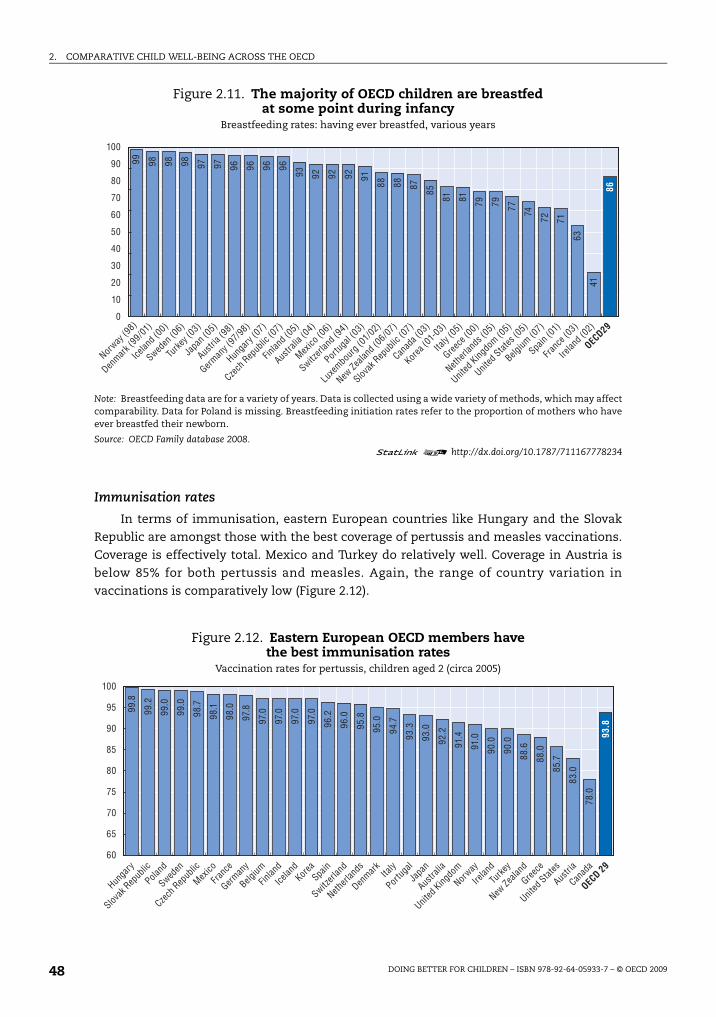
2. COMPARATIVE CHILD WELL-BEING ACROSS THE OECD
DOING BETTER FOR CHILDREN – ISBN 978-92-64-05933-7 – © OECD 200948
Immunisation rates
In terms of immunisation, eastern European countries like Hungary and the Slovak
Republic are amongst those with the best coverage of pertussis and measles vaccinations.
Coverage is effectively total. Mexico and Turkey do relatively well. Coverage in Austria is
below 85% for both pertussis and measles. Again, the range of country variation in
vaccinations is comparatively low (Figure 2.12).
Figure 2.11. The majority of OECD children are breastfed at some point during infancy
Breastfeeding rates: having ever breastfed, various years
Note: Breastfeeding data are for a variety of years. Data is collected using a wide variety of methods, which may affectcomparability. Data for Poland is missing. Breastfeeding initiation rates refer to the proportion of mothers who haveever breastfed their newborn.
Source: OECD Family database 2008.1 2 http://dx.doi.org/10.1787/711167778234
Figure 2.12. Eastern European OECD members havethe best immunisation rates
Vaccination rates for pertussis, children aged 2 (circa 2005)
0
20
30
50
10
40
60
80
70
90
10099 98 98 98 97 97 96 96 96 96
93 92 92 92 91
88 88 87 85
81 81 79 79 77 74
72 71
63
41
86
Norway
(98)
Denmark
(99/01
)
Icelan
d (00)
Sweden
(06)
Turke
y (03)
Japa
n (05)
Austri
a (98)
German
y (97
/98)
Hunga
ry (0
7)
Czech
Rep
ublic
(07)
Finlan
d (05)
Austra
lia (0
4)
Mexico
(06)
Switzerl
and (
94)
Portug
al (0
3)
Luxe
mbourg
(01/0
2)
New Ze
aland
(06/07
)
Slovak
Rep
ublic
(07)
Canad
a (03)
Korea
(01-0
3)
Italy
(05)
Greece
(00)
Netherl
ands
(05)
United
Kingdo
m (05)
United
States
(05)
Belgium
(07)
Spain
(01)
Franc
e (03)
Irelan
d (02)
OECD29
100
60
65
70
75
80
85
90
95 99.8
99.2
99.0
99.0
98.7
98.1
98.0
97.8
97.0
97.0
97.0
97.0
96.2
96.0
95.8
95.0
94.7
93.3
93.0
92.2
91.4
91.0
90.0
90.0
88.6
88.0
85.7
83.0
78.0
93.8
Hunga
ry
Slovak
Rep
ublic
Poland
Sweden
Czech
Rep
ublic
Mexico
Franc
e
German
y
Belgium
Finlan
d
Icelan
dKor
eaSpa
in
Switzerl
and
Netherl
ands
Denmark Ita
ly
Portug
al
Japa
n
Austra
lia
United
Kingdo
m
Norway
Irelan
d
Turke
y
New Ze
aland
Greece
United
States
Austri
a
Canad
a
OECD 29
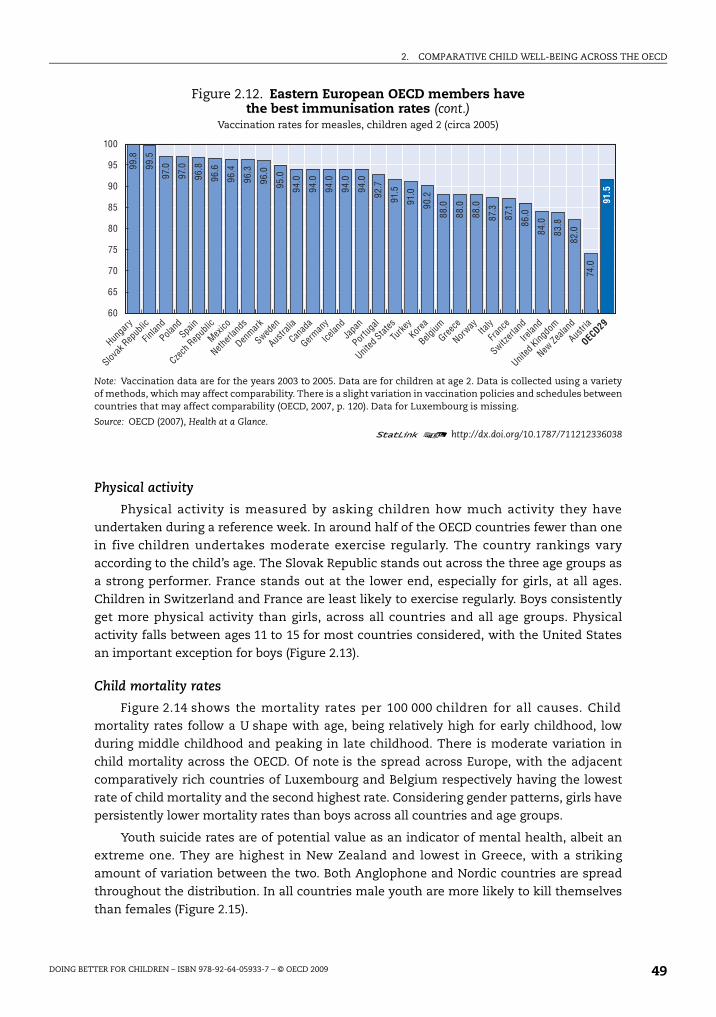
2. COMPARATIVE CHILD WELL-BEING ACROSS THE OECD
DOING BETTER FOR CHILDREN – ISBN 978-92-64-05933-7 – © OECD 2009 49
Physical activity
Physical activity is measured by asking children how much activity they have
undertaken during a reference week. In around half of the OECD countries fewer than one
in five children undertakes moderate exercise regularly. The country rankings vary
according to the child’s age. The Slovak Republic stands out across the three age groups as
a strong performer. France stands out at the lower end, especially for girls, at all ages.
Children in Switzerland and France are least likely to exercise regularly. Boys consistently
get more physical activity than girls, across all countries and all age groups. Physical
activity falls between ages 11 to 15 for most countries considered, with the United States
an important exception for boys (Figure 2.13).
Child mortality rates
Figure 2.14 shows the mortality rates per 100 000 children for all causes. Child
mortality rates follow a U shape with age, being relatively high for early childhood, low
during middle childhood and peaking in late childhood. There is moderate variation in
child mortality across the OECD. Of note is the spread across Europe, with the adjacent
comparatively rich countries of Luxembourg and Belgium respectively having the lowest
rate of child mortality and the second highest rate. Considering gender patterns, girls have
persistently lower mortality rates than boys across all countries and age groups.
Youth suicide rates are of potential value as an indicator of mental health, albeit an
extreme one. They are highest in New Zealand and lowest in Greece, with a striking
amount of variation between the two. Both Anglophone and Nordic countries are spread
throughout the distribution. In all countries male youth are more likely to kill themselves
than females (Figure 2.15).
Figure 2.12. Eastern European OECD members havethe best immunisation rates (cont.)
Vaccination rates for measles, children aged 2 (circa 2005)
Note: Vaccination data are for the years 2003 to 2005. Data are for children at age 2. Data is collected using a varietyof methods, which may affect comparability. There is a slight variation in vaccination policies and schedules betweencountries that may affect comparability (OECD, 2007, p. 120). Data for Luxembourg is missing.
Source: OECD (2007), Health at a Glance.1 2 http://dx.doi.org/10.1787/711212336038
60
65
70
75
80
85
90
95
10099
.5
99.8
97.0
97.0
96.8
96.6
96.4
96.3
96.0
95.0
94.0
94.0
94.0
94.0
94.0
92.7
91.5
91.0
90.2
88.0
88.0
88.0
87.3
87.1
86.0
84.0
83.8
82.0
74.0
91.5
Hunga
ry
Slovak
Rep
ublic
Finlan
d
Poland
Spain
Czech
Rep
ublic
Mexico
Netherl
ands
Denmark
Sweden
Austra
lia
Canad
a
German
y
Icelan
dJa
pan
Portug
al
United
States
Turke
yKor
ea
Belgium
Greece
Norway
Italy
Franc
e
Switzerl
and
Irelan
d
United
Kingdo
m
New Ze
aland
Austri
a
OECD29
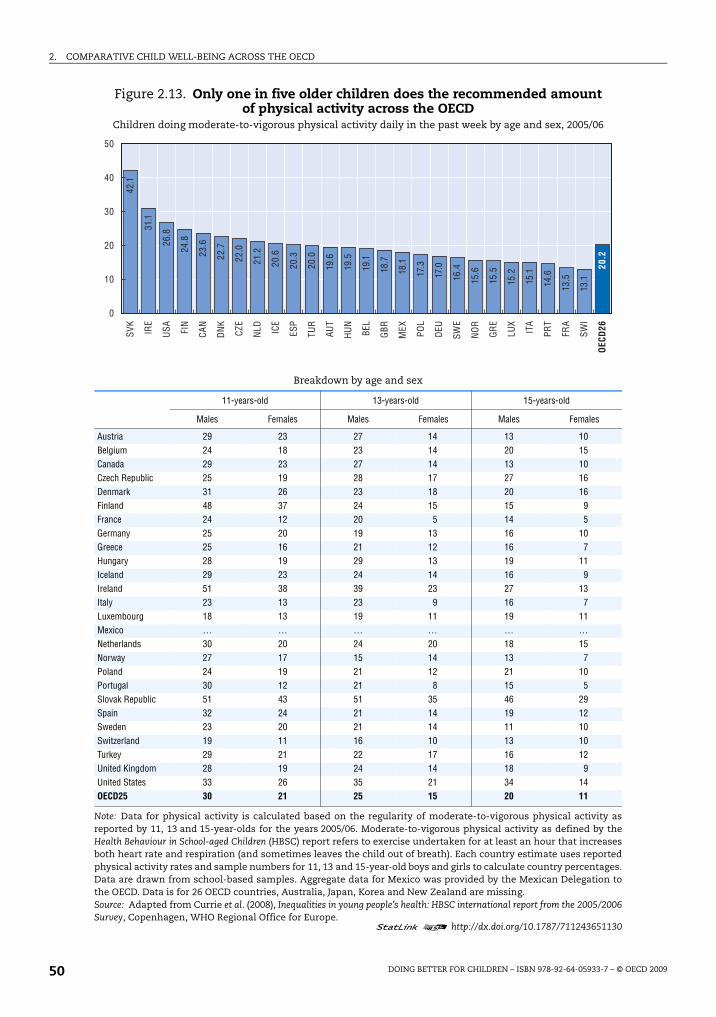
2. COMPARATIVE CHILD WELL-BEING ACROSS THE OECD
DOING BETTER FOR CHILDREN – ISBN 978-92-64-05933-7 – © OECD 200950
Figure 2.13. Only one in five older children does the recommended amount of physical activity across the OECD
Children doing moderate-to-vigorous physical activity daily in the past week by age and sex, 2005/06
Breakdown by age and sex
11-years-old 13-years-old 15-years-old
Males Females Males Females Males Females
Austria 29 23 27 14 13 10Belgium 24 18 23 14 20 15Canada 29 23 27 14 13 10Czech Republic 25 19 28 17 27 16Denmark 31 26 23 18 20 16Finland 48 37 24 15 15 9France 24 12 20 5 14 5Germany 25 20 19 13 16 10Greece 25 16 21 12 16 7Hungary 28 19 29 13 19 11Iceland 29 23 24 14 16 9Ireland 51 38 39 23 27 13Italy 23 13 23 9 16 7Luxembourg 18 13 19 11 19 11Mexico … … … … … …Netherlands 30 20 24 20 18 15Norway 27 17 15 14 13 7Poland 24 19 21 12 21 10Portugal 30 12 21 8 15 5Slovak Republic 51 43 51 35 46 29Spain 32 24 21 14 19 12Sweden 23 20 21 14 11 10Switzerland 19 11 16 10 13 10Turkey 29 21 22 17 16 12United Kingdom 28 19 24 14 18 9United States 33 26 35 21 34 14OECD25 30 21 25 15 20 11
Note: Data for physical activity is calculated based on the regularity of moderate-to-vigorous physical activity asreported by 11, 13 and 15-year-olds for the years 2005/06. Moderate-to-vigorous physical activity as defined by theHealth Behaviour in School-aged Children (HBSC) report refers to exercise undertaken for at least an hour that increasesboth heart rate and respiration (and sometimes leaves the child out of breath). Each country estimate uses reportedphysical activity rates and sample numbers for 11, 13 and 15-year-old boys and girls to calculate country percentages.Data are drawn from school-based samples. Aggregate data for Mexico was provided by the Mexican Delegation tothe OECD. Data is for 26 OECD countries, Australia, Japan, Korea and New Zealand are missing.Source: Adapted from Currie et al. (2008), Inequalities in young people’s health: HBSC international report from the 2005/2006Survey, Copenhagen, WHO Regional Office for Europe.
1 2 http://dx.doi.org/10.1787/711243651130
0
10
20
30
40
50SV
K
IRE
USA FI
N
CAN
DN
K
CZE
NLD IC
E
ESP
TUR
AUT
HU
N
BEL
GBR
MEX PO
L
DEU
SWE
NO
R
GR
E
LUX
ITA
PRT
FRA
SWI
OEC
D26
42.1
31.1
26.8
24.8
23.6
22.7
22.0
21.2
20.6
20.3
20.0
19.6
19.5
19.1
18.7
18.1
17.3
17.0
16.4
15.6
15.5
15.2
15.1
14.6
13.5
13.1
20.2
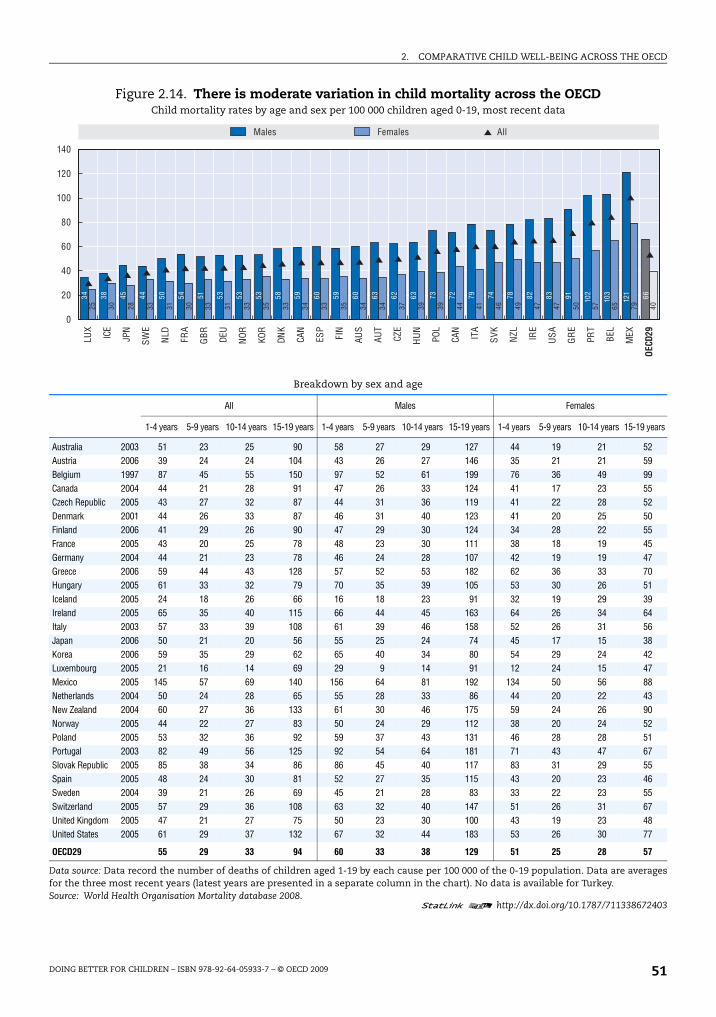
2. COMPARATIVE CHILD WELL-BEING ACROSS THE OECD
DOING BETTER FOR CHILDREN – ISBN 978-92-64-05933-7 – © OECD 2009 51
Figure 2.14. There is moderate variation in child mortality across the OECDChild mortality rates by age and sex per 100 000 children aged 0-19, most recent data
Breakdown by sex and age
All Males Females
1-4 years 5-9 years 10-14 years 15-19 years 1-4 years 5-9 years 10-14 years 15-19 years 1-4 years 5-9 years 10-14 years 15-19 years
Australia 2003 51 23 25 90 58 27 29 127 44 19 21 52Austria 2006 39 24 24 104 43 26 27 146 35 21 21 59Belgium 1997 87 45 55 150 97 52 61 199 76 36 49 99Canada 2004 44 21 28 91 47 26 33 124 41 17 23 55Czech Republic 2005 43 27 32 87 44 31 36 119 41 22 28 52Denmark 2001 44 26 33 87 46 31 40 123 41 20 25 50Finland 2006 41 29 26 90 47 29 30 124 34 28 22 55France 2005 43 20 25 78 48 23 30 111 38 18 19 45Germany 2004 44 21 23 78 46 24 28 107 42 19 19 47Greece 2006 59 44 43 128 57 52 53 182 62 36 33 70Hungary 2005 61 33 32 79 70 35 39 105 53 30 26 51Iceland 2005 24 18 26 66 16 18 23 91 32 19 29 39Ireland 2005 65 35 40 115 66 44 45 163 64 26 34 64Italy 2003 57 33 39 108 61 39 46 158 52 26 31 56Japan 2006 50 21 20 56 55 25 24 74 45 17 15 38Korea 2006 59 35 29 62 65 40 34 80 54 29 24 42Luxembourg 2005 21 16 14 69 29 9 14 91 12 24 15 47Mexico 2005 145 57 69 140 156 64 81 192 134 50 56 88Netherlands 2004 50 24 28 65 55 28 33 86 44 20 22 43New Zealand 2004 60 27 36 133 61 30 46 175 59 24 26 90Norway 2005 44 22 27 83 50 24 29 112 38 20 24 52Poland 2005 53 32 36 92 59 37 43 131 46 28 28 51Portugal 2003 82 49 56 125 92 54 64 181 71 43 47 67Slovak Republic 2005 85 38 34 86 86 45 40 117 83 31 29 55Spain 2005 48 24 30 81 52 27 35 115 43 20 23 46Sweden 2004 39 21 26 69 45 21 28 83 33 22 23 55Switzerland 2005 57 29 36 108 63 32 40 147 51 26 31 67United Kingdom 2005 47 21 27 75 50 23 30 100 43 19 23 48United States 2005 61 29 37 132 67 32 44 183 53 26 30 77
OECD29 55 29 33 94 60 33 38 129 51 25 28 57
Data source: Data record the number of deaths of children aged 1-19 by each cause per 100 000 of the 0-19 population. Data are averagesfor the three most recent years (latest years are presented in a separate column in the chart). No data is available for Turkey.Source: World Health Organisation Mortality database 2008.
1 2 http://dx.doi.org/10.1787/711338672403
34 38 45 44 50 54 51 53 53 53 58 59 60 59 60 63 62 63 73 72 79 74 78 82 83 91 102
103
121 66
25 30 28 33 31 30 33 31 33 35 33 34 33 35 34 34 37 39 39 44 41 46 49 47 47 50 57 65 79 40
0
20
40
60
80
100
120
140
LUX
ICE
JPN
SWE
NLD FR
A
GBR DE
U
NOR KO
R
DNK
CAN
ESP
FIN
AUS
AUT
CZE
HU
N
POL
CAN
ITA
SVK
NZL IR
E
USA
GR
E
PRT
BEL
MEX
OECD
29
AllMales Females

2. COMPARATIVE CHILD WELL-BEING ACROSS THE OECD
DOING BETTER FOR CHILDREN – ISBN 978-92-64-05933-7 – © OECD 200952
Risk behaviours
The UNCRC does not explicitly mention risks from which children should be protected.
But protection is implicit in rights that cover preventive health, education regarding healthy
behaviours, and the provision of recreational activities appropriate to the age of the child.
Protecting children from illicit drugs is however explicit (art. 33). The UNCRC stipulates that
governments should provide family planning education and services to parents (art. 24.2f). In
some cases parents can themselves be children under the age of 18.
Risk taking as a dimension is in part related to health, as it can often have adverse
physical health consequences. However, risk taking is also a proxy for externalising or anti-
social behaviour, as many risk-taking behaviours have strong negative spillovers and are
correlated at an individual level with anti-social behaviours such as alcohol and drug
dependence and violence. Such behaviours are also associated with poor educational
performance. At the same time, it should be acknowledged that taking some risks may not
necessarily be bad, and in some respects are a relatively normal part of growing up.
Indicators of risk taking include 15-year-olds who smoke regularly, 13- and 15-year-olds
who report having been drunk on more than two occasions, and rates of birth to females
aged 15 to 19.
The three indicators are child-centred, being drawn directly from the children
themselves. They are also up-to-date, using data collected during 2005-06, and come from
international surveys and series, achieving a high degree of standardisation. The indicators
cover an age range of 13-19.
There are a wide range of government policy instruments, including: the legal system,
and the age of legal maturity, public information campaigns, laws on advertising, and
Figure 2.15. Rates of suicide are higher among male youth in all OECD countriesYouth suicides by sex per 100 000 youth aged 15-19, most recent data
Data source: Data record the number of suicides of people aged 15-19 per 100 000 of the 15-19 population. Data are averages forthe three most recent years as in Figure 2.14. Comparability of suicide statistics is dependent on reporting mechanisms in eachcountry, as varying degrees of social stigma associated with suicide may lead to variations in under-reporting. No data isavailable for Turkey. There are no reported female youth suicides in Luxembourg and Iceland during the period.
Source: World Health Organisation Mortality database 2008.
1 2 http://dx.doi.org/10.1787/711357235473
0
5
10
15
20
25
1.5
3.2 3.7
3.7 4.2
4.7
7.1
8.5
7.3
8.4
9.3
9.8
12.5 8.8
7.4
10.0 9.4
12.1 9.5
15.3
13.0
14.9
13.4
15.2
16.0
14.7
14.2
17.1
20.8
10.21.0 1.
6
1.1
1.4 1.8
2.2 1.
5
2.6
2.7 3.0
2.5
2.4
2.5
0.0
4.6
6.1
3.5
5.1
3.1
5.8
0.0
3.8
4.4
3.5
2.7
5.1
5.8
7.0
10.9
3.4
All 15-19Males 15-19 Females 15-19
Greece
Portug
alIta
lySpa
in
United
Kingdo
m
Netherl
ands
Franc
e
Slovak
Rep
ublic
Mexico
German
y
Denmark
Czech
Rep
ublic
Luxe
mbourg
Sweden
Korea
Hunga
ry
Switzerl
and
United
States
Japa
n
Icelan
d
Austra
lia
Poland
Belgium
Austri
a
Irelan
d
Canad
a
Norway
Finlan
d
New Ze
aland
OECD29

2. COMPARATIVE CHILD WELL-BEING ACROSS THE OECD
DOING BETTER FOR CHILDREN – ISBN 978-92-64-05933-7 – © OECD 2009 53
taxation to discourage smoking and drinking. Public policy response mechanisms to teenage
pregnancy include providing family planning services and public health information to
children. Sex education classes are also regular fixtures in schools across the OECD.
Country coverage is limited to the 25 countries covered in the Health Behaviour in School-
aged Children (HBSC) survey. Although Turkey is part of the survey, they do not collect data on
risk behaviours.
The complementarity of indicators within the risk dimension is limited by the age-
defined nature of the concept. The indicators do however complement each other in that
they cover a range of different risk behaviours. They also deal with child well-being currently
as well as in the future, given the longer-term consequences of some risk-taking behaviours.
The measures are limited in terms of child coverage because surveys for smoking and
drinking are undertaken in schools. It is likely that those at extreme risk do not attend school
regularly and are hence not surveyed. Teen births, on the other hand, will capture any girls
whose births are registered, which is normally the case in OECD countries.
Smoking and drinking
The variation in smoking and drinking among children in the OECD is moderate by the
standards of many of the other indicators. In terms of smoking, rates range from a bit less
than 10% to a shade under 30%. Smoking rates are somewhat higher on average for girls
than for boys, although the opposite occurs in several countries like Slovak Republic,
Poland, and Finland, and equality can be found in Denmark, Switzerland and Italy.
Rates of children reporting being drunk on more than two occasions also vary
moderately across countries. Drunkenness rates rise strongly between ages 13 and 15 in all
countries. While boys are more likely to have been drunk than girls overall across the
OECD, there are exceptions where drunkenness is more common amongst girls, including
Canada for both age groups, and for 15-year-olds in Iceland, Norway, Spain and the United
Kingdom (Figure 2.16). There are few strong relationships between the risk indicators at a
country level (see Annex 2.A1).
Teenage birth rates
Rates of teen births are particularly high in Mexico, the United States and Turkey, at
three to four times the OECD average. Japan, Korea, Switzerland and the Netherlands have
the lowest rates of teenage birth rates. The variation in rates of teen births is very high
across the OECD. Mexico has rates of teen birth nearly 20 times greater than that of Japan
(Figure 2.17).
Quality of school life
The UNCRC requires governments to provide for children’s health and safety in
institutions, services and facilities that provide for the care and protection of children
(art. 3.3). Schools are also the place where children’s freedom of expression and freedom to
peacefully assemble (art. 13 and 15) can likewise be promoted or inhibited. Furthermore,
the Convention states that the education of the child shall be directed towards preparation
for responsible adult life, and towards an understanding of peace, tolerance and equality
among genders and peoples (art. 29d).
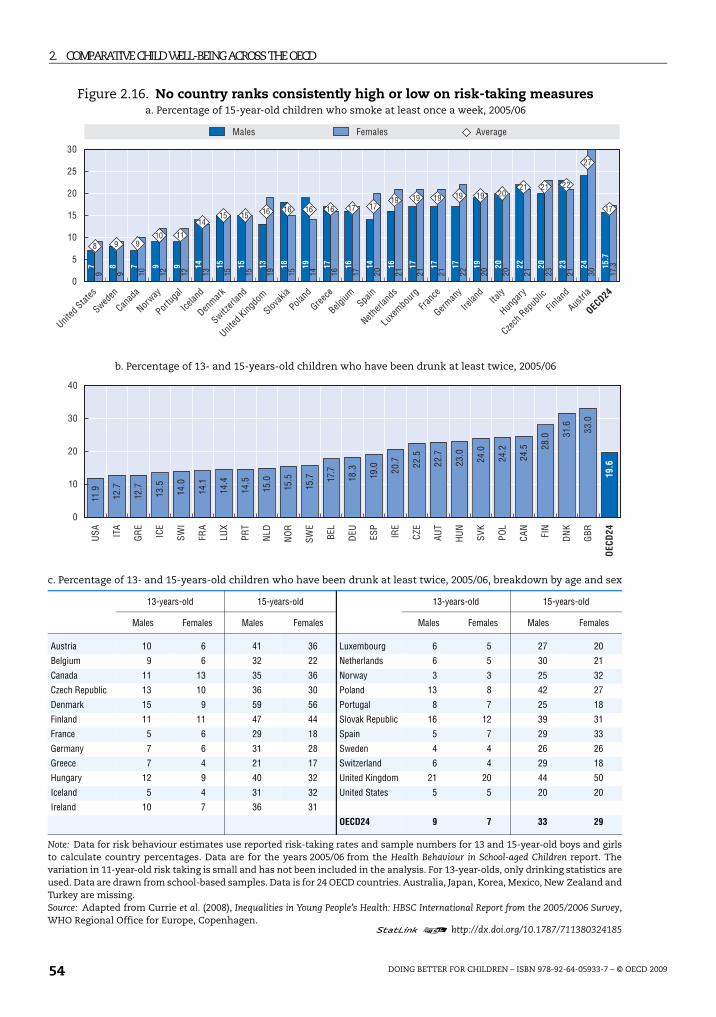
2. COMPARATIVE CHILD WELL-BEING ACROSSTHE OECD
DOING BETTER FOR CHILDREN – ISBN 978-92-64-05933-7 – © OECD 200954
Figure 2.16. No country ranks consistently high or low on risk-taking measuresa. Percentage of 15-year-old children who smoke at least once a week, 2005/06
b. Percentage of 13- and 15-years-old children who have been drunk at least twice, 2005/06
c. Percentage of 13- and 15-years-old children who have been drunk at least twice, 2005/06, breakdown by age and sex
13-years-old 15-years-old 13-years-old 15-years-old
Males Females Males Females Males Females Males Females
Austria 10 6 41 36 Luxembourg 6 5 27 20
Belgium 9 6 32 22 Netherlands 6 5 30 21
Canada 11 13 35 36 Norway 3 3 25 32
Czech Republic 13 10 36 30 Poland 13 8 42 27
Denmark 15 9 59 56 Portugal 8 7 25 18
Finland 11 11 47 44 Slovak Republic 16 12 39 31
France 5 6 29 18 Spain 5 7 29 33
Germany 7 6 31 28 Sweden 4 4 26 26
Greece 7 4 21 17 Switzerland 6 4 29 18
Hungary 12 9 40 32 United Kingdom 21 20 44 50
Iceland 5 4 31 32 United States 5 5 20 20
Ireland 10 7 36 31
OECD24 9 7 33 29
Note: Data for risk behaviour estimates use reported risk-taking rates and sample numbers for 13 and 15-year-old boys and girlsto calculate country percentages. Data are for the years 2005/06 from the Health Behaviour in School-aged Children report. Thevariation in 11-year-old risk taking is small and has not been included in the analysis. For 13-year-olds, only drinking statistics areused. Data are drawn from school-based samples. Data is for 24 OECD countries. Australia, Japan, Korea, Mexico, New Zealand andTurkey are missing.Source: Adapted from Currie et al. (2008), Inequalities in Young People’s Health: HBSC International Report from the 2005/2006 Survey,WHO Regional Office for Europe, Copenhagen.
1 2 http://dx.doi.org/10.1787/711380324185
0
5
10
15
20
25
30
7 8 7 9 9 14 15 15 13 18 19 17 16 14 16 17 17 17 19 20 22 20 23 24 15.7
9 9 10 12 12 13 15 15 19 15 14 16 17 20 21 21 21 22 20 20 21 23 21 30 17.3
8 9 910 11
1415 15 16 16 16 16 17 17
19 19 19 19 19 2021 21 22
27
17
AverageMales Females
United
States
Sweden
Canad
a
Norway
Portug
al
Icelan
d
Denmark
Switzerl
and
United
Kingdo
m
Slovak
ia
Poland
Greece
Belgium Spa
in
Netherl
ands
Luxe
mbourg
Franc
e
German
y
Irelan
dIta
ly
Hunga
ry
Czech
Rep
ublic
Finlan
d
Austri
a
OECD24
0
10
20
30
40
USA IT
A
GR
E
ICE
SWI
FRA
LUX
PRT
NLD
NO
R
SWE
BEL
DEU ES
P
IRE
CZE
AUT
HU
N
SVK
POL
CAN
FIN
DN
K
GBR
OEC
D24
11.9
12.7
12.7
13.5
14.0
14.1
14.4
14.5
15.0
15.5
15.7 17
.7
18.3
19.0 20
.7 22.5
22.7
23.0
24.0
24.2
24.5 28
.0 31.6 33
.0
19.6
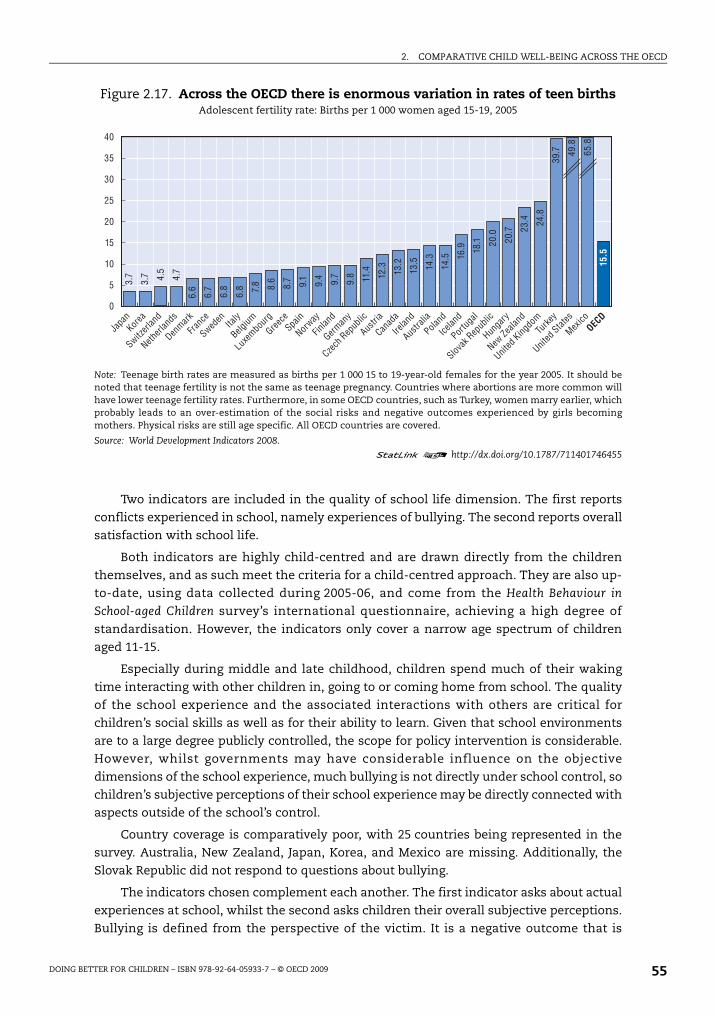
2. COMPARATIVE CHILD WELL-BEING ACROSS THE OECD
DOING BETTER FOR CHILDREN – ISBN 978-92-64-05933-7 – © OECD 2009 55
Two indicators are included in the quality of school life dimension. The first reports
conflicts experienced in school, namely experiences of bullying. The second reports overall
satisfaction with school life.
Both indicators are highly child-centred and are drawn directly from the children
themselves, and as such meet the criteria for a child-centred approach. They are also up-
to-date, using data collected during 2005-06, and come from the Health Behaviour in
School-aged Children survey’s international questionnaire, achieving a high degree of
standardisation. However, the indicators only cover a narrow age spectrum of children
aged 11-15.
Especially during middle and late childhood, children spend much of their waking
time interacting with other children in, going to or coming home from school. The quality
of the school experience and the associated interactions with others are critical for
children’s social skills as well as for their ability to learn. Given that school environments
are to a large degree publicly controlled, the scope for policy intervention is considerable.
However, whilst governments may have considerable influence on the objective
dimensions of the school experience, much bullying is not directly under school control, so
children’s subjective perceptions of their school experience may be directly connected with
aspects outside of the school’s control.
Country coverage is comparatively poor, with 25 countries being represented in the
survey. Australia, New Zealand, Japan, Korea, and Mexico are missing. Additionally, the
Slovak Republic did not respond to questions about bullying.
The indicators chosen complement each another. The first indicator asks about actual
experiences at school, whilst the second asks children their overall subjective perceptions.
Bullying is defined from the perspective of the victim. It is a negative outcome that is
Figure 2.17. Across the OECD there is enormous variation in rates of teen birthsAdolescent fertility rate: Births per 1 000 women aged 15-19, 2005
Note: Teenage birth rates are measured as births per 1 000 15 to 19-year-old females for the year 2005. It should benoted that teenage fertility is not the same as teenage pregnancy. Countries where abortions are more common willhave lower teenage fertility rates. Furthermore, in some OECD countries, such as Turkey, women marry earlier, whichprobably leads to an over-estimation of the social risks and negative outcomes experienced by girls becomingmothers. Physical risks are still age specific. All OECD countries are covered.
Source: World Development Indicators 2008.
1 2 http://dx.doi.org/10.1787/711401746455
40
35
30
25
20
15
10
5
0
3.7
3.7 4.5
4.7
6.6
6.7
6.8
6.8 7.8 8.6
8.7 9.1
9.4 9.7
9.8 11.4 12.3 13.2
13.5 14.3
14.5 16
.9 18.1 20
.0
20.7 23
.4 24.8
39.7 49
.8
65.8
15.5
Japa
nKor
ea
Switzerl
and
Netherl
ands
Denmark
Franc
e
Sweden Ita
ly
Belgium
Luxe
mbourg
Greece
Spain
Norway
Finlan
d
German
y
Czech
Rep
ublic
Austri
a
Canad
a
Irelan
d
Austra
lia
Poland
Icelan
d
Portug
al
Slovak
Rep
ublic
Hunga
ry
New Ze
aland
United
Kingdo
mTu
rkey
United
States
Mexico
OECD
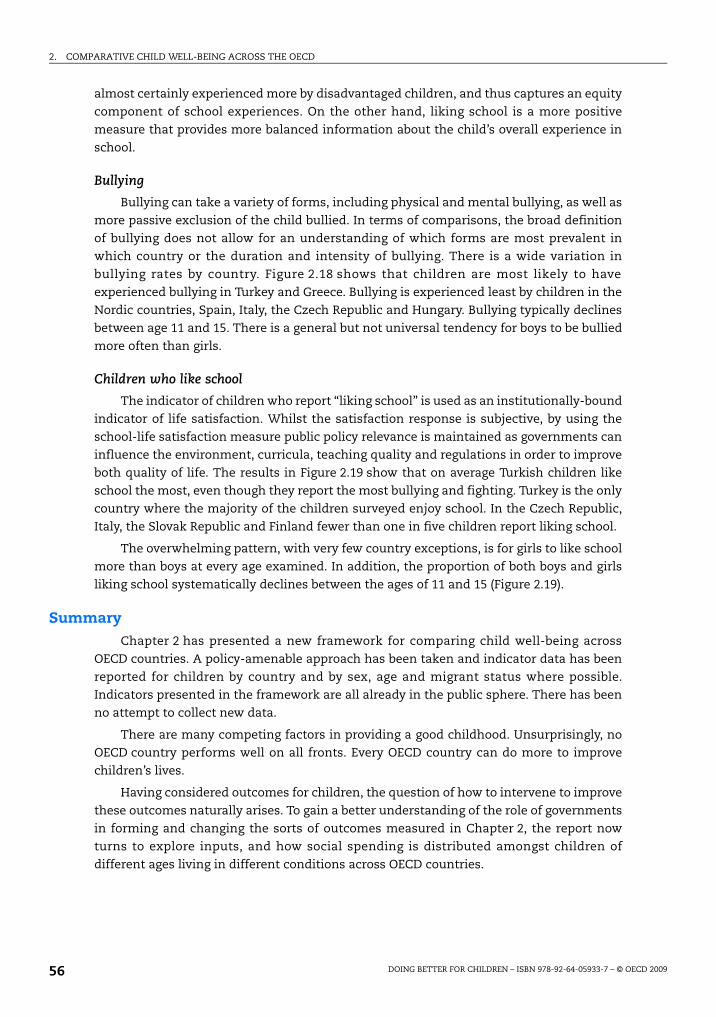
2. COMPARATIVE CHILD WELL-BEING ACROSS THE OECD
DOING BETTER FOR CHILDREN – ISBN 978-92-64-05933-7 – © OECD 200956
almost certainly experienced more by disadvantaged children, and thus captures an equity
component of school experiences. On the other hand, liking school is a more positive
measure that provides more balanced information about the child’s overall experience in
school.
Bullying
Bullying can take a variety of forms, including physical and mental bullying, as well as
more passive exclusion of the child bullied. In terms of comparisons, the broad definition
of bullying does not allow for an understanding of which forms are most prevalent in
which country or the duration and intensity of bullying. There is a wide variation in
bullying rates by country. Figure 2.18 shows that children are most likely to have
experienced bullying in Turkey and Greece. Bullying is experienced least by children in the
Nordic countries, Spain, Italy, the Czech Republic and Hungary. Bullying typically declines
between age 11 and 15. There is a general but not universal tendency for boys to be bullied
more often than girls.
Children who like school
The indicator of children who report “liking school” is used as an institutionally-bound
indicator of life satisfaction. Whilst the satisfaction response is subjective, by using the
school-life satisfaction measure public policy relevance is maintained as governments can
influence the environment, curricula, teaching quality and regulations in order to improve
both quality of life. The results in Figure 2.19 show that on average Turkish children like
school the most, even though they report the most bullying and fighting. Turkey is the only
country where the majority of the children surveyed enjoy school. In the Czech Republic,
Italy, the Slovak Republic and Finland fewer than one in five children report liking school.
The overwhelming pattern, with very few country exceptions, is for girls to like school
more than boys at every age examined. In addition, the proportion of both boys and girls
liking school systematically declines between the ages of 11 and 15 (Figure 2.19).
SummaryChapter 2 has presented a new framework for comparing child well-being across
OECD countries. A policy-amenable approach has been taken and indicator data has been
reported for children by country and by sex, age and migrant status where possible.
Indicators presented in the framework are all already in the public sphere. There has been
no attempt to collect new data.
There are many competing factors in providing a good childhood. Unsurprisingly, no
OECD country performs well on all fronts. Every OECD country can do more to improve
children’s lives.
Having considered outcomes for children, the question of how to intervene to improve
these outcomes naturally arises. To gain a better understanding of the role of governments
in forming and changing the sorts of outcomes measured in Chapter 2, the report now
turns to explore inputs, and how social spending is distributed amongst children of
different ages living in different conditions across OECD countries.
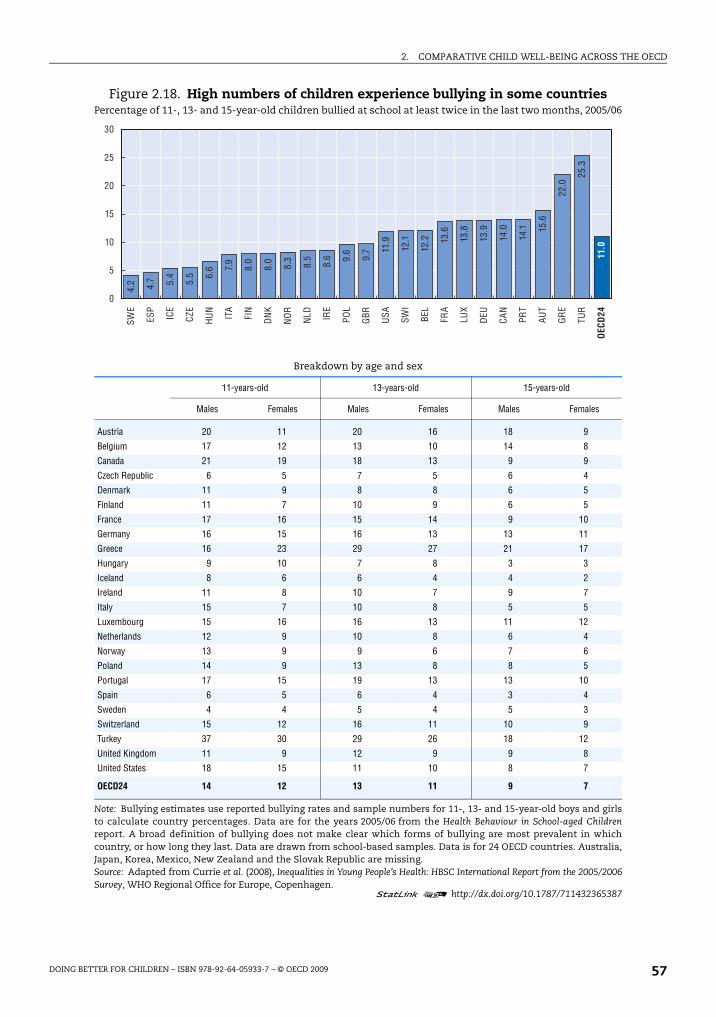
2. COMPARATIVE CHILD WELL-BEING ACROSS THE OECD
DOING BETTER FOR CHILDREN – ISBN 978-92-64-05933-7 – © OECD 2009 57
Figure 2.18. High numbers of children experience bullying in some countriesPercentage of 11-, 13- and 15-year-old children bullied at school at least twice in the last two months, 2005/06
Breakdown by age and sex
11-years-old 13-years-old 15-years-old
Males Females Males Females Males Females
Austria 20 11 20 16 18 9
Belgium 17 12 13 10 14 8
Canada 21 19 18 13 9 9
Czech Republic 6 5 7 5 6 4
Denmark 11 9 8 8 6 5
Finland 11 7 10 9 6 5
France 17 16 15 14 9 10
Germany 16 15 16 13 13 11
Greece 16 23 29 27 21 17
Hungary 9 10 7 8 3 3
Iceland 8 6 6 4 4 2
Ireland 11 8 10 7 9 7
Italy 15 7 10 8 5 5
Luxembourg 15 16 16 13 11 12
Netherlands 12 9 10 8 6 4
Norway 13 9 9 6 7 6
Poland 14 9 13 8 8 5
Portugal 17 15 19 13 13 10
Spain 6 5 6 4 3 4
Sweden 4 4 5 4 5 3
Switzerland 15 12 16 11 10 9
Turkey 37 30 29 26 18 12
United Kingdom 11 9 12 9 9 8
United States 18 15 11 10 8 7
OECD24 14 12 13 11 9 7
Note: Bullying estimates use reported bullying rates and sample numbers for 11-, 13- and 15-year-old boys and girlsto calculate country percentages. Data are for the years 2005/06 from the Health Behaviour in School-aged Childrenreport. A broad definition of bullying does not make clear which forms of bullying are most prevalent in whichcountry, or how long they last. Data are drawn from school-based samples. Data is for 24 OECD countries. Australia,Japan, Korea, Mexico, New Zealand and the Slovak Republic are missing.Source: Adapted from Currie et al. (2008), Inequalities in Young People’s Health: HBSC International Report from the 2005/2006Survey, WHO Regional Office for Europe, Copenhagen.
1 2 http://dx.doi.org/10.1787/711432365387
0
5
10
15
20
25
30SW
E
ESP
ICE
CZE
HU
N
ITA
FIN
DN
K
NO
R
NLD IR
E
POL
GBR USA SW
I
BEL
FRA
LUX
DEU
CAN
PRT
AUT
GR
E
TUR
OEC
D24
4.2 4.7 5.4
5.5 6.
6 7.9
8.0
8.0
8.3
8.5
8.6 9.
6
9.7 11
.9
12.1
12.2 13
.6
13.8
13.9
14.0
14.1 15
.6
22.0
25.3
11.0
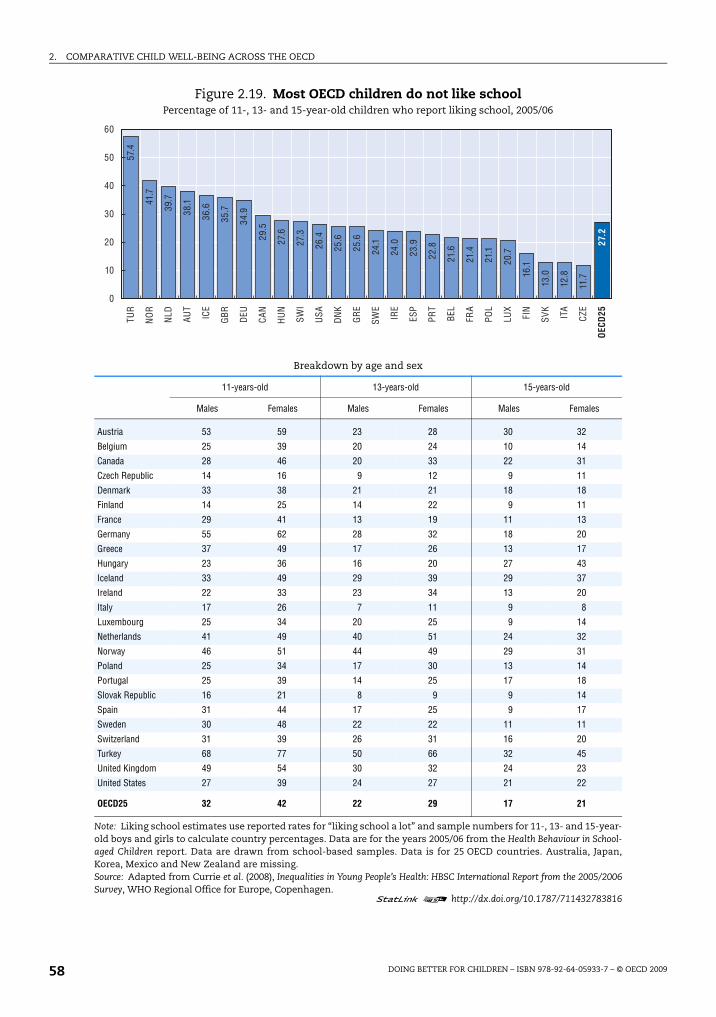
2. COMPARATIVE CHILD WELL-BEING ACROSS THE OECD
DOING BETTER FOR CHILDREN – ISBN 978-92-64-05933-7 – © OECD 200958
Figure 2.19. Most OECD children do not like schoolPercentage of 11-, 13- and 15-year-old children who report liking school, 2005/06
Breakdown by age and sex
11-years-old 13-years-old 15-years-old
Males Females Males Females Males Females
Austria 53 59 23 28 30 32
Belgium 25 39 20 24 10 14
Canada 28 46 20 33 22 31
Czech Republic 14 16 9 12 9 11
Denmark 33 38 21 21 18 18
Finland 14 25 14 22 9 11
France 29 41 13 19 11 13
Germany 55 62 28 32 18 20
Greece 37 49 17 26 13 17
Hungary 23 36 16 20 27 43
Iceland 33 49 29 39 29 37
Ireland 22 33 23 34 13 20
Italy 17 26 7 11 9 8
Luxembourg 25 34 20 25 9 14
Netherlands 41 49 40 51 24 32
Norway 46 51 44 49 29 31
Poland 25 34 17 30 13 14
Portugal 25 39 14 25 17 18
Slovak Republic 16 21 8 9 9 14
Spain 31 44 17 25 9 17
Sweden 30 48 22 22 11 11
Switzerland 31 39 26 31 16 20
Turkey 68 77 50 66 32 45
United Kingdom 49 54 30 32 24 23
United States 27 39 24 27 21 22
OECD25 32 42 22 29 17 21
Note: Liking school estimates use reported rates for “liking school a lot” and sample numbers for 11-, 13- and 15-year-old boys and girls to calculate country percentages. Data are for the years 2005/06 from the Health Behaviour in School-aged Children report. Data are drawn from school-based samples. Data is for 25 OECD countries. Australia, Japan,Korea, Mexico and New Zealand are missing.Source: Adapted from Currie et al. (2008), Inequalities in Young People’s Health: HBSC International Report from the 2005/2006Survey, WHO Regional Office for Europe, Copenhagen.
1 2 http://dx.doi.org/10.1787/711432783816
0
10
20
30
40
50
60TU
R
NO
R
NLD AU
T
ICE
GBR DEU
CAN
HU
N
SWI
USA
DN
K
GR
E
SWE
IRE
ESP
PRT
BEL
FRA
POL
LUX
FIN
SVK
ITA
CZE
OEC
D25
57.4
41.7
39.7
38.1
36.6
35.7
34.9
29.5
27.6
27.3
26.4
25.6
25.6
24.1
24.0
23.9
22.8
21.6
21.4
21.1
20.7
16.1
13.0
12.8
11.7
27.2
2. COMPARATIVE CHILD WELL-BEING ACROSS THE OECD
DOING BETTER FOR CHILDREN – ISBN 978-92-64-05933-7 – © OECD 2009 59
References
Australian Institute of Health and Welfare (2008), Making Progress. The Health, Development and Wellbeing ofAustralia’s Children and Young People Canberra, AIHW.
Ben-Arieh, A. and R. Goerge (2001), “Beyond the Numbers: How Do We Monitor the State of OurChildren”, Children and Youth Services Review, Vol. 23, No. 2, pp. 709-727.
Ben-Arieh, A. and I. Frønes (2007a), “Indicators of Children’s Well being: What should be Measured andWhy?”, Social Indicators Research, Vol. 84, pp. 249-250.
Ben-Arieh, A. and I. Frones (2007b), “Indicators of Children’s Well Being – Concepts, Indices and Usage”,Social Indicators Research, Vol. 80, pp. 1-4.
Bradshaw, J., P. Hoelscher and D. Richardson (2007), “An Index of Child Well-Being in the EuropeanUnion”, Journal of Social Indicators Research, Vol. 80, pp. 133-177.
Casas, F. (1997), “Children’s Rights and Children’s Quality of Life: Conceptual and Practical Issues”, SocialIndicators Research, Vol. 42, pp. 283-298.
Currie, C. et al. (2008), Inequalities in Young People’s Health: HBSC International Report from the 2005/2006 Survey, WHO Regional Office for Europe, Copenhagen.
Currie, J. and E. Tekin (2006), “Does Child Abuse Cause Crime?”, NBER Working Paper No. 12171, April.
Currie, J. and M. Stabile (2007), “Mental Health and Childhood and Human Capital”, NBER Working PaperNo. 13217.
Dijkstra, T. (2009), “Child Well-being in Rich Countries: UNICEF’s Ranking Revisited, and New SymmetricAggregating Operators Exemplified”, Child Indicators Research, forthcoming.
Fattore, T., J. Mason and E. Watson (2007), “Children’s Conceptualisation(s) of their Well-being”, SocialIndicators Research, Vol. 80, pp. 1-4.
Hanafin, S. et al. (2007), “Achieving Consensus in Developing a National Set of Child Well-beingIndicators”, Social Indicators Research, Vol. 80, pp. 79-104.
Heshmati, A., C. Bajalan and A. Tausch (2007), “Measurement and Analysis of Child Well-Being in Middleand High Income Countries”, IZA Document Paper, No. 3203, Institute for the Study of Labor, Bonn,December.
Hood, S. (2007), “Reporting on Children’s Well-being: The State of London’s Children Reports”, SocialIndicators Research, Vol. 80, pp. 1249-1264.
Land, K. (2007a), “The Foundation for Child Development Child and Youth Well-being Index (CWI), 1975-2005, with Projections for 2006”, 2007 FCD-CWI Report, Foundation for Child Development, NewYork.
Land, K. (2007b), “Measuring Trends in Child Well-being: An Evidence-based Approach”, Journal of SocialIndicators Research, Vol. 80, pp. 105-132.
Land, K., V. Lamb, S. Meadows and A. Taylor (2007), “Measuring Trends in Child Well-being: An EvidenceBased Approach”, Social Indicators Research, Vol. 80, pp. 105-132.
OECD (2007), Health at a Glance, OECD Publishing, Paris.
OECD (2008a), Education at a Glance, OECD Publishing, Paris.
OECD (2008b), Growing Unequal – Income Distribution and Poverty in OECD Countries, OECD Publishing, Paris.
OECD (2008c), OECD Family Database, OECD Publishing, Paris.
OECD – Programme for International Student Assessment (2008), The PISA 2006 International Database,available at http://pisa2006.acer.edu.au/.
Patel, S., P. Marjo-Riitta Jarvelin and M.P. Little (2008), “Systematic Review of Worldwide Variations of thePrevalence of Wheezing Symptoms in Children”, Environmental Health, Vol. 7, No. 57.
Pollard, E. and P. Lee (2003), “Child Well-Being: A Systematic Review of the Literature”, Social IndicatorsResearch, Vol. 61, pp. 59-78.
Richardson, D., P. Hoelscher and J. Bradshaw (2008), “Child Well-being in Central and Eastern EuropeanCountries (CEE) and the Commonwealth of Independent States (CIS)”, Child Indicators Research. Vol. 1,pp. 211-250.
2. COMPARATIVE CHILD WELL-BEING ACROSS THE OECD
DOING BETTER FOR CHILDREN – ISBN 978-92-64-05933-7 – © OECD 200960
UNICEF (2007), Child Poverty in Perspective: An Overview of Child Well-being in Rich Countries, Innocenti ReportCard 7, Florence.
United Nations (1989/1990), United Nations Convention for the Rights of Children, www.unhchr.ch/html/menu3/b/k2crc.htm.
World Development Indicators (2008), World Development Indicators Online Database, 2008. http://go.worldbank.org/IW6ZUUHUZ0.
2. COMPARATIVE CHILD WELL-BEING ACROSS THE OECD
DOING BETTER FOR CHILDREN – ISBN 978-92-64-05933-7 – © OECD 2009 61
ANNEX 2.A1
Relationships between the OECD Child Well-being Indicators
Table 2.A1.1 below presents cross-country correlations across the child well-being
indicators. The results are presented in dimensional blocks for easier understanding and
comparison.
The largest number of significant inter-relationships is found for average literacy and
low birth weight, which are both significantly correlated with 13 out of 20 other indicators.
Additionally, the three material well-being measures – a child’s family income, child
poverty, and educational deprivation – are each significantly correlated with 10 or 11 of the
20 other indicators. At the other end of the scale, breastfeeding, physical activity and
smoking are not correlated with any of the other 20 indicators.
Table 2.A1.2 below presents the correlation matrix excluding Turkey. The Turkish
figures have been removed from the associations because of several unanticipated
correlations. Positive significant correlations between liking school, on one hand, with
NEET, low birth weight and bullying together on the other hand are found largely because
of the very high rate of children in Turkey who report liking school. Unexpected significant
associations remain, however, between average literacy and both drunkenness and suicide.
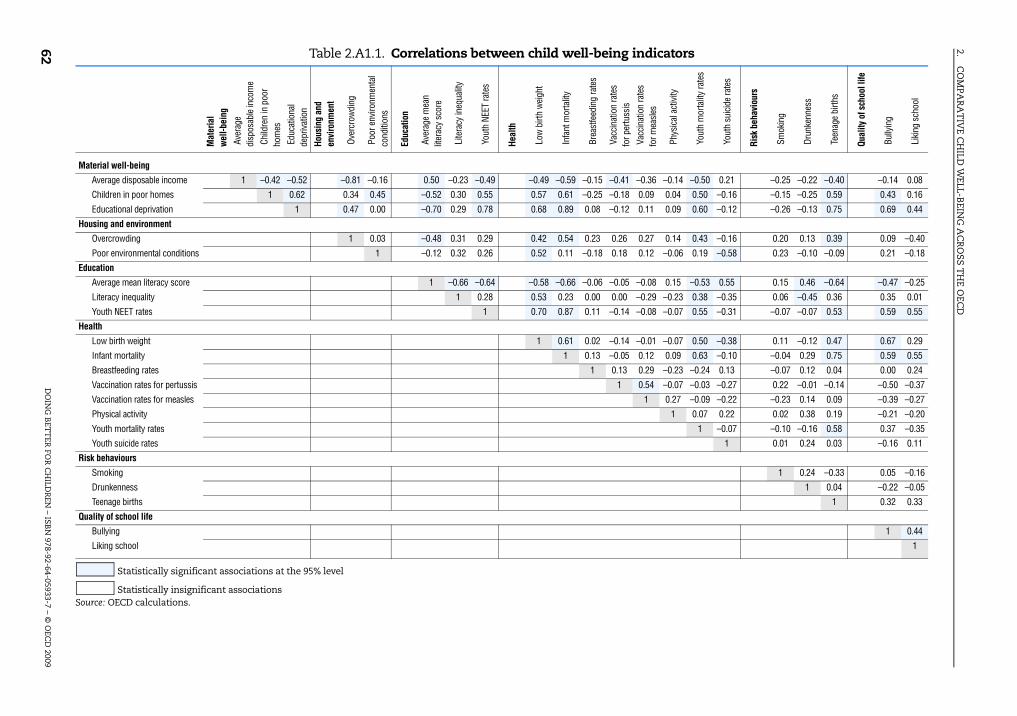
2.C
OM
PAR
AT
IVE C
HILD
WELL-B
EING
AC
RO
SST
HE O
ECD
DO
ING
BET
TER
FOR
CH
ILDR
EN – IS
BN
978-92-64-05933-7 – © O
ECD
200962 Table 2.A1.1. Correlations between child well-being indicators
Mat
eria
l w
ell-b
eing
Ave
rage
di
spos
able
inco
me
Chi
ldre
n in
poo
rho
mes
Edu
catio
nal
depr
ivat
ion
Hous
ing
and
envi
ronm
ent
Ove
rcro
wdi
ng
Poo
r env
ironm
enta
l co
nditi
ons
Educ
atio
n
Ave
rage
mea
n lit
erac
y sc
ore
Lite
racy
ineq
ualit
y
You
th N
EET
rate
s
Heal
th
Low
birt
h w
eigh
t
Infa
nt m
orta
lity
Bre
astfe
edin
g ra
tes
Vac
cina
tion
rate
s fo
r per
tuss
is V
acci
natio
n ra
tes
for m
easl
es
Phy
sica
l act
ivity
You
th m
orta
lity
rate
s
You
th s
uici
de ra
tes
Risk
beh
avio
urs
Sm
okin
g
Dru
nken
ness
Tee
nage
birt
hs
Qual
ity o
f sch
ool l
ife
Bul
lyin
g
Lik
ing
scho
ol
Material well-being
Average disposable income 1 –0.42 –0.52 –0.81 –0.16 0.50 –0.23 –0.49 –0.49 –0.59 –0.15 –0.41 –0.36 –0.14 –0.50 0.21 –0.25 –0.22 –0.40 –0.14 0.08
Children in poor homes 1 0.62 0.34 0.45 –0.52 0.30 0.55 0.57 0.61 –0.25 –0.18 0.09 0.04 0.50 –0.16 –0.15 –0.25 0.59 0.43 0.16
Educational deprivation 1 0.47 0.00 –0.70 0.29 0.78 0.68 0.89 0.08 –0.12 0.11 0.09 0.60 –0.12 –0.26 –0.13 0.75 0.69 0.44
Housing and environment
Overcrowding 1 0.03 –0.48 0.31 0.29 0.42 0.54 0.23 0.26 0.27 0.14 0.43 –0.16 0.20 0.13 0.39 0.09 –0.40
Poor environmental conditions 1 –0.12 0.32 0.26 0.52 0.11 –0.18 0.18 0.12 –0.06 0.19 –0.58 0.23 –0.10 –0.09 0.21 –0.18
Education
Average mean literacy score 1 –0.66 –0.64 –0.58 –0.66 –0.06 –0.05 –0.08 0.15 –0.53 0.55 0.15 0.46 –0.64 –0.47 –0.25
Literacy inequality 1 0.28 0.53 0.23 0.00 0.00 –0.29 –0.23 0.38 –0.35 0.06 –0.45 0.36 0.35 0.01
Youth NEET rates 1 0.70 0.87 0.11 –0.14 –0.08 –0.07 0.55 –0.31 –0.07 –0.07 0.53 0.59 0.55
Health
Low birth weight 1 0.61 0.02 –0.14 –0.01 –0.07 0.50 –0.38 0.11 –0.12 0.47 0.67 0.29
Infant mortality 1 0.13 –0.05 0.12 0.09 0.63 –0.10 –0.04 0.29 0.75 0.59 0.55
Breastfeeding rates 1 0.13 0.29 –0.23 –0.24 0.13 –0.07 0.12 0.04 0.00 0.24
Vaccination rates for pertussis 1 0.54 –0.07 –0.03 –0.27 0.22 –0.01 –0.14 –0.50 –0.37
Vaccination rates for measles 1 0.27 –0.09 –0.22 –0.23 0.14 0.09 –0.39 –0.27
Physical activity 1 0.07 0.22 0.02 0.38 0.19 –0.21 –0.20
Youth mortality rates 1 –0.07 –0.10 –0.16 0.58 0.37 –0.35
Youth suicide rates 1 0.01 0.24 0.03 –0.16 0.11
Risk behaviours
Smoking 1 0.24 –0.33 0.05 –0.16
Drunkenness 1 0.04 –0.22 –0.05
Teenage births 1 0.32 0.33
Quality of school life
Bullying 1 0.44
Liking school 1
Statistically significant associations at the 95% level
Statistically insignificant associationsSource: OECD calculations.

2.C
OM
PAR
AT
IVE C
HILD
WELL-B
EING
AC
RO
SST
HE O
ECD
DO
ING
BET
TER
FOR
CH
ILDR
EN – ISB
N 978-92-64-05933-7 – ©
OEC
D 2009
63
Table 2.A1.2. Correlations between child well-being indicators (without Turkey)
Mat
eria
l w
ell-b
eing
Ave
rage
di
spos
able
inco
me
Chi
ldre
n in
poo
rho
mes
Edu
catio
nal
depr
ivat
ion
Hous
ing
and
envi
ronm
ent
Ove
rcro
wdi
ng
Poo
r env
ironm
enta
l co
nditi
ons
Educ
atio
n
Ave
rage
mea
n lit
erac
y sc
ore
Lite
racy
ineq
ualit
y
You
th N
EET
rate
s
Heal
th
Low
birt
h w
eigh
t
Infa
nt m
orta
lity
Bre
astfe
edin
g ra
tes
Vac
cina
tion
rate
s fo
r per
tuss
is V
acci
natio
n ra
tes
for m
easl
es
Phy
sica
l act
ivity
You
th m
orta
lity
rate
s
You
th s
uici
de ra
tes
Risk
beh
avio
urs
Sm
okin
g
Dru
nken
ness
Tee
nage
birt
hs
Qual
ity o
f sch
ool l
ife
Bul
lyin
g
Lik
ing
scho
ol
Material well-being
Average disposable income 1 –0.31 –0.40 –0.81 –0.16 0.41 –0.21 –0.38 –0.38 –0.51 –0.10 –0.51 –0.40 –0.15 –0.50 0.21 –0.25 –0.22 –0.32 0.19 0.46
Children in poor homes 1 0.51 0.34 0.45 –0.42 0.29 0.45 0.46 0.51 –0.36 –0.14 0.11 0.04 0.50 –0.16 –0.15 –0.25 0.53 0.23 –0.17
Educational deprivation 1 0.47 0.00 –0.61 0.29 0.64 0.53 0.82 –0.03 –0.04 0.16 0.12 0.60 –0.12 –0.26 –0.13 0.74 0.45 –0.21
Housing and environment
Overcrowding 1 0.03 –0.48 0.31 0.29 0.42 0.54 0.23 0.26 0.27 0.14 0.43 –0.16 0.20 0.13 0.39 0.09 –0.40
Poor environmental conditions 1 –0.12 0.32 0.26 0.52 0.11 –0.18 0.18 0.12 –0.06 0.19 –0.58 0.23 –0.10 –0.09 0.21 –0.18
Education
Average mean literacy score 1 –0.69 –0.62 –0.47 –0.58 0.01 –0.12 –0.09 0.17 –0.53 0.55 0.15 0.46 –0.59 –0.20 0.13
Literacy inequality 1 0.43 0.56 0.24 –0.02 0.01 –0.29 –0.23 0.38 –0.35 0.06 –0.45 0.35 0.35 –0.07
Youth NEET rates 1 0.59 0.65 –0.08 –0.06 –0.14 –0.14 0.55 –0.31 –0.07 –0.07 0.56 0.10 –0.15
Health
Low birth weight 1 0.39 –0.07 –0.08 –0.01 –0.08 0.50 –0.38 0.11 –0.12 0.37 0.49 –0.09
Infant mortality 1 0.01 0.09 0.20 0.14 0.63 –0.10 –0.04 0.29 0.82 0.08 –0.10
Breastfeeding rates 1 0.16 0.30 –0.23 –0.24 0.13 –0.07 0.12 –0.01 –0.13 0.17
Vaccination rates for pertussis 1 0.54 –0.07 –0.03 –0.27 0.22 –0.01 –0.11 –0.53 –0.37
Vaccination rates for measles 1 0.27 –0.09 –0.22 –0.23 0.14 0.10 –0.48 –0.33
Physical activity 1 0.07 0.22 0.02 0.38 0.20 –0.28 –0.25
Youth mortality rates 1 –0.07 –0.10 –0.16 0.58 0.37 –0.35
Youth suicide rates 1 0.01 0.24 0.03 –0.16 0.11
Risk behaviours
Smoking 1 0.24 –0.33 0.05 –0.16
Drunkenness 1 0.04 –0.22 –0.05
Teenage births 1 0.03 0.05
Quality of school life
Bullying 1 0.11
Liking school 1
Statistically significant associations at the 95% level
Statistically insignificant associationsSource: OECD calculations.