Comparative Characteristic Lifestyle Approaches of ...
164
East Tennessee State University Digital Commons @ East Tennessee State University Electronic eses and Dissertations Student Works May 1995 Comparative Characteristic Lifestyle Approaches of Persisters and Dropouts in Adult High Schools in Tennessee Samuel J. Shepherd East Tennessee State University Follow this and additional works at: hps://dc.etsu.edu/etd Part of the Adult and Continuing Education Administration Commons is Dissertation - Open Access is brought to you for free and open access by the Student Works at Digital Commons @ East Tennessee State University. It has been accepted for inclusion in Electronic eses and Dissertations by an authorized administrator of Digital Commons @ East Tennessee State University. For more information, please contact [email protected]. Recommended Citation Shepherd, Samuel J., "Comparative Characteristic Lifestyle Approaches of Persisters and Dropouts in Adult High Schools in Tennessee" (1995). Electronic eses and Dissertations. Paper 2793. hps://dc.etsu.edu/etd/2793
Transcript of Comparative Characteristic Lifestyle Approaches of ...

East Tennessee State UniversityDigital Commons @ East
Tennessee State University
Electronic Theses and Dissertations Student Works
May 1995
Comparative Characteristic Lifestyle Approachesof Persisters and Dropouts in Adult High Schoolsin TennesseeSamuel J. ShepherdEast Tennessee State University
Follow this and additional works at: https://dc.etsu.edu/etd
Part of the Adult and Continuing Education Administration Commons
This Dissertation - Open Access is brought to you for free and open access by the Student Works at Digital Commons @ East Tennessee StateUniversity. It has been accepted for inclusion in Electronic Theses and Dissertations by an authorized administrator of Digital Commons @ EastTennessee State University. For more information, please contact [email protected].
Recommended CitationShepherd, Samuel J., "Comparative Characteristic Lifestyle Approaches of Persisters and Dropouts in Adult High Schools inTennessee" (1995). Electronic Theses and Dissertations. Paper 2793. https://dc.etsu.edu/etd/2793

INFORMATION TO USERS
This manuscript has been reproduced from the microfilm master. UMI films the text directly from the original or copy submitted. Thus, some thesis and dissertation copies are in typewriter face, while others may be from any type of computer printer.
The quality of this reproduction Is dependent upon the quality of the copy submitted. Broken or indistinct print, colored or poor quality illustrations and photographs, prim bleed through, substandard maigins, and improper alignment can adversely affect reproduction.
In the unlikely, event that the author did not send UMI a complete manuscript and there are missing pages, these will be noted. Also, if unauthorized copyright material had to be removed, a note will indicate the deletion.
Oversize materials (e.g^ maps, drawings, charts) are reproduced by sectioning the original, beginning at the upper left-hand comer and continuing from left to right in equal sections with small overlaps. Each original is also photographed in one exposure and is included in reduced form at the back of the book.
Photographs included in the original manuscript have been reproduced xerographically in this copy. Higher quality 6" x 9" black and white photographic prints are available for any photographs or illustrations appearing in this copy for an additional charge. Contact UMI directly to order.
A Belt & Howell information Company 300 North Zeeb Road. Ann Arbor. Ml 48106*1346 USA
313/761*4700 800/521*0600

COMPARATIVE CHARACTERISTIC LIFESTYLE APPROACHES
OF PERSISTERS AND DROPOUTS
IN ADULT HIGH SCHOOLS IN TENNESSEE
A Dissertation
Presented to the Faculty of the
Department of Educational Leadership and
Policy Analysis
East T ennessee State University
In Partial Fulfillment
of the Requirements for the Degree of
Doctor of Education
by
Samuel J. Shepherd
May 1995

UMI Number: 9527949
UMI Micro£ora 9S27949 Copyright 1995, by UMI Coapany. All rights reserved*
This aicrofora edition is protected against unauthorized copying under Title 17, United States Code.
UMI300 Horth Zeeb Road Ann Arbor, MI 4B103

APPROVAL
This Is to certify that the Graduate Committee of
Samuel J. Shepherd
met on the 7th_______ dav of December . 1994.
The committee read and examined his dissertation, supervised his
defense of it in an oral examination, and decided to recommend that his
study be submitted to the Graduate Council Associate Vice-President for
Research and Dean, School of Graduate Studies, In partial fulfillment of
the requirem ents for the degree of Doctor of Education in Educational
Leadership and Policy Analysis.
Chalpyian, Graduate Committee
Signed on behalf of Associate Vice-President forthe Graduate Council Research and Dean, School of
Graduate Studies

ABSTRACT
COMPARATIVE CHARACTERISTIC LIFE STYLE APPROACHES OF PERSISTERS AND DROPOUTS
IN ADULT HIGH SCHOOLS IN TENNESSEE
by
Samuel J. Shepherd
The problem of this study w as that no data existed on characteristics of life style management a s related to perslsters and dropouts among adult high school students In the state of Tennessee. The purpose of the study was to determine the characteristic life style approaches most prevalent among persistent enrollees, graduates, and dropouts of selected adult high school programs In Tennessee. Five hundred fifty-nine persisters and 868 dropouts were surveyed by mall, by telephone, or by school site visits. There were 419 participants in the study, 311 persisters and 108 dropouts.
The research was descriptive In nature and utilized data gathered from a survey instrument entitled, Life Stvle Approaches ILSA1 Scale. The Instrument was developed by Williams and Long (1991) based on a
. collection of self-management strategies. Six self-management strategies were identified In the 22 item instrument, and respondents were asked to report to what degree each Item was or w as not similar to their life styles. The Instrument w as piloted on 50 adult high school students In Hamblen and Greene Counties who were not In the study sample. Pilot results indicated that reading and comprehension levels were adequate for the students surveyed.
Findings were divided into two categories, demographics and the findings a s a result of hypothesis testing. Seventy-three percent of respondents were bom after 1960, 88% were Caucasian, and 52% lacked one year or less to graduate. An equal number were married and single, and 55% were employed. Incomes of respondents ranged from less than $5,000 to $40,000; however, 31% of them earned less than $5,000. With regard to hypothesis testing, no significant differences were found between dropouts and persisters In the demographic a reas of age, gender, race, marital status, or occupational status. There w as a significant difference between dropouts and persisters In the number of years needed to graduate. Of the self-management practices
iii

(performance focus and efficiency, goat directedness, timeliness of task accomplishment, organization of physical space, written plans for change, and verbal support for self-management), only performance focus and efficiency was found to be significantly different between dropouts and persisters. The performance focus and efficiency factor is
.closely related to self efficacy, and persisters had a greater degree of self efficacy than did the dropouts reported in this study.
Iv

IRB Number 01 Assurance Number M1194
IRB FORM 108 PROTOCOL NO. 93-155s
EAST TENNESSEE STATE UNIVERSITY INSTITUTIONAL REVIEW BOARD
PROJECT TITLE: Comparative Characteristic Life Style Approaches of Persisters and Dropouts in Adult High Schools in Tennessee.
PRINCIPAL INVESTIGATOR: Samuel J. ShepherdThe Institutional Review Board has reviewed the above-titled project on June 30. 1994 with respect to the rights and safety of human subjects, including matters of informed consent and protection of subject confidentiality, and finds the project acceptable to the Board.
Anthony J. DeLucia Chairman, IRB
v

DEDICATION
In honor and memory of
those members of my family
who supported me during this study

ACKNOWLEDGMENTS
I’ would like to express my appreciation to those who helped make
this study possible:
To Dr. Robert McElrath, chairman of my committee, for his support
and encouragement.
To Dr. Charles Burkett, Dr. Cecil Blankenship, Dr. Donn Gresso,
and Dr. Russell West, who served on my committee and contributed their
time and knowledge.
To the Educational Leadership and Policy Analysis Department of
East T ennessee State University for their foresight in initiating the
Executive Doctoral Program for practicing school administrators.
Without the unique contributions of each of those listed above, this
project would not have been possible.
vii
TABLE OF CONTENTS
PAGE
CHAPTER
1. INTRODUCTION............................................................................ 1
Statem ent of the Problem ............................................................ 5
Purpose of the S tudy.................................................................... 6
Hypotheses........................................................................................ 6
Significance of the Problem ........................................................ 8
Limitations of the Study................................................................ 9
A ssum ptions.................................................... , ................. 9
Definitions of T erm s........................................................................ 10
P ro c e d u re s .................................................................................... 11
Organization of the S tudy . .................................. ............. . 12
2. REVIEW OF RELATED LITERATURE......................................... 14
Early Efforts.................................................................................... 14
Motivational Orientation Literature . . . ........ 20
Deterrents to Participation In Adult E ducation ........................ 37
Future P ro jections........................................................................ 43
S u m m a r y . . . . . ........................... 45
vii I

PAGE
3. METHODOLOGY AND PROCEDURES..................................... 46
Research D esig n .......................................................................... 46
P ro c e d u re s ......................................... 46
Population ...................................................................................... 48
S am p le ............................................................................................ 49
Measurement of V ariables.......................................................... 50
The Instrum ent........................ 51
Data A nalysis................................................................................ 54
4. FINDINGS...................................................................................... 60
Introduction.................................................................................... 60
Demographic Data ...................................................................... 60
Survey of Statement R esponse.................................................. 65
Descriptive Data .......................................................................... 88
5. SUMMARY, FINDINGS, CONCLUSIONS,
AND RECOMMENDATIONS........................................................... 107
Summary ........................................................................................107
Findings ......................................................................................... 108
C o n c lu s io n s ....................................................................................115
Recommendations ........................................................................117
ix

PAGE
REFEREN CES...............................................................................................119
A PPEN D ICES................................................................................................129
A. Letter to Adult High School Directors RequestingList of Student Names and A ddresses........................................130
B. Letter to Students Requesting Participation in S u rvey ............132
C. Survey Instrument/Scoring Guide................................................135
D. Lite Style Approaches (LSA) ScaleChecklist for Pilot S tu d y ...................................................................141
E. Positive and Negative Statem ents on the Life Style Approaches (LSA) S c a le ..............................................................143
VITA ..............................................................................................................145
x

LIST OF TABLES
TABLE PAGE
1. INTERNAL CONSISTENCY COEFFICIENTS FORLSA FA C TO R S................................................................................ 54
2. FREQUENCY OF RESPONSES BY RESPONDENT BIRTH YEAR, GENDER, RACE, NUMBER YEARS NEEDED TO GRADUATE, AND PREVIOUS ATTENDANCE IN ANOTHER HSC/GED PROGRAM .................................................................... 62
3. FREQUENCY OF RESPONSES BY RESPONDENT MARITAL STATUS, OCCUPATIONAL STATUS BEFORE ENROLLMENT, ANNUAL INCOME, AND ENROLLMENT IN PROGRAMSAFTER GRADUATION.................................................................... 64
4. FREQUENCY OF RESPONSE OF PERSISTERS AND DROPOUTS TO LSA QUESTION 1 (CLEAR SENSE OFRIGHT AND WRONG) .................................................................... 66
5. FREQUENCY OF RESPONSE OF PERSISTERS AND DROPOUTS TO LSA QUESTION 2(DIFFICULTY IN PRIORITIZING TASK S).................................... 67
6. FREQUENCY OF RESPONSE OF PERSISTERS AND DROPOUTS TO LSA QUESTION 3(GETTING SIDETRACKED).......................................................... 68
7. FREQUENCY OF RESPONSE OF PERSISTERS AND DROPOUTS TO LSA QUESTION 4 (STARTING IMMEDIATELY ON TASK AFTER CHOICE IS MADE).............................................. 69
8. FREQUENCY OF RESPONSE OF PERSISTERS AND DROPOUTS TO LSA QUESTIONS(WRITTEN PROS AND CONS) .................................................... 70
9. FREQUENCY OF RESPONSE OF PERSISTERS AND DROPOUTS TO LSA QUESTION 6(DIFFICULTY JUDGING COMPLETION TIM E).......................... 71

TABLE PAGE
10. FREQUENCY OF RESPONSE OF PERSISTERS AND DROPOUTS TO LSA QUESTION 7 (INFREQUENT ANALYSIS OF SELF-TALK) ............................................................................ 72
11. FREQUENCY OF RESPONSE OF PERSISTERS AND DROPOUTS TO LSA QUESTION 8(WRITTEN LIFE GOALS) .............................................................. 73
12. FREQUENCY OF RESPONSE OF PERSISTERS AND DROPOUTS TO LSA QUESTION 9(CONFIDENTIALITY OF PLANS).................................................. 74
13. FREQUENCY OF RESPONSE OF PERSISTERS AND DROPOUTS TO LSA QUESTION 10(WELL ORGANIZED WORK SPA C E ).......................................... 75
14. FREQUENCY OF RESPONSE OF PERSISTERS AND DROPOUTS TO LSA QUESTION 11(CLEAR SENSE OF LIFE EXPERIENCES)................................ 76
15. FREQUENCY OF RESPONSE OF PERSISTERS AND DROPOUTS TO LSA QUESTION 12 (I SELDOM ASK FOR FEEDBACK FROM OTHERS REGARDINGNEEDED BEHAVIOR CHANGES).............................................. 77
16. FREQUENCY OF RESPONSE OF PERSISTERS AND DROPOUTS TO LSA QUESTION 13 (TIMELY COMPLETION OF TASKS) ................................................ 78
17. FREQUENCY OF RESPONSE OF PERSISTERS AND DROPOUTS TO LSA QUESTION 14 (I SELDOM WRITEDOWN MY YEARLY GOALS) .................................................... 79
18. FREQUENCY OF RESPONSE OF PERSISTERS AND DROPOUTS TO LSA QUESTION 15 (CONFUSEDABOUT DESIRED PERSONAL QUALITIES) ............................ 80
xii

TABLE PAGE
19. FREQUENCY OF RESPONSE OF PERSISTERS ANDDROPOUTS TO LSA QUESTION 16 (REPORTED DIFFICULTYMATCHING TASKS WITH ENERGY LEVEL) ............................ 81
20. FREQUENCY OF RESPONSE OF PERSISTERS AND DROPOUTS TO LSA QUESTION 17 (SUBDIVISION OF BIG TASKS INTO SMALLER O N E S ).................................................. 82
21. FREQUENCY OF RESPONSE OF PERSISTERS AND DROPOUTS TO LSA QUESTION 18(LITTLE IDEA OF DESIRED ACHIEVEMENT)............................ 83
22. FREQUENCY OF RESPONSE OF PERSISTERS AND DROPOUTS TO LSA QUESTION 19 (ACTIVELY WORKTO MAKE WORKPLACE ATTRACTIVE) .................................... 84
23. FREQUENCY OF RESPONSE OF PERSISTERS AND DROPOUTS TO LSA QUESTION 20 (COMPLETION OFTASKS IN ADVANCE OF DEADLINES) .................................... 85
24. FREQUENCY OF RESPONSE OF PERSISTERS AND DROPOUTS TO LSA QUESTION 21 (DIFFICULTY GETTING BACK ON TRACK AFTER BEING SIDETRACKED)...................... 86
25. FREQUENCY OF RESPONSE OF PERSISTERS AND DROPOUTS TO LSA QUESTION 22(MESSY LIVING SPA C E ).............................................................. 87
26. RESULTS OF T-TEST FOR HYPOTHESIS 1: DIFFERENCE IN SELF-REPORTED SCORES OF PERSISTERS AND DROPOUTS ON PERFORMANCE FOCUS AND EFFICIENCY 89
27. RESULTS OF T-TEST FOR HYPOTHESIS 2: DIFFERENCE IN SELF-REPORTED SCORES OF PERSISTERS AND DROPOUTS ON GOAL DIRECTEDNESS.................................... 90
28. RESULTS OF T-TEST FOR HYPOTHESIS 3: DIFFERENCE IN SELF-REPORTED SCORES OF PERSISTERS AND DROPOUTS ON TIMELINESS OF TASK ACCOMPLISHMENT 91
xlil
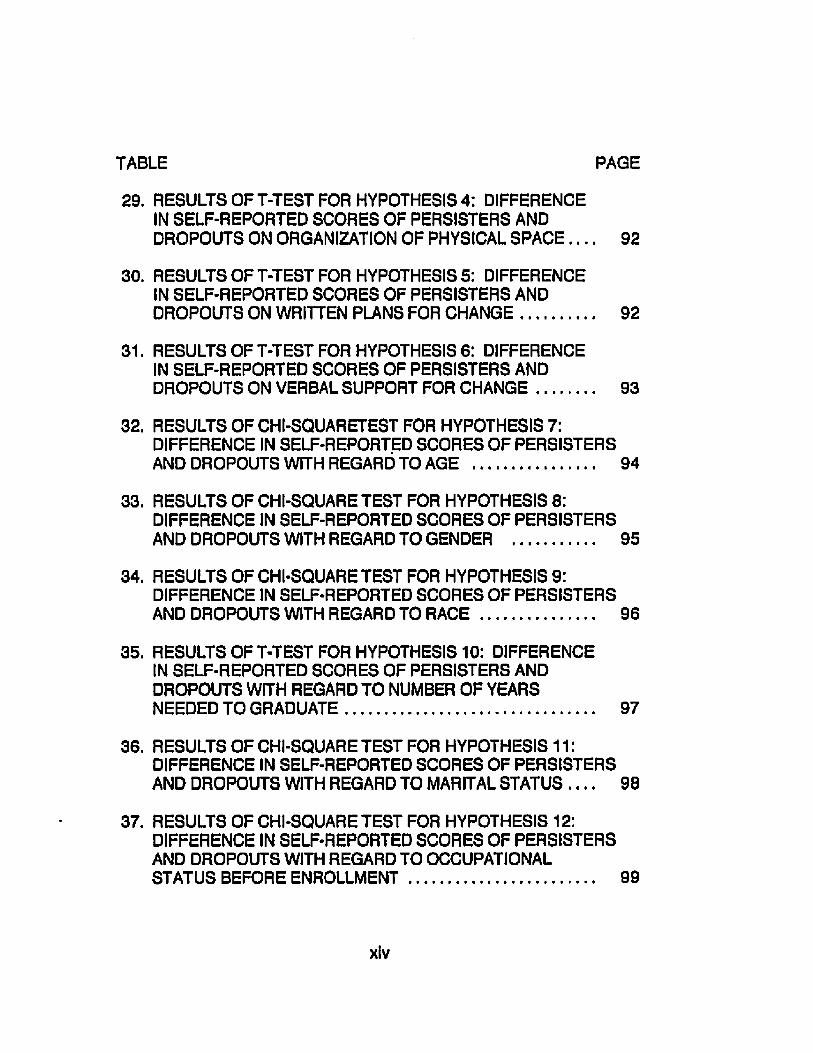
TABLE PAGE
29. RESULTS OF T-TEST FOR HYPOTHESIS 4: DIFFERENCE IN SELF-REPORTED SCORES OF PERSISTERS AND DROPOUTS ON ORGANIZATION OF PHYSICAL SPA CE. . . . 92
30. RESULTS OF T-TEST FOR HYPOTHESIS 5: DIFFERENCE IN SELF-REPORTED SCORES OF PERSISTERS AND DROPOUTS ON WRITTEN PLANS FOR CHANGE.................. 92
31. RESULTS OFT-TEST FOR HYPOTHESIS 6 : DIFFERENCE IN SELF-REPORTED SCORES OF PERSISTERS AND DROPOUTS ON VERBAL SUPPORT FOR CHANGE 93
32. RESULTS OF CHI-SQUARETEST FOR HYPOTHESIS 7: DIFFERENCE IN SELF-REPORTED SCORES OF PERSISTERS AND DROPOUTS WITH REGARD TO AGE .............................. 94
33. RESULTS OF CHI-SQUARE TEST FOR HYPOTHESIS 8 : DIFFERENCE IN SELF-REPORTED SCORES OF PERSISTERS AND DROPOUTS WITH REGARD TO GENDER .................... 95
34. RESULTS OF CHI-SQUARE TEST FOR HYPOTHESIS 9: DIFFERENCE IN SELF-REPORTED SCORES OF PERSISTERS AND DROPOUTS WITH REGARD TO RACE ............................ 96
35. RESULTS OFT-TEST FOR HYPOTHESIS 10: DIFFERENCE IN SELF-REPORTED SCORES OF PERSISTERS AND DROPOUTS WITH REGARD TO NUMBER OF YEARSNEEDED TO GRADUATE.............................................................. 97
36. RESULTS OF CHI-SQUARE TEST FOR HYPOTHESIS 11: DIFFERENCE IN SELF-REPORTED SCORES OF PERSISTERS AND DROPOUTS WITH REGARD TO MARITAL STATUS . . . . 98
37. RESULTS OF CHI-SQUARE TEST FOR HYPOTHESIS 12: DIFFERENCE IN SELF-REPORTED SCORES OF PERSISTERS AND DROPOUTS WITH REGARD TO OCCUPATIONAL STATUS BEFORE ENROLLMENT.............................................. 99

TABLE PAGE
38. RESULTS OF CHI-SQUARE TEST FOR HYPOTHESIS 13: DIFFERENCE IN SELF-REPORTED SCORES OF PERSISTERS AND DROPOUTS WITH REGARD TO ANNUAL PERSONAL INCOME............................................................................................. 101
39. COMPARISON OF MEAN SCORES OF DROPOUTS AND PERSISTERS WITH REGARD TO FACTORS IDENTIFIED AS SUBSCALES AND DEMOGRAPHIC VARIABLES OFTHE LIFE STYLE APPROACHES (LSA) SCALE .................... 103
40. STANDARDIZED DISCRIMINANT FUNCTION COEFFICIENTS AND WILKS* LAMBDA FOR EACH SUBSCALE FACTOR AND DEMOCRAPHIC VARIABLE OF THE LIFE STYLE APPROACHES (LSA) SCALE...................................................... 105
41. PREDICTION OF GROUP CLASSIFICATION BASED ON MEAN SCORES OF THE LIFE STYLE APPROACHES(LSA) SCALE .................................................................................. 106
xv

1
CHAPTER 1
INTRODUCTION
The problem of participation and dropout "have been major
concerns of adult education researchers, policy-makers, and practitioners
who struggle with the problems of recruitment and retention" (Rockhill,
1982, p. 3). Even In the early nineteenth century the dilemmas of
participation, attrition, and attendance in adult education were evident in
Pole's 1816 account a s reported by Bimbaum (1990):
W herever adult schools are opened, the friends of such Institutions
should be fully apprised that It has been found necessary, In order
to keep up a due attendance of the learners, to visit th e m This
we have found a very essential part of our duty; for we should not
only be willing to receive and instruct those who apply for
admission, but endeavor to use every argument In our power to
convince them of the pleasure and important advantage they may
derive from being able to r e a d The ignorant are too
inconsiderate of what is for their own benefit, and if they do not
make the progress they expected, a re liable to sink Into
discouragement; thence it is that they suffer trivial circumstances to
prevent their attendance, (p. 1)

2
Today, dropout from adult education programs continues to be a
problem. In a study by Tracy-Mumford (1990) it w as reported that of a
population of 1,000 enrollees in an adult high school program, 36%
dropped out before completing the first sem ester course despite an
ongoing teacher/coach support system. The U. S. Bureau of the Census
reported in 1991, based on 1989 data, that T ennessee ranks forty*eighth
in the nation with only 65.4% of its population over age 25 having
received a high school diploma.
One of the most difficult tasks program planners have in adult
education is helping adults overcome the forces that deter their
participation. Referring to the dropout issue in adult programs, Bimbaum
(1990) stated that it "becomes particularly critical when considering a
segm ent of the adult population most in need: adult basic education
(ABE) and high school completion (HSC) students” (p. 2). Adults who
enroll In these programs are four times more likely to drop out than those
participants in other adult education programs (Anderson & Darkenwald,
1979).
The dynamics explaining why students stop or continue attending
adult education programs remain uncertain, but there is the contention
that it may be the result of the nature of the adult learner (a part-time

volunteer participant) (Bimbaum, 1990). Adult students, whether enrolled
In ABE or In HSC, frequently have roles other than that of a student. That
role may be a worker, a parent, and/or a spouse. Dropping out from an
adult high school, where the individual is a part-time student, may not
create major role shifts a s it does for the high school or college dropout.
Adults, therefore, have more freedom to choose whether to participate,
not participate, or drop out (Darkenwald, 1981).
When Investigating this problem, one should remember that adults
enrolled in both adult basic education or adult high school programs are
there because they, for one reason or another, have dropped out of
secondary programs before attaining a high school diploma. Many times
a student, upon realization of the mistake, will express a desire to reenter
an educational program, such a s an adult high school, designed to allow
completion of the necessary requirements for earning a high school
diploma. The desire to receive a diploma may be followed by registration
and subsequent enrollment Into such a facility. However, after attending
one or more sessions som e students appear less frequently until they
drop out of th e adult program (Colli, 1987).
Several studies have identified certain factors which tend to deter
adults from completing an adult high school program (Valentine &

4
Darkenwald, 1985; Birnbaum, 1990; and Ehring, 1982), but very few
heeded the Individual differences of the adult high school student. Many
studies have been termed reactional a s they "attempt to find out from the
dropouts them selves their reasons for leaving and/or their criticisms of the
program" (Birnbaum, 1990, p. 51). A major difficulty of this approach is
that It Is "difficult to locate dropouts and/or get responses from them after
the fact" (Birnbaum, p. 50). In addition, Irish (1976) points out that the
reliability and bias of the responses is .often questionable. Bimbaum
(1990) suggests,
Another way of researching this subject entails surveying or
interviewing program graduates to determine what m ade them
successful. Researchers have spent considerable time
questioning dropouts and limited time interviewing achievers.
(p. 112)
Completion of the high school diploma is a prerequisite to entering
postsecondary programs designed to prepare students for the highly
skilled jobs available within this decade. The body of theory in adult
education is in short supply (Darkenwald & Merriam, 1990). Given the
lack of knowledge in the area of adult high school dropout, It would seem
that more research into the problems facing students In adult high school

programs is indicated.
Forty adult high school programs exist today throughout
T ennessee and approximately half of them began after the 1992-93
school year. Enrollment data provided by the T ennessee State
Department of Education showed that a s of the third month attendance
reporting period of the 1993-94 school year there were 2,799 students
enrolled In adult high schools In Tennessee. Program directors of 12
pilot sites surveyed In April, 1993, reported that dropout from their
programs during the 1992-93 school year w as approximately 49%.
Seven other sites not in the pilot project reported dropout rates in 1992-
93 ranging from 18% to 74% with an average rate of 34%.
Statement of the Problem
Thus far there has been little or no research conducted in
T ennessee on the adult high school concept to provide a base on which
to build future programs. Adult high school programs In T ennessee have
grown from fewer than 10 a s of January, 1990, to 40 a s of June, 1994,
with an additional 12 sites In the planning stages for the 1994-95 school
year. The research In this area has lagged far behind implementation of
new programs. There is little knowledge pertaining to the characteristic
life style approaches among Individuals who enroll in adult high school

programs and persist to completion of their goal or cease to attend for
one reason or another. No data existed on characteristics of life style
m anagem ent a s related to persisters and dropouts among adult high
school students in the state of Tennessee.
Purpose of the Study
The purpose of this study was to determine the characteristic life
style approaches most prevalent among persistent enrollees, graduates,
and dropouts of selected adult high school programs in Tennessee.
Hypotheses
For the purposes of this study, the following null hypotheses were
formed:
1. There will be no significant difference between the self-reported
scores of persisters and dropouts on performance focus and efficiency,
Factor 1 of the Life Style Approaches (LSA) Scale.
2. There will be no significant difference in the self-reported scores
of persisters and dropouts on goal dlrectedness, Factor 2 of the Life Style
Approaches (LSA) Scale.
3. There will be no significant difference in the self-reported scores
of persisters and dropouts on timeliness of task accomplishment, Factor 3
of the Life Style Approaches (LSA) Scale.

7
4. There will be no significant difference in the self-reported scores
of persisters and dropouts on organization of physical space, Factor 4 of §
the Life Style Approaches (LSA) Scale.
5. There will be no significant difference in the self-reported scores
of persisters and dropouts on written plans for change, Factor 5 of the Life
Style Approaches (LSA) Scale.
6 . There will be no significant difference in the self-reported scores
of persisters and dropouts on perceived verbal support for self
management, Factor 6 of the Life Style Approaches (LSA) Scale.
7. There will be no significant difference between persisters and
dropouts with regard to age.
8 . There will be no significant difference between persisters and
dropouts with regard to gender.
9. There will be no significant difference between persisters and
dropouts with regard to race.
10. There will be no significant difference between persisters and
dropouts with regard to number of years needed to graduate.
11. There will be no significant difference between persisters and
dropouts with regard to marital status.

8
12. There will be no significant difference between persisters and
dropouts with regard to occupational status before enrollment In adult
high school.
13. There will be no significant difference between persisters and
dropouts with regard to annual personal income in the year preceding
enrollment in the adult high school.
14. There Is no significant difference between the independent
variable scores for performance focus and efficiency, goal directed ness,
timeliness of task accomplishment, organization of physical space, written
plans for change, verbal support for self-management, age, gender, race,
number of years needed to graduate, marital status, occupational status,
annual income, and persistence.
Significance of the Problem
An overwhelming majority of Americans (61%) believe that only
through better education will the country find a way to turn around
American productivity over the long haul (Harris, 1989). Industry finds
itself grappling with an expanding marketplace and growing dem and for
expedient delivery of an ever-increasingly sophisticated product. A
growing number of businesses are facing a severe shortage of skilled
workers (Dole, 1990), and many workers in their employ frequently do not

9
have the necessary basic skills to meet the expectations of the job they
presently hold (Martin, 1990). As increased pressures from the public,
business, and industry mount on federal, state, and local governments
there has developed a need for implementation of new programs of study
geared toward high school completion so that adults may pursue
postsecondary training designed to upgrade their skills. Before
procedures can be Implemented to facilitate persistence to complete such
programs, the reasons for persistence must be studied, documented, and
communicated to all parties involved In educating these vast numbers of
Americans.
Limitations of the Study
The scope of this study was limited to adults aged 18 and older
who enrolled in 12 adult high schools In T ennessee In the 1992-93
school year and who had maintained enrollment, dropped out, or
graduated a s of August, 1994.
Assumptions
1. The respondents will be capable of honestly expressing their
perception of their life style approach.
2. The respondents' perceptions will be accurate indications of
their actual life style approach.

10
Definitions of Terms
The following definitions apply to this study;
Adult Hfah School * The adult high school Is designed for persons at
least 18 years of age who are not currently enrolled In a regular school
program. After demonstrating proficiency In the required courses,
students earn credits based upon Carnegie units and receive a regular
high school diploma--not a General Equivalency Diploma (GED)
(McCullough, 1993).
Adult Basic Education - A GED program which prepares students to take
the GED test for a state-issued high school diploma (Bimbaum, 1990).
Demographics - Background facts about the student, including age, sex,
race, marital status, last grade attended in school, and occupational
status (Birnbaum, 1990).
Dropout - A student who enrolled in an adult high school program during
the 1992-93 school year, attended classes, dropped out by the end of the
school term, and did not return.
Life Stvle Approaches (LSA) - A self-report scale of self m anagem ent
processes containing 22 Items subdivided into: performance focus and
efficiency, goal dlrectedness, timeliness of task accomplishment,

11
organization of physical space, written plans for change, and verbal
support for self managem ent (Moore, 1991).
Motivators - The reasons for being enrolled In an adult high school cited
a s important by the student (Bimbaum, 1990).
Perslster - A student who enrolled in an adult high school during the
1992-93 school year and maintained enrollment or graduated as of
August 1994.
Self-efflcacv - People's judgments about their capabilities to execute
particular courses of action (Mager, 1992).
Self-manaaement - A set of techniques for directing one 's efforts to
accomplish certain goats, by using both external and internal support, but
the application of that support is directed by the self m anager (Moore,
1991).
Situational Circumstances - The problems which might hinder a student's
attendance, such a s work schedules, family obligations, health problems,
availability of child care, and family/peer support systems.
Procedures
The following procedures were executed:
1. A review of research and literature w as conducted through
ERIC.

12
2 . Experts on the subject ot adult high schools In T ennessee were
consulted or Interviewed.
3. Directors of beginning adult high school pilot sites in T ennessee
were consulted.
4. A survey questionnaire pertinent to this study was selected.
5. Twenty-three adult high school site directors were contacted to
obtain nam es and addresses of students presently enrolled In their
school, students who had dropped out, and students who had graduated.
6. Data from surveys of graduates and dropouts were compiled to
find if significant differences existed between the two groups.
7. Conclusions and recommendations w ere m ade using
Information gathered in the survey and data analysis.
Organization of the Study
Chapter 1 contains an introduction to the study, the statem ent of
the problem, the purpose of the study, the hypotheses, the significance of
the problem, the limitations, the assumptions, the definition of terms, the
procedures, and the overview of the study. Chapter 2 contains a review
of related literature. Chapter 3 includes the methodology and procedures
used in the study and a description of the programs which were studied.

Chapter 4 contains the results of the study. Chapter 5 contains a
summary of the findings, conclusions, and recommendations.

CHAPTER 2
REVIEW OF RELATED LITERATURE
A review of related literature was conducted to Identify relevant
literature essential to this study. The first component of the literature
review addresses the early attempts by researchers to investigate the
concept of participation of adults in programs of education for those who
had previously dropped out of the system. The second part of the review
provides examination of motivational orientations research,
sociodemographic components, and thirdly, literature dealing with
deterrents to participation In programs to educate adults. The last
section provides a glimpse of future projections of a life-long continuous
learning process. A summary is provided which attempts to tie together
all of the pivotal components related to participation and persistence In
ABE and AHS programs. The inclusion of related literature In ABE and
programs of adult literacy serves to broaden the base of knowledge from
which generalizations may be m ade since the populations served by
these programs are similar in nature.
E a r l v E f f o r t s
The.review of literature revealed several interesting factors which
may play a role in nonpersistence in adult programs. This material is

reported In chronological order a s nearly a s possible to reflect the
thinking of the very earliest authorities on the subject, with a
concentration of literature from 1961 to the present era. Many of the
studies encountered in the latest time frame are related to
nonparticipation or deterrents to participation in adult-related educational
programs. Boshier and Collins (1985) reported that many of the studies
around that time period referred in som e way to the work done by C. O.
Houle, who had proposed that adult learners could be classified into one
of three typologies: goal-oriented, learning-oriented, or activity-oriented.
His tripartite typology created considerable interest in the adult education
community, and his works were cited significantly more often by authors
between 1968 and 1977 than most other works in adult education
literature. Houle audiotaped interviews with 22 continuing education
participants in the Chicago area and subsequently classified them into
the groups identified earlier, the goal-oriented learners used education
a s a m eans of accomplishing clear cut objectives; the activity-oriented
learners found meaning in the activity itself; and the learning-oriented
sought knowledge for its own sake (Boshier & Collins, 1985). Cross
(1981), reporting a 1967 conclusion by Miller, stated that the reasons for
the types of programs in which adults participate may be related to their

16
socioeconomic status. Based on Maslow’s hierarchy, those in lower
socioeconomic c lasses may choose programs which m eet their survival
needs while those in the upper socioeconomic standards may choose
programs which lead to self-realization.
When considering programs which lead to self-realization, the
literature must include information on an institution which revolutionized
American adult education--both religious and secular. It was called
"Chautauqua," founded by John Heyl Vincent and Lewis Miller In 1874
(Schurr, 1992). Although the adult students In this early educational
institution were primarily from the upper socioeconomic c lass who were
seeking not only an education but also self-realization, the problem of
retention w as common with that group. Vincent, in 1891, reported that of
the 180,000 students who had enrolled, only about 12% completed the
full course, the problem of dropouts in adult education has been
historical, even In the group seeking the realm of self-realization (Schurr
1992). However, life w as different for students of Chautauqua. As
pointed out by Mary Lee Morgan, the coordinator of the Daytona Beach
Community College District Literacy Center, when she stressed that there
w as a time in history when being able to read and write was a point of
personal pride, but In today’s world it is an element of survival. Therefore,

17
in Florida where 1 of 3 adults are illiterate, to combat the problem which
h as becom e of epidemic proportions, noninstructional literacy centers
have been established for the identification of potential students,
recruitment, and counseling so that history will not continue to repeat
itself (Morgan, 1989).
As early a s 1926, Undeman, father of adult education, wrote about
the high dropout rate. He said that such failure constitutes an
“indictment"--not against intelligence, but rather against the formalism ol
our educational system (Undeman, 1989). He also pointed out the
impossibility of building wholesome societies "out of partially starved
personalities" (p. 36). He said that adult learners need not be starved
when they can participate in learning where teachers create an
environment that invites, encourages, and helps alt students to overcome
the barrier of a poor self-concept. In Undem an's words, "Self is relative to
other selves and to the Inclusive environment" (Undeman, p. 50).
The writings of the American pragmatic philosopher and social
psychologist George Herbert Mead (Kazemek, 1988) have great
relevance for those interested in literacy education or the general
education of adult learners who have not completed high school. M ead’s
concept of the individual and self has pertinent social implications which

18
should be considered by teachers of adults, programmers, and
administrators who help plan programs.
M ead's work has had a profound influence on scholars and
practitioners in such fields a s philosophy, sociology, and psychology
during the past five decades. However, only during the present decade
have these ideas become relevant for education in general and for adult
education in particular because during this decade we have becom e
more aware of the impact of self-concept on the total learning process
(Kazemek, 1988).
Another Important historical figure in the adult education
movement w as Myles Horton (1905 • 1990). Gary J, Conti (1990), In
Adult Literacy and Basic Education said that Horton's autobiography,
entitled The Long Haul fHorton. Kohl, & Kohl, 1990), provided the best
insights into his educational philosophy, commitment to democracy,
concern for people, and humor. In The Long Haul. Horton said,
Education Is what happens to the other person, not what com es out
of the mouth of the educator. You have to posit trust In the learner
In spite of the fact that the people you're dealing with may not, on
the surface, seem to merit the trust. If you believe In democracy,
which I do, you have to believe that people have the capacity

19
within them selves to develop the ability to govern themselves.
You've got to believe In that potential, and to work a s If It were true
in the situation. (Horton, et. al„ 1990, p. 131),
He continued by stating that with this trust In the Individual, "you have to
start where people are, because their growth Is going to be from there,
not from som e abstraction of where you or som eone else is. People are
not abstract" (p. 131).
Horton surely was speaking to the whole concept of the
importance of the element of self-efficacy a s described by Mager and
Bandura. Mager (1992) stated that self-efficacy refers to people's
judgments about their capabilities to execute particular courses of action.
More specifically, he said it "refers to people's beliefs about their ability to
influence the events that affect their lives" (p. 32). Bandura (1977 &1982)
suggested that raising an adult's level of skill through training without
regard to increasing self-efficacy levels will lead to deficient or absent
performance. Bandura further stated,
Judgm ents of self-efficacy also determine how much effort people
will expend and how long they will persist in the face of obstacles
or aversive experiences those who have a strong sen se of
efficacy exert greater effort to master the challenges. (1982, p. 123)
20
So strong is the perceived efficacy in individuals, it will influence their
performance even when incentives are offered, Kirsch (1982) reported
that the success of incentives to produce altered efficacy ratings w as tied
to the level of anticipated anxiety in subjects, consequently it may be said
that self-efficacy is linked to a person's anticipated level of anxiety about
perseverance in spite of perceived obstacles. Bandura (1977) supported
this notion by offering the following advice for educators:
Persistence in activities that are subjectively threatening but in fact
relatively safe produces, through experiences of mastery, further
enhancem ent of self-efficacy and corresponding reductions in
defensive behavior, (p. 191)
Self-efficacy may be considered an important factor In one 's motivation to
enter programs for self-improvement and continue to pursue a program
until a task is accomplished.
Motivational Orientation Literature
Cross (1981) sta tes that Houle's typology study "remains the single
most influential motivational study today” (p. 89). According to Scanlan
and Darkenwald (1984), most of the research dealing with participation in
adult education”h as strongly emphasized identifying learner 'types',
motives, or 'motivational orientations'” (p. 155) which have not proven

21
useful In distinguishing participants from nonpartlcipants. However,
Boshier and Collins (1985) disagreed with Scanlan and Darkenwald
when they stated that “Indeed, the interest In the functions of motivational
orientations appear to be accelerating, not diminishing” (Boshier &
Collins, p. 127).
In 1982, Darkenwald and Merriam wrote a book entitled, Adult
Education: Foundations of Practice, which emphasized that adult
education must be more than academics. They stressed that In order to
motivate the adult learner there must be more concern with helping them
to live more successfully in general, helping them to increase their
com petencies in their social roles, helping them to gain fulfillment in their
personal lives, and assisting them In solving personal and community
problems (p. 7).
G eorge's (1979) and Brockett's (1985) works are in direct
agreem ent with Darkenwald and Merriam's 1962 em phasis on the
importance of personal fulfillment. George said, “life satisfaction is
essentially a cognitive assessm ent of one 's progress toward desired
goals (p. 210), and without this assessm ent the adult learner in most
c a se s will not be motivated because they will not be striving for a goal.
Brockett agreed by pointing out that life satisfaction and self*directed

22
learning readiness share an em phasis on independence. Individuals
who are able to take charge and remain in control of their lives are more
motivated to meet personal needs a s they arise than are those who view
them selves a s having to be dependent upon others.
If the above is true, then counseling adult learners is just a s
important a s teaching, according to Peggy Davis (1989). She maintains
that adult learners share two characteristics: a fear of tests and a lack of
self-confidence. She stresses the Importance of talking to students In an
effort to build self-confidence. She says that constant praise, If nothing
e lse but for the courage to be involved with adult education, Is crucial.
She goes on to em phasize that encouragement must be built into each
segm ent of learning, helping them to understand that they are not starting
over but are simply building on what they already know. Patience is of
prime importance. Davis continues by pointing out that if adult learners
are going to be motivated to want to continue, building a relationship a s a
friend must take the place of a teacher-student relationship. She says that
helping them to view the total situation with a positive attitude must be a
never-ending effort.
Fairgrieve and Jimmerson's (1988) work is consistent with what
Davis has said. They surveyed 200 ABE instructors in Washington state

concerning their perceptions of counseling in their programs. It w as
determined from the results of the survey that instructors generally
believe that their counseling abilities were very inferior to their teaching
abilities. Part time instructors did much less counseling than did those
employed full time. Although instructors were genuinely interested in and
committed to their students and felt that counseling was crucial a s a tool
of motivation, they stilt felt that counseling needs were not being met.
Findings suggest that: specially trained ABE counselors should be
available, appropriate inservice training in counseling skills should be
available, and more full time instructors should be hired for ABE
programs.
Kozol (1980) agreed with Fairgrieve and Jimmerson concerning
the need for counseling for adult learners if they are going to be
successfully motivated to learn. In the book Prisoners of Silence, it was
pointed out that illiterate adults are confronted with a multitude of
personal and social difficulties. Fear of discovery, anxiety, and
humiliation a re just a few. These have often caused them to develop a
life style of deception and evasion with an effort to "lie low” and “watch for
traps” (Kozot, p. 8).
Belz (1984) maintained that in order to motivate adult learners to

24
progress and not drop out programs must be designed to be one-to-one
in format in order to be effective, because this approach can be tailored to
m eet the individual needs of the adult student (p. 97).
Learning environment, teaching styles, and learning styles are
important factors when attempting to assemble material on effective
motivation of adult learners. George Spear and Donald Mocker (1984)
have put together a wealth of Information on these subjects, drawing from
other experts in the a rea of adult education. They did a qualitative
analysis on the results of a survey from 78 self-directed learners with less
than high school completion who were engaged in a learning project.
The survey had originally been administered to 158 persons.
S pear and Mocker's (1984) interview format was open ended and
probing, and the survey was administered in Washington, D. C.; Miami,
Florida; Chicago, Illinois; Kansas City, Missouri; and San Diego,
California. Their study w as built upon the 1971 work of Allen Tough and
the 1981 work of Patricia Cross. Fascination with adult self-directed
learning w as se t in motion by Allen Tough in 1971. In summarizing a
decade of research by Tough and Cross, Spear and Mocker noted the
narrow scope of knowledge about self-directed learning a s a method of
motivating adult learners. In her book, Adults a s Learners. Cross pointed

25
out that, in spite of much research, we still know little about what actually
happens during the course of an'adult learning project. However, she
does offer a chain of response (COR) model which encom passes several
major theoretical perspectives of motivation of adult learners.
Spear and Mocker (1984) referred to the research of Kurt Lewin,
who has heavily impacted the field of adult education, particularly in the
a reas of motivation and group dynamics. Lewin referred to a "field" or
"life space" of an individual in order to better understand behavior. He
believed that the social, psychological, and physical elements,
interdependently and a s perceived by that person, accounted for their
action, change, or locomotion. Lewin's work is often cited a s
undergirding contemporary theories of motivation that attempt to identify
the propelling forces that prompt human beings into action.
Peggy Davis (1989) stressed that a teacher’s body language and
attitude can be a significant motivational force, or the opposite. She
suggested the use of a bulletin board of "positives" than can have an
impact, or an inspiring poem, or news clippings about successful adult
learners. She went on to suggest a personal "confidence booklet" for
each student a s an ever present, inexpensive, and simply constructed
motivational tool. Notes of praise from the teacher in this booklet are

26
worth more than money. However, she continued by pointing out that
locating a sponsor or "adopter" for each student, som eone else or morei
than one, to show that they care for the student, would magnify teacher
attempts at motivation. Checklists for progress are good indicators of
accomplishment. Computer records of mastery and error level are less
threatening In many cases, according to Davis, than is an instructor.
Allowing students to participate in writing exercises to express their
feelings gives them an opportunity to express their fears. Encouraging
students to keep a journal would provide a regular opportunity to do this.
Encouraging students to read confidence building material such a s
Guideposts Magazine and books by Norman Vincent Peale or Robert
Schuller are easy motivational materials to be read regularly. Davis
(1989) stressed that it would be impossible to overemphasize the
importance of building self-confidence in adult learners.
In a book by Michael Collins (1987) entitled Competence in Adult
Education, a caution is presented that a heavy em phasis on Individual,
learner cen tem ess in adult education does not address the need for
dealing with social values and social interactions. He even argued that
planners and instructors should enter the teaching-learning situation with
tentative plans which could easily be changed based upon the situation,

27
Interests, and needs of the participants. He stressed that without this
consideration, motivation is dead and dropout rates will continue to climb
In adult education.
A study by Conti in 1990 also provided Insight about teaching-
learning styles in adult education a s it related to motivation and
achievement. The major finding of this study w as that there was a
relationship between teaching style in the adult education setting and
student achievement. The study indicated that GED students learned,
more in a structured, teacher-centered environment where the primary
goal w as to pass the GED. However, a different approach seem s to be
more appropriate in the basic level and in English as a second language
(ESL) settings where the goal Is to improve skills in reading, math, and
English proficiency. Because of the deficiencies, this is a long term
process. In addition, the acquisition of skills cannot be the primary
concern, but rather that of raising the adult learner's self-concept since
this influences both the way people see them selves and the way they
perceive others seeing them. A positive relationship with the teacher is
critical a s they develop not only academic skills but also interpersonal
skills.
Besides providing learning experiences to improve com petencies

28
In reading, writing, and math for 83 participants between the a g es of 14
and 21, the Job Training Partnership Act (JTPA) program included a new
focus. The new focus was on cooperative living since the students spent
three weeks on the cam pus of Midwestern University. To evaluate the
JTPA program, attitude assessm ent was equally a s important a s
academic gain. At the conclusion of the program, the attitude of most of
the participants was considered to be positive, although most had
dem onstrated suspicion and lack of trust at the beginning (Thistlethwaite,
1989).
At the conclusion of the JTPA program, the participants had begun
to believe In them selves a s indicated In expressed interests In continuing
into higher levels of adult literacy or GED programs. Another observation
was that participants had learned that they could learn from each other,
moving from inarticulate silence to vocal, thoughtful, and perceptive
expressions of their own ideas (Thistlethwaite, 1989). Although
organization and record keeping of adult teaming programs must bet
highly Individualized and tailor m ade to ensure that individual needs are
being met, the consensus of the literature has been that em phasis must
be placed on social interaction among the adult learners, especially in
small groups.

As reported by Kazemek (1988), Mead maintained that the human
being is primarily a social being. Therefore, he contended, individual
experiences, thoughts, and language must be built around social
experiences: they work from the “outside" to the "inside" and not vice
versa. When considering Mead's concept of the social nature of human
beings, adult education instruction would shift from one-on-one to small
groups of adults working in a collaborative manner. Such small circles
would stress reciprocity and mutuality among instructors and students.
The element of caring would be crucial.
In Kozol’s (1980) book Illiterate America, he agreed with M ead’s
model a s he maintained throughout the book that adult learners must be
involved in a collective process of shared knowledge rather than always
functioning In a situation of one-on-one learning. Kozol stated in that
book that he was "convinced that groups of six or seven learners and one
instructor represent an ideal unit of Instruction" (p. 108).
No collection of literature concerning motivation of the adult
learner could be complete without the inclusion of information on the
computer a s a trusted friend and companion in the 1990s. More and
more multimedia innovations are being used to assist the growing
number of adults who are struggling with the most basic educational

skills. For example, inmates at Rikers Island Prison In New York City
recently began using a multimedia computer to learn how to read
(Zimmer, 1993). The director of the program, Beverly Hemmings, had
studied the Impact of technology on minority education while she w as a
graduate student and had come to recognize its potential usefulness in
fighting the plague of adult illiteracy. She pointed out that because
teaching an adult to read is often harder than teaching a child, it can be a
source of humiliation for the student and frustration for the teacher.
However, a computer doesn't humiliate and is never frustrated; therefore,
it can be an excellent tool of motivation as it teaches. In 1993, Hemmings
ran a demonstration project for 60 people using the computer at her
Street Literacy Clinic in Harlem, New York. No one dropped out, and
many enrolled in basic literacy courses afterward. Hemmings
commented, "The machine never ge ts tired, and it doesn't make
judgments on you" (Zimmer, p. 36).
John DeWitt is currently director of grants and research for the
school district of Escambia County in Pensacola, Florida. A sophisticated
computer w as installed in that school district a few years ago to facilitate
computer assisted instruction. Results have shown substantial gains in
reading and math for at-risk students (DeWitt, 1989).

Of the 300 highest risk regular students, only 4 dropped out. The
significance of this information for this collection of literature is that similar
results were reported for adult students. The retention rate for adult
students has been significantly higher, and the number of adults in the
program has doubled in the last year, with a reporting of increased
attendance and increased completion. The system provides adult literacy
courses from Grade 0 through all four levels of the GED. However, the
writer stressed that maintaining motivation of students must be a prime
concern of instructors in order to ensure future success (DeWitt, 1989).
From a review of the literature concerning the computer in ABE
and GED classrooms, one clear inference Is noted and that is that
computer assisted instruction (CAI) is no panacea in the ABE and GED
settings (Rachal, 1985). Although many authors indicate that CAI can be
extremely effective, their review of the literature points out that a number
of factors must be considered: cost, the hardware syndrome, and
administrative and staff commitment. The most encouraging aspects of
CAI might com e under the headings of Individualization, positive
reinforcement, and instructional gains (Rachal, 1985).
Dlllion and Kincade (1990) offered the sam e caution a s w as given
by Rachal. They reminded the reader that the scope of the literacy

32
problem, combined with the special needs of today's adult basic
education students, required new approaches to old problems. However,
they stressed that technology could not be viewed a s a panacea, but it
could provide a segm ent of the interaction necessary for individualization.
In David Harman's book Illiteracy: A National Dilemma (1987), his
most salient point is that effective literacy efforts need "a very carefully
planned, long term, and sustained instructional effort focused on groups
of people in their communities of affiliation and based on constant
analysis of their circumstances, needs, and motivations” (p. 104). Of
course, these points are the backbone of any successful adult education
program, and they are consistent with any carefully planned program of
networking or any other organizational plan where people are trying to
help other people.
Networking is a term that has become rather common in the last
few years. Several authors have called for networking a s an
interconnecting system for the enhancem ent of the education of adults
who have not been successfully educated in our traditional systems.
Such networking can offer opportunities which would influence support,
provide communication, share information, and generate funding for adult
education. Although caution would have to be taken, it seem s that the

33
time has arrived for serious attention to be put on networking for the basic
educational experiences of adult learners (Richardson, 1988).
Networking is built on the principle that no man Is an island. It
refers to the interconnections that can be created among the many
organizations which declare a serious interest in helping uneducated
adults to becom e educated and productive citizens. Kozol (1985) pointed
out that the networking approach seem s to be an obvious solution to
bringing together people who are working to try to achieve the sam e goal.
Contrary to an earlier position which he had taken, Kozol in 1985
encouraged the coalition of all interested parties from educators,
business, government, and community members in general for the
purpose of providing guidance, support, and motivation to adult learners.
Morgan (1989) agreed with the concept of networking such groups a s
business, industry, and other organizations to help provide funding for
adult literacy endeavors.
One specific project shows how educators In a program of adult
education, through collaborative efforts, can promote literacy with special
objectives of reaching at-risk populations. This one year demonstration
project in New England City (Bridgeport, Connecticut) via a major
collaborative effort involving black churches, described a delivery of

effective adult literacy education. The project w as named Literacy
improvement Needs Collaboration (LINC) and used the Literacy
Volunteers of America program a s a model for tutor and student training
(Lakes & Lewis, 1990). Unlike other adult education systems, this project
incorporated mem bers of the community a s tutors and assistants in the
delivery of the literacy se rv ices. The churchgoers were perceived a s a
surrogate family, providing personal support, familiar surroundings,
encouragem ents, and assistance to learners by establishing a social
network.
Influence and visible support from among church related
organizations and other social organizations, a s well a s viable ministerial
guidance and neighborhood leadership was demonstrated. This
leadership is desperately needed in ghetto a reas In order to ameliorate a
host of serious social problems including illiteracy, unemployment, crime,
school dropout, Inadequate housing, teen pregnancy, and drug abuse.
The steering committee functioned a s an advisory board and was
com posed of 20 members which represented literacy providers,
community members, social service agency staff members, and ministers.
The committee worked at recruitment, program effectiveness, and
troubleshooting to monitor services and to facilitate outreach efforts. Key

35
players w ere church liaisons who Identified lay volunteers and tutors
(Lakes & Lewis, 1990).
It Is apparent from the Information presented in this section on
motivation of adult learners that, in addition to understanding learning
strategies, instructors of ABE students must be able to a sse ss the clients’
psychological attitudes. A profile of motivation, self-esteem, and
response styles, as well a s the clients' perceptions of teacher-leam er
relationships, must be analyzed (Belz, 1984).
The primary objective of the process referred to a s educational
therapy Is to help the client to unload all of the psychological burdens in
order to becom e free to learn. Before that freedom Is experienced, the
adult learner has been shackled by the bonds of Insecurity, inadequacy,
and the fear of failure. The self-perception that Is held Is one of low self
esteem and the feeling of incompetence. By leading the client through
the process of educational therapy, the client can become free of the
prohibitive Inhibitions, displaying more Initiative and self-control (Belz,
1984). Belz, quoting Jonathan Edwards, wrote,
The plain and obvious meaning of the words freedom and
liberty. In common speech, Is power, opportunity, or advantage that
anyone has to do a s he pleases. Or, In other words, his being free

from hindrance or impediment in the way of doing, or conducting in
any respect, a s he wills. . . . To be free is the property of an agent,
who is possessed of powers and faculties, a s much a s to be
cunning, valiant, bountiful, or zealous. But these qualities are the
properties of men or persons and not the properties of properties.
There are two things which are contrary to this which Is called
liberty In common speech. One Is constraint: the sam e Is otherwise
called force, compassion, and coaction; which Is a person’s being
necessitated to do a thing contrary to his will. The other Is restraint:
which Is his being hindered, and not having power to do according
to his will. But that which has no will cannot be the subject of these
things.
The above points out that liberty may be both constrained and
restrained, with constraint meaning that a person's powers, opportunities,
or advantages to do what Is desired possible bundled, tied, or drawn so
tightly together a s to have the special compression called force,
compulsion, and coercion. While, on the other hand, liberty may be
restrained a s well, causing one’s powers, opportunities, o r advantages to
be bound fast or to be confined. T h e restraint of freedom Is the hindering
of a person's powers, opportunities, or advantages to do a s one needs or

37
wishes to do. The etymological source of both notions acts a s an
astringent on the body” (Strange, 1986, p. 123).
Adult education has the potential to be a rigorous human science
with the power to enrich and transform human destiny If it addresses
constraints and restraints of liberty (Strange, 1986). Freedom to learn Is
the ultimate source of motivation.
Deterrents to,Participation in Adult Education
For a period of time since 1984, other avenues of inquiry began,
focusing on deterrents to participation rather than motivational
orientations. Scanlan and Darkenwald (1984) stated that painfully few
studies had given attention to what factors deter participation. As early a s
1975, in a book called Last Gamble on Education. Darkenwald and Knox
(as reported by Belz, 1984) noted that budgetary and time constraints left
many teachers and counselors unable to become Involved In their
students' personal problems, although literature in the previous section
had clearly pointed out that these problems must be addressed if we a re
to avoid the bitter cycle of educational failure and dropout.
It h as also been previously noted that the notion of self-concept
development In ABE programs can be the primary m eans of Increasing
retention of students. Teachers must be trained to Identify the special

38
needs of adult learners, most of whom have poor self-concepts which
prove to be the major deterrent to success and completion of the
program. Skills must be developed in teachers in order to implement a
proposed plan of promoting positive self-esteem in adult students. An
improved self-concept has been shown in reported studies to significantly
Improve learning. It Is probable that training teachers for this task can
provide a better education for students, improve teacher satisfaction, and
decrease attrition rates (Criner, 1990)-.
Students with low self-esteem usually perceive them selves a s
failures and have not learned to trust anyone connected in any way with
the society that they feel rejected them (Criner, 1990). Martin (1983)
pointed out that helping students persist might be a s simple a s
encouraging them to “se e them selves a s able, capable learners” (p. 91).
Poor self-concepts of adults In ABE and AHS classes seem to
directly affect and inhibit their willingness to persist and complete their
academ ic programs. Therefore, programmers must include self-concept
development methods In teacher training In order for teachers to be able
to help students improve their self-esteem, thus Improving achievement
(Criner, 1990).
Finger (1990) agreed with this assessm ent by saying that adults

39
who face a modem, uncertain, and sometimes frightening society must be
provided with personal skills development with the goal of improved self- »
concept to help them raise their level of self-confidence. He concluded
by slating “if adult education follows the sam e paths a s traditional
education, It will end up, like modernity, In crisis too" (p. 15).
As has already been reported, research on dropouts seeks to
identify the differentiating characteristics of dropouts or perslsters in order
to better match the learning needs of students with environments and
experiences of educational programs (Martin, 1990). Martin stressed that
students at risk of dropping out appeared to require a concerted effort to
increase their academic and social Integration, clarification of targeted
goals, and increased commitment to the program. At-risk students can be
placed in cooperative learning groups and other methods of instruction or
approaches which simultaneously increase both academ ics and social
skills. He noted that counseling services should be provided and that
teachers and counselors should m ake more effort to spend more time
talking to individual students about their needs, interests, and goals.
Kazemek (1988) pointed out the fact that the attrition rate among
instructors and volunteer tutors who worked with adult learners w as
legendary and scandalous, stating that there were a variety of reasons

40
that they fall to be successful with their students. Perhaps a very
Important reason for this frustrating failure is that the Instructors don't
perceive the students a s complex human beings who display varying
levels of competency in various situations.
Even the assessm ent instruments used with adult learners can be
Intimidating because they focus on w eaknesses rather than on strengths,
depowering the learner rather than empowering them (Kazemek, 1988).
Quite often the materials and methods used with adult students are based
upon controlled texts and tightly sequenced skills approaches which can
m ake reading more difficult and is similar to the material which caused
the adult to fail In the past. These materials and activities do not provide
opportunities for social interaction or for examining and reconstructing the
self and the inner problems. Such activities a s poetry reading, role
playing, and the use of photographs and illustrations would generate
discussion and promote oral and written language development. Mead,
a s reported by Kazemek, stressed that learning experiences for adults
must be centered upon helping them to become from within.
Although an increasing number of adults throughout the country
are attending basic literacy classes, too many of them are not completing
their program. Too many are having to be labeled dropouts, with attrition

41
rates becoming a serious matter of concern and discussion. In fact, In
adult literacy programs an attrition rate of 40% to 60% Is average (Bean,
Partanen, Wright, & Aaron son, 1989). Because of this problem, they
conducted a study to investigate the reasons students had dropped out,
with implications for program improvement and student retention
strategies.
Although It Is difficult to research dropouts because of geographic
instability, studies have been conducted which indicated that the primary
reasons for dropping out were discouragement with their lack of progress
and conflicts with work schedules. Situational reasons were more
frequently given than Instructional ones. On the other hand, key factors
which fostered retention In the program were family support, perceived
progress, heightened self-esteem, and a good teacher. Both program
and person factors interrelate to impact a student's motivation to continue
the program (Bean, et. al., 1989).
When asked to make suggestions a s to what would have kept*
them In the program, 15% of the responses related to the need to be
working on a specific self-designed goal. Of the dropouts reached, 40%
indicated that they planned to reenter a program when life circumstances
allow it. The personal reasons for dropping out most often were: needing

42
to earn a living, caring for a sick relative, or dealing with personal health
problems (Bean, et. al., 1989). The findings of this study suggest a need
for literacy programs to provide special training for tutors In order for them
to be better prepared to address the special social, emotional, and
educational needs of those students who have not been successful In
traditional school. Tutors also need additional emotional support training
which would enable them to cope with what is potentially an emotionally
draining experience. This special support might he a positive Impact on
the retention of tutors.
Regular evaluation of tutor-student relationship seem s to be
desirable. Much attention should be given to the establishment or
change in tutor-student matches in order for problems in this area not to
becom e a major deterrent. Students should receive special assistance
with the Identification of goals, with the appropriate materials being
matched with the appropriate student goals. Scheduling must be llexible
enough to accommodate changing work schedules of students.
Even after students have had to leave the program, contact should
remain with regular communication in an effort to offer encouragem ent to
the students, with the hope that they would return to the program. Other
agencies, organizations, and volunteers might be enlisted In order to be

43
able to have the time required to keep communication open with
dropouts. Such follow up procedure should be routine to better serve the
needs of students who have dropped out. Those involved with programs
which attempt to educate adults must continue to search for ways to
recapture the Initial enthusiasm and interest of the students who
desperately need the services (Bean, et. al., 1989).
The them e which runs throughout Cowbum's book Ideology and
Community Education (1986), emphasizes the fact that most effective
adult education programs succeed In attracting and keeping students for
Ideological and social reasons rather than strictly academics, but are
often hampered because of being labeled a s frivolous or unprofessional.
Many times this is the case because the program emphasized the social
angle at the apparent expense of traditional book work (Cowbum, 1986).
Future Projections
Knowles (1989) went a step beyond the age of technology when
he projected what might be expected In the twenty-first century education
of adults and other learners. In his book, The Making of an Adult
Educator, he referred to a future concept which he called a Lifelong
Learning Resource System (LLRS) (p. 132). In this system, education a s
we know it would no longer exist. The total environment would becom e

44
the classroom, with self-directed learning taking place regardless of age
(p. 133). There would be no teachers; but, rather, educationali
diagnosticians, educational planning consultants, and resource people,
in addition to administrators, information processors, and coordinators (p.
136).
Perhaps the most important projection presented by Knowles w as
that people would becom e obsdescent-psychologlcally, socially, and
vocationally-unless they engage in the process of continuous learning.
Workers will have to retrain continuously in order to get and keep a Job
because the new skills they will acquire wilt quickly becom e obsolete
(Knowles, p. 147). The twenty-first century education, a s described by
Knowles a s a Lifelong Learning Resource System, would be a
consortium of all of the following learning resources in the community.
Institutions; specialized educational institutions, religious institutions, health and social service agencies, governmental agencies, museums, and librariesVoluntary organizations: labor unions, consum er and producer cooperatives, civic and fraternal societies, agricultural organizations, youth organizations, political organizations, and professional societiesEconomic enterprises; business and industrial firms, farms, markets, and trade associations The mediaEpisodic events: fairs, exhibits, trips, rituals, and anniversary celebrationsEnvironmental resources: parks, reserves, zoos, forests, deserts, lakes, and stream s

45
People: elders, specialists, families, and neighborhoods (pp. 132-133)
Summary
The review of related literature consisted of four general a reas
pertinent to the study: early attempts to examine persistence to
completion of adult programs; the motivational orientations and
sociodemographic components related to adult participation In GED,
HSC, and literacy programs; literature dealing with deterrents to
participation, and future projections for the twenty-first century. As can be
seen, persistence to task completion, a s well a s dropout behavior, Is
multifaceted and very complex. The underlying theme, however, seem s
to be related to the notion that the self-efficacy of an individual may be the
influence needed to propel him through, around, and over barriers to
continuation and completion of planned tasks. Church (1992) best
summed up this Idea with a quote from Bandura's works: “Self-efficacy
influences Initiation of behavior, effort, and persistence in the face of
obstacles and achievement” (p. 498). To meet the ever-changing needs
of the adult population, educators, business and Industry, or anyone
responsible for continuing education for adults should be aware of these
factors when undertaking an educational Initiative for this group.

CHAPTER 3
METHODOLOGY AND PROCEDURES
This chapter presents the methodology of the study. It includes the
following: research design, procedures, the instrument, population,
sample, m easurem ent of variables, and data analysis.
Research Design
This study used descriptive research methods which involved the
collection of data through a survey of the chosen sample. There were no
perceived internal or external threats to the validity of the study.
Procedures
The procedures used In this study were a s follows:
1. Using data provided by the Adult Basic Education Department
and the Department of School Approval of the T ennessee State
Department of Education, the researcher Identified 23 system s with adult
high schools In T ennessee which enrolled students during the 1992-93
school year.
2. A field test of the survey Instrument entitled Life Stvle
Approaches fLSAI Scale w as conducted with 50 adult high school
enrollees in Hamblen and Greene Counties to determine if the reading
level was appropriate for the subjects. The directors/teachers in these
programs were asked to administer these instruments to students who
were currently enrolled in their programs with the exception of those
students currently enrolled who had begun in the 1992-93 school year.
They were provided a checklist by which they could note any questions
with which a student had trouble reading or understanding. Those were
noted with an explanation of the problems encountered so the question
could be changed if a need was indicated. Only one respondent in the
pilot expressed any difficulty, questioning the need for marking the race
alternatives. Otherwise, there were no other difficulties reported by
directors. The checklist is included in Appendix D.
3. After approval from the East T ennessee State University
institutional Review Board, an explanatory letter and survey were mailed
to the 23 identified site directors along with a self-addressed, stam ped
return envelope (copies of the survey and letter a re included in
Appendices A and B respectively). After 10 days the researcher m ade
telephone contact to system s whose directors had not responded.
4. Fourteen responses were received, seven of which contained
the requested nam es and addresses of persisters and dropouts. The
remaining seven respondents granted permission to use the enrollment
and dropout information if the researcher would compile the data. The

48
researcher visited five of the seven sites and complied the nam es and
addresses of persisters and dropouts from site records.
5. Based on the information provided, the researcher developed a
computerized list of 1,427 student nam es and addresses which were
generated on mailing labels, and surveys were mailed to 559 persisters
and 868 dropouts in 12 counties.
6 . After 10 days, follow-up surveys were sent to nonrespondents.
7. The researcher, in further attempts to contact nonrespondents,
visited four sites and administered surveys to identified students at the
school setting, and attempted telephone contact with an additional 211
students.
8. Data from 419 usable surveys were entered into SPSS/PC+
(Norusis, 1992) by hand. SPSS/PC+ was used a s the vehicle for
statistical calculations. The hypotheses were tested and findings
analyzed.
Population
The population to which the researcher intended to generalize was
the approximately 2,945 students enrolled in 23 adult high schools which
enrolled students during the 1992-93 school year. According to the
T ennessee Department of Education, approximately 50% of the group

49
are dropouts and 50% are persisters. The population consisted of adult
high school persisters who had maintained enrollment, adult high school « ,
g raduates enrolled during the 1992*93 school year, and those students
who dropped out after their enrollment during 1992*93.
Sample
There were two groups In this study. The first group (persisters)
w as comprised of adult high schoolers who enrolled in 1992*93 and were
either maintaining enrollment or had since graduated. The second group
(dropouts) w as inclusive of adult high schoolers who enrolled in 1992-93
but had dropped out and remained out of the program.
The T ennessee State Department of Education, Department of
Adult Education, reported that during the 1992*93 school year 23
counties reported enrollment of 2,945 adult high school students.
Directors across the state reported that the dropout rate w as
approximately 50%. Consequently, each population total contained
1,473 students. Based on a .05 level of confidence each sample should
have contained 500 students, including oversampling, which w as done
in order to ensure that the required number of surveys were returned. A
total of 559 persisters and 868 dropouts were surveyed by mail, by
telephone, or on site.
50
The param eter of selecting adult high school programs which had
been In operation for at least two years (1992-93 and 1993-94) served to
identify students who could be considered persistent a s they maintained
enrollment for at least one year or did so until they completed the
requirements for graduation. Secondly, the long term approach identified
true dropouts, a s many adult high school students tend to attend for a
short while, drop out for several weeks, then reenter.
Measurement of Variables
The survey consisted of a written survey form entitled Life Stvle
Approaches fLSAL developed by Williams and Long (1991), The survey
consisted of 22 Items with a modified version of a Llkert 1-5 response
scale. The scale provides a choice regarding the respondent's
perception of how similar each item is to their personal lifestyle by
choosing Irom a choice range of; very different from me, somewhat
different from me, uncertain, somewhat similar to me, and very similar to
me. The response alternatives were scored on a 0-4 scale, with 0
representing the alternative least consistent with the application of each
self-management practice and 4 representing the alternative most
consistent with that practice. Negatively worded items were scored In a
51
reverse direction from the positively worded items. A demographics
section of the survey contained eight items.
Reliability for the instrument w as established by studies done at
the University of T ennessee by Moore (1991). The overall scale of
Cron bach's Alpha w as calculated a s .80.
The instrument
The Life Styles Approaches fLSAI instrument w as developed by
Williams and Long based on a collection of self management strategies
described in their book Manage Your Life (4th ed.) (1991). The strategies
were translated into a 48 item instrument which was administered to 735
college students and nonstudent adults ranging in age from 18 to 65.
Based on subject responses, six clusters of self-management strategies
em erged after subjection to a principal components analysis with varimax
notation. As a result of a three stage factor analysis, 22 items
representing the six factors were included in the concurrent and
discriminant validity assessm ent. The eigenvalues for these six factors
ranged from 1.41 to 2.43 (Williams, et. al., 1991).
1. Factor 1, Performance Focus and Efficiency, a sse sse s self-
reported skill In priority tasks and concentration on them until completed.
Items comprising this subscale are: (2) When confronted with many

52
different things to do, t have difficulty deciding what is most important to
do; (3) After making a decision about what is most important to do at any
given time, I easily get sidetracked from that activity; (6) t have difficulty
judging how long it will take me to complete a task; (16) I have difficulty
matching various tasks with my energy level; and (21) When I deviate
from my selected goat, I have a hard time getting back on track.
2, Factor 2, Goal Dlrectedness. m easures the perceived clarity
with which one views personal goals and objectives. Items comprising
this subscale are: (1) In most situations, I have a clear sense of what
behaviors would be right or wrong for me; (11)1 have a clear sen se of
what I most want to experience in my life; (15) I'm confused a s to the kind
qf personal qualities I want to develop in my life; and (18) I have little Idea
a s to what I most want to achieve in my life.
3. Factor 3, Timeliness of Task Accomplishment. Indicates whether
one begins a task promptly and works efficiently until it is finished. Items
making up this subscale are: (4) Once I decide what is most important to
do at any given time, I start on that task right away; (13) I complete tasks
at the time I say I'm going to complete them; (17) I subdivide big tasks into
a series of smaller tasks; and (20) I complete tasks well in advance of
deadlines.

53
4. Factor 4, Organization of Physical Space, m easures whether
one keeps work and living areas'well organized. Items comprising this
subscale are: (10) I keep my work space well organized; (19) I actively
work to m ake the'place I spend a lot of time more attractive; and (22) My
living space is quite messy.
5. Factor 5. Written Plans for Change, m easures self-reported
written goals and plans. Items comprising this subscale are: (5) I write
down the pros and cons of any behavior change I am considering; (8) I
have written down my life goals; and (14) I seldom write down my yearly
goals.
6 . Factor 6. YerbaLSupportfor Self-Management. Indicates
whether one u ses self-talk and seeks support from others when
attempting a self-change project. Items comprising this subscale are: (7)
I seldom analyze what I am saying to myself; (9) When I begin a personal
change project, I generally keep my plans to myself; and (12) I seldom
ask for feedback from others about behaviors I need to change and how
best to change those behaviors.
Internal consistency coefficients for each LSA factor ranged from
.38 to .71. Internal consistency m easures for the factors are shown In
Table 1. Cronbach’s Alpha for the entire LSA was .60. The comparison

54
variable most strongly related to the LSA factors w as general self efficacy
with a Cronbach's Alpha of .86 (Moore, 1991).*
Data Analysis
The StatfsticalEackage.forJhe Social Sciences (SPSS) (Norusis,
1988) was used for data analysis. The specific test used for Hypotheses
1-6 and 10 w as the t-test for independent m eans. The specific test for
Hypotheses 7-9 and 11-13 was the chi-square test. A discriminant
Table 1
Internal Consistency Coefficients for LSA Factors
Factor Alphq
1 Performance focus and efficiency .71
2 Goal directedness .66
3 Timeliness of task accomplishment .64
4 Organization of physical space .71
5 Written plans for change .60
6 Verbal support for self management .38

55
analysis was conducted for Hypothesis 14. These tests were used to
determine whether differences existed among self-reported life style
approaches of adult high school persisters and dropouts who enrolled in
high school completion programs during the 1992-93 school year.
The data analysis was reported in relation to the null hypotheses.
A present Alpha of .05 was used to test each hypothesis.
Hypothesis 1: There will be no significant difference between the
self-reported scores of persisters and dropouts on performance focus and
efficiency, Factor 1 of the LSA. The Statistical Package for the Social
Sciences (SPSS/PC+) and a t-test for independent m eans w as used to
determine if a significant difference existed between dropouts and
persisters with regard to this factor.
Hypothesis 2: There will be no significant difference In the self-
reported scores of persisters and dropouts on goal directedness, Factor 2
of the LSA. The Statistical Package for the Social Sciences (SPSS/PC+)
and a t-test for independent m eans w as used to determine if a significant
difference existed between dropouts and persisters with regard to this
factor.
Hypothesis 3: There will be no significant difference In the self-
reported scores of persisters and dropouts on timeliness of task

accomplishment, Factor 3 of the LSA. The Statistical Package for the
Social Sciences (SPSS/PC+) and a t-test for independent m eans was
used to determine if a significant difference existed between dropouts
and persisters with regard to this factor.
Hypothesis 4: There will be no significant difference in the self-
reported scores of persisters and dropouts on organization of physical
space, Factor 4 of the LSA. The Statistical Package for the Social
Sciences (SPSS/PC+) and a t-test for. independent m eans w as used to
determine if a significant difference existed between dropouts and
persisters with regard to this factor.
Hypothesis 5: There will be no significant difference in the self-
reported scores of persisters and dropouts on written plans for change,
Factor 5 of the LSA. The Statistical Package for the Social Sciences
(SPSS/PC+) and a t-test for independent m eans w as used to determine if
a significant difference existed between dropouts and persisters with
regard to this factor.
Hypothesis 6: There will be no significant difference in the self-
reported scores of persisters and dropouts on perceived verbal support
for self-management, Factor 6 of the LSA. The Statistical Package for the
Social Sciences (SPSS/PC+) and a t-test for independent m eans w as

57
used to determine if a significant difference existed between dropouts
and persisters with regard to this factor.
Hypothesis 7: There will be no significant difference between
persisters and dropouts on the LSA with regard to age. The Statistical
Package for the Social Sciences (SPSS/PC+) and a chi-square test was
used to determine if a significant difference existed between dropouts
and persisters with regard to this factor.
Hypothesis 8: There will be no significant difference between
persisters and dropouts with regard to gender. The Statistical Package
for the Social Sciences (SPSS/PC+) and a chi-square test w as used to
determine If a significant difference existed between dropouts and
persisters with regard to this factor.
Hypothesis 9: There will be no significant difference between
persisters and dropouts on the LSA with regard to race. The Statistical
Package for the Social Sciences (SPSS/PC+) and a chi-square test w as
used to determine if a significant difference existed between dropouts
and persisters with regard to this factor.
Hypothesis 10: There wilt be no significant difference between
persisters and dropouts on the LSA with regard to number of years
needed to graduate. The Statistical Package for the Social Sciences

58
(SPSS/PC+) and a t-test for independent m eans w as used to determine if
a significant difference existed between dropouts and persisters with
regard to this factor,
Hypothesis 11: There will be no significant difference between
persisters and dropouts on the LSA with regard to marital status. The
Statistical Package for the Social Sciences (SPSS/PC-t-) and a chi-
square test was used to determine if a significant difference existed
between dropouts and persisters with regard to this factor.
Hypothesis 12: There will be no significant difference between
persisters and dropouts with regard to occupational status before
enrollment in adult high school. The Statistical Package for the Social
Sciences (SPSS/PC+) and a chi-square test w as used to determine if a
significant difference existed between dropouts and persisters with
regard to this factor.
Hypothesis 13: There will be no significant difference between
persisters and dropouts with regard to annual personal Income of
respondents in the year preceding enrollment in the adult high school.
The Statistical Package for the Social Sciences (SPSS/PC+) and a chi-
square tes t w as used to determine if a significant difference existed
between dropouts and persisters with regard to this factor.

Hypothesis 14: There is no significant difference between the
independent variable scores for performance focus and efficiency, goalt »
directedness, timeliness of task accomplishment, organization of physical
space, written plans for change, verbal support for self-management, age,
gender, race, number of years needed to graduate, marital status,
occupational status, annual income, and persistence. The Statistical
Package for the Social Sciences (SPSS/PC+) was used to conduct a
discriminate analysis for this hypothesis to determine if the LSA has any
value in predicting persistence.

60
CHAPTER 4
FINDINGS
Introduction
The research questions and hypotheses presented In Chapter 1
are addressed in Chapter 4, which Includes the results and llndlngs
obtained from the data gathered In this study. The purpose of this study
was to determine the characteristic life style approaches most prevalent
among persistent enrollees, graduates, and dropouts of selected adult
high school programs In Tennessee.
A total of 1,625 adult high school students who enrolled during the
1992-93 school year w ere surveyed. Surveys were mailed to 1,427
students, 192 were delivered on site and administered by the researcher
or the site director, and 6 respondents were surveyed by telephone.
There were 868 dropouts and 757 perslsters who were surveyed. A total
of 419 usable surveys were returned--311 perslsters and 108 dropouts.
Demographic Data
Demographic data were collected from the respondents' profile
information which w as requested on the survey instrument entitled, Life
Stvle Approaches (LSA1 Scale. Demographic data were reported by
perslsters and dropouts for the following categories: birth year, gender,

race, number of years needed to graduate, previous attendance In
another adult high school or GED program, marital status, occupational
sta tus before enrollment, and annual personal income, Perslsters who
had graduated were asked if they had enrolled in another educational
program since graduation, and if so to identify whether it w as a two year
college, four year college, technical school, or other educational
institution.
Although the total respondent birth years ranged from 1926
through 1977, the majority of both perslsters and dropouts were born
after 1960. Dropouts were younger than the perslsters, with 85% of
dropouts born after 1960 a s opposed to 75% of the perslsters. Both
groups contained more than twice the number of fem ales than males,
and 88% of both perslsters and dropouts were white. Nine percent of the
perslsters were black, and 10% of dropouts were black. Two percent of
the total respondents reported their race as being other (Table 2).
The respondents reported a range of zero to four years needed to
graduate when they enrolled. Perslsters lacked fewer years to graduate
than did dropouts. Fifty-eight percent of the persisters lacked one year or
less to graduate a s opposed to only 39% of the dropouts. Of the total
number of respondents, 42% were married and the remaining 58%

Table 2FreouencV-Of.Responsea bv Respondent Birth Year. Gender. Race. Number Years Needed toGraduate. and Previous Attendance In Another HSC/GED Program
Perslsters Dropouts _ !_____2k_
Birth year 1960-present 232 75 91 851943-1959 55 18 14 13Before 1943 _21 _ z _ 2 _ 2
308 100 107 100
Gender Male 98 32 36 33Female 212 68 71 66Missing „Q _ l
310 100 108 100
Race White 272 88 95 88Black 27 9 11 10Other 9 2 0 0Missing _2 - 4 _ 2 _ 2
310 100 108 100
Years to graduate 0-1 178 58 42 392-3 79 26 46 434 + 22 7 20 10Missing _2i _ S __Q
310 100 108 100
Marital status Single 135 43 52 48Married 132 43 43 40Divorced 41 13 10 9Other 2 1 2 2Missing _Q _Q —1 _ l
310 100 108 100

63
were single, divorced, or widowed. More dropouts (48%) than perslsters
(43%) were single. Forty-three percent of the perslsters were married
and 40% of the dropouts reported their marital status a s married.
Tabulations for these factors are reported in Table 2.
Only one-fourth of the total respondents reported having enrolled
In other GED or HSC programs prior to enrollment in their current
programs. Of the graduates who reported entry Into postsecondary
programs after graduation, 70% chose two-year colleges or technical
schools. Nine percent of graduates chose four-year college programs
(Table 3).
One-third of the perslsters reported their occupations a s skilled
laborer while one-fourth of the dropouts reported them selves as skilled
laborers. An equal number of each group reported them selves a s
unskilled laborers, but more dropouts (27%) than perslsters (22%) were
unemployed at the time of enrollment. With regard to Income, perslsters
had slightly higher Incomes than dropouts. Fifty-one percent of the
perslsters earned less than $10,000, and 55% of the dropouts earned
less than $10,000. The mean annual Income of perslsters w as $7,319,
and the m ean Income for dropouts was $6,580. Tabulations for
occupation and Income are reported in Table 3.

64
Table 3Frequency of Responses bv Respondent Marital Status. Occupational Status Before Enrollment. Annual Income, and Enrollment In Programs Attar Graduation
Marital status
Occupational status before enrollment
Annual Income
Persist era Dropouts_ L J&. JL _2L
Single 135 45 52 . 48Married 132 42 43 40Divorced 41 12 10 9Other 2 1 2 2Missing _Q _Q _ 1
310 100 10B 100
Unemployed* seeking work 49 16 19 18Unemployed-not seeking work 20 6 10 9Employed-skilled 92 30 26 24Employed-unskilled 85 27 30 28Homemaker 42 14 16 15Other 18 6 4 4Missing _4 _1 _ 3 _ 2
310 100 108 100
Under $5,000 87 28 43 40$ 5,000*$ 9,000 71 23 16 15$10,000 • $14,999 68 22 22 20$15,000 - $19,999 36 12 14 13$20,000 - $24,999 13 4. 5 5$25,000 - $29,999 9 3 1 1$30,000 * $34,999 5 2 2 2$35,000 + 4 1 0 0Missing J1 _ 5 - 5
310 100 108 100Mean Income $7,319 $6,580
65
Survey Statement Responses
The survey form entitled Life Stvle Approaches fLSAl Scale
consisted of 22 statem ents concerning the subjects' perception of their
self-management practices. There were 11 positive and 12 negative
statem ents (see Appendix E). A modified version of a Lfkert 1-5
response scale provided a choice regarding the respondents' perception
of how similar each item was to their personal lifestyle. They chose from
a range of: very different from me, somewhat different from me,
uncertain, somewhat similar to me, and very similar to me. The response
alternatives were scored on a 0-4 scale, with 0 representing the
alternative least consistent with the application of each self-management
practice and 4 representing the alternative most consistent with that
practice. Negatively worded items were scored in a reverse direction
from the positively worded items.
Survey Question 1: In most situations i have a clear sense of what
behaviors would be right or wrong for me. Both perslsters and dropouts
reported that they had a very clear sense of what behaviors would be
right or wrong for them. Ninety-three percent of the persisters chose
either somewhat similar or very similar to them, and 87% of the dropouts
reported either somewhat similar or very similar to them (Table 4).

66
Table 4
Frequency of Response of Perslsters and Dropouts to LSA Question 1
(Clear S ense of Right and Wronal
ResDonse ValuePerslsters f %
Dropouts f %
Very different from me 0 6 2.0 4 3.0
Somewhat different from me 1 5 1.5 3 3.0
Uncertain 2 9 3.0 5 5.0
Somewhat similar to me 3 75 24.0 25 23.0
Very similar to me 4 214 69.0 69 64.0
No response — L ___ J> _ 2 2.0
310 100.0 108 100,0
Survey Question 2: When confronted with many things to do, I
have difficulty deciding what is most important to do. Perslsters and
dropouts alike reported having som e difficulty putting tasks into priority
from most important to least Important. Sixty-percent of the perslsters
and 58% of the dropouts reported having difficulty in this a rea (Table 5).

67
Tables
Frequency of Response of Persisters and Dropouts to LSA Question 2t
I Difficulty In Prioritizing Tasks)
ResDonse ValuePersisters
_LDrooouts f %
Very different from me 0 40 13.0 15 14.0
Somewhat different from me 1 64 21.0 19 17.5
Uncertain 2 20 6.0 11 10.0
Somewhat similar to me 3 77 25.0 31 29.0
Very similar to me 4 109 35.0 31 29.0
No response ___Q _£LQ ___1 1,9
310 100.0 106 100.0
Survey Question 3: After making a decision about what is most
important to do at any given time, I easily get sidetracked from that
activity. Once a decision was m ade about what to do at a given time,
dropouts reported having less difficulty with staying on track than did
persisters. Almost half of the dropouts indicated that the statem ent w as

68
somewhat different or very different from them. Only one-fourth of
persisters chose somewhat or very different from them (Table 6).
Survey Question 4: Once t decide what is most important to do at
any given time, I start on that task right away. Dropouts and persisters
alike tended to start on a task right away after they had chosen it a s a
Table 6
Frequency of Response of Perslsters and Dropouts to LSA Question 3
(Getting Sidetracked)
ResDonse ValuePersisters f %
Drooouts±
Very different from me 0 28 9.0 16 15.0
Somewhat different from me 1 57 18.0 31 29.0
Uncertain 2 17 6.0 6 5.5
Somewhat similar to me 3 96 31.0 26 24,0
Very similar to me 4 112 36.0 28 26.0
No response ___Q QQ ___1
310 100.0 108 100.0

69
priority item. Neither persisters nor dropouts reported having difficulty in
this area more than 19% of the time (Table 7).
Survey Question 5: I write down the pros and cons of any
behavior change I am considering. Fewer than 30% of dropouts and
persisters reported the self-management practice of writing down the
Table 7
Frequency of Response of Persisters and Dropouts to LSA Question 4
(Starting immediately on Task After Choice is Madet
.Persisters. DroDOUtsResDonse Value _L _ 2L _L %
Very different from me 0 10 3.0 7 7.0
Somewhat different from me 1 37 12.0 13 12.0
Uncertain 2 14 5.0 3 3.0
Somewhat similar to me 3 99 32.0 36 33.0
Very similar to me 4 150 46.0 48 44.0
No response ___Q 0.0 _ L _L Q
310 100.0 108 100.0

70
pros and cons of any anticipated behavior change. Sixty*two percent of
the persisters and 63% of the dropouts chose either very similar to them
or somewhat similar to them when answering this item (Table 8).
Survey Question 6 : I have difficulty judging how long it wilt take
me to complete a task. Responses from dropouts and persisters alike
T a b le s
Frequency of Response of Persisters and Dropouts to LSA Question 5
(Written F ros.andC onsl
R esponse ValuePerslsters.
_LDroDOUts f %
Very different from me 0 135 44.0 55 51.0
Somewhat different from me 1 57 18.0 43 12.0
Uncertain 2 31 10.0 12 11.0
Somewhat similar to me 3 56 18.0 19 18.0
Very similar to me 4 30 9.7 8 7.0
No response ___1 ___ ___1 _ L S
310 100.0 108 100.0

71
ranged across the entire choice spectrum for this survey item. However,
59% of the persisters and 52% of the dropouts reported difficulty in
judging how long a task, once begun, would take to complete. Dropouts
had stronger disagreement with the survey item than did persisters
(Table 9).
Table 9
Frequency of Response of Persisters and Dropouts.to ISA Question 6
/Difficulty Judging Completion Timel
Response value.Persisters. _L _ 2L
Dropouts f %
Very different from me 0 26 8.0 15 14,0
Somewhat different from me 1 62 20.0 25 23.0
Uncertain 2 39 13.0 11 10.0
Somewhat similar to me 3 62 27.0 27 25.0
Very similar to me 4 101 32.0 29 27.0
No response ___Q 0.0 ___1 _ L Q
310 100.0 108 100.0
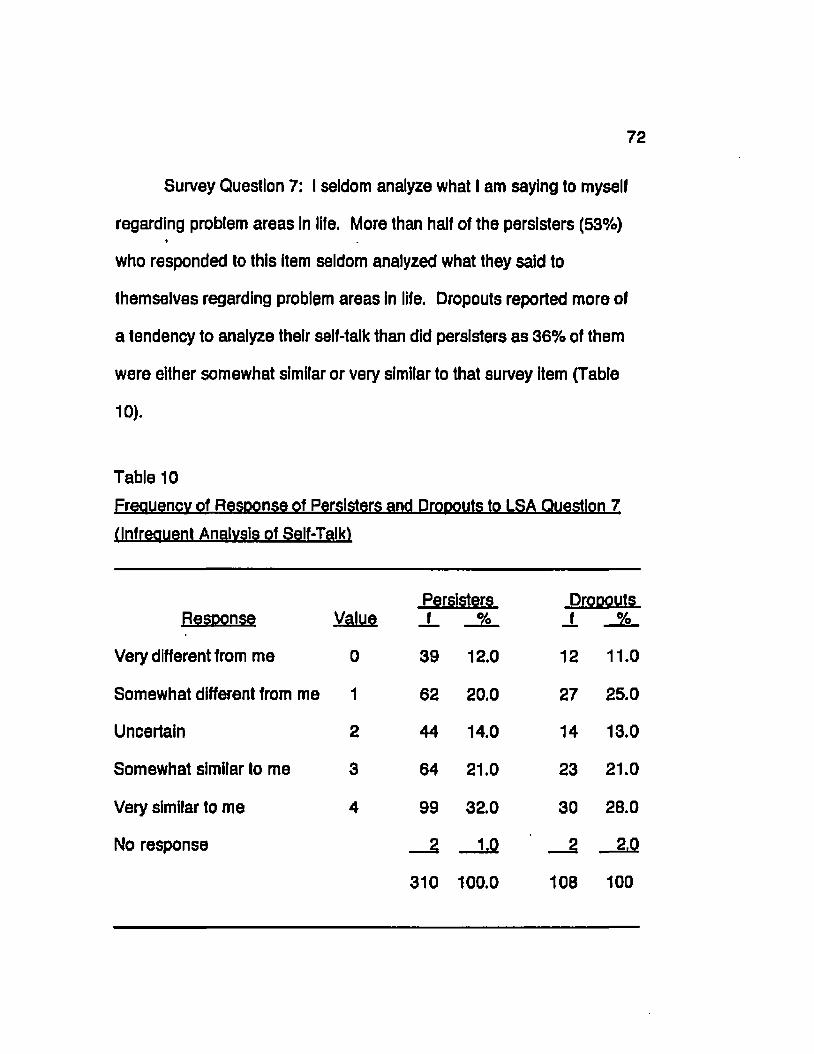
Survey Question 7: I seldom analyze what I am saying to myself
regarding problem a reas In life. More than half of the persisters (53%)4
who responded to this item seldom analyzed what they said to
them selves regarding problem areas in life. Dropouts reported more of
a tendency to analyze their self-talk than did perslsters a s 36% of them
were either somewhat similar or very similar to that survey Item (Table
10).
Table 10
Frequency of Response of Perslsters and Dropouts to LSA Question 7
(Infrequent Analysis of Self-Talk)
ResDonse valuePerslsters
J _ %DroDOUts
_L
Very different from me 0 39 12.0 12 11.0
Somewhat different from me 1 62 20.0 27 25.0
Uncertain 2 44 14.0 14 13.0
Somewhat similar to me 3 64 21.0 23 21.0
Very similar to me 4 99 32.0 30 28.0
No response _ 2 1,0 _ 2 _JLQ
310 100.0 108 100

73
Survey Question 8 : I have written down my life goals. Dropouts
differed markedly from persisters in having written life goals. Only 13% of
persisters reported very different from themselves on this Item, but 44% of
the dropouts chose this alternative. More than half (52%) of persisters
chose very similar or somewhat similar to them for this item, a s compared
to 32% of the dropouts (Table 11).
Table 11
Frequency of Response of Persisters and Dropouts to LSA Question 8
(Written Life Goalsl
R esponse ValuePersisters f %
Drooouts _L %
Very different from me 0 39 13.0 47 44.0
Somewhat different from me 1 62 20.0 16 15.0
Uncertain 2 44 14.0 9 8.0
Somewhat similar to me 3 64 21.0 16 15.0
Very similar to me•
4 99 31.0 18 17.0
No response _ L Q ___2 _ L f l
310 100.0 108 100.0

74
Survey Question 9: When I begin a personal change project, I
generally keep my plans to myself. More than half of both persisters and
dropouts tended to make their plans for self-change projects known to
others. Both persisters and dropouts 34% of the time chose either
somewhat similar or very similar to them on this item (Table 12).
Table 12
Frequency of Response of Persisters and Dropouts to LSA Question 9
(Confidentiality of Plans)
Persisters Dropoutsf % 1 OAR esponse value _L % J . %
Very different from me 0 102 33.0 28 26.0
Somewhat different from me 1 60 26.0 30 28.0
Uncertain 2 19 6.0 11 10,0
Somewhat similar to me 3 54 17.0 16 15.0
Very similar to me 4 54 17.0 21 19.0
No response ___1 1,0 __ 2 -2 Q
310 100 108 100.0

75
Survey Question 10: I keep my work space welt organized.
Approximately three-fourths of both dropouts and persisters chose ■
somewhat simitar or very similar to them for this item. Less than one-
fourth of both groups reported having a messy work space (Table 13).
Table 13
Frequency of Response of Perslsters and Dropouts to LSA Question 10
(Well Organized Work Space!
ResDonse ValuePersisters. Dropouts,
f %
Very different from m e 0 25 6.0 14 13.0
Somewhat different from me 1 36 12.0 10 9.0
Uncertain 2 14 4.0 4 4.0
Somewhat similar to me 3 93 30.0 37 34.0
Very similar to me 4 142 46.0 42 39.0
No response _ Q 0.0 ___ 1 1.0
310 100.0 108 100.0

Survey Question 11:1 have a clear sense of what I most want to
experience in my life. Both persisters and dropouts reported that they
were very similar to this item. Forty-eight percent of persisters and 46%
of the dropouts answered this alternative. Both groups had a clear sen se
of what they wanted to experience in life (Table 14).
Table 14
Frequency of Response of Persisters and Dropouts to LSA Question 11
(Clear S ense of Life Experiences!
Persisters, Dropoutsf ° /„ f OAR esponse value _L % _L %
Very different from me 0 19 6.0 5 5.0
Somewhat different from me 1 15 5.0 12 11.0
Uncertain 2 36 12.0 15 14.0
Somewhat similar to me 3 91 29.0 25 23.0
Very similar to me 4 149 48.0 50 46.0
No response 0 P-P ___1 1.0
310 100.0 108 100.0

77
Survey Question 12: I seldom ask for feedback from others about
behaviors I need to change and how best to change those behaviors.
The response choices of dropouts were strikingly similar for the practice
of asking for feedback from others on needed behavior changes. As can
be seen In Table 15, percentages for each choice are within a few points
of each other for dropouts and persisters except for the very similar to me
category. It would seem that dropouts have a slightly greater tendency
Table 15
Frequency of Response of Persisters and Dropouts to LSA Question 12
(I Seldom Ask for Feedback From Others Regarding Needed Behavior
C hanges)
Perslsters DropoutsResDonse Value _L % JL %
Very different from me 0 73 23.0 27 25.0
Somewhat different from me 1 81 26.0 25 23.0
Uncertain 2 33 10.0 10 9.0
Somewhat similar to me 3 58 19.0 25 23.0
Very similar to me 4 64 20.5 19 18.0
No response ___1 2.0
310 100.0 108 100.0

78
than persisters to ask for feedback from others regarding their own
behavior changes.
Survey Question 13: I complete tasks at the time I say I'm going to
complete them. Approximately three-fourths of both persisters and
dropouts reported that they completed tasks at the time they said they
were going to complete them. Fewer than one-fourth of either group
chose somewhat different or very different from them on this item, and it
may be said that dropouts and persisters perceived them selves a s
completing tasks on time the majority of the time (Table 16).
Table 16
Frequency of Response of Perslsters and Dropouts to LSA Question 13
fTlmelv Completion of Tasksl
R esoonse ValuePersisters f %
Drooouts f %
Very different from me 0 22 7.0 11 10.0
Somewhat different from me 1 34 11.0 14 13.0
Uncertain 2 23 7.0 7 6.0
Somewhat similar to me 3 129 42.0 46 43.0
Very similar to me 4 101 32.0 29 27.0
No response 1 1.0 ___1 1,P310 100.0 108 100.0
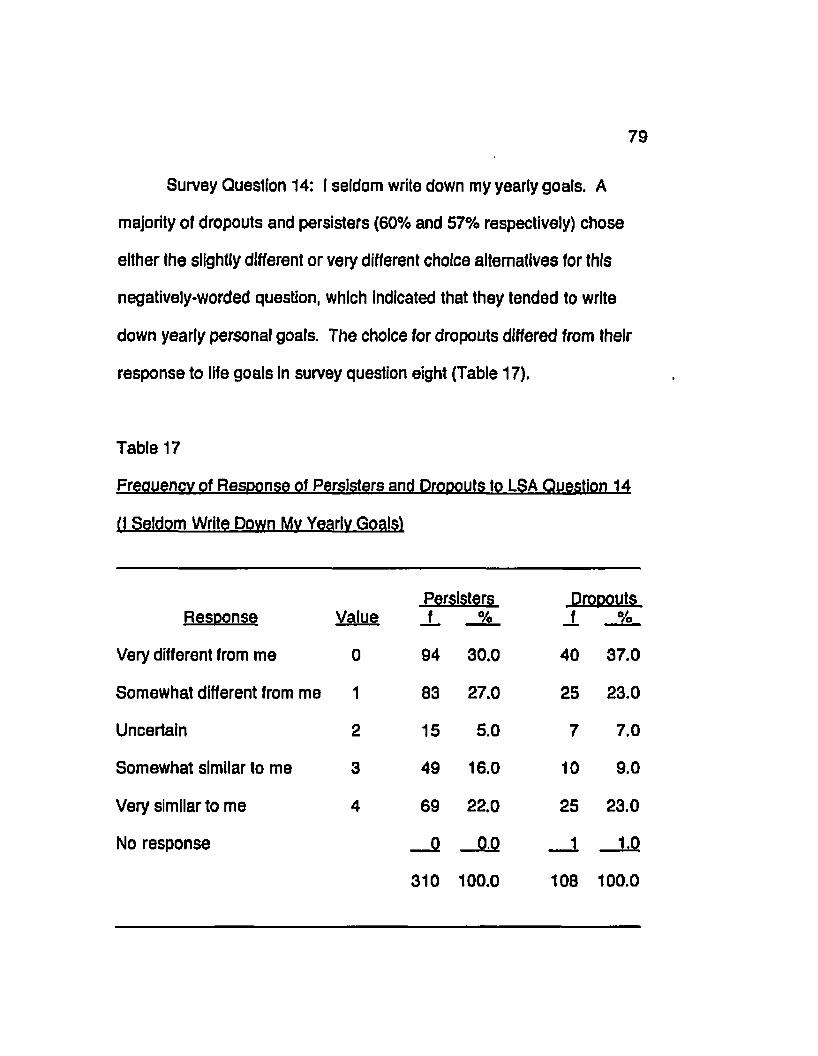
Survey Question 14: I seldom write down my yearly goafs. A
majority of dropouts and persisters (60% and 57% respectively) chose
either the slightly different or very different choice alternatives for this
negatively-worded question, which indicated that they tended to write
down yearly personal goals. The choice for dropouts differed from their
response to life goals In survey question eight (Table 17).
Table 17
Frequency of Response of Perslsters and Dropouts to LSA Question 14
fl Seldom Write Down Mv Yearly Goalsl
ResDonse ValuePersisters Dropouts,
f %
Very different from me 0 94 30.0 40 37.0
Somewhat different from me 1 83 27.0 25 23,0
Uncertain 2 15 5.0 7 7.0
Somewhat similar to me 3 49 16.0 10 9.0
Very similar to me 4 69 22.0 25 23.0
No response __ Q SLQ ___1 _ L Q
310 100.0 108 100.0
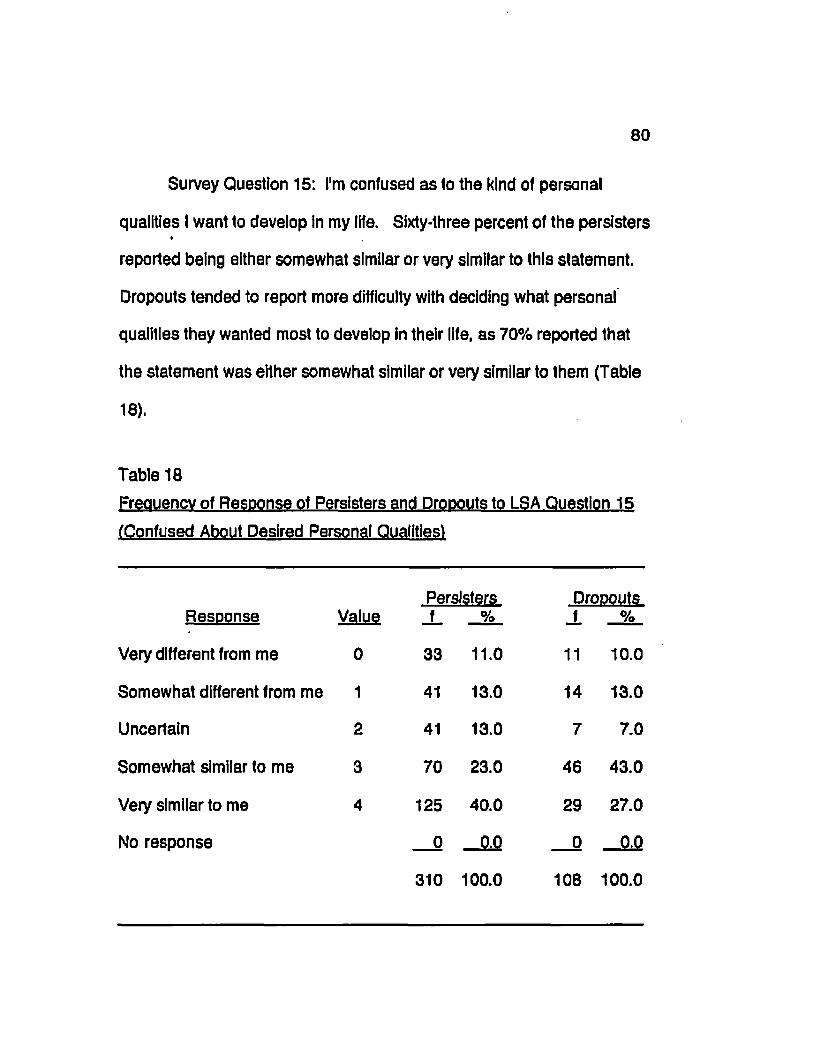
80
Survey Question 15: I'm confused a s to the kind of personal
qualities I want to develop in my life. Sixty-three percent of the perslsters*
reported being either somewhat similar or very similar to this statement.
Dropouts tended to report more difficulty with deciding what personal'
qualities they wanted most to develop In their life, a s 70% reported that
the statem ent w as either somewhat similar or very similar to them (Table
18).
Table 10
Frequency of Response of Persisters and Dropouts to LSA Question 15
(Confused About Desired Personal Qualities!
ResDonse ValuePerslsters
_LDropouts
±
Very different from me 0 33 11.0 11 10.0
Somewhat different from me 1 41 13.0 14 13.0
Uncertain 2 41 13.0 7 7.0
Somewhat similar to me 3 70 23.0 46 43.0
Very similar to me 4 125 40.0 29 27.0
No response 0 _ £ Q 0 Q.Q
310 100.0 108 100.0

81
Survey Question 16: I have difficulty matching various tasks with
my energy level. Very little differences were noted between dropouts
and persisters In this area. Slightly more than one-third of each group
chose the very similar alternative. However, dropouts reported less
difficulty with matching tasks to their energy level than did persisters
(Table 19).
Table 19
Frequency of Response of Perslsters and Dropouts to LSA Question 16
fReported Difficulty,Matching Tasks With Energv_Level)
Perslsters DropoutsResDonse Value _L % _L %
Very different from me 0 31 10.0 13 12.0
Somewhat different from me 1 54 17.0 26 24.0
Uncertain 2 46 15.0 12 11.0
Somewhat similar to me 3 73 24.0 17 16.0
Very similar to me 4 106 34.0 39 36.0
No response __ Q _ 0 Q ___1 1.0
310 100.0 108 100.0

82
Survey Question 17: I subdivide big tasks into a series of smaller
tasks. More than half of dropouts and perslsters reported the practice of
subdividing large tasks into smaller ones by choosing either the
somewhat similar or the very similar alternative. Very little differences
were noted between the two groups on this survey item (Table 20).
Table 20
Frequency of Response of Perslsters and Dropouts to LSA Question 17
(Subdivision of Bla Tasks Into Smaller Onest
Persisters. DropoutsR esponse Value _L % _L %
Very different from me 0 45 15.0 24 22.0
Somewhat different from me 1 49 16.0 15 14,0
Uncertain 2 43 14.0 13 12.0
Somewhat similar to me 3 107 34.0 34 32,0
Very similar to me 4 66 21.0 21 19.0
No response 0 0,0 ___1 1.0
310 100.0 108 100.0

83
Survey Question 16: I have little Idea a s to what I most want to
achieve In my life. Perslsters and dropouts reported results very similar
to each other for each alternative. Seventy-one percent of perslsters
reported having little Idea a s to what they most wanted to achieve In their
lives, but 68% of the dropouts reported having this difficulty (Table 21).
Table 21
Frequency of Response.of .Persisters.and Dropouts_to_LSA_Question_l8
/Little Idea of Desired Achievement)
ResDonse ValuePersisters J _ _% _
DroDouts _f_ %
Very different from me 0 41 13.0 14 13.0
Somewhat different from me 1 26 8.0 17 16.0
Uncertain 2 26 8.0 8 7.0
Somewhat similar to me 3 69 23.0 21 19.0
Very similar to me 4 148 48.0 47 44.0
No response 0 0,0 ___1 _ L Q
310 100.0 108 100.0

84
Survey Question 19: I actively work to make the place where 1
spend a lot of time more attractive. Most persisters and dropouts alike
(48% and 46% respectively) reported that the practice of keeping the
place where they spent a lot of time neat and orderly, a s they chose the
very similar alternative on this item (Table 22).
Table 22
Frequency of Response of Persisters and Dropouts to LSA Question 19
(Actively Work to Make Workplace Attractive!
ResDonse ValuePersisters f %
DroDOUts f %
Very different from me 0 16 5.0 10 9.0
Somewhat different from me 1 26 8.0 12 11.0
Uncertain 2 21 7.0 7 7.0
Somewhat similar to me 3 98 32.0 28 26.0
Very similar to me 4 148 47.7 50 46.0
No response ___1 .3 1 1,0
310 100.0 108 100.0

85
Survey Question 20: I complete major tasks well in advance of
deadlines. Persisters and dropouts both were under the impression thati ,
they completed tasks well In advance of deadlines. The responses
between the two groups were very similar. More than 60% of both
groups chose either the very similar or the somewhat similar alternative
for this item (Table .23).
Table 23
Frequency of Response of Persisters and Dropouts to LSA Question 20
fComnletlon of Tasks In Advance of Deadlines!
ResDonse ValuePersisters Drorjouts
_L %
Very different from me 0 33 10.7 12 11.0
Somewhat different from me 1 51 17.0 15 14.0
Uncertain 2 35 11.0 10 9.0
Somewhat similar to me 3 119 38.0 38 35.0
Very similar to me 4 71 23.0 32 30.0
No response ___1 ___1
310 100.0 108 100.0

86
Survey Question 21: When I deviate from my selected goal, I have
a hard time getting back on track, Although 16% of the persisters chose
the undecided alternative, fewer persisters than dropouts chose the very
different or somewhat different alternatives on this survey question.
However, more than half of each group reported difficulty getting back on
track when they deviated from a selected goal (Table 24).
Table 24
Frequency of Response of Persisters and Dropouts to LSA Question 21
(Difficulty Getting Back on Track After Being Sidetracked!
ResDonse ValuePersisters f %
.Dropouts, f %
Very different from me 0 36 12.0 21 19.0
Somewhat different from me 1 60 19.0 30 28.0
Uncertain 2 49 16.0 2 2.0
Somewhat similar to me 3 92 29.7 28 26.0
Very similar to me 4 72 23.0 26 24.0
No response 1 3 ___1 1.0
310 100.0 108 100.0

87
Survey Question 22: My living space is quite messy. Choice
percentages for dropouts were identical on three of the five alternatives.
Both persisters and dropouts (60% and 55% respectively) saw
them selves a s having a messy living space (Table 25). The survey
statem ent response section has presented the subjects1 perceptions of
their self-management practices for each item on the Life Stvle
Table 25
Frequency of Response of Persisters and Dropouts to LSA Question 22
fMessv Living Space)
R esponse Vaiy?Persisters
X %DroDOUts f %
Very different from me 0 15 5.0 10 9.0
Somewhat different from me 1 28 9.0 10 9.0
Uncertain 2 8 3.0 3 3.0
Somewhat simitar to me 3 71 23.0 25 23.0
Very similar to me 4 188 60.0 59 55.0
No response __ Q _£LQ __ 1 1.0
310 100.0 108 100.0

88
Approaches Scale. They responded to 11 positive and 12 negative
statem ents on a modified Likert 1*5 response scale.
Descriptive Data
Hypothesis 1 stated that there would be no significant difference
between the self reported scores of persisters and dropouts on
performance focus and efficiency, Factor 1 of the LSA. Performance
focus and efficiency a sse sse s the self-reported skill in prioritization of
tasks and concentration on them until completed. Six items comprised
this subscale: Questions 2 ,3 ,6 ,1 6 , and 21. A t-test for independent
m eans (pooled variance) w as used to test the hypothesis. The two-tailed
probability w as .022 and therefore, the null hypothesis w as rejected.
Persisters scored significantly higher than dropouts for this particular item
(Table 26).
Hypothesis 2 stated that there would be no significant difference
between the self reported scores of persisters and dropouts on goal
directedness, Factor 2 of the LSA. Goal directedness m easures the
perceived clarity with which one views personal goals and objectives.
Items comprising this subscale were Questions 1 ,1 1 ,1 5 , and 18 on the
LSA scale. A t-test for independent m eans (separate variance) w as

89
Table 26
Results of T-Test for Hypothesis 1: Difference In Self-Reported Scores of
Persisters and Dropouts on Performance Focus and Efficiency
Group 1 Group 2 F Pooled Variance Separate VarianceMean Mean Value E ro k _ t_ Prob. _ t_ Prob.
12.5922 11.3458 1.16 .339 2.30 .022’ 2.22 .028
’Indicates a significant difference at Alpha <.05.
Group 1, persisters. Group 2, dropouts.
conducted with a resulting 2-talled probability of .079. The null
hypothesis w as retained (Table 27).
Hypothesis 3 stated that there would be no significant difference In
the self reported scores of persisters and dropouts on timeliness of task
accomplishment, factor 3 of the LSA. Timeliness of task accomplishment
indicates w hether one begins a task promptly and works efficiently until it
is finished, and included subscale Items 4 ,1 3 ,1 7 , and 20 of the LSA. A
t-test for independent m eans (pooled variance) w as conducted to

90
Table 27
Results of T-Test for Hypothesis 2: Difference In Self-Reported Scores of »
Persisters and Dropouts on Goal Directedness
Group 1 Qroijb_2 F Pooled Variance Separate VarianceMean Mean Value Prob. t Prob. t Prob.
12.1909 11.4811 1.38 .037 1.91 .057 1.77 .079
Group 1, persisters. Group 2, dropouts.
determine if a significant difference existed for this factor. The two-tailed
pooled variance estimate was .316, and the null hypothesis w as retained
(Table 28),
Hypothesis 4 stated that there would be no significant difference in
the self reported scores of persisters and dropouts on organization of
physical space, Factor 4 of the LSA. The Organization of Physical Space
subscale m easures whether one keeps work and living a reas well
organized and included items 10,19, and 22 on the LSA. A t-test for
independent m eans (pooled variance) was conducted to test this

91
Table 28
Results of T-Test for Hypothesis 3: Difference In Self-Reported Scores of
Persisters and Dropouts on Timeliness of Task Accomplishment
Group 1 Group 2 F Pooled Variance Separate VarianceMean Mean Value Prob. t Prob. t Prob.
10.7078 10.3271 1.35 .052 1.00 .316 .93 .351
Group 1, persisters. Group 2, dropouts.
hypothesis. The two-tailed probability of pooled variance estim ate w as
.088, but the difference w as not sufficient to reject the null hypothesis,
and the null hypothesis was retained (Table 29).
Hypothesis 5 stated that there would be no significant difference in
the self reported scores of persisters and dropouts on written plans for
change, Factor 5 of the LSA. Factor 5 measured self reported written
goals and plans and included Items 5, 8, and 14 of the LSA. A t-test for
Independent m eans (pooled variance) w as administered to test this
hypothesis. A resultant 2-tailed probability of pooled variance estim ate
w as .107, and the null hypothesis was retained (Table 30).
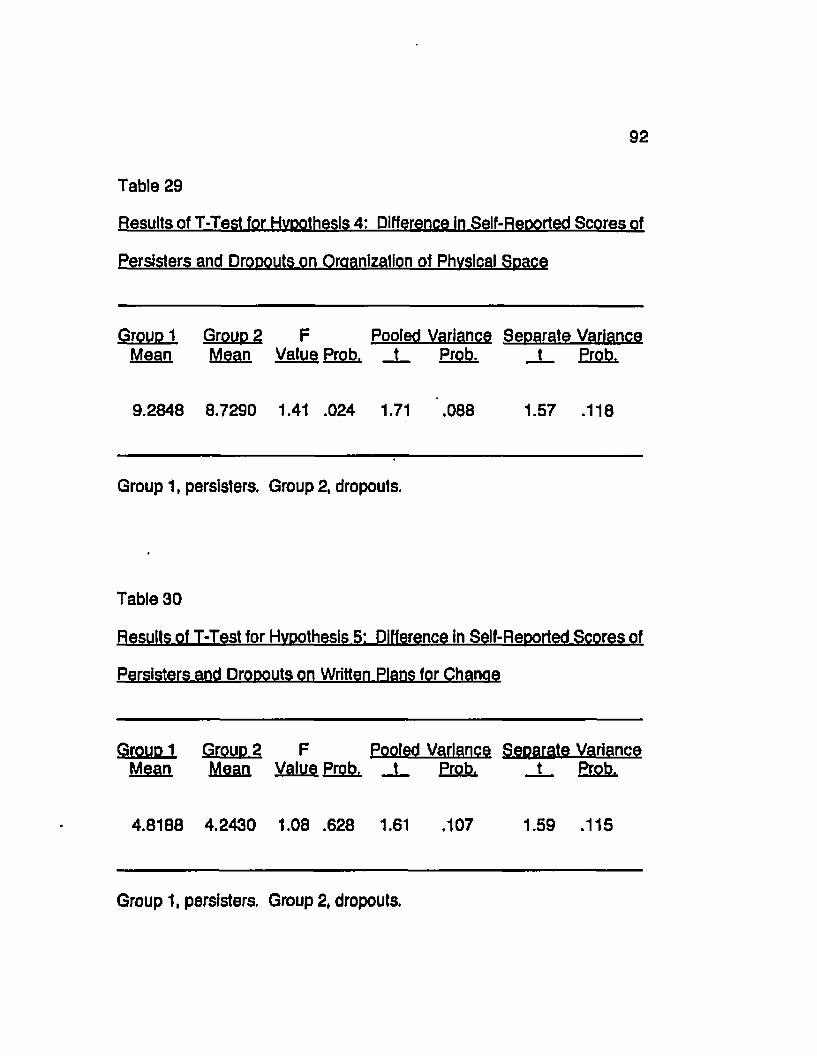
Table 29
Results of T-Test for Hypothesis 4: Difference In Self-Reported Scores of
Persisters and Dropouts on Organization of Physical Space
Group 1 Group 2 F Pooled Variance Separate VarianceMean Mean Value Prob. t Prob. t Prob.
9.2848 8,7290 1.41 .024 1.71 .088 1.57 .118
Group 1, persisters. Group 2. dropouts.
Table 30
Results of T-Test for Hypothesis 5: Difference In Self-Reported Scores of
Persisters and Dropouts on Written Plans for Chanoe
GroupJL Group 2 F Pooled Variance Separate Variance Mean M ean Value Prob. _ i_ Prob, __t_ Prob.
4.8188 4.2430 1.08 .628 1.61 ,107 1.59 .115
Group 1. persisters. Group 2. dropouts.

93
Hypothesis 6 stated that there would be no significant difference In
the self reported scores of persisters and dropouts on perceived verbal
support for self management, Factor 6 of the LSA. Factor 6 indicated
whether one used self talk and sought support from others when
attempting a self change project. The items comprising this subscale are
Items 7, 9, and 12 of the LSA. A t-test for Independent m eans (pooled
variance) w as used to test the null hypothesis, and a resultant 2-tailed
probability of pooled variance estimate was .904. The null hypothesis
w as retained (Table 31).
Table 31
Results of T-Test .for. Hypothesis _6 ̂ Difference In Self-Reported Scores of
Persisters and Dropouts on Verbal Support for Change
Group 1 Group 2 F Pooled Variance Separate.V arianca Mean Mean Value Prob. t Prob. t Prob.
5.8567 5.8942 1.05 .756 -.12 .904 -.12 ,905
Group 1, persisters. Group 2, dropouts.
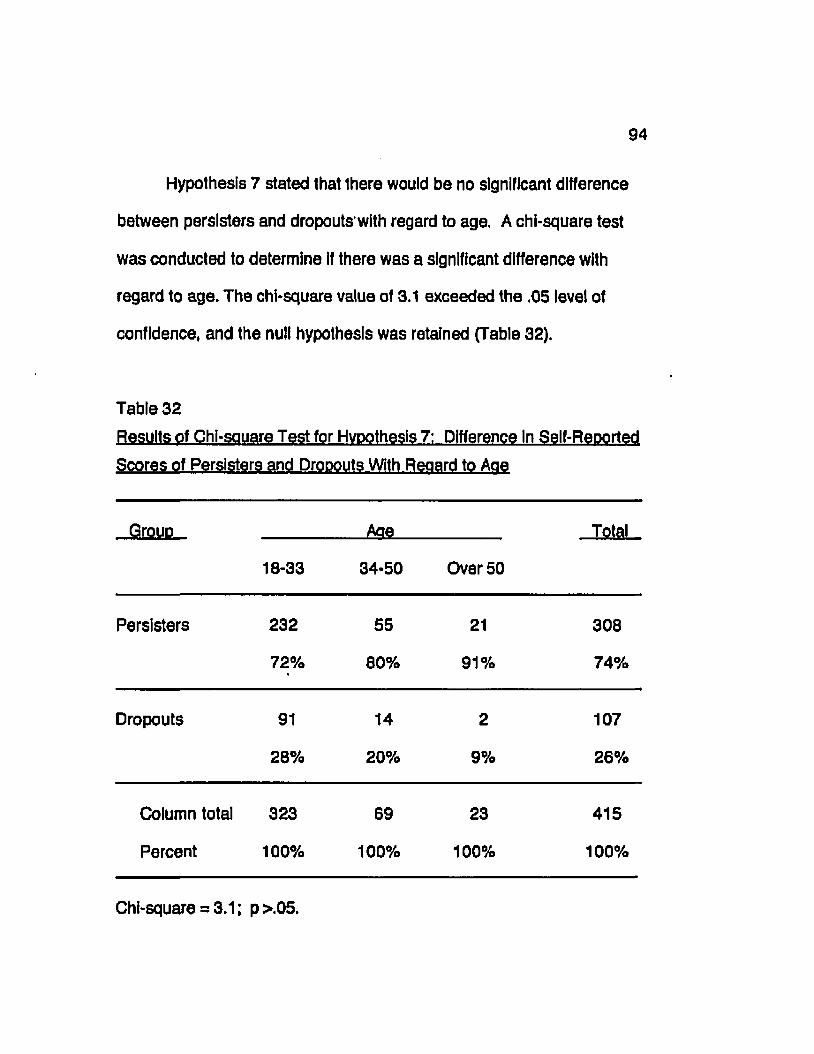
94
Hypothesis 7 stated that there would be no significant difference
between persisters and dropouts with regard to age. A chi-square test
was conducted to determine if there was a significant difference with
regard to age. The chi-square value of 3.1 exceeded the .05 level of
confidence, and the null hypothesis was retained (Table 32).
Table 32
Scores of Persisters and Drooouts With Reoard to Aae
GrouD Aae Total
18-33 34-50 Over 50
Persisters 232 55 21 308
72% 00% 91% 74%
Dropouts 91 14 2 107
20% 20% 9% 26%
Column total 323 69 23 415
Percent 100% 100% 100% 100%
Chi-square = 3.1; p>.05.

95
Hypothesis 8 stated that there would be no significant difference
between persisters and dropouts with regard to gender. A chi-square4 .
test w as conducted to determine if there was a significant difference with
regard to gender. The chi-square w as 1.51 with a p-value of .698, and
the null hypothesis was retained (Table 33).
Table 33
Scores of Persisters and DroDouts With Reaard to Gender
Grouo Gender Total
Male Female
Persisters 98 212 310
73% 75% 74%
Dropouts 36 71 107
27% 25% 26%
Column total 134 283 417
Percent 100% 100% 100%
Chi-square = .151; p >.05.

96
Hypothesis 9 stated that there would be no significant difference •
between persisters and dropouts with regard to race. A chi-square test
was conducted to determine if a significant difference existed for this
factor by grouping respondents into white and non-white categories. The
p-value was .71364, and consequently the null hypothesis w as retained
(Table 34).
Table 34
Scores of Persisters and DroDOUts With Reaard to Race
Grouo Race Total
White Non-white
Persisters 272 36 308
74% 77% 74.4%
Dropouts 95 11 106
26% 23% 25.6%
Column total 367 47 414
Percent 100% 100% 100%
Chi-square = .13467; p >.05.

Hypothesis 10 stated that there would be no significant difference
between persisters and dropouts with regard to the number of years
needed to graduate. A t-test for independent m eans (pooled variance)
was conducted with a resultant 2-tailed probability of pooled variance
estim ate of .008, and the null hypothesis was rejected (Table 35).
Hypothesis 11 stated that there would be no significant difference
between persisters and dropouts with regard to marital status. A chi-
Table 35
Results of T-Test for Hypothesis 10: Difference in Self-Reported Scores
of Persisters and Dropouts With Regard to Number of Years Needed to
Graduate
Group 1 Group 2 F Pooled Variance Separate Variance M ean Mean Value Prob, _L_ Prob, _L_ Prob,
1.4731 1.8586 1.11 .564 -2.65 .008* -2.72 .007
‘Indicates a significant difference at Alpha <.05.
Group 1, persisters. Group 2, dropouts.

98
square test w as conducted with a resultant significance value of .21925.
The null hypothesis was retained for the marital status factor (Table 36).
Hypothesis 12 stated that there would be no significant difference
between persisters and dropouts with regard to occupational status
Table 36
Results of Chi-square Test for Hypothesis 11: Difference in Self-Reported
Scores of Persisters and Dropouts With Regard to Marital Status
.Qrqup , Marital status____ Total
Single Married
Persisters 178 132 310
74% 75% 74%
Dropouts 63 43 106
26% 25% 26%
Column total 241 175 416
Percent 100% 100% 100%
Chi-square = 3.035; p >.05.

99
before enrollment in adult high school. A chi-square test w as conducted
with a resultant chi-square of 4.5251 and a p-value of .3396. The null
hypothesis w as retained for this factor (Table 37).
Table 37
Results of Chi-square Test for Hypothesis 12: Difference In Self-
Reported Scores of Persisters and Dropouts With Reoard to
Occupational S tatus Before Enrollment
Group Occupational status TotalSkilled Unskilled
Unemployed Employment Employment Other
Persisters 69 92 85 60 306
70% 78% 74% 75% 74.3%
Dropouts 29 26 30 20 106
30% 22% 26% 25% 25.7%
Column total 98 118 115 80 412
Percent 100% 100% 100% 100% 100%
Chi-square = 4.5251; p >.05.

100
Hypothesis 13 stated that there would be no significant difference
between persisters and dropouts with regard to annual personal income
In the year preceding enrollment in adult high school. A chi-square test
w as conducted to determine if a significant difference existed for this
factor. The chi-square value was 1.657 with a significance of .437. The
null hypothesis was retained for the annual personal income of
respondents (Table 38).
Hypothesis 14 stated that there would be no significant difference
between the independent variable scores (performance focus and
efficiency, goal directedness, timeliness of task accomplishment,
organization of physical space, written plans for change, verbal support
for self-management, age, gender, race, number of years needed to
graduate, marital status, occupational status, annual income) and
persistence. A discriminant analysis was conducted to determine if self
reported scores on the LSA could be used to accurately classify
individuals a s persisters or dropouts. For purposes of this test, 348 cases
w ere processed--258 persisters and 90 dropouts. Comparisons of
m eans for the two groups showed that persisters scored higher on five of
the six factors identified a s subscales on the LSA: performance focus
and efficiency, goat directedness, timeliness of task accomplishment,

101
organization of physical space, and written plans for change. Only with
regard to verbal support for self .management did the m ean score for
dropouts exceed the score for persisters (Table 39).
Table 38
Results of Chi-sauare Test for Hypothesis 13: Difference in Self-
Reported Scores of Persisters and Dropouts With Regard to Annual
Personal Income
Group Income Total
<$5000-$9999 $10000*$24999 >$25000
Persisters 158 117 18 293
73% 74% 86% 74%
Dropout 59 41 3 103
27% 26% 14% 26%
Column total 217 158 21 396
Percent 100% 100% 100% 100%
Chi-square = 1.657; p >.05.

102
Hypothesis 14 stated that there would be no significant difference
between the Independent variable scores (performance focus and
efficiency, goal directedness, timeliness of task accomplishment,
organization of physical space, written plans for change, verbal support
for self-management, age, gender, number of years needed to graduate,
and annual income) and persistence. A discriminant analysis was
conducted to determine If self reported scores on the LSA could be used
to accurately classify individuals a s persisters or dropouts. For purposes
of this test, 348 cases were processed--258 persisters and 90 dropouts.
Comparisons of m eans for the two groups showed that persisters scored
higher on five of the six factors identified a s subscales on the LSA:
performance focus and efficiency, goal directedness, timeliness of task
accomplishment, organization of physical space, and written plans for
change. Only with regard to verbal support for self m anagem ent did the
m ean score for dropouts exceed the score for persisters (Table 39).
included in the comparison of mean scores were demographic
factors. Dropouts were two years older than persisters on the average;
had more years to go until graduation than persisters; and had a slightly
lower income level than persisters. More persisters were married and
had slightly higher rates ol prior enrollments into adult programs. The

103
Table 39
Comparison of Mean Scores of Dropouts and Persisters With Regard to
Factors Identified a s Subscales and Demographic Variables of the Life
Style Approaches (LSA) Scale
Mean score
Subscale factor__________ Persisters Dropouts
Performance focus and efficiency 12.81 11.50
Goal directedness 12.31 11.56
Timeliness of task accomplishment 10.67 10.37
Organization of physical space 9.21 8.81
Written plans for change 4.90 4.01
Verbal support 5.95 5.96
Mean score
Demographic Variable________ Persisters Dropouts
Birth year 65.86 67.21
Years to graduation 1.46 1.87
Previous enrollment in similar programs 3.34 3,30
Income 2.64 2.42
104
comparative m eans for demographic variables and LSA factors are also
compiled In Table 39,
A further analysis included In the discriminant function w as the
standardized discriminant function and the Wilks' Lambda (u statistic).
The Wilks' Lambda significance results confirmed the test
findings for Hypotheses 1 and 10. A significant difference existed
between persisters and dropouts for performance focus and efficiency
and the number of years needed to graduate. Additionally, the Wilks'
Lambda test showed a significant difference between persisters and
dropouts with regard to written plans for change, which w as not the case
with the results of the t-test for independent means. The difference in
results of the two testing strategies may be explained by the fact that in
the discriminant analysis, 71 fewer cases were used because they did
not contain data on all of the factors tested in each individual case (Table
40).
A comparison of the predicted classification of persisters and
dropouts w as conducted In the analysis. It w as found that only 63.51 % of
the grouped c ase s were correctly classified a s determined by m ean
scores on all variables of the LSA. Based on these results, it was
determined that the scores on the LSA for these groups w as not sufficient

105
justification for predicting dropout or persistence solely on the basis of
the instrument (Table 41).
Table 40
Standardized Discriminant Function Coefflctents and Wilks’ Lambda for Each Subscale
Factor and Demographic Variable ol the Ufa Style Approaches fLSAI Scale
Factor . Function _ Wilks'Lambda f Slanlflcance
Performance focus and efficiency .42938 .98541 5.124 .0242*
Goal directedness .12934 .99026 3.404 .0659
Timeliness of task accomplishment -.18566 .99851 .5168 .4727
Organization of physical space .00482 .99628 1.291 .2567
Written plans for change .51386 .98525 5.181 .0234*
Verbal support -.16745 1.00000 .8512E-03 .9767
Birth year -.22421 ,997071 1.038 .3090
Gender -.05900 .99996 .1559E-01 .9010
Years to graduate -.64362 ,98026 6,969 .0087*
Income .14866 .99646 1.229 .2684
‘Significant difference at < .05.

106
Table 41
Prediction of Group Classification Based on Mean Scores of the Life
Styles Approaches fLSAt Scale
Predicted group membership Actual group B oa se s Q m ztl _ % . G roup2 % _
1. Persisters 258 169 65.5 89 34.5
2 . Dropouts 90 38 42.2 52 57.8
Grouped c ase s correctly classified: 63.51%

107
CHAPTER 5
SUMMARY, FINDINGS, CONCLUSIONS,
AND RECOMMENDATIONS
Chapter 5 contains summary, findings, conclusions, and
recommendations based on the results of this study.
Summary
No data existed on characteristics of life style m anagem ent a s
related to persisters and dropouts among adult high school students In
the state of Tennessee. Five hundred fifty-nine persisters and 868
dropouts were surveyed by mail, by telephone, or by school site visits.
There were 419 participants in the study, 311 persisters and 108
dropouts. The research was descriptive in nature and utilized data
gathered from a survey instrument entitled Life Style Approaches fLSAl
Scale. Six self m anagem ent strategies were identified in the 22-item
instrument, and respondents were asked to report to what degree each
item w as or w as not similar to their life styles.
One thousand six hundred fifty-four surveys were delivered with
419 responses, which represented a 25% rate of return. The low rate of
return w as due to the transient nature of this group of people. Three
hundred forty-three surveys were returned with no forwarding address.

108
The researcher attempted to match 211 nam es and addresses of
non respondents in telephone directories, and all except 15 subjects
were either not listed or their phones had been disconnected.
Respondents reported their perceptions of how they approached
self m anagem ent In the following areas: performance focus and
efficiency, goal directedness, timeliness of task accomplishment,
organization of physical space, written plans for change, and verbal
support for self-management. Demographic data gathered on dropouts
and persisters included age, gender, race, number of years needed to
graduate, marital status, occupational status before enrollment, and
annual personal Income. A discriminant analysis w as conducted to
determine if the instrument, Life Stvle Approaches fLSAI Scale, had
predictive value in determining whether or not a high school completion
program applicant would persist to completion of a program once
enrolled.
Findings
The findings were divided Into two sections: demographics and
the findings a s a result of hypothesis testing. Seventy-three percent of
respondents were born after 1960, and the majority of both the persister
and dropout groups were born after that date. However, dropouts tended

109
to be younger than persisters. Both groups contained more than twice
the number of fem ales than males, and 88% of both groups were
Caucasian. Fifty-etght percent of the persisters reported having one year
or less until graduation, and 39% of dropouts reported having one year
or less to graduate. Approximately one-fourth (26%) of respondents had
not enrolled in GED or HSC programs prior to enrollment in adult high
school.
Forty-five percent of respondents were single, and 42% were
married. Twenty-three percent were unemployed, and 55% were
em ployed-28% being employed In skilled jobs. More persisters than
dropouts were employed in skilled jobs, and more of the dropouts were
unemployed at the time of program entry. Thirty-one percent of
respondents earned less than $5,000, and the mean income fell in the
$10,000 to $14,999 range. Total annual incomes ranged from $5,000 to
$40,000. The mean annual income for persisters was $7,319, and the
m ean annual income for dropouts w as $6,580. Sixty-six percent ol the
graduates reported non-entry into post-secondary programs; however, of
the graduates who reported entry into post-secondary programs, 70%
chose two-year colleges and 9% chose four-year colleges.

Hypothesis 1 stated that there would be no significant difference
between the self-reported scores of persisters and dropouts on
performance focus and efficiency, Factor 1 of the LSA. Performance
focus and efficiency reflects self-reported skill in judging what is
important to do at any given time and then maintaining on that task until it
Is completed, A t-test of Independent m eans (pooled variance) w as
conducted with a resultant two-tailed probability of pooled variance
estim ate of .022, The null hypothesis was rejected at the ,05 level of
confidence. A difference does exist between persisters and dropouts on
performance focus and efficiency in that persisters scored significantly
higher than dropouts for this particular factor.
Hypothesis 2 stated that there would be no significant difference in
the self-reported scores of persisters and dropouts on goal directedness,
Factor 2 of the LSA. Goal directedness represents individuals'
perceptions of whether their actions are guided by clearly defined
priorities and goals. A t-test of independent m eans (separate variance)
w as conducted and a resultant significance variance estimate of .057
was found. At the .05 level of confidence, the null hypothesis was
retained.

Hypothesis 3 stated that there would be no significant differences
in the self-reported scores of persisters and dropouts on timeliness of
task accomplishment. Timeliness of task accomplishment relates to the
self-reported tendency to initiate work on a task and move through the
task in a timely fashion. A t-test of independent m eans (pooled variance)
w as conducted with a resultant two-tailed probability of pooled variance
estim ate of .316. At the .05 level of confidence, the null hypothesis w as
accepted.
Hypothesis 4 stated that there would be no significant difference in
the self-reported scores of persisters and dropouts on organization of
physical space, Factor 4 of the LSA. Organization of physical space
m easures the extent to which individuals reported keeping their work and
living space organized, clean, and attractive. A t-test for Independent
m eans (pooled variance) was conducted with a resultant two-tailed
probability of pooled variance estimate of .088. At the .05 level of
confidence, this result was insufficient to reject the null hypothesis.
Hypothesis 5 stated that there would be no significant difference in
the self-reported scores of persisters and dropouts on written plans for
change, Factor 5 of the LSA. Written plans for change a sse s se s the self-
reported practice of writing down goats and plans for change. A t-test for

112
Independent m eans (pooled variance) with a resultant two-tailed pooled
variance estimate of .107 proved insufficient to reject the null hypothesis.
Hypothesis 6 stated that there would be no significant difference in
the self-reported scores of persisters and dropouts on perceived verbal
support for self-management, Factor 6 of the LSA. This factor indicates
whether or not one uses verbal support from others in self-management.
A t-test for independent m eans (pooled variance) was conducted, and a
resultant two-tailed probability of pooled variance estimate w as .904.
The null hypothesis w as retained.
Hypothesis 7 stated that there would be no significant difference
between persisters and dropouts with regard to age. A chi-square test
w as conducted, and the chi-square value of 3.1 exceeded the critical
value of .05; therefore, the null hypothesis w as retained.
Hypothesis 8 stated that there would be no significant difference
between persisters and dropouts with regard to gender. A chi-square
test w as conducted, and the resultant chi-square was 1.51 with a p-value
of .698. The null hypothesis was retained.
Hypothesis 9 slated that there would be no significant difference
between persisters and dropouts with regard to race. A chi-square test
was conducted with a resultant chi-square value of .135 and a p-value of

113
.715. Based on the .05 level of confidence, the null hypothesis w as
retained.
Hypothesis 10 stated that there would be no significant difference
between persisters and dropouts with regard to number of years needed
to graduate. A t-test for independent m eans (pooled variance) w as
conducted, and a two-tailed probability of pooled variance estim ate of
.008 w as sufficient to reject the null hypothesis based on a .05 level of
confidence.
Hypothesis 11 stated that there would be no significant difference
between persisters and dropouts with regard to marital status. A chi-
square test was conducted, and the value of 3.035 and the p-value of
.219 proved insufficient evidence to reject the null. The null hypothesis
was accepted.
Hypothesis 12 stated that there would be no significant difference
between persisters and dropouts with regard to occupational status
before enrollment in adult high school. A chi-square test w as conducted
with a resultant chi-square value of 4.575 and a p-value of .339. The
result w as Insufficient to reject the null hypothesis.
Hypothesis 13 stated that there would be no significant difference
between persisters an dropouts with regard to annual personal income in

114
the year preceding enrollment In the adult high school. A chi-square test
w as conducted with a resultant chl-square value of 1.657 and a
significance of .437. The null hypothesis was accepted.
Hypothesis 14 stated that there would be no significant difference
between the independent variable scores (performance focus and
efficiency, goal directedness, timeliness of task accomplishment,
organization of physical space, written plans for change, verbal support
for self-management, age, gender, race, number of years needed to
graduate, marital status, occupational status, annual income) and
persistence. To test this hypothesis a discriminant analysis w as
conducted to determine If subjects could be accurately classified a s
persisters or dropouts based solely on the m ean scores of the Life Stvle
Approaches fLSAl Scale. The percent of grouped cases correctly
classified w as 63.51%. Based on the result, it was determined that the
self-reported mean scores on the instrument were not sufficient to justify
classification of individuals a s persisters or dropouts. The Instrument
scores alone should not be the only parameter In screening for
persistence or dropout from high school completion programs.
Additional da ta such a s the Wilks' Lambda and the discriminant function
coefficients confirmed the hypotheses testing results. Performance focus

115
and efficiency and years needed to graduate showed the higher
coefficients and were also significant at the .05 level using the Wilks'
Lambda (u statistic). One difference was noted in that the Wilks' Lambda
and a high standardized coefficient indicated a significant difference
between persisters and dropouts with regard to written plans for change.
This did not confirm the t-test result because 71 fewer c a se s were used in
the discriminant function analysis.
Conclusions
Based on the results of the study, the following conclusions are
proposed:
1. Persisters tend to score higher on all except one of the
subscale factors of the Life Style Approaches fLSAt Scale, and that w as
verbal support for self-management.
2. Dropouts a re slightly younger than persisters.
3. The distance to goal a s m easured by the number of years to
graduation is higher for dropouts than for persisters.
4. Self-efficacy, a s measured by the performance focus and
efficiency factor of the LSA, is greater for persisters than dropouts.
5. There Is little difference between dropouts and persisters with
regard to whether one keeps work and living a reas well organized.

116
6 . The majority of adult learners perceive them selves a s having a
clear sense of what behaviors would be right and wrong for them.
7. Adult learners have difficulty deciding what Is most Important to
do when confronted with many things to do. Additionally, when they do
decide what Is most Important, the majority begin right away on the task.
However, adult learners are easily sidetracked from that action plan, and
have difficulty returning to the activity.
6. Adult learners do not tend to write down plans and goals for
behavioral changes, although the majority state that they have a clear
sen se of what they want to experience In their life.
9. Most adults complete tasks in a timely fashion.
10. Gender of individuals Is not a factor in persistence.
11. The annual personal income for persisters is higher than that
of dropouts, but about one-half of adult high school students earn less
than $9,000 a year.
12. The majority of adult students in T ennessee are employed,
and about 3 out of 10 can be classified a s skilled laborers.
13. The self-reported mean scores on the Life Stvle Approaches
fLSAI Scale should not be used a s the sole source for predicting
whether or not an enrol lee will drop out of programs before completion.

117
14. Marital status is not a factor in persistence.
Recommendations
The following recommendations are m ade for further research:
1. A study of persistence and dropout using qualitative techniques
should be conducted to investigate this subject In more detail than Is
possible quantitatively.
2. More research on the notion of self efficacy and its relationship
to self-esteem should be conducted for adult (earning.
3. Local school system s and the T ennessee Department of
Education should establish accurate records and follow-up studies of
adult learners.
4. This study should be expanded to a larger population of adult
learners and the Life Stvle Approaches (LSAI Scale administered and
tested for predictive value.
5. When research efforts are attempted, more cooperation Is
needed for HSC directors to furnish necessary information to those
research efforts so that more data can be added to the body of
knowledge in this area.
6. A concerted effort by HSC personnel should be m ade to
develop more effective teacher/coach relationships with students so that

118
opportunity for success is increased, self-motivation is enhanced, and
resultant self-efficacy is internalized.
7. HSC programs should include a combination of didactical,
small group problem solving, and computer aided instructional
techniques to m ake up the delivery system.
8. HSC curriculums should include, in addition to Carnegie unit
Instruction, techniques of self management such a s those described in
this study, communication skills, and problem solving skills geared for the
workplace.
I

REFERENCES

REFERENCES
Anderson, Richard E.p & Darkenwald, Gordon G. (1979). Implications for
public .policy andJuture research from a multivariate analysis of a
national data base . (ERIC Document Reproduction Service No.
023221).
Bandura, Albert. (1977, March). Persistence in activities that are
subjectively threatening. Psychological Review. 84 (31.191-215.
Bandura, Albert. (1982, February), Self-efficacy mechanism in human
agency. Psychological Review. 37 (21,122-147.
Bean, Rita M., Partanen, Jane, Wright, Frances, & Aaronson,Judith.
(1989). Attrition in urban basic literacy programs and strategies to
Increase retention. Adult literacy and Basic Education. 12, (3),
146-154.
Beder, Hal. (1990). Reasons for nonparticipation In adult basic
education. Adult Education Quarterly. 40.207-218.
Beiz, Elaine. (1984). Educational therapy: A model for the treatm ent of
functionally illiterate adults. Adult Education Quarterly. 25, (2), 96-
104.
Blmbaum, Marilyn E. (1990). Predicting persistence In adult high
schools: Motivational, situational, and demographic influences.

121
(Doctoral dissertation, Rutgers University).
Boshier, Roger, & Collins, John B. (1985). The Houle typology after
twenty-two years: A large scale empirical test. Adult Education
Quarterly. 35.113-130.
Brockett, Ralph. (1985). The relationship between self-directed learning
readiness and life satisfaction among older adults. Adult
Education Quarterly. 35 (41210-219.
Chlsman, F. P. (1989). Jump start: The federal role In adult literacy.
Southport, CT: Institute for Policy Analysis.
Church, A. Timothy. (1992, October). Self-efficacy for careers and
occupational consideration in minority high school equivalency
students. Journal of Counseling Psychology. 22 (4), 498-508.
Colli, Elizabeth J. (1987). An ethnographic study of perceptions of
dropouts from an alternative high school program. (Doctoral
dissertation, University of Connecticut, 1987). Dissertation
Abstracts. 48.1595.
Collins, Michael, (1987). Competence In adult education: A new
perspective. Lanham, MD: University Press.
Conti, Gary J. (1990). Book review. Adult Literacy and Basic Education.
14, 259.
122
Conti, Gary J , (1985). The relationship between teaching style and adult
learning style. Adult Education Quarterly. 35 (4), 220*228.
Cowburn, Will. (1986). Ideology and community education. Wolfeboro,
NH: Croom Helm.
Crlner, Linda A. (1990). Self-concept development: A teacher's task.
Adult Literacy and Basic Education. 14 (2), 124-135.
Cross, K. Patricia. (1981). Adults a s learners. San Francisco,
Washington, & London: Jossey-Bass.
Darkenwald. Gordon G. (1983). Perspectives of business and Industry
on cooperative programming with educational Institutions. Adult
Education Quarterly. 33,230*243.
Darkenwald, Gordon G. (1981). Retaining adult students. (Information
Series No. 225). (ERIC Document Reproduction Service No.
205773).
Darkenwald, Gordon G., & Gavin, W. J. (1987). Dropout a s a function of
discrepancies between expectations and actual experiences of
the classroom social environment. Adult Education Quarterly. 37.
152-163.
Darkenwald, Gordon G., & Merriam, Sharan B. (1982). Adult education:
Foundations of practice. New York: Harper & Row.

Darkenwald, Gordon G., & Valentine, T. (1985). Factor structure of
deterrents to public participation in adult education. Adult
Education Quarterly, gg, 177-193.
Davis, Peggy. (1989). Caution: Human beings here! Handle with care I
Confidence builders for adult learners. Adult Literacy and Basic
Education. 13111.1*6.
DeWitt, John. (1989). Power behind the screen. Adult Literacy and
Basic Education. 1 5 (1). 28-33.
Dilllon, Connie L.,‘ & Kincade, Kay M. (1990). Interaction, technology,and
the adult basic education student. Adult Literacy and Basic
Education. 14 <31.184-197.
Dole, Elizabeth. (1990). Help wanted: Skills for th e '90s. Human
Capital. 56.101*102.
Ehring, Howard A. (1982). Implications of high school dropouts1
perceptions of adult basic education programs for the improvement
of instruction. (ERIC Document Reproduction Service No.
8303096).
Fairgrleve, Jean E., & Jimmerson, Ronald M. (1988). Counseling in
adult basic education programs: Instructors speak out. Adult
Literacy and Basic Education. 12(31.121-134.

124
Finger, M. (1990). New social movements and their Implications for adult
education. Adult-Education-Quarterly. 4Q, 15-22.
Garrison, D. R. (1986). A deductively derived and empirically confirmed
structure of factors associated with dropout in adult education.
Adult Education Quarterly. 2S, 199-210.
Garrison, D. R. (1967). Dropout prediction within a broad psychosocial
context: An analysis of Boshler’s congruence model. Adult
Education Quarterly. 2Z. 212-222.
George, L. K. (1979). The happiness syndrome: Methodological and
substantive issues In the study of social psychological well-being
In adulthood. Gerontologist. 12, 210-216.
Gower, Mike. (1992). 1990*91 annual report of dropouts. (Tennessee
State Department of Education), January 31,1991.
Harman, David, (1987). Illiteracy: A national dilemma New York:
Cambridge.
Harris, T. George, & Trotter, Robert J. (1989). Work smaller, not harder.
Psychology Today, 22, (2), 33.
Horton, Myles, Kohl, Judith, and Kohl, Herbert. (1990). The Iona haul.
New York: Doubleday.
Irish, G. (1978). Persistence and dropout in adult education: Their

relation to differential reinforcement of attendance. (Doctoral
dissertation, Columbia University, 1978). Dissertation
Abstracts. 3 9 .1993A.
Justiz, Manuel J., & Kameen, Marilyn C. (1987). Business offers a hand
to education. Phi Delta Kaooan. §& 397-383.
Kazemek, Francis E. (1988). The self a s social process: The work of
George Herbert Mead and its implications for adult literacy
education. Adult Literacy and Basic Education. 12, (1), M 3 .
Kirsch, Irving. (1982). Efficacy expectations on response predictions.
Journal of. Personality,and Social Psychology. 142(1).
Knowles, Malcolm S. (1989). The making of an adult educator. San
Francisco: Jossey-Bass.
Kozol, J. (1985). Illiterate America Garden City, NY: Anchor P ress/
Doubleday.
Kozol, J. (1980). Prisoners of silence. New York: Continum.
Lakes, D„ & Lewis, Linda H. (1990). Literacy and the black church: A
demonstration project in Connecticut, Adult Literacy and Basic
Education. 14, (2), 65-75.
Lindeman, E. (1989). The meaning of adult education. Norman, OK:
Harvest House.

Mager, Robert F. {1992, April). No self-efficacy, no performance.
Training. 2g (4), 32-26. ■
Martin, L. (1983). Achievement motivation training's effect on
psychosocial self-perceptions. Adult Literacy and Basic
Education. (3), 86-93.
Martin, Larry G. (1990). Dropout, persistence, and completion in adult
secondary and prevocatlonal education programs. Adult Literacy
and Basic. Education. 14, (3), 159-174.
Martin, Larry Q. (1987). Life style classifications of adult high school
noncompleters. Adult Education Quarterly. 41.32-45.
McCullough, Ken. (1993, April). Unpublished memorandum to
T ennessee superintendents from Tennessee Department of
Education director of adult education.
Moore, Carol A. (1991). A Validity Assessm ent of a Self-Report Scale of
Self-Management Practices. (Doctoral dissertation, University of
Tennessee).
Morgan, Mary Lee. (1989). Noninstructlonal adult literacy centers. Adult
literacy and basic education. 13 (1). 56-59.
Norusis, M. J . (1988). Statisticalpackaae tor the social sciences
ISPSS/PC+ Studentware). Chicago: SPSS.

Norusis, M. J. (1990). Statistical package for the social sciences
fSPSS/PC+ statistics 4.01. Chicago: SPSS.
Rachal, John R. (1985). The computer In the ABE and GED classroom:
A review of the literature. Adult Education Quarterly. 35 (2), 86*95.
Richardson, Judy S. (1988). Networking for adult literacy: A position
statement. Adult Literacy and Basic Education. 12, (1), 27-32.
Roberts, David R. (1991). Participant characteristics and perceptions
of a basic skills dropout prevention program. (Doctoral
dissertation, University of Tennessee, December, 1991).
Rockhill, Kathleen. (1982). Researching participation in adult education:
The potential of the qualitative perspective. Adult Education. 33
(1), 3-19.
Scanlan, Craig S., & Darkenwald, Gordon G. (1984). Identifying
deterrents to participation in continuing education. Adult
Education Quarterly. 34,155*166.
Schurr, Cathleen. (1992, July/August). Chautauqua: Yesterday and
today. American History Illustrated. 27,40-45.
Spear, George E., & Mocker, Donald W. (1984). The organizing
circumstance: Environmental determinants in self-directed
learning. Adult Education Quarterly. 35(1). 1-10.
Strange, Sherman M. (1986). Unrestraining liberty: Adult education and
the empowerment of persons. Adult Education Quarterly. 3£, (3),
123-129.
Thlstlethwaite, Linda. (1989). Reading, writing, and cooperative
learning in a JTPA summer program. Adult Literacy and Basic
Education. 13 (2). 81-98.
Tracy-Mumford, Frances Diana (1990). The effect of a student
Identification/intervention support system on decresina the dropout
rate of adults enrolled in an adult hlah school program. (ERIC
Document Reproduction Service No. 9031005).
Valentine, Thomas, & Darkenwald, Gordon G, (1990). Deterrents to
participation In adult education: Profile of potential learners. Adult
Education Quarterly. £L 29-42.
Williams, Robert L„ Moore, Carol A., Pettibone, Timothy J., & Thomas,
Sandra P. (1992). Construction and validation of a brief self-
report scale of self-management practices. Journal of Research In
Personality, gg, 216-234.
Williams, Robert L„ & Long, J. D, (1991). Manage vour life (4th ed.).
Boston: Houghton Mifflin.
Zimmer, Carl. (1993, September). Tutor by computer. Discover. 36.

APPENDICES

APPENDIX A
Letter to Adult High School Directors
Requesting List of Student Names and Addresses
130

BOARD OF EDUCATIONGARY CHESNEY, Chairman CLYDE KINDER, Vice Chairman JOE GIBSON, SR.ROGER GREENE
BOARD OF EDUCATIONERNIE HORNER
HAROLD ROUSE ANNIE MAE SPOONE
Dr. Emmm WaUur, Supcrint$mUnt
May 17,1994
Dear Fellow Educator;
As you well know, the dropout rate of enrollees in Tennessee adult high schools averages 50% or higher I am currently studying the extent of persistence of students who are enrolled In adult high schools across the state of Tennessee as a part of my doctoral dissertation at East Tennessee State University, and I need your help.
First, would you please send me, In the enclosed self-addressed, stamped envelope, a list of names and addresses of those students who enrolled In your program during the 1992-93 school year who either have maintained enrollment or graduated from your program. Secondly, please Include a separate list of those students who have enrolled in your program during the 1992-93 school year who have dropped out for one reason or another. Thirdly, would you please let me know it your school Is In operation during the summer months.
I intend to send each student a survey concerning life style approaches, then tabulate data to see if self efficacy is an Issue with dropouts and persistence. Perhaps the Instrument can then be used with new enrollees to see It they are candidates for dropping out.
I appreciate your help in this study and will be glad to share the results with you H you desire.
Sincerely,
Sam ShepherdAssistant Superintendent & Principal of Aduit High School
SS/ag
Enclosure
310 Sait Monk Boulevard • Morristown, Tenneuee 37813 • (615)586-7700

APPENDIX B
Letter to Students
Requesting Participation In Survey
132

BOARD OF EDUCATIONGARY CHESNEY, Chairman CLYDE KINDER, Vica Chairman JOE GIBSON, s a ROGER GREENE
BOARD OF EDUCATION ERNIE HORNER
HAROLD ROUSE ANNIE MAE SPOONE
Earnest Walker, Superintendent
Dear Adult High School StudentiMy name Is Sam Shepherd, and I work in the Hamblen County School System in Morristown, TN. Some of my responsibilities include the Adult High School. I want to congratulate you for deciding to return to school and earn your diploma. Deciding to do this was an important step in your future, and you have been selected to take part in a very important study. The dropout rate in Adult High Schools is high, and I am doing a study to find out if staying in school is related to people's life management approach. This letter will go to graduates, those still in school, and those who have dropped out for one reason or another. I am doing this study as part of my school work at ETSU in Johnson City.The survey that is enclosed with this letter won't take long for you to complete. Please read each question and answer it as best you can and as honestly as you can. You are not required to answer all questions if you don’t want to. Seal the survey in the enclosed envelope and send it back to me. No one except me will see your answers, and there are no risks to you involved. You will help program planners design better adult high school programs by participating in this study.Your participation is voluntary, and by completing and returning the survey you are saying you want to help and that it's OK for your answers to be used as a part of this study. Your answers will be part of a large group of data and not identified separately. The surveys are marked only to determine who has and has not replied. I am the only person who will know who returned the survey. Any information you provide will be strictly confidential, and the data will be maintained in a locked file in my home for a period of ten years before it is destroyed.
Thanks so much for your help, and if you have any questions about this survey you may contact me at (615) 586-7700.Thanks again,
210 East Morris Boulevard • Morristown, Tennessee 37813 • (615)586-7700
Sam Shepherd Assistant SuperintendentSJS/awEnclosures

BOARD OF EDUCATIONGARY CHESNEY, Chairman CLYDE KINDER Vic* Chairman JOE GIBSON, SR ROGER GREENE
BOARD OF EDUCATIONERNIE HORNER
HAROLD ROUSE ANNIE MAE SPOONE
Earnest Walker, Superintendent
Dear Adult High School Student/Graduate*A few days ago X mailed a survey form to you requesting your help in an important study. I have not heard from you yet, but your help is very Important to complete this study. It concerns the life style approaches of adults who have attended Adult High Schools in Tennessee. Information from you will be compiled to help educators provide better programs for adults working on their high school diplomas.If you have questions about the study or are not sure about whether to participate, let me assure you that your answers will be put into a large data base and not be identified separately. Nobody will know how you responded on the survey, and these answers are strictly confidential. If you have doubts, questions, or comments, please call me at (615) 586-7700 from 6 1OO a.m. until 4t30 p.m., or (615) 586-4475 after 5t00 p.m.The code on the survey is there to help identify those who have not sent the survey back.
Won't you please complete the enclosed survey and return it to me in the self addressed stamped envelope as soon as possible.
I appreciate your help.
Sincerely,
Sam J. shepherd Assistant SuperintendentSJS/aw
210 Ease Morris Boulevard • Morristown, Tennessee 37813 • (615)586-7700

APPENDIX C
Survey Instrument/Scoring Guide
135

BIOGRAPHICAL DATA
DIRECTIONS: Please read the following questions carefully and check In the appropriate blank. Your answers will be kept confidential and used only for purposes of describing life style situations.
Birth year: ____________
Gender: ___ r r d s female
Race:_______ ___ VWe Bteric Heparic other
Number of years needed to graduate:
Have you attended another adult high school or GED program before entering this one? V® no
If yw; please write the name of ttie school: _________________________________
Marital status: srx^e marled
, OWDfDBD
other (widowed, separated)
Occupational status before enrollment in adult high school: unemployed (looking for work) unemployed (not seeking work) employed as a skied worker employed as an unskied worker homemaker c*ienF*0flBespedfy;_________________
Which category below corresponds most closely to your annual personal Income? under $ 5,000 $25,000 * $29,999 $ 5,000 - $ 9,000 $30,000 * $34,999 $10,000 - $14,999 $35,000 * $39,999 $15,000 - $19,999 $40,000 + $20,000 * $24,999
FOR GRADUATES ONLY: Have you enrolled In another educational program since you graduated?
V® no
If you checked yes, please mark the appropriate category below: two-year oolege technical school four-year cottage ___ ottw

LIFE STYLE APPROACHES (LSA) SCALE
DIRECTIONS: For each of the following Hems, indicate how different or how similar that Hem is to your life style. Use the following scale:
(A) Verv.differentfrom me(B) Somewhat different from me(C) Uncertain(D) Somewhat similar to me(E) Very similar to me
Simply indicate your answer for each item by placing the appropriate letter in the blank before that Item.
1. In most situations, I have a dear sense of what behaviors would be right orwrong for me.
2. When confronted with many different things to do, I have difficulty deddlngwhat Is most important to do.
3. After making a decision about what Is most important to do at any given time, Ieasily get sidetracked from that activity,
4. Once I decide what Is most Important to do at any given time, I start on that taskrfghtaway.
5. I write down the pros and cons of any behavior change I am considering,
6. I have difficulty Judging how long It will take me to complete a task.
7. I seldom analyze what I am saying to myself regarding problem areas In life.
8. I have written down my Gfe goals.
9. When I begin a personal change project, I generafly keep my plans to myseif.
10. I keep my work space well organized.
11. I have a dear sense of what I most want to experience In my Pfe.
12. I seldom ask for feedback from others about behaviors I need to change andhow best to change those behaviors.

LIFE STYLE APPROACHES (LSA) SCALE (continued)
___ 13. I complete tasks at the time I say I'm going to complete them.
___ 14. 1 seldom write down my yearly goals.
___ 15. I'm confused as to the kind of personal qualities 1 want to develop In my (He.
___ 18. 1 have difficulty matching various tasks with my energy level.
___ 17. 1 subdivide big tasks Into a series of smaller tasks.
___ 18. 1 have little idea as to what 1 most want to achieve in my life.
___ 19. 1 actively work to make the place where 1 spend a lot of time more attractive.
___ 20. 1 complete major tasks well In advance of deadlines.
___ 21. When 1 deviate from my selected goal, 1 have a hard time getting back on track.
___ 22. My living space Is quite messy.
COMMENTS YOU WOULD LIKE TO MAKE ABOUT YOUR ADULT HIGH SCHOOL EXPERIENCE (OPTIONAL):

SCORING PROCEDURES FOR LSA
For the positive items (+), use the following scale In recording your response:
A = 0, B = 1, C = 2, D = 3, E = 4. For the negative items (-), use the following scale In
recording your response: A = 4, B = 3, C = 2, D = 1, E = 0.
Factor 1 (Performance Focus and Efficiency):* 2 ________________________
• 3 ________- 6 _______________
-18 ________*21 ________
Factor 1 Total ________
Factor 2 (Goal directedness)+ 1 _________
+11 _________
•15 ________-18 ________
Factor 2 Total
Factor 3 (Timeliness of Task Accomplishment)+ 4 ________+13 ________+17 ________+20 _________
Factor 3 Total

SCORING PROCEDURES FOR LSA (continued)
Factor 4 (Organization ot Physical Space)+10 _______
+19 ______-22 ______
Factor 4 Total
Factor 5 (Written Plans for Change)+ 5 ______+ 8 ________
-14 ______Factor 5 Total
Factor 6 (Verbal Support)- 7__________- 9___ ________
-12 ______Factor 6 Total
GRAND TOTAL of Factor Totals (your total score on LSA)

4
APPENDIX D
Life Style Approaches (LSA) Scale
Checklist for Pilot Study
141

C H ECK LISTFO R
LIFE STYLE APPROACHES (LSA) SCALE
DIRECTIONS: In the blank provided, please check any question students encountered difficulties interpreting or understanding on the survey Instrument being piloted at your location. Place appropriate comments In the blanks provided below.
BIOGRAPHICAL DATA
Birth Year
Gender
Race
Years to Graduate
Other Programs Attended
Marital Status
. Occupational Status
Annual Personal Income
Other Programs After Graduation
LSA
----- 1 ___ 9 ----- 16
- 2 ___ 10 ■ 17
----- 3 ___ 11 ----- 16
------ 4 ___ 12 . ------ 19
----- 5 ___ 13 ----- 20
------ 6 ___ 14 . . . 21
— 7 ___ 15 ------ 22
8
COMMENTS

APPENDIX E
Positive and Negative Statem ents
on the Life Style Approaches (LSA) Scale
143

LIFE STYLE APPROACHES (LSA) SCALE POSITIVE/NEGATIVE STATEM ENTS
POSITIVE STATEMENTS
1. In most situations, I have a dear sense of what behaviors would be right or wrong for me.4. Once I decide what is most important to do at any given time, I start on that task right away.5. I write down the pros and cons of any behavior change I am considering.8. I have written down my life goals.
10. I keep my work space well organized.11.1 have a clear sense of what I most want to experience in my life.13. I complete tasks at the time i say I'm going to complete them.17. I subdivide big tasks into a series of smaller tasks.19.1 actively work to make the place where I spend a lot of time more attractive.20. I complete major tasks well In advance of deadlines.
NEGATIVE STATEMENTS
2. When confronted with many different things to do, I have difficulty deddlng what is most ■ important to do.
3. After making a decision about what is most Important to do at any given time, I easily get sidetracked from that adlvity.
6. I have difficulty Judging how long it will take me to complete a task.7. i seldom analyze what I am saying to myself regarding problem areas in life.9. When I begin a personal change project, I generally keep my plans to myself.
12.1 seldom ask for feedback from others about behaviors I need to change and how best to change those behaviors.
14. I seldom write down my yearly goals,15. I’m confused as to the kind of personal qualities I want to develop In my life.16. I have difficulty matching various tasks with my energy level.18. I have little idea as to what I most want to achieve in my life.21. When i deviate from my seleded goal, I have a hard time getting back on track.22. My living space is quite messy.

VITA
145

VITA
Personal Data:
Education:
ProfessionalExperience:
SAMUEL J. SHEPHERD
Date of Birth: March 30,1944Place of Birth: Greeneville, T ennessee Marital Status: Married
Public Schools, Hawkins County, T ennessee East T ennessee State University, Johnson City,
T ennesseeTusculum College, Greeneville, T ennessee: Secondary
Education/Biology, B.S., 1968 East T ennessee State University, Johnson City,
Tennessee; Educational Administration and Supervision, M.Ed., 1984
East T ennessee State University, Johnson City, Tennessee; Administration, Ed.D., 1994
National Teacher Corps Cycle II Intern, Washington County Board of Education, 1967-69
Teacher/Coach, Morristown Junior High School, Board of Education, Morristown City Schools, 1969-75
Teacher/Coach, Meadowview Middle School, Board of Education, Morristown City Schools, 1975-81
Assistant Principal, Meadowview Middle School, Board of Education, Morristown City Schools, 1981-85
Assistant Principal, Morristown-Hamblen High School East, Hamblen County Board of Education, 1985-87
Job Placement Supervisor, Hamblen County Board of Education, 1987-89
Assistant Superintendent, Hamblen County Board of Education, 1989 - present
146