Comparative Biometric Testing Round 6 Public Report 2006 CBT Round 6 Public Report ... Comparative...
117
Comparative Biometric Testing Round 6 Public Report September 2006 Copyright © 2006 International Biometric Group
Transcript of Comparative Biometric Testing Round 6 Public Report 2006 CBT Round 6 Public Report ... Comparative...

Comparative Biometric Testing
Round 6 Public Report
September 2006
Copyright © 2006 International Biometric Group

Copyright © 2006 International Biometric Group
September 2006 CBT Round 6 Public Report International Biometric Group Trademark and Contact Information – i
All brands, company names, and product names are trademarks or registered trademarks of their respective holder(s). Copyright © 2006 by International Biometric Group. All rights reserved. Duplication or reproduction of this publication in any form without prior written permission is forbidden. International Biometric Group shall have no liability for errors, omissions or inadequacies in the information contained herein or for interpretations thereof. The reader assumes sole responsibility for the selection of these materials to achieve its intended results. The opinions expressed herein are subject to change without notice. Request for permission or further information should be addressed to: Michael Thieme Director of Special Projects [email protected] International Biometric Group One Battery Park Plaza New York, NY 10004 (212) 809-9491

Copyright © 2006 International Biometric Group
September 2006 CBT Round 6 Public Report International Biometric Group Acknowledgements – ii
Acknowledgments
IBG extends its appreciation to CBT Round 6 participants Fujitsu, Hitachi, and IrisGuard for their technical assistance and insightful feedback throughout the test process.
Copyright © 2006 International Biometric Group
September 2006 CBT Round 6 Public Report International Biometric Group Contents – iii
Contents
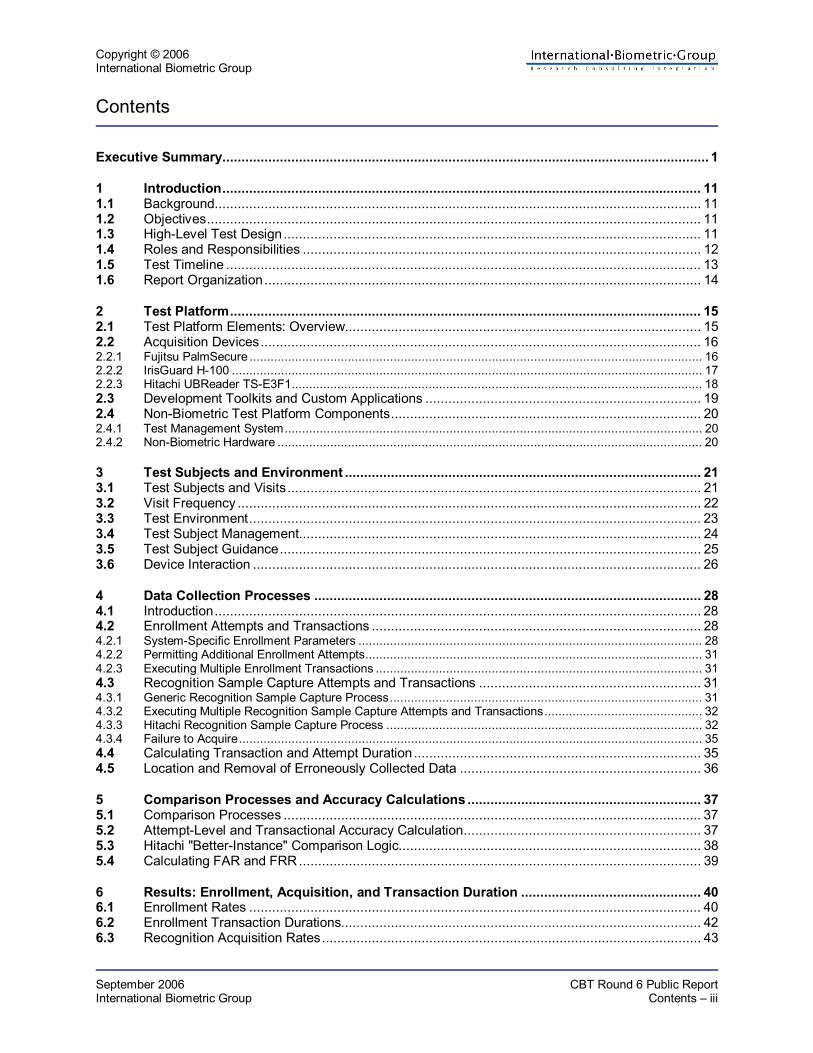
Executive Summary............................................................................................................................... 1
1 Introduction............................................................................................................................. 11 1.1 Background............................................................................................................................... 11 1.2 Objectives................................................................................................................................. 11 1.3 High-Level Test Design............................................................................................................. 11 1.4 Roles and Responsibilities ........................................................................................................ 12 1.5 Test Timeline ............................................................................................................................ 13 1.6 Report Organization.................................................................................................................. 14
2 Test Platform........................................................................................................................... 15 2.1 Test Platform Elements: Overview............................................................................................. 15 2.2 Acquisition Devices................................................................................................................... 16 2.2.1 Fujitsu PalmSecure ................................................................................................................................. 16 2.2.2 IrisGuard H-100 ...................................................................................................................................... 17 2.2.3 Hitachi UBReader TS-E3F1..................................................................................................................... 18 2.3 Development Toolkits and Custom Applications ........................................................................ 19 2.4 Non-Biometric Test Platform Components................................................................................. 20 2.4.1 Test Management System....................................................................................................................... 20 2.4.2 Non-Biometric Hardware ......................................................................................................................... 20
3 Test Subjects and Environment ............................................................................................. 21 3.1 Test Subjects and Visits............................................................................................................ 21 3.2 Visit Frequency ......................................................................................................................... 22 3.3 Test Environment...................................................................................................................... 23 3.4 Test Subject Management......................................................................................................... 24 3.5 Test Subject Guidance.............................................................................................................. 25 3.6 Device Interaction ..................................................................................................................... 26
4 Data Collection Processes ..................................................................................................... 28 4.1 Introduction............................................................................................................................... 28 4.2 Enrollment Attempts and Transactions ...................................................................................... 28 4.2.1 System-Specific Enrollment Parameters .................................................................................................. 28 4.2.2 Permitting Additional Enrollment Attempts................................................................................................ 31 4.2.3 Executing Multiple Enrollment Transactions ............................................................................................. 31 4.3 Recognition Sample Capture Attempts and Transactions .......................................................... 31 4.3.1 Generic Recognition Sample Capture Process......................................................................................... 31 4.3.2 Executing Multiple Recognition Sample Capture Attempts and Transactions............................................. 32 4.3.3 Hitachi Recognition Sample Capture Process .......................................................................................... 32 4.3.4 Failure to Acquire.................................................................................................................................... 35 4.4 Calculating Transaction and Attempt Duration........................................................................... 35 4.5 Location and Removal of Erroneously Collected Data ............................................................... 36
5 Comparison Processes and Accuracy Calculations ............................................................. 37 5.1 Comparison Processes ............................................................................................................. 37 5.2 Attempt-Level and Transactional Accuracy Calculation.............................................................. 37 5.3 Hitachi "Better-Instance" Comparison Logic............................................................................... 38 5.4 Calculating FAR and FRR......................................................................................................... 39
6 Results: Enrollment, Acquisition, and Transaction Duration ............................................... 40 6.1 Enrollment Rates ...................................................................................................................... 40 6.2 Enrollment Transaction Durations.............................................................................................. 42 6.3 Recognition Acquisition Rates................................................................................................... 43

Copyright © 2006 International Biometric Group
September 2006 CBT Round 6 Public Report International Biometric Group Contents – iv
6.3.1 Attempt-Level Recognition Acquisition Rates ........................................................................................... 43 6.3.2 Transactional Recognition Acquisition Rates............................................................................................ 44 6.4 Recognition Attempt Duration.................................................................................................... 45
7 Results: Accuracy by Comparison Type ............................................................................... 46 7.1 Presentation of Accuracy Results.............................................................................................. 46 7.2 Accuracy Formulae ................................................................................................................... 47 7.3 Sample and Comparison Volumes ............................................................................................ 48 7.4 Error Rates at Specified FMR and T-FMR ................................................................................. 49 7.5 Equal Error Rates ..................................................................................................................... 50 7.6 Overview of Results Tables and DET Curves ............................................................................ 51 7.7 Attempt-Level Results ............................................................................................................... 52 7.7.1 Attempt-Level DETs (All Systems) ........................................................................................................... 53 7.7.2 Fujitsu Attempt-Level Results Tables ....................................................................................................... 54 7.7.3 Hitachi Attempt-Level Results Tables....................................................................................................... 55 7.7.4 IrisGuard Attempt-Level Results Tables ................................................................................................... 57 7.8 Transactional Results................................................................................................................ 60 7.8.1 Transactional DETs (All Systems)............................................................................................................ 61 7.8.2 Fujitsu Transactional Results Tables........................................................................................................ 62 7.8.3 Hitachi Transactional Results Tables ....................................................................................................... 63 7.8.4 IrisGuard Transactional Results Tables.................................................................................................... 65
8 Results: Accuracy by System ................................................................................................ 68 8.1 Presentation of Accuracy Results.............................................................................................. 68 8.2 Fujitsu Result Table and DETs.................................................................................................. 69 8.3 Hitachi Result Table and DETs.................................................................................................. 71 8.4 IrisGuard Result Table and DETs.............................................................................................. 74
9 Results Summary.................................................................................................................... 78
Annex A. Hitachi "Both-Instance" Performance.............................................................................. 79
Annex B. Test Management System Interface................................................................................. 83
Annex C. Enrollment and Acquisition Application GUIs................................................................. 84
Annex D. Test Scripts....................................................................................................................... 86 D1 Introductory Narrative................................................................................................................ 86 D2 Fujitsu....................................................................................................................................... 86 D3 IrisGuard................................................................................................................................... 90 D4 Hitachi ...................................................................................................................................... 94
Annex E. CBT Functional Requirements......................................................................................... 99
Annex F. Vendor Comments.......................................................................................................... 104
Annex G. Acronyms........................................................................................................................ 109
Annex H. References ...................................................................................................................... 110

Copyright © 2006 International Biometric Group
September 2006 CBT Round 6 Public Report International Biometric Group Figures – v
Figures
Figure 1: Fujitsu PalmSecure................................................................................................................. 16 Figure 2: IrisGuard H-100 ...................................................................................................................... 17 Figure 3: Hitachi TS-E3F1 ..................................................................................................................... 18 Figure 4: Days Elapsed between Visit 1 and Visit 2................................................................................ 22 Figure 5: Number of Visits Executed per Day......................................................................................... 23 Figure 6: Room 1 Layout ....................................................................................................................... 24 Figure 7: Room 2 Layout ....................................................................................................................... 25 Figure 8: Fujitsu Interaction (Photo provided by Fujitsu) ......................................................................... 26 Figure 9: IrisGuard Interaction ............................................................................................................... 27 Figure 10: Hitachi Interaction ................................................................................................................. 27 Figure 11: Device-to-Device Test Subject Flow (Visit 1) ......................................................................... 29 Figure 12: Device-to-Device Test Subject Flow (Visit 2) ......................................................................... 30 Figure 13: Enrollment Transaction Process Flow ................................................................................... 33 Figure 14: Recognition Transaction Process Flow.................................................................................. 34 Figure 15: Attempt-Level DETs.............................................................................................................. 53 Figure 16: Transactional DETs .............................................................................................................. 61 Figure 17: Fujitsu DETs......................................................................................................................... 70 Figure 18: Hitachi DETs......................................................................................................................... 73 Figure 19: IrisGuard DETs..................................................................................................................... 77 Figure 20: Test Subject Management Menu........................................................................................... 83 Figure 21: Test Subject Profile Page...................................................................................................... 83 Figure 22: IrisGuard GUI........................................................................................................................ 84 Figure 23: Fujitsu GUI............................................................................................................................ 84 Figure 24: Hitachi GUI ........................................................................................................................... 85

Copyright © 2006 International Biometric Group
September 2006 CBT Round 6 Public Report International Biometric Group Tables – vi
Tables
Table 1: Elements of Scenario and Technology Testing in Comparative Biometric Testing..................... 12 Table 2: CBT Dates ............................................................................................................................... 13 Table 3: Report Organization................................................................................................................. 14 Table 4: Fujitsu PalmSecure Specifications............................................................................................ 16 Table 5: IrisGuard H-100 Specifications................................................................................................. 17 Table 6: Hitachi UBReader TS-E3F1 ..................................................................................................... 18 Table 7: Non-Biometric Hardware .......................................................................................................... 20 Table 8: CBT Test Subject and Visit Totals ............................................................................................ 21 Table 9: CBT Demographics.................................................................................................................. 21 Table 10: Acquisition Device Functionality Comparison.......................................................................... 26 Table 11: Maximum Enrollment Templates and Recognition Samples Acquired per Visit........................ 28 Table 12: Fujitsu Enrollment Results...................................................................................................... 41 Table 13: Hitachi Enrollment Results ..................................................................................................... 41 Table 14: IrisGuard Enrollment Results.................................................................................................. 41 Table 15: Enrollment Transaction Durations........................................................................................... 42 Table 16: Fujitsu Attempt-Level Recognition Acquisition Rates .............................................................. 43 Table 17: Hitachi Attempt-Level Recognition Acquisition Rates .............................................................. 43 Table 18: IrisGuard Attempt-Level Recognition Acquisition Rates .......................................................... 43 Table 19: Fujitsu Transactional Recognition Acquisition Rates ............................................................... 44 Table 20: Hitachi Transactional Recognition Acquisition Rates............................................................... 44 Table 21: IrisGuard Transactional Recognition Acquisition Rates........................................................... 44 Table 22: Samples Acquired per Recognition Transaction...................................................................... 45 Table 23: Recognition Attempt Duration................................................................................................. 45 Table 24: Total Enrollment Templates and Recognition Samples ........................................................... 48 Table 25: Total Genuine Comparisons................................................................................................... 48 Table 26: Total Genuine Transactions ................................................................................................... 48 Table 27: Total Impostor Comparisons .................................................................................................. 48 Table 28: Total Impostor Transactions ................................................................................................... 48 Table 29: Genuine Error Rates at 0.10% FMR / T-FMR ......................................................................... 49 Table 30: Genuine Error Rates at 0.01% FMR / T-FMR ......................................................................... 49 Table 31: Fujitsu Error Rates at Observed Thresholds ........................................................................... 50 Table 32: Equal Error Rates................................................................................................................... 50 Table 33: Fujitsu Genuine and Impostor Comparisons ........................................................................... 54 Table 34: Fujitsu Single-Attempt Comparison Error Rates...................................................................... 54 Table 35: Hitachi Genuine and Impostor Comparisons........................................................................... 55 Table 36: Hitachi Single-Attempt Comparison Error Rates ..................................................................... 56 Table 37: IrisGuard Genuine and Impostor Comparisons ....................................................................... 57 Table 38: IrisGuard Single-Attempt Comparison Error Rates.................................................................. 59 Table 39: Fujitsu Genuine and Impostor Transactions............................................................................ 62 Table 40: Fujitsu Transactional Comparison Error Rates........................................................................ 62 Table 41: Hitachi Genuine and Impostor Transactions ........................................................................... 63 Table 42: Hitachi Transactional Comparison Error Rates ....................................................................... 64 Table 43: IrisGuard Genuine and Impostor Transactions........................................................................ 65 Table 44: IrisGuard Transactional Comparison Error Rates.................................................................... 67 Table 45: Fujitsu Comparison Error Rates ............................................................................................. 69 Table 46: Hitachi Comparison Error Rates ............................................................................................. 72 Table 47: IrisGuard Comparison Error Rates ......................................................................................... 76 Table 48: Hitachi Genuine and Impostor Comparisons........................................................................... 79 Table 49: Hitachi Single-Attempt "Both-Instance" Results ...................................................................... 80 Table 50: Hitachi Genuine and Impostor Transactions ........................................................................... 81 Table 51: Hitachi Transactional "Both-Instance" Results ........................................................................ 82 Table 52: Acronyms............................................................................................................................. 109

Copyright © 2006 International Biometric Group
September 2006 CBT Round 6 Public Report International Biometric Group Executive Summary – 1
Executive Summary
Concept of Operations Comparative Biometric Testing (CBT) Round 6 evaluated full biometric systems representative of those utilized in access control, point-of-sale, border management, logical access, and ID systems applications. A full biometric system consists of acquisition devices, sample capture software, enrollment software, and comparison (i.e. matching) software. CBT is one of few biometric testing efforts focused on full-system performance. Data collection occurred in a controlled, indoor office environment. The evaluation did not utilize any pre-existing sample databases; instead, all data was collected from Test Subjects at IBG's test facility. Sample capture was automated to enable measurement of enrollment and acquisition rates, attempt and transaction duration, and levels of effort. Enrollment was conducted in real time. Templates and recognition samples were compared offline after all Test Subject data had been collected. The combination of real-time sample capture and offline comparison generates a range of performance data. The following systems were tested1 in CBT Round 6: • Fujitsu PalmSecure (palm vein recognition) • IrisGuard H100 (iris recognition) • Hitachi UB READER (finger vein recognition) CBT Round 6 represents the first major independent test inclusive of multiple vascular recognition technologies. Vascular recognition has gained very considerable traction in Japan, and is in the process of being introduced into global markets including the U.S. IrisGuard iris recognition technology is deployed in very high-profile and successful border control programs in the United Arab Emirates. Enrollment and recognition data was also acquired through the JIRIS JPC-1000, a USB iris recognition device. Due to anomalous system behavior, full JIRIS results could not be generated, and JIRIS results are not included in this Report. Roles and Responsibilities IBG was responsible for the following: • Development of the CBT test plan • Installation of test equipment in its New York City test facility • Design and implementation of enrollment, recognition, and comparison applications based on vendor
software development kits (SDKs)2 • Recruitment, training, and compensation of Test Subjects • Data collection and reporting Vendors were responsible for the following: • Delivery of acquisition hardware, application software, SDKs, and documentation • Technical assistance necessary to ensure that systems were implemented and utilized properly • Review and comment on draft CBT Report(s)
1 Systems are referred to by vendor names throughout this Report, e.g. “Fujitsu” for “Fujitsu PalmSecure”. 2 Hitachi provided an application that met the test specification, such that IBG did not need to develop the capture and comparison applications. IBG developed scripts to execute the comparison application and analyze results logs.

Copyright © 2006 International Biometric Group
September 2006 CBT Round 6 Public Report International Biometric Group Executive Summary – 2
Test Subjects and Test Operators 650 Test Subjects participated in CBT Round 6. Of these, 476 conducted two visits, and 174 conducted one visit. During Visit 1, Test Subjects conducted enrollment and recognition transactions. During Visit 2, which occurred days or weeks later, Test Subjects conducted recognition transactions. Test Operators trained and directed each Test Subject in his interactions with each acquisition device, following scripted instructions and device-specific best practices. Guidance and alignment instructions were provided during enrollment, but not during recognition. A Test Operator accompanied and monitored each Test Subject at every point in the test process. Data collection in enrollment and recognition transactions was almost entirely automated. Test Subjects' visit lasted from as little as 20 minutes to more than an hour. CBT Test Platform The CBT Test Platform was comprised of the following elements: • (2) Fujitsu PalmSecure devices; Fujitsu acquisition and comparison software • (2) IrisGuard H100 devices; Iridian PrivateID acquisition and OpenIris comparison software • (2) Hitachi UB READER devices; Hitachi acquisition and comparison software • (8) enrollment and recognition laptops / workstations • (8) storage and processing servers • Test Management System to manage Test Subject IDs, visits, and data collection • Data Analysis Application used to generate accuracy and usability results Enrollment and Recognition Sample Capture Processes Enrollment templates and recognition samples were collected through enrollment and recognition transactions, respectively. Within each transaction, two instances were acquired (e.g. left and right hand). Automated feedback provided from the system to the Test Subject varied from system to system.
System Instances Presented (Separately) System-Provided Guidance and Feedback
Fujitsu Left and Right Palm Not implemented in IBG-developed test application3
Hitachi Right Index and Right Middle Finger Audible and Visual
IrisGuard Left and Right Iris Spoken and Visual Depending on the system, successful enrollment required acquisition of one to four samples per instance. Systems tested in CBT Round 6 can be implemented with enrollment software different that that tested here, such that more or fewer sample may be acquired to enroll in certain operational environments. To reduce failure to enroll rates, Test Subjects who failed to enroll one or both instances executed an additional enrollment transaction. This policy accommodated Test Subjects who encountered difficulty enrolling. Further, to improve analysis of Test Subject-specific performance, each Test Subject was enrolled twice in each system. Therefore the 650 Test Subjects created ∼1300 multi-instance enrollments. Roughly 20 minutes after enrollment, each Test Subject conducted three separate recognition transactions in each system. Each recognition transaction was comprised of six recognition attempts (three per instance). Thus up to 18 recognition samples were collected per system, less acquisition failures. Executing multiple recognition transactions enabled more extensive offline data analysis and increased Test Subjects’ familiarity with device operations. Accounting for failed enrollment and recognition attempts as well as data collection errors, ∼7500 enrollment templates and ∼60,000 recognition samples were collected.
3 User guidance and feedback can be implemented through the BioAPI implementation provided by Fujitsu.

Copyright © 2006 International Biometric Group
September 2006 CBT Round 6 Public Report International Biometric Group Executive Summary – 3
Comparison Processes Biometric comparisons are typically based on comparison of recognition samples and enrollment templates. In CBT Round 6, recognition samples were compared against enrollment templates through offline bulk processing. For Hitachi and IrisGuard, each comparison generated a comparison score4. For Fujitsu, each comparison resulted in a match-no match decision at a specified threshold. Fujitsu was tested at three thresholds: Low Security, Default, and High Security. Comparisons of different instances from the same Test Subject (e.g. the same Test Subject’s left iris vs. right iris) were excluded from the results. ∼90,000 genuine comparisons and ∼116m impostor comparisons were executed across the three Test Systems. Accuracy was evaluated at the attempt and transaction levels. Attempt-level results are based on all available comparison scores, while transactional results are based on the strongest comparison score of the six available in most recognition transactions. Transactional results reflect a "best-of-six" decision policy whereby multiple attempts are permitted before a user is rejected. Many 1:1 biometric systems utilize this type of decision policy. Hitachi comparison error rates were evaluated through two separate analyses. One analysis utilized results from both instances from each Test Subject (this is how other CBT systems were evaluated). Another analysis was based on results from the more accurate of the two instances available from each Test Subject. Results in the Executive Summary and the Report body are based on the better-instance methodology. Results in Annex A are based on the both-instance methodology. Readers may prefer to utilize Annex A results when comparing performance of different systems. Performance Metrics Based on collection and comparison processes described above, the following metrics were generated:
Usability Metrics Accuracy Metrics • Failure to Enroll Rate (FTE) • Transactional Failure to Acquire Rate (T-FTA) • Enrollment Transaction Duration • Recognition Attempt Duration • Failure to Acquire Rate (FTA)
• Transactional False Match Rate (T-FMR) • Transactional False Non-Match Rate (T-FNMR) • False Match Rate (FMR) • False Non Match Rate (FNMR)
Generalized metrics such as false accept rate (FAR) and false reject rate (FRR) can be calculated from these metrics. Metrics in bold can be considered the fundamental performance metrics most relevant to operational deployments. Non-bold metrics provide additional perspectives on usability and accuracy. Enrollment and acquisition results – including capture rates and transaction durations – are functions of hardware, software, and decision policy. Operational systems may achieve lower FTE and shorter attempt and transaction durations based on a customized or optimized implementation.
4 To ensure fidelity to real-world operations, Hitachi was evaluated through two comparison techniques. One utilized a single instance for all results generation (the stronger of a Test Subject's two instances). The other utilized both instances. Results presented in this Report are based on the "better-instance" methodology. Annex A shows "both-instance" accuracy.
Copyright © 2006 International Biometric Group
September 2006 CBT Round 6 Public Report International Biometric Group Executive Summary – 4
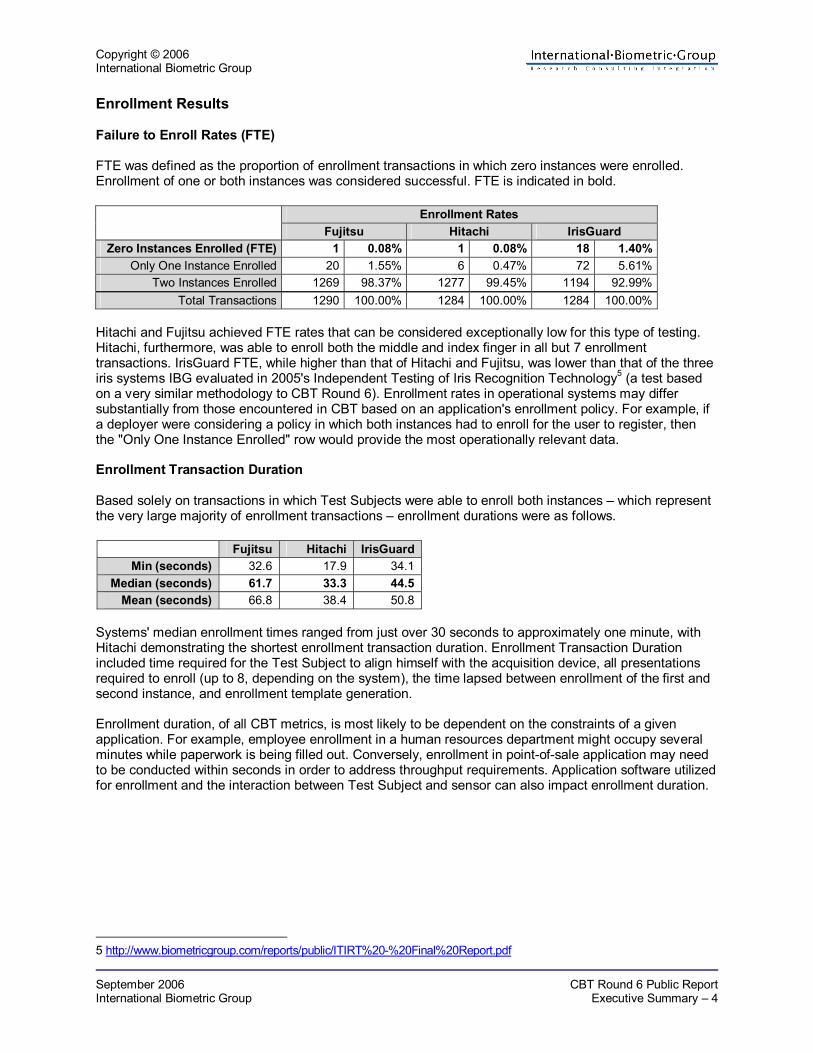
Enrollment Results Failure to Enroll Rates (FTE) FTE was defined as the proportion of enrollment transactions in which zero instances were enrolled. Enrollment of one or both instances was considered successful. FTE is indicated in bold.
Enrollment Rates Fujitsu Hitachi IrisGuard
Zero Instances Enrolled (FTE) 1 0.08% 1 0.08% 18 1.40% Only One Instance Enrolled 20 1.55% 6 0.47% 72 5.61%
Two Instances Enrolled 1269 98.37% 1277 99.45% 1194 92.99% Total Transactions 1290 100.00% 1284 100.00% 1284 100.00%
Hitachi and Fujitsu achieved FTE rates that can be considered exceptionally low for this type of testing. Hitachi, furthermore, was able to enroll both the middle and index finger in all but 7 enrollment transactions. IrisGuard FTE, while higher than that of Hitachi and Fujitsu, was lower than that of the three iris systems IBG evaluated in 2005's Independent Testing of Iris Recognition Technology5 (a test based on a very similar methodology to CBT Round 6). Enrollment rates in operational systems may differ substantially from those encountered in CBT based on an application's enrollment policy. For example, if a deployer were considering a policy in which both instances had to enroll for the user to register, then the "Only One Instance Enrolled" row would provide the most operationally relevant data. Enrollment Transaction Duration Based solely on transactions in which Test Subjects were able to enroll both instances – which represent the very large majority of enrollment transactions – enrollment durations were as follows.
Fujitsu Hitachi IrisGuard Min (seconds) 32.6 17.9 34.1
Median (seconds) 61.7 33.3 44.5 Mean (seconds) 66.8 38.4 50.8
Systems' median enrollment times ranged from just over 30 seconds to approximately one minute, with Hitachi demonstrating the shortest enrollment transaction duration. Enrollment Transaction Duration included time required for the Test Subject to align himself with the acquisition device, all presentations required to enroll (up to 8, depending on the system), the time lapsed between enrollment of the first and second instance, and enrollment template generation. Enrollment duration, of all CBT metrics, is most likely to be dependent on the constraints of a given application. For example, employee enrollment in a human resources department might occupy several minutes while paperwork is being filled out. Conversely, enrollment in point-of-sale application may need to be conducted within seconds in order to address throughput requirements. Application software utilized for enrollment and the interaction between Test Subject and sensor can also impact enrollment duration.
5 http://www.biometricgroup.com/reports/public/ITIRT%20-%20Final%20Report.pdf

Copyright © 2006 International Biometric Group
September 2006 CBT Round 6 Public Report International Biometric Group Executive Summary – 5
Acquisition Results Transactional Acquisition Rates Transactional failure to acquire rate (T-FTA) was defined as the proportion of recognition transactions in which no instances were successfully acquired. T-FTA, the error case, is indicated in bold.
Transactional Acquisition Rates Fujitsu Hitachi IrisGuard
Zero Instances Acquired (T-FTA) 5 0.15% 2 0.06% 2 0.06% Only One Instance Acquired 6 0.18% 15 0.45% 41 1.26%
Two Instances Acquired 3343 99.67% 3334 99.49% 3200 98.67% Total Transactions 3354 100.00% 3351 100.00% 3243 100.00%
T-FTA was universally low; each system acquired one or more sample in over 99.5% of transactions. Recognition Attempt Duration Based solely on successful recognition attempts, recognition attempt durations were as follows.
Recognition Attempt Duration (seconds)
Fujitsu Hitachi IrisGuardMedian (seconds) 2.13 1.23 4.22
Mean (seconds) 2.14 1.77 5.10 These durations include time for the Test Subject to align himself with the acquisition device, time for the device to locate the instance, and time for algorithms to validate the quality of the sample. Vascular recognition systems' attempt duration was lower than that of iris recognition in part because the former are based on placement of the hand or finger against an alignment apparatus. As with enrollment transaction duration, application software utilized for recognition sample capture can be as much of determinant of performance as interaction between Test Subject and sensor. Further, it was necessary to measure Hitachi recognition attempt duration in a different fashion than that of IrisGuard and Fujitsu. Accuracy Terminology Attempt-level accuracy is measured through the following formulae (FTE and FTA are not included):
Genuine attempts that generate comparison score below threshold False Non-Match Rate (FNMR) = Total genuine attempts
Impostor attempts that generate comparison score above threshold False Match Rate (FMR) =
Total impostor attempts Transactional accuracy is measured through the following formulae:
Genuine transactions that generate comparison score below threshold Transactional False Non-Match Rate (T-FNMR) =Total genuine transactions
Impostor transactions that generate comparison score above threshold Transactional False Match Rate (T-FMR) =
Total impostor transactions Same-Day Attempts are trials in which Visit 1 recognition samples are compared against enrollment templates created on the same day. All genuine and impostor attempts are utilized to calculate Same-Day FMR and Same-Day FNMR.

Copyright © 2006 International Biometric Group
September 2006 CBT Round 6 Public Report International Biometric Group Executive Summary – 6
Different-Day Attempts are trials in which Visit 2 recognition samples are compared against enrollment templates created days or weeks earlier. All genuine and impostor attempts are utilized to calculate Different-Day FMR and Different-Day FNMR. Same-Day Transactions are trials in which Visit 1 recognition samples are compared against enrollment templates created on the same day. The strongest comparison score from each recognition transaction is utilized to calculate Same-Day T-FMR and Same-Day T-FNMR. Different-Day Transactions are trials in which Visit 2 recognition samples are compared against enrollment templates created days or weeks earlier. The strongest comparison score from each recognition transaction is utilized to calculate Different-Day T-FMR and Different-Day T-FNMR. Different-Day Transaction results are typically the most operationally relevant. Most applications allow multiple attempts to match, and Different-Day accuracy is more relevant than Same-Day accuracy. Accuracy Results Hitachi and IrisGuard FNMR and T-FNMR at 0.1% and 0.01% FMR Systems are frequently evaluated based on their genuine error rates at specific impostor error rates. Many systems are configured to provide a 0.10% or 0.01% FMR, such that the odds of a false match are 1 in 1000 or 1 in 10,000. The following table shows genuine error rates as FNMR (attempt-level) and T-FNMR (transactional) for IrisGuard and Hitachi.
Genuine Error Rates at 0.10% FMR / T-FMR Genuine Error Rates at 0.01% FMR / T-FMR Attempt-Level (FNMR) Transactional (T-FNMR) Attempt-Level (FNMR) Transactional (T-FNMR)
Same- Day
Different- Day
Same-Day
Different-Day
Same-Day
Different- Day
Same- Day
Different-Day
Hitachi 0.77% 3.02% 0.34% 1.94% 1.26% 4.72% 0.68% 2.77%IrisGuard 1.54% 1.88% 0.58% 1.06% 1.76% 2.14% 0.70% 1.17%
Hitachi Same-Day FNMR and Same-Day T-FNMR were lower than IrisGuard's, although its Different-Day FNMR was higher. In applications such as access control, point-of-sale, and logical access, users grow accustomed to using biometric devices, such that genuine error rates may not increase in this fashion. IrisGuard T-FNMR increased only slightly as T-FMR decreased. In fact, at a Different-Day T-FMR of 0.00006% (not shown in the table above), IrisGuard T-FNMR was only 1.33%. Therefore IrisGuard T-FNMR degrades only slightly as T-FMR approaches zero. Fujitsu FMR, FNMR, T-FMR, and T-FNMR Fujitsu FMR, FNMR, T-FMR, and T-FNMR were as follows.
Attempt-Level Transactional Same-Day Different-Day Same-Day Different-Day
FNMR FMR FNMR FMR T-FNMR T-FMR T-FNMR T-FMR Low Security 3.13% 0.0380% 6.17% 0.0395% 0.22% 0.1766% 0.33% 0.1831%
Default 4.23% 0.0118% 8.52% 0.0135% 0.57% 0.0559% 0.69% 0.0629%High Security 5.64% 0.0018% 11.86% 0.0007% 0.87% 0.0091% 1.42% 0.0042%
While Fujitsu attempt-level FNMR was relatively high, Fujitsu Different-Day T-FNMR of 0.69% at its default threshold was lower than that of any competing technology.

Copyright © 2006 International Biometric Group
September 2006 CBT Round 6 Public Report International Biometric Group Executive Summary – 7
Equal Error Rates The equal error rate (EER) is the operating point at which the difference between genuine and impostor error rates is closest to zero. Fujitsu is excluded because its matcher did not return score values.
Attempt-Level Transactional
FMR FNMR T-FMR T-FNMRSame-Day 0.5449% 0.55% 0.3003% 0.29%
Hitachi Different-Day 2.0336% 2.04% 1.3706% 1.36%
Same-Day 1.2850% 1.27% 0.5412% 0.55%IrisGuard
Different-Day 1.6093% 1.58% 0.8516% 0.87% DET Curves DET curves plot error rates across a range of operating points, such that accuracy improves as one moves leftward and downward on the graph. The following graphs show attempt-level and transactional DETs for all systems. Transactional DETs are the more operationally relevant of the two figures.

Cop
yrig
ht ©
200
6
Inte
rnat
iona
l Bio
met
ric G
roup
Se
ptem
ber 2
006
C
BT R
ound
6 P
ublic
Rep
ort
Inte
rnat
iona
l Bio
met
ric G
roup
Exec
utiv
e Su
mm
ary
– 8

Cop
yrig
ht ©
200
6
Inte
rnat
iona
l Bio
met
ric G
roup
Se
ptem
ber 2
006
C
BT R
ound
6 P
ublic
Rep
ort
Inte
rnat
iona
l Bio
met
ric G
roup
Exec
utiv
e Su
mm
ary
– 9

Copyright © 2006 International Biometric Group
September 2006 CBT Round 6 Public Report International Biometric Group Executive Summary – 10
Results Summary Systems tested in CBT Round 6 have each found considerable success in high-profile implementations outside the U.S. – Fujitsu and Hitachi in Japan, and IrisGuard in the Middle East. However, prior to CBT Round 6, limited independent test results were publicly available on these systems' performance. Based on CBT Round 6 results, each system excelled at many different aspects of performance, such that IrisGuard, Hitachi, and Fujitsu can each be considered very high-performing systems for the types of applications that CBT models. The low failure to enroll and failure to acquire rates generated by all systems were surprising, particularly for vascular recognition systems. Failure to enroll is an often-overlooked metric; it is well-known that systems can improve accuracy by increasing the proportion of samples that fail the enrollment process. Enrollment capabilities are essential to decision-making in large-scale, mass-market systems. Even at the attempt level for recognition sample capture, Fujitsu and Hitachi were able to capture a very high percentage of hands and fingers, respectively. Hitachi and to a lesser degree Fujitsu also showed comparatively short Enrollment Transaction Duration and Recognition Attempt Duration. This data may help address the question of vascular recognition's usability for a high percentage of the population. Hitachi provided highly robust 1:1 FNMR at various thresholds, and also provided very rapid sample capture. Based on CBT Round 6 results, one might speculate that a highly-habituated population would perform very well on the Hitachi system due to its very low Same-Day FNMR. At its default threshold, Fujitsu Different-Day T-FNMR (the most operationally relevant accuracy metric) was lower than that of other systems. Fujitsu T-FNMR increased only slightly between Same- and Different-Day Transactions. Fujitsu would likely have benefited from providing a development kit that output scores as opposed to match / no-match decisions, as this would have enabled generation of more granular results. In sum, vascular recognition – a modality seen as novel in the U.S. – appears to be a very serious competitor to fingerprint, hand geometry, and certain iris recognition systems used in large-scale 1:1 access control, logical access, and consumer ID applications. The systems tested provided a strong combination of usability and accuracy. IrisGuard was implemented on an Iridian software platform that differs from the native architecture typically used in operational deployments. On review of draft test results, IrisGuard stated that its platform provides much more rapid capture than the software tested in CBT Round 6, and also that the Iridian PrivateID implementation required more enrollment presentations than was necessary. Since this negatively impacted IrisGuard capture speed and capture rates, and potentially its FNMR, IrisGuard results must be reviewed guardedly. This notwithstanding, IrisGuard accuracy and usability were such that it is, in many respects, the most robust all-around iris recognition system that IBG has tested. Genuine error rates increased only slightly between Same- and Different-Day. IrisGuard T-FNMR of 1.33% at T-FMR of 0.0001% was by far the lowest in CBT Round 6 and was on par with any commercial iris recognition system IBG has evaluated. Round 6 was the first round of CBT to have incorporated real-time data collection and offline comparison, which introduced many challenges. Among the more difficult elements to address were (1) maintaining operational realism during the capture process absent real-time comparison and (2) balancing vendor desire for customized implementation with the need to enforce consistent capture and comparison concepts of operations. Despite the complexities associated with this type of testing, we believe that the combination of usability and accuracy results generated in Comparative Biometric Testing provides deployers, vendors, and technology partners with unique insights into end-to-end system performance. In addition to the CBT Round 6 Public Report, IBG offers a CBT Round 6 Private Report that contains additional analyses and data, including Test Subject-specific performance and demographic trends.

Copyright © 2006 International Biometric Group
September 2006 CBT Round 6 Public Report International Biometric Group Introduction – 11
1 Introduction
The following section introduces Comparative Biometric Testing Round 6 (CBT) objectives, test design, and roles and responsibilities.
1.1 Background Biometric technologies such as fingerprint, facial recognition, and iris recognition are deployed in applications such as access control, border management, network security, and point of sale, among others. Independently-generated data on accuracy and usability of these technologies – measured in terms of match rates, enrollment and acquisition rates, and transaction duration – are central to decisions on deployment, technology partnerships, and investments. 1.2 Objectives CBT’s objective is to evaluate the usability and accuracy of full biometric systems in terms of the following: • Match rates: systems’ ability to correctly distinguish between genuine and impostor comparisons • Enrollment and acquisition rates: systems’ ability to successfully enroll and acquire samples from
Test Subjects • Level of effort: systems’ ability to successfully enroll and acquire samples from Test Subjects with
minimal transaction durations and repeated attempts / transactions In a biometric system, comparison, acquisition, and level of effort are interdependent. For example, strict enrollment criteria can improve match rates while increasing enrollment failure rates. Biometric system performance evaluation thus should take each of these elements into account. 1.3 High-Level Test Design CBT tests full biometric systems inclusive of acquisition devices, sample capture software, enrollment software, and comparison software. CBT is one of few biometric testing efforts focused on full-system performance. In order to test full biometric systems, CBT combines aspects of scenario testing and technology testing. The scenario testing aspect of CBT is manifest in real-time enrollment and recognition sample collection from a controlled test population. The technology testing aspect of CBT is manifest in offline cross-comparison of enrollment template and recognition samples, a process that maximizes the number of comparison scores generated. This approach to biometric testing, while complex, generates robust and realistic accuracy and usability results. While enrollment was conducted in real time, CBT did not incorporate real-time comparison at the point of recognition sample collection. Instead, enrollment templates and recognition samples were compared in an offline mode subsequent to acquisition. Offline testing allowed templates and samples to be cross-compared once all data had been acquired. Data resulting from cross-comparisons (scores or decisions) were analyzed to measure accuracy. All comparisons were 1:1, not 1:N. CBT entailed both acquisition and comparison of biometric templates and samples; the test did not utilize any pre-existing sample databases. Sample capture was automated to enable measurement of enrollment and acquisition rates, transaction durations, and levels of effort in Test Subject-device interaction. Comparison of enrollment templates and recognition samples were executed offline after all Test Subject data was collected. Offline testing dramatically increases the number of genuine and impostor comparisons executed in a test. The relationship between scenario testing, technology testing, and CBT is shown in Table 1.

Copyright © 2006 International Biometric Group
September 2006 CBT Round 6 Public Report International Biometric Group Introduction – 12
Scenario Testing Technology Testing CBT Data Collection System-Specific Shared Test Database System-Specific
Comparison Approach Online Comparison Offline Comparison Offline ComparisonWhat is Evaluated Full System Comparison Algorithm Full System
Table 1: Elements of Scenario and Technology Testing in Comparative Biometric Testing Acquisition devices were configured, installed, and utilized in a fashion consistent with usage in an environmentally-controlled indoor environment. Test Operators directed Test Subjects in their interactions with each acquisition device, ensuring compliance with scripted instructions and best practices for device usage. Separate data collection methods were implemented for enrollment and recognition, emulating operations in fielded systems. CBT measured the level of effort required to present data during enrollment and recognition, reported in terms of transaction and attempt duration. Three systems were tested in CBT Round 6: • Fujitsu PalmSecure (palm vein recognition) • IrisGuard H100 (iris recognition) • Hitachi UB READER (finger vein recognition) In addition to Fujitsu, IrisGuard, and Hitachi, enrollment and recognition data was also acquired through the JIRIS JPC-1000, a USB iris recognition device. Due to anomalous system behavior, full JIRIS results could not be generated, and JIRIS results are not included in this Report. 1.4 Roles and Responsibilities IBG responsibilities in CBT included the following, in their approximate order of execution: • develop CBT test plan • procure and implement non-biometric test hardware (workstations, servers) • specify, in conjunction with participating vendors, the acquisition hardware, enrollment software,
recognition software, and comparison software suitable for testing6 • install test equipment, including biometric and non-biometric components • integrate biometric hardware and software into CBT test platform using vendor-provided software
development kits (SDKs) and application programming interfaces (APIs) • design and implement enrollment and recognition applications based on vendor discussions • design and implement sample, template, and transaction logging databases • recruit, schedule, train, and compensate test subjects • collect samples from test subjects • enforce vendor-provided best practices on system usage • design and implement comparison applications • execute full 1:1 cross-comparisons • analyze results for various 1:1 test cases • resolve collection discrepancies • document CBT methodology, results, and findings in a CBT public report • provide draft CBT report to vendors for review and comment • publish CBT public report Vendor responsibilities in CBT included the following: • provide (2) acquisition devices and SDK/API necessary to develop test applications7 • provide installation, developer, and system operator documentation
6 See Annex E, CBT Functional Requirements. 7 Hitachi provided an application that met the test specification, such that IBG did not need to develop the capture and comparison applications. IBG developed scripts to execute the comparison application and analyze results logs.

Copyright © 2006 International Biometric Group
September 2006 CBT Round 6 Public Report International Biometric Group Introduction – 13
• validate data collection and comparison concepts of operation documented in the CBT test plan • provide technical assistance necessary to ensure that hardware and software were implemented in a
fashion consistent with real-world operations • attend, at their discretion, dry-run testing to validate system functions and operator processes • review interim CBT results and provide comments for inclusion in the CBT Final Report Once testing began, vendor involvement was limited to assistance on an as-needed basis in resolving suspected problems on software and device operations. IBG designed and implemented enrollment, recognition sample capture, and comparison applications for two of the three CBT systems8. Design and development typically leverages vendor acquisition devices and development toolkits. While biometric tests typically devolve responsibility for software implementation to the vendor, the CBT approach differs for the following reasons: • In order to acquire transaction and attempt duration and events in a consistent fashion across
different types of devices, customized enrollment and recognition acquisition applications are necessary. Requiring that vendors develop these acquisition applications to exact CBT specifications would be burdensome and could negatively impact the testing timeline.
• The specific schemas needed to specify visit, Test Subject, instance, device, transaction, attempt,
and other event-based information typically cannot be determined until one has access to the vendor’s development kit. Therefore it is incumbent on IBG to familiarize itself with vendor development kits to map the CBT test concept to the vendor implementation.
• To process the quantity of template and sample data collected in an equivalent time for all systems,
comparison applications must be distributed across an uneven number of machines. For slower matchers, this could require that the vendor configure, ship, and implement comparison hardware on short notice, which poses logistics and test schedule risks.
The net result of these test design requirements is that IBG bears primary responsibility for design, implementation, and integration of CBT acquisition and comparison applications. 1.5 Test Timeline The following is a high-level timeline for CBT activities.
Event DatesVendor Outreach November 2005-March 2006
Vendors Provide Test Hardware And Software March-April 2006Test Platform Development and Integration March-May 2006
Dry Run Testing April-May 2006Data Collection Begins May 2006
Data Collection Ends June 2006Offline Comparison June-July 2006
Initial Data To Vendors for Review, Comment July 2006Data Resolution July 2006
Vendor Review and Comment Disposition July-August 2006CBT Public Report Released September 2006
Table 2: CBT Dates 8 Hitachi provided enrollment, recognition sample capture, and comparison applications that met the high-level requirements provided by IBG prior testing, as shown in Annex E. IBG managed Test Subject and Sample IDs to ensure that the Hitachi application could not differentiate between genuine and impostor comparisons based on metadata.

Copyright © 2006 International Biometric Group
September 2006 CBT Round 6 Public Report International Biometric Group Introduction – 14
1.6 Report Organization This report is organized as follows (beginning with Section 2):
Section Scope Section 2: Test Platform Biometric and non-biometric hardware and software evaluated
and utilized in CBT; overall CBT test architecture Section 3: Test Subjects and Environment
Test environment for enrollment and recognition; Test Subject-device interface; test population; Test Subject guidance
Section 4: Data Collection Processes
Enrollment and recognition sample collection processes; multi-attempt and multi-transaction logic; error handling
Section 5: Comparison Processes and Results Calculations
Offline comparison processes and comparison error rate calculations
Section 6: Enrollment, Acquisition, and Transaction Duration Results
Enrollment and acquisition results for all systems, including rates, durations, and level of effort
Section 7: Comparative Accuracy Results
Comparison accuracy results by comparison types
Section 8: Accuracy Results by System
Comparison accuracy results by system
Annex A. Hitachi "Both-Instance" Performance
Additional Hitachi performance data using an alternative results analysis
Annex B. Test Management System Interface
Select menus and interfaces used in test management
Annex C. Enrollment and Acquisition Application GUIs
Graphical interface used by Test Operators and, in limited cases, Test Subjects
Annex D. Test Scripts Detailed scripts used to guide Test Subjects in their interactions with devices
Annex E. CBT Functional Requirements
High-level description of enrollment, recognition sample capture, and comparison applications as provided to vendors
Annex F. Vendor Comments Vendor comments on the CBT Public Report; IBG responses
Annex G. Acronyms Acronyms used in the body of the report
Annex F. References Links to relevant biometric performance testing documents
Table 3: Report Organization In addition to the CBT Round 6 Public Report, IBG offers a CBT Round 6 Private Report that contains additional analyses and data, including Test Subject-specific performance and demographic trends.

Copyright © 2006 International Biometric Group
September 2006 CBT Round 6 Public Report International Biometric Group Test Platform – 15
2 Test Platform
The following section describes the biometric and non-biometric hardware and software used to acquire, process, compare, and analyze samples, templates, and results in the course of CBT.
2.1 Test Platform Elements: Overview The integrated system used in CBT execution, referred to as the CBT Test Platform, was comprised of the following components: Acquisition Devices Two of each of the following acquisition devices were utilized in CBT: • Fujitsu PalmSecure (palm vein recognition) • IrisGuard H100 (iris recognition) • Hitachi UB READER (finger vein recognition) Development Toolkits and Utilities • Fujitsu PalmSecure SDK • Iridian PrivateID 2.3, Iridian OpenIris Verifier (OIV) (used for IrisGuard enrollment and recognition) • Hitachi UBR Custom Application Non-Biometric Hardware • (7) IBM ThinkPads (for enrollment and recognition applications) • (1) Dell (for enrollment and recognition applications) • (9) IBM xSeries Model 306 (for sample and results storage, comparison applications, queries) Non-Biometric Software • Test Management System to manage Test Subject IDs, visits, and data collection • Data Analysis Application used to generate accuracy and usability results

Copyright © 2006 International Biometric Group
September 2006 CBT Round 6 Public Report International Biometric Group Test Platform – 16
2.2 Acquisition Devices 2.2.1 Fujitsu PalmSecure The Fujitsu PalmSecure is a USB-powered peripheral that reads vascular patterns within a user’s left or right palm. Imaging and IR components are housed in a small black cube (dimensions below) that rests within a plastic housing. The sensor can be oriented in three directions; orientation is determined by the direction of the USB cable with respect to the sensor. In CBT, the device was tested at 0° as shown in Figure 1. Each device’s housing was secured to the desk, fixed in a single position for the duration of testing to reduce variability. The PalmSecure sensor is frequently incorporated into
Figure 1: Fujitsu PalmSecure external devices or housings for specific applications such as access control, logical access, point-of-sale, or ID systems. The PalmSecure is widely utilized in ATM and Windows log-in applications. The following product information is taken from the Fujitsu PalmSecure datasheet9. Specifications refer to the imaging unit exclusive of the mounting apparatus.
Supply Voltage (From US Bus Power) 4.4 to 5.4V (Input current: up to 500mA) Power Consumption 2.5W or less
Interface USB 2.0 / 1.1 (Hi speed or full speed) Photography Distance (From Filter Surface) 50mm (+/- 10mm)
Filter Material Glass Acoustic Noise None
Operating Temperature 0°C to 60°C Storage Temperature -20°C to 70°C
Outer Dimensions 35mm x 35mm x 27mm Weight 50g (approx.)
Additional Notes Compliant with UL/CE/RoHS Table 4: Fujitsu PalmSecure Specifications
9 www.fujitsu.com/downloads/COMP/fcpa/biometrics/palmsecure_datasheet.pdf

Copyright © 2006 International Biometric Group
September 2006 CBT Round 6 Public Report International Biometric Group Test Platform – 17
2.2.2 IrisGuard H-100 The IrisGuard H-100 is an AC-powered iris recognition device capable of reading a user’s left or right iris. The device connected to the host PC via serial and USB cables. As tested, the device was mounted on a tripod, although in operational deployments the device can be mounted on a variety of brackets and is available in a hand-held form factor. The device is typically used in border control and ID systems applications. The IrisGuard H-100 has an auto-focus camera, though the user needs to be within the device’s range of operations in order to present iris data. The user aligns his eye in the mirror on the face of the device; up and down arrows adjacent to the mirror prompt the user to move forward and backward. IR illumination is provided by LEDs on the front of the device. The device provides verbal feedback to the user. To avoid potential calibration issues and to reduce variability in the testing, each of the two test devices were set in a fixed position (i.e. devices were not adjusted on a Test Subject-by-Test Subject basis). One H-100 unit was damaged during testing, approximately 5 days before the end of data collection. A Test Subject inadvertently knocked a device onto its side, causing the camera to become non-functional. For the remainder of the test, a
Figure 2: IrisGuard H-100
single device was used for enrollment and recognition sample collection. The following product information is taken from the IrisGuard H-100 datasheet10.
Mounting Tripod ¼ Standard Mount or IrisGuard wall and desk mounts Indicator LEDS Front & Rear Power Status, Move Back , Move Forwards, Accept , Yield, Reject
Audio Voice Prompts (English, other languages possible) User Alignment Mirror - Designed to reduce the effect of dominance.
Acquisition Time 8 shots in < 3 Seconds Composite Video Output RS170 (NTSC) Monochrome
Control Input/Output RS232/USB II Input Power 12Vdc (2.1mm Centre Positive Socket) PC Interface USB II Interface Kit
Weight 750g approx Size 120mm x 120mm
Composite Video RS170 (NTSC) Picture Elements 680K Pixels
Horizontal Resolution 470 TVL S/N Radio >49dB
Table 5: IrisGuard H-100 Specifications
10 Linked from www.irisguard.com/pages.php?menu_id=29&local_type=0

Copyright © 2006 International Biometric Group
September 2006 CBT Round 6 Public Report International Biometric Group Test Platform – 18
2.2.3 Hitachi UBReader TS-E3F1 The Hitachi UBReader TS-E3F1 is an AC-powered USB peripheral capable of reading the vascular patterns within a user’s index or middle fingers. The device is contactless in that the portion of the finger imaged for enrollment and recognition does not come into contact with any surface. The tip of the finger rests on a recessed notch at the top of the device, while the wrist rests against a brace at the bottom of the device.
Figure 3: Hitachi TS-E3F1
The core technology is used for access control, ATM and other 1:1 applications in Japan. The following product information is taken from a specification sheet provided by Hitachi. The following product information is taken from the Hitachi UBReader product sheet11.
SIZE (W x D x H) mm3 75.0 x 157.5 x 48.4 Weight 0.3 kg
Power Requirement • AC 100V (for adapter) • DC 12V (+/-8%) • Max. 0.6A
Maximum Power Consumption 0.76 kgf. m/s(7.2W)
Cable Length • Interface cable: 4m • AC adopter and cable: 3.7m
Environment Condition Temperature (Humidity)
• Operating: 5 to 35 degree C (35 to 85%) • Stand-by: 0 to 40 degree C (10 to 90%) • Transportation (with packing) -25 to 60 degree C (10 to 90%)
Product Life 7 years (61,000h) Interface RS232C (communication speed 115,200bps) or USB1.1
Table 6: Hitachi UBReader TS-E3F1
11 Further information is available at http://www.hitachi.co.jp/Prod/comp/fingervein/global/index.html

Copyright © 2006 International Biometric Group
September 2006 CBT Round 6 Public Report International Biometric Group Test Platform – 19
2.3 Development Toolkits and Custom Applications Vendor development toolkits and custom applications were utilized to implement enrollment, recognition sample capture, and comparison applications for each system. Toolkits allowed IBG developers to implement the following functionality: • acquire enrollment templates and recognition samples through acquisition devices • design applications that encapsulate multiple attempts and transactions to emulate enrollment and
recognition usage • provide an interface for Test Operators to acquire samples from test subjects • event timing • create enrollment templates • compare recognition samples to enrollment templates (offline) Observations on development toolkits and custom applications for each of the systems are as follows. Fujitsu PalmSecure SDK, Authentication Library v.10. The software documentation states that the authentication library interface conforms to BioAPI 1.1. In discussions with Fujitsu subsequent to testing, the implementation of Test Subject feedback was discussed. In IBG's experience, most systems' enrollment and recognition routines incorporate Test Subject feedback as an integral component of the process. Fujitsu informed us that their SDK supported Test Subject feedback, but that this was not an integral part of the enrollment and recognition routines (giving the deployer more discretion over its implementation). In retrospect, IBG might have explored this functionality more thoroughly, and Fujitsu might have specified that feedback be implemented outside the core routines. Iridian PrivateID 2.3, Iridian OpenIris Verifier (OIV) (used for IrisGuard enrollment and recognition). IBG and IrisGuard agreed to test the H-100 using Iridian-provided encoding and comparison software. IBG executed a separate agreement with Iridian to obtain software for CBT testing. The initial version of the OIV software used for comparison utilized a web service layer that precluded rapid 1:1 comparison such as that required in CBT Round 6. IBG built a simple application using VerifyAPI.h and IrisVerifier.dll, which provides comparison functionality within the Open Iris Libraries. This Iridian software platform differs from the native architecture typically used in IrisGuard's operational deployments. IrisGuard states that its native platform provides much more rapid capture than its Iridian counterpart. IrisGuard states that this negatively impacted capture speed and potentially FNMR. Hitachi UBR vendor-provided application. Whereas Fujitsu and IrisGuard applications were developed using vendor-provided toolkits, Hitachi developed and provided enrollment, recognition sample capture, and bulk comparison applications to IBG prior to testing. The applications that Hitachi provided were based on a CBT Functional Requirements document (see Annex E) shared with each vendor once its participation was confirmed. IBG evaluated the Hitachi applications (working with Hitachi engineers) through pre-test trials executed at IBG offices several weeks before testing to confirm that the software did exactly what was specified and no more. Hitachi made slight modifications to the applications’ logging functions to support IBG data analysis needs. Hitachi data was saved locally and uploaded to the CBT server on a daily basis, whereas other systems wrote to the CBT server with each enrollment transaction and recognition attempt. Although such vendor-developed applications are permitted in CBT when the vendor cannot or will not release its SDK for integration into the CBT test platform, this is a deprecated approach, and IBG reserves the right to not implement any specific piece of vendor-provided software. This option is extended by IBG at its discretion based on the availability of third-party development kits as well as the overall testing schedule.
Copyright © 2006 International Biometric Group
September 2006 CBT Round 6 Public Report International Biometric Group Test Platform – 20
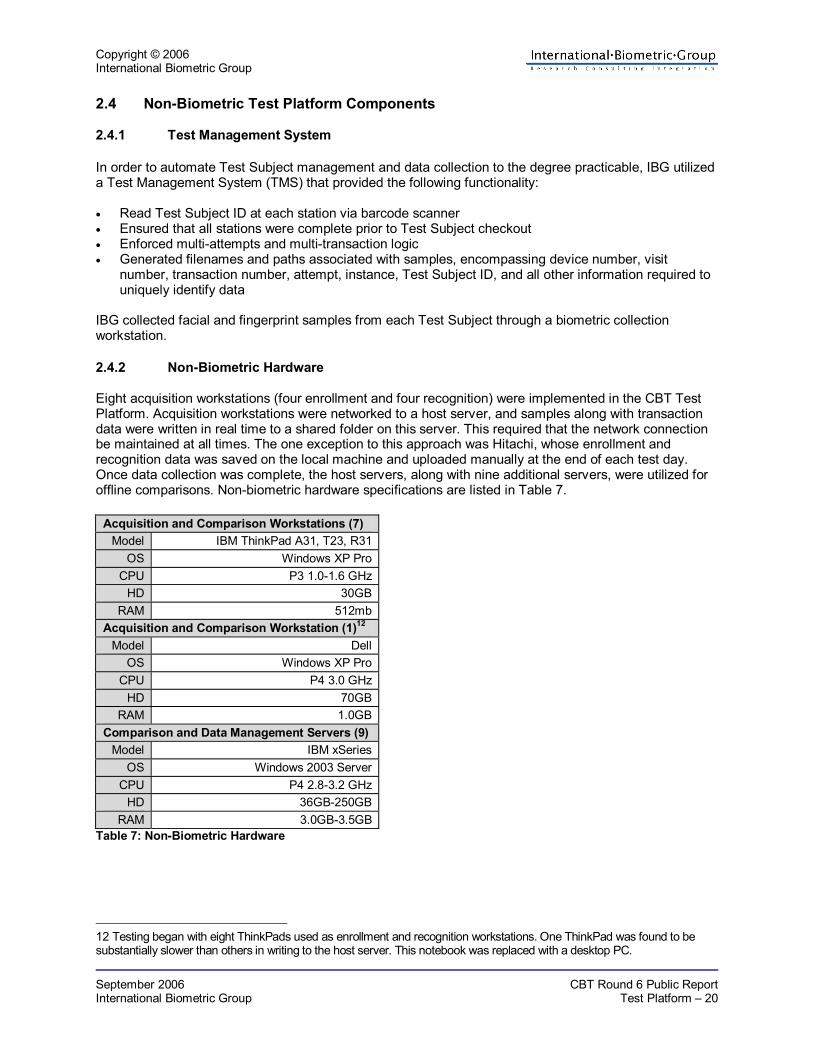
2.4 Non-Biometric Test Platform Components 2.4.1 Test Management System
In order to automate Test Subject management and data collection to the degree practicable, IBG utilized a Test Management System (TMS) that provided the following functionality: • Read Test Subject ID at each station via barcode scanner • Ensured that all stations were complete prior to Test Subject checkout • Enforced multi-attempts and multi-transaction logic • Generated filenames and paths associated with samples, encompassing device number, visit
number, transaction number, attempt, instance, Test Subject ID, and all other information required to uniquely identify data
IBG collected facial and fingerprint samples from each Test Subject through a biometric collection workstation.
2.4.2 Non-Biometric Hardware Eight acquisition workstations (four enrollment and four recognition) were implemented in the CBT Test Platform. Acquisition workstations were networked to a host server, and samples along with transaction data were written in real time to a shared folder on this server. This required that the network connection be maintained at all times. The one exception to this approach was Hitachi, whose enrollment and recognition data was saved on the local machine and uploaded manually at the end of each test day. Once data collection was complete, the host servers, along with nine additional servers, were utilized for offline comparisons. Non-biometric hardware specifications are listed in Table 7.
Acquisition and Comparison Workstations (7) Model IBM ThinkPad A31, T23, R31
OS Windows XP Pro CPU P3 1.0-1.6 GHz
HD 30GB RAM 512mb
Acquisition and Comparison Workstation (1)12 Model Dell
OS Windows XP Pro CPU P4 3.0 GHz
HD 70GB RAM 1.0GB
Comparison and Data Management Servers (9) Model IBM xSeries
OS Windows 2003 ServerCPU P4 2.8-3.2 GHz
HD 36GB-250GB RAM 3.0GB-3.5GB
Table 7: Non-Biometric Hardware
12 Testing began with eight ThinkPads used as enrollment and recognition workstations. One ThinkPad was found to be substantially slower than others in writing to the host server. This notebook was replaced with a desktop PC.

Copyright © 2006 International Biometric Group
September 2006 CBT Round 6 Public Report International Biometric Group Test Subjects and Environment – 21
3 Test Subjects and Environment
3.1 Test Subjects and Visits 650 Test Subjects participated in CBT Round 6. Of these, 174 conducted one visit and 476 conducted two visits. During Visit 1, Test Subjects conducted enrollment and recognition transactions at eight separate workstations. During Visit 2, Test Subjects conducted recognition transactions at four separate workstations. Visit 1’s lasted approximately 40 minutes (but could last up to an hour), and Visit 2’s lasted approximately 20 minutes. Test Subjects were paid $20 for each visit. Test Subject and Visit Totals are shown in Table 8.
Total Subjects 650 Visit 1's Executed 645
Visit 2's Executed 476 Total Visits Executed 1121
Subjects with Visit 2, No Visit 113 5 Table 8: CBT Test Subject and Visit Totals Test Subjects were recruited from the general population of the New York City metropolitan area through newspaper and online advertisements. The following information was acquired prior to testing. • Name • Phone (used to schedule Visit 2) • DL/ID# (for duplicate detection) • Age • Ethnicity • Glasses • Contact lenses (self-reporting) Digital fingerprint images and facial images were acquired to determine whether certain Test Subjects participated under multiple identities (whether deceitfully or due to scheduling error). Table 9 presents the demographic composition of the test population. Visit 1 Visit 2
Total Test Subjects 645 476 18-35 318 217 36-50 199 162 51-65 76 63
Age Range
Unspecified 52 34 Male 398 291 Gender
Female 247 185 White/Hispanic 362 269
Black 181 134 American Indian, Alaskan Native 2 1
Asian 24 17 Mixed 18 16 Other 11 7
Ethnicity
Unspecified 47 32 Table 9: CBT Demographics
13 Due to a scheduling error, five Test Subjects conducted Visit 2’s without having performed Visit 1’s. These Test Subjects therefore have recognition data but no enrollments. These Test Subjects were used for impostor comparisons only.

Copyright © 2006 International Biometric Group
September 2006 CBT Round 6 Public Report International Biometric Group Test Subjects and Environment – 22
3.2 Visit Frequency Figure 4 indicates the number of calendar days elapsed between Visit 1 and Visit 2 for Test Subjects who executed two visits. The majority of second visits were conducted 13-21 days after the Test Subject's Visit 1. As few as 1 and as many as 40 days elapsed between visits. The unusually high number of Test Subjects with only one day elapsed between Visit 1 and Visit 2 was due to a testing anomaly in which several Test Subjects executed their first visit late in the test period, leaving little Visit 2 scheduling flexibility. It was determined that collecting transactions with suboptimal inter-visit duration was preferable to not collecting transactions.
Figure 4: Days Elapsed between Visit 1 and Visit 2

Copyright © 2006 International Biometric Group
September 2006 CBT Round 6 Public Report International Biometric Group Test Subjects and Environment – 23
Figure 5 indicates the number of visits executed per day. Data collection spanned 42 days (29 business days) from May to June 2006. Dry run testing conducted prior to data collection is not reflected below.
Figure 5: Number of Visits Executed per Day 3.3 Test Environment Eight acquisition devices (including two from JIRIS, whose results are not included in this report) were installed in two adjacent offices in IBG’s New York City facilities. Four workstations were deployed in each test room, one per device. Mounting and positioning of enrollment and recognition devices was consistent with vendor documentation and/or instructions. Any meaningful variance from documented specifications was approved by vendors prior to testing. Temperature was kept at an average of 71 degrees during the test period. Overhead lighting intensity and positioning was consistent with that of an indoor office environment. While most enrollment transactions were conducted in Room 1 and most recognition transactions were conducted in Room 2, workstations were capable of performing either enrollment or recognition. During high-volume periods or when a device was undergoing diagnostics, Test Operators were instructed to proceed to any available device, such that in rare cases a Test Subject would perform both enrollment and recognition attempts at the same workstation. Test Subjects performed enrollment and recognition transactions from a seated position. Height-adjustable chairs were utilized to accommodate abnormally tall or short Test Subjects. Test Operators stood or sat next to Test Subjects during transactions to drive the applications and monitor Test Subject interactions. Figure 6 and Figure 7 show the device layout for each room.
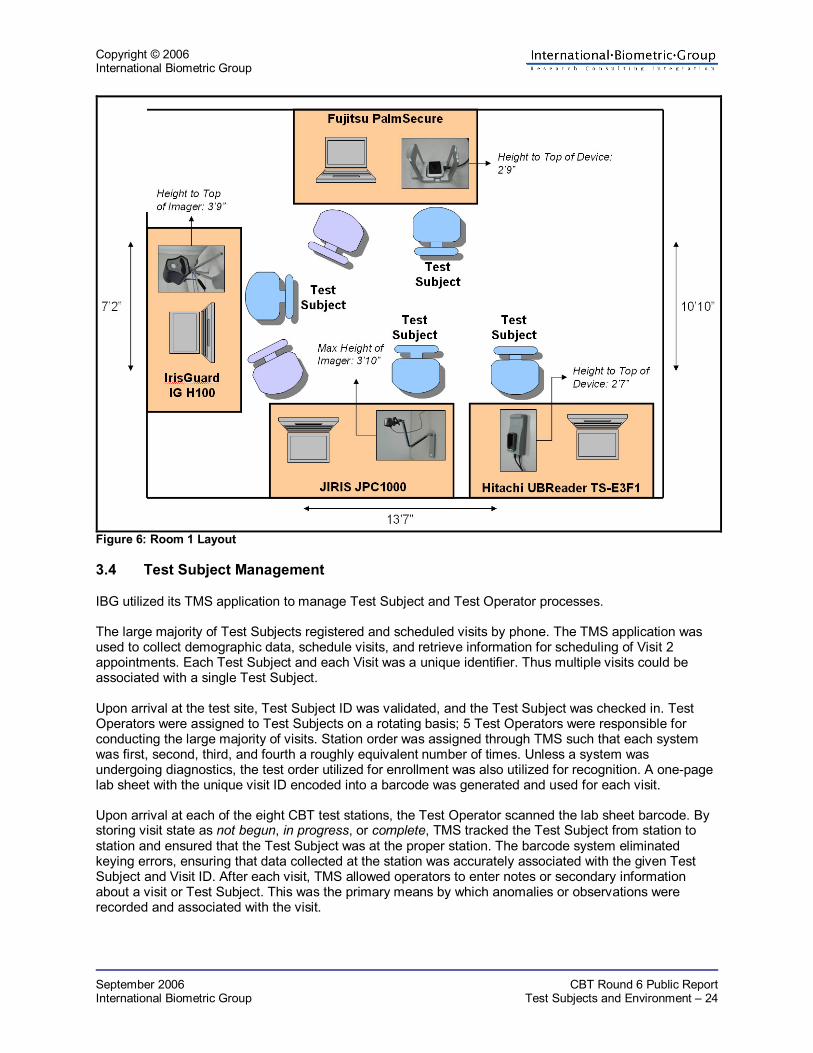
Copyright © 2006 International Biometric Group
September 2006 CBT Round 6 Public Report International Biometric Group Test Subjects and Environment – 24
Figure 6: Room 1 Layout 3.4 Test Subject Management IBG utilized its TMS application to manage Test Subject and Test Operator processes. The large majority of Test Subjects registered and scheduled visits by phone. The TMS application was used to collect demographic data, schedule visits, and retrieve information for scheduling of Visit 2 appointments. Each Test Subject and each Visit was a unique identifier. Thus multiple visits could be associated with a single Test Subject. Upon arrival at the test site, Test Subject ID was validated, and the Test Subject was checked in. Test Operators were assigned to Test Subjects on a rotating basis; 5 Test Operators were responsible for conducting the large majority of visits. Station order was assigned through TMS such that each system was first, second, third, and fourth a roughly equivalent number of times. Unless a system was undergoing diagnostics, the test order utilized for enrollment was also utilized for recognition. A one-page lab sheet with the unique visit ID encoded into a barcode was generated and used for each visit. Upon arrival at each of the eight CBT test stations, the Test Operator scanned the lab sheet barcode. By storing visit state as not begun, in progress, or complete, TMS tracked the Test Subject from station to station and ensured that the Test Subject was at the proper station. The barcode system eliminated keying errors, ensuring that data collected at the station was accurately associated with the given Test Subject and Visit ID. After each visit, TMS allowed operators to enter notes or secondary information about a visit or Test Subject. This was the primary means by which anomalies or observations were recorded and associated with the visit.

Copyright © 2006 International Biometric Group
September 2006 CBT Round 6 Public Report International Biometric Group Test Subjects and Environment – 25
Figure 7: Room 2 Layout 3.5 Test Subject Guidance Test Operators trained and directed Test Subjects in their interactions with each system, following scripted instructions and best practices for system usage. The following materials were developed to familiarize Test Subjects with systems and to guide their interactions (all but the introductory narrative were developed specifically for each system): • Introductory narrative: describes CBT objectives, discusses biometric technologies and their use • General instructions: anticipated duration of visit, movement between two test rooms • Device-specific narrative: introduction to how system operates, what types of feedback it will provide,
general description of interaction • Enrollment overview: description of enrollment process and Test Operator-provided enrollment
directions • Enrollment instructions: detailed step-by-step script for executing enrollment, guiding Test Subject in
enrollment process • Recognition overview: description of recognition process and Test Operator-provided recognition
directions (if any) • Recognition instructions: detailed step-by-step script for executing recognition, guiding Test Subject in
recognition process Test scripts for each device can be found in Annex D.

Copyright © 2006 International Biometric Group
September 2006 CBT Round 6 Public Report International Biometric Group Test Subjects and Environment – 26
3.6 Device Interaction Test Subject interaction with acquisition devices varied in the following ways: • Instance(s) provided by the Test Subject for primary-path and fallback enrollment and recognition
(e.g. index finger, left palm, right iris); • Visual, spoken, and other audible guidance and feedback provided by acquisition device. Interaction with systems varied as shown in Table 10:
System Samples Presented (Separately) System-Provided Guidance and Feedback14 Fujitsu Left and right palm Not implemented in IBG-developed test application
IrisGuard Left and right iris Spoken Hitachi Right index and right middle finger Audible and Visual
Table 10: Acquisition Device Functionality Comparison Fujitsu is designed to acquire the left or right palm. While automated guidance and feedback for enrollment and recognition transactions can be implemented using the BioAPI implementation that Fujitsu provided, returning messages such as "your hand is too far" and "your hand is too close", such guidance was not implemented in the IBG-developed test application. Therefore Test Subjects relied on the Test Operator to indicate when to present samples and when attempts and transactions were complete. Deployments based on this platform are tailored for applications such as ATM, physical access, time attendance, and PC login would provide feedback in a fashion commensurate with the application.
Figure 8: Fujitsu Interaction (Photo provided by Fujitsu)
14 Guidance refers to instructions or triggers provided automatically in the course of every attempt or transaction, whereas feedback refers to system responses to specific, typically anomalous behaviors or events.

Copyright © 2006 International Biometric Group
September 2006 CBT Round 6 Public Report International Biometric Group Test Subjects and Environment – 27
IrisGuard is designed to acquire the left or right iris. The system provided spoken guidance and feedback to the Test Subject during enrollment and recognition. A .wav file played at the beginning of each enrollment and recognition attempt instructed the Test Subject to present his iris. If the Test Subject was positioned too closely or too far away, the system prompted the Test Subject to move closer or further away. If the Test Subject was outside of the range of operations, the device would not provide any instructions.
Figure 9: IrisGuard Interaction Hitachi is designed to acquire the left or right index or middle finger, although it would be possible to acquire the ring or little fingers as well. The system provided audible and visual guidance and feedback during enrollment and recognition, of which the audible portion was more relevant. When the finger vascular sample was acquired successfully, the system would chime and a green checkmark would appear on the screen. If the sample was not acquired successfully, the system would show a red X. The screen was positioned in view of the Test Subject, in keeping with the system’s typical usage.
Figure 10: Hitachi Interaction

Copyright © 2006 International Biometric Group
September 2006 CBT Round 6 Public Report International Biometric Group Data Collection Processes – 28
4 Data Collection Processes
4.1 Introduction Data collection took place through enrollment transactions, in which enrollment templates were acquired, and recognition transactions, in which recognition samples were acquired. Enrollment transactions preceded recognition transactions. Device order was automatically assigned upon generation of the Test Subject data sheet. Test Operators were allowed to change test order during high-volume periods or when a system was unavailable in order to maintain throughput rates. System-to-system Test Subject flow for Visit 1 and Visit 2 are presented in Figure 11 and Figure 12. Multiple enrollment templates and recognition samples were acquired during enrollment and recognition transactions. This enabled more robust evaluation of error rates within and across Test Subjects and increased Test Subject familiarity with device usage. Table 11 shows the maximum number of enrollment templates and recognition samples acquired per visit.
Transaction Type
When Executed
Transactions per Visit
Data Acquired per Transaction Data Collected per Visit
Enrollment Visit 1 2 Up to 2 enrollment templates Up to 4 enrollment templates 2 transactions x 2 instances
Recognition Visit 1, 2 3 Up to 6 recognition samples (three per instance)
Up to 18 recognition samples3 transactions x 3 samples x 2 instances
Table 11: Maximum Enrollment Templates and Recognition Samples Acquired per Visit 4.2 Enrollment Attempts and Transactions Test Subjects, having been instructed by Test Operators in device usage and operations, were positioned in a consistent fashion with respect to the enrollment device before the Test Operator began the enrollment application. The Test Operator triggered the enrollment transaction, which cycled automatically until the instance was enrolled, the instance failed to enroll, or a timeout was encountered. Once enrollment began for a given instance the Test Operator did not need to interact with the application unless the instance was enrolled successfully or the instance failed to enroll. The Test Operator provided instructions and guidance to ensure that the Test Subject was positioned correctly and was presenting the instance in the proper fashion. 4.2.1 System-Specific Enrollment Parameters Enrollment parameters such as minimum samples required to enroll and time out logic varied from system to system. For Hitachi, a minimum of four finger vein samples were required to enroll each instance. Within each enrollment transaction, the right middle finger was enrolled prior to the right index finger. The first three acquisitions were evaluated for quality and internal consistency, and the fourth acquisition was used to verification against the first three. Hitachi enrollment attempts were configured to time out after 30 seconds. For IrisGuard, a minimum of four attempts were required to enroll each instance, and no more than six enrollment attempts were permitted. Within each enrollment transaction, the right iris was enrolled prior to the left iris. If a Test Subject’s first six attempts failed to generate a successful enrollment for a given iris, a second set of up to six attempts was permitted. IrisGuard enrollment attempts were configured to time out after 30 seconds. In post-testing discussions, IrisGuard stated that its device supported enrollment via one multi-capture presentation, and that four presentations (as required by the PrivateID implementation that IBG was provided) were unnecessary. Based on this assertion, had IrisGuard been tested on a PrivateID implementation that required fewer enrollments, enrollment transaction duration would likely have been substantially shorter.

Copyright © 2006 International Biometric Group
September 2006 CBT Round 6 Public Report International Biometric Group Data Collection Processes – 29
Figure 11: Device-to-Device Test Subject Flow (Visit 1)

Copyright © 2006 International Biometric Group
September 2006 CBT Round 6 Public Report International Biometric Group Data Collection Processes – 30
Figure 12: Device-to-Device Test Subject Flow (Visit 2) For Fujitsu, a minimum of three hand vein samples were required to enroll. The first two samples are used for enrollment, and the third sample is matched against the preceding two samples. Within each enrollment transaction the right palm was enrolled prior to the left palm. If either palm failed to enroll, another enrollment attempt was immediately triggered. The first acquisition was the benchmark against which subsequent presentations were judged. Since IBG did not implement time-out logic, if the first presentation was unrepresentative or not repeatable, the Test Subject could conduct limitless presentations without enrolling successfully or being declared a failure to enroll. Therefore IBG implemented the following policy for Fujitsu enrollment: • If after 6 enrollment presentations for a given instance the Test Subject was not enrolled15, the Test
Operator hit "Retry". This cleared the first enrollment presentation, which was presumably deficient, and began a new enrollment transaction for that hand.
• If after 6 additional presentations of this instance enrollment was not successful, the Test Operator hit
"Cancel" and the instance was declared a failure to enroll. This is the only CBT process in which a Test Operator was responsible for counting presentations and declaring an error after a threshold was exceeded.
15 The enrollment application provides an "authentication" prompt which indicates that one additional presentation is required to enroll.

Copyright © 2006 International Biometric Group
September 2006 CBT Round 6 Public Report International Biometric Group Data Collection Processes – 31
4.2.2 Permitting Additional Enrollment Attempts Failures to enroll may occur for several reasons: inability of a system to sense or locate a presented sample (such that segmentation and extraction never begin); insufficient quality of acquired sample(s); or device time-out. Generally, as the number of enrollment attempts and the time permitted to enroll increase, failure to enroll rates decrease. Recall that for each system, up to two instances could be enrolled (e.g. left and right palm). If a given system failed to enroll one or both instances, the CBT enrollment application automatically initiated additional enrollment attempt(s) for those instances that failed enrolled. For example, if a Test Subject successfully enrolled his left iris but failed to enroll his right iris, the CBT enrollment application would initiate another enrollment attempt for the missing instance (in this case the right iris). The additional enrollment attempt would follow the same logic as in the initial enrollment. In this case, if the right iris was enrolled in the additional attempt, the left and right irises were declared to have enrolled successfully. It is only after two failed enrollment attempts that a given instance was declared unable to enroll. In order for an entire transaction to be declared a failure to enroll (and to thus contribute to the system’s failure to enroll rate), both instances would have failed both the primary and additional enrollment attempts. 4.2.3 Executing Multiple Enrollment Transactions In a process unrelated to the multi-attempt process described in 4.2.2, each Test Subject conducted two separate enrollment transactions in each device. This effectively doubled the number of reference templates available for analysis in the test. Based on this methodology, each Test Subject generated up to 4 enrollment templates per system (2 instances x 2 enrollment transactions). While end users will not typically enroll multiple times in operational systems, this methodology was beneficial for a few reasons. • Test Subjects may become more habituated to device usage through multiple enrollment
transactions. A frequently-cited limitation of biometric scenario testing is that Test Subjects are not sufficiently familiar with device interaction, such that performance is not representative of what is attained through a habituated population. The CBT approach, while not a perfect emulation of the effects of frequent device usage, increases the frequency and duration of Test Subject interaction with acquisition devices prior to recognition transactions.
• One of the Test Subject’s two enrollments may be more or less susceptible to false matches or false
non-matches than the other. By enrolling Test Subjects twice, one can conduct a high-level assessment of the degree to which specific instances are more susceptible than others to false matching and false non-matching.
Enrollment transaction process flow is shown in Figure 13. 4.3 Recognition Sample Capture Attempts and Transactions 4.3.1 Generic Recognition Sample Capture Process In CBT, a recognition transaction is comprised of up to six recognition attempts (three per instance). This emulates a decision policy in which up to three attempts are permitted for each enrolled instance to generate a sufficiently strong comparison score. By acquiring multiple recognition samples, transactional acquisition and comparison rates could be calculated. Within each six-attempt transaction, the strongest match score was used to calculate genuine and impostor error rates (discussed in more detail in 5.2). Recognition attempts could time out if the Test Subject did not provide adequate recognition samples within the recognition attempt time out limit, which was roughly 30 seconds. Recall that recognition attempts and transactions did not involve real-time comparison; recognition samples were instead collected for subsequent offline comparison. Test Operators did not provide usage or interaction instructions to Test Subjects during recognition transactions other than to inform Test Subjects of the proper time at which to begin interaction with recognition devices (i.e. the point at which a

Copyright © 2006 International Biometric Group
September 2006 CBT Round 6 Public Report International Biometric Group Data Collection Processes – 32
transaction starts). This process was in keeping with recognition in real-world applications, in which guidance is not provided during recognition transactions. If a Test Subject was unable to present recognition samples within time-out parameters, corrective instructions were provided. In instances where individuals clearly fail to follow instructions, the recognition transaction was terminated and restarted with no adverse impact. Between each attempt within a recognition transaction, the Test Operator hit "OK" to proceed to the next attempt or transaction. 4.3.2 Executing Multiple Recognition Sample Capture Attempts and Transactions The execution of three sequential recognition sample capture transactions took place through an extended Test Subject-acquisition device interaction as shown in Figure 14. Once the Test Subject was properly positioned, the Test Operator triggered recognition sample capture attempt 1 within recognition transaction 1. The device attempted to acquire the first sample from the instance 1 (e.g. right hand). If necessary the device provided positioning guidance to the Test Subject. The Test Subject remained engaged with the device after the first recognition. The Test Operator immediately triggered the second recognition sample capture attempt for instance 1, then upon successful sample capture triggered recognition sample capture attempt 3. The Test Subject remained engaged with the device between attempts to emulate usage on the part of a habituated individual capable of rapidly and correctly aligning himself with a device16. Following recognition sample capture attempt 3, the Test Subject executed a three-attempt recognition transaction for the alternate instance (e.g. left hand). Recognition sample capture attempts for instance 2 were conducted in the same fashion as instance 1. Following the third recognition sample capture attempt for instance 2, recognition sample capture transaction 1 was completed. With the Test Subject repositioned as necessary, the Test Operator triggered recognition sample capture transaction 2 for that same device. Recognition sample capture transaction 2 followed the same processes as recognition sample capture transaction 1; up to six samples (e.g., three left-iris and three right-iris) were acquired. Recognition sample capture transaction 3 for that same device was executed after recognition sample capture transaction 2. Upon the completion of recognition sample capture transaction 3 for a given device, up to 18 recognition samples will have been acquired. As opposed to enrollment transactions, in which there were accommodations for additional effort for failures to enroll, recognition sample capture either resulted in a capture or a failure to capture. No additional attempts were permitted, such that each Test Subject performed exactly 18 recognition sample capture attempts for each system. The Test Subject moved to the next device and repeated the process. A total of 54 recognition samples were acquired for subsequent comparison across all three devices. 4.3.3 Hitachi Recognition Sample Capture Process In order to test the Hitachi system following the general CBT methodology (i.e. real-time enrollment, offline comparison of recognition samples vs. enrollment templates), and to generate meaningful results, Hitachi modified its native recognition sample capture process to acquire a 14-15 second image stream with each recognition sample capture attempt. The comparison algorithm in Hitachi's typical application is multi-pass, meaning that a first algorithm is used for 1:1 comparison once the finger is detected. If the recognition sample is a strong match, the user is authenticated in the first few frames and data collection stops. If the user is not matched in the first few frames, data collection continues, and a second algorithm is triggered which examines different feature data. Since CBT uses the same “image” or series of images for offline genuine and impostor comparisons – and since impostor comparisons are likely to invoke a second-pass algorithm – it is necessary to acquire the maximum amount of recognition sample data that might be used to execute genuine or
16 Test Subjects were instructed to disengage from the device in the case of a fail-to-acquire attempt, as such failures may have been attributable to poor positioning.

Copyright © 2006 International Biometric Group
September 2006 CBT Round 6 Public Report International Biometric Group Data Collection Processes – 33
impostor comparisons. In an operational device, this would translate to approximately 5 seconds of feature-vector capture time. However, the Hitachi application had to save frames from the capture device as opposed to feature vectors in order to facilitate offline comparisons. Different feature vectors are extracted depending on the pass. Thus each recognition attempt entailed the capture of 14-15 seconds of frames (50 frames, specifically). This process, while unusual for vascular recognition systems, is normal for face recognition system that process video streams.
Figure 13: Enrollment Transaction Process Flow

Copyright © 2006 International Biometric Group
September 2006 CBT Round 6 Public Report International Biometric Group Data Collection Processes – 34
Figure 14: Recognition Transaction Process Flow
Copyright © 2006 International Biometric Group
September 2006 CBT Round 6 Public Report International Biometric Group Data Collection Processes – 35
4.3.4 Failure to Acquire Failure to acquire occurs during recognition attempts and transactions as opposed to enrollment transaction (acquisition failures during enrollment contribute to failure to enroll). A Test Subject may present images to an acquisition device during a recognition transaction without samples being acquired, or without samples meeting quality criteria. In a real-world application, failure to acquire samples during a recognition transaction may trigger an alert or fallback process. This fallback process may or may not be identical to the process put in place when a user is rejected after a failure to match. In CBT, failures to acquire are measured at the attempt level and at the transaction level. Failure to acquire at the attempt level is referred to as FTA. A Test Subject for whom 3 out of a possible 6 samples are acquired in a transaction would have an FTA, for this transaction, of 50%. Failure to acquire at a transaction level is the proportion of transactions in which zero of 6 possible samples are acquired. Failure to acquire at the transaction level is referred to as T-FTA. 4.4 Calculating Transaction and Attempt Duration Two transaction duration metrics are reported in CBT: enrollment transaction duration and recognition attempt duration. Enrollment transactions were measured in an automated fashion from the point at which a Test Operator clicked "OK" to trigger the enrollment transaction to the point at which the enrollment process was completed for the second instance. Enrollment transaction duration encompasses the following elements: • time required for the Test Subject to align himself with the acquisition device • all presentations and attempts required to enroll (up to 8, depending on the system) • time lapsed between each attempt • the time lapsed between enrollment of the first and second instance • enrollment template generation on the local workstation • any additional enrollment attempts granted in case of failure • time required for Test Operator to provide guidance to Test Subject in the course of a transaction Enrollment attempt time was measured but is not reported, because the operationally relevant figure is the time required for all attempts within an enrollment transaction to be executed. Recognition attempt duration was measured in an automated fashion from the point at which a Test Operator clicked "OK" to trigger the recognition sample capture attempt until the point at which the recognition sample capture application either acquired the sample or declared the attempt a failure to acquire. Recognition attempt duration encompasses the following elements: • time required for the Test Subject to present the instance to the acquisition device • time for the recognition sample capture application to locate and acquire the instance • time for the recognition sample capture application algorithms to validate recognition sample quality It is important to note that recognition sample capture attempt duration is not inclusive of comparison time, as no real-time comparisons take place. Comparisons take place offline, on a server, in bulk. Validation of sample quality on the part of the recognition sample capture application is typically the determinant of recognition sample capture attempt completion. Recognition transaction time was measured but is not reported. Since recognition transactions were comprised of six attempts, and there is no real-time matching, recognition transaction time (inclusive of all six attempts) is not an operationally meaningful figure. One could determine, through offline processing, which of the six attempts was the first to match against a predetermined threshold, but time constraints precluded this analysis.

Copyright © 2006 International Biometric Group
September 2006 CBT Round 6 Public Report International Biometric Group Data Collection Processes – 36
Recall that Test Subjects were prepared to present data to, or were aligned with, each device prior to the triggering of the enrollment and recognition applications. In recognition transactions, each sequential recognition attempt was executed in direct succession, such that the Test Subject would become accustomed to the method of presentation over the course of a transaction. Hitachi recognition attempt duration was evaluated in a different fashion than that of other systems. As discussed under 4.3.3, it was necessary to modify the Hitachi device and software such that it could record a 14-15 second "stream" of images to enable offline multi-pass comparisons. Hitachi recognition attempt time was measured as the duration between the test operator's clicking "OK" triggering the capture application and the capture of the first "frame" on the part of the Hitachi application. An additional 400ms was added to this duration to account for functions implemented in operational systems that were disabled due to the modification of the native Hitachi recognition sample capture application. 4.5 Location and Removal of Erroneously Collected Data Eliminating data collection and logging errors attributable to Test Operators or application malfunction is an essential part of biometric performance testing. If enrollment templates or recognition samples from the same Test Subject are mistakenly categorized as being from two different Test Subjects, genuine and impostor error rate calculations may be erroneous. Although most CBT test execution and data collection processes were automated, a limited number of scenarios presented themselves in which enrollment templates or recognition samples could be collected improperly. The most common case is transposition of left and right irises. The risk of erroneous acquisition is greater during recognition transactions than during enrollment due to the number of recognition samples acquired (up to 18) and the fact that numerous recognition samples are acquired in rapid succession. IBG performed manual data validation to identify and remove or re-label incorrectly-acquired data. This was performed by (1) identifying samples that generated a series of anomalously high false match or false non-match rates as probes or gallery records and (2) in the case of iris recognition, visually comparing iris images (which were degraded by the application) to determine whether a sample had been transposed. Since strong impostor scores are less common than weak genuine scores, and are thus are more likely to negatively impact comparison accuracy, several dozen strong impostor scores for each matcher were manually reviewed to ensure that no Test Subject management errors had occurred. IrisGuard's total number of attempts and comparisons are proportionally lower than those of Hitachi and Fujitsu in part due to the removal of erroneously-capture data.

Copyright © 2006 International Biometric Group
September 2006 CBT Round 6 Public Report International Biometric Group Comparison Processes and Accuracy Calculations – 37
5 Comparison Processes and Accuracy Calculations
5.1 Comparison Processes Biometric matching is typically based on comparison of newly-acquired biometric samples against previously enrolled templates. In biometric tests, this process is emulated though the use of probe and gallery datasets. Gallery datasets contain enrollment templates, and probe datasets contain the equivalent of newly-acquired biometric feature samples. All CBT comparisons were based on 1:1 comparisons as opposed to 1:N identification. Each element in the probe dataset is compared against each element in the gallery dataset to generate comparison scores. Results from comparisons of different instances from the same Test Subject (e.g. left iris vs. right iris from the same Test Subject) were excluded from all analyses and reporting. For Fujitsu, each comparison resulted in a match-no match decision at a specified threshold as opposed to a match score. Therefore Fujitsu performance is shown at a single operating point, as opposed to a continuous line showing performance at all thresholds. Fujitsu was tested at three thresholds: Low Security, Default, and High Security. The Default setting should be seen as the focus of the evaluation; testing at low and high security provides supplemental data. In order to generate results at each threshold, IBG re-executed the entire N:N bulk processing effort three times. 5.2 Attempt-Level and Transactional Accuracy Calculation Accuracy results are presented at the attempt and transaction levels. Attempt-level accuracy is based on results from each comparison, measuring accuracy without consideration of a multi-attempt decision policy. Attempt-level false match rate (FMR) is the proportion of impostor attempts in which comparison of a Test Subject's recognition sample against another Test Subject's enrollment template generates a comparison score above a given threshold. Attempt-level false non-match rate (FNMR) is the proportion of genuine attempts in which comparison of a Test Subject's recognition sample against his enrollment template generates a comparison score below a given threshold. FMR and FNMR do not include acquisition failures. Transactional error rates reflect performance in applications wherein multiple match attempts are permitted within each transaction. This is consistent with the use of biometrics in many applications. Transactional genuine error rates are lower than attempt-level genuine error rates, because a Test Subject is more likely to match when given multiple attempts. For the same reason, transactional impostor error rates are higher than attempt-level impostor error rates. Transactional accuracy is based on the strongest comparison score generated within a transaction. For recognition transactions in which all recognition samples were successfully acquired, six comparison scores are generated based on comparison of each recognition sample against each enrollment template. Transactional False Non-Match Rate (T-FNMR) is the proportion of genuine transactions in which the strongest score generated through comparison of samples within a recognition transaction against that same Test Subject's enrollment template exceeds a given threshold. Transactional False Match Rate (T-FMR) is the proportion of impostor transactions in which the strongest score generated through comparison of all samples within a recognition transaction against another Test Subject's enrollment template exceeds a given threshold. T-FNMR and T-FMR do not include acquisition failures. While attempt-level and transactional accuracy results are each fundamental to evaluating system performance, transactional accuracy results are more likely to be reflective of what is encountered in operational systems.
Copyright © 2006 International Biometric Group
September 2006 CBT Round 6 Public Report International Biometric Group Comparison Processes and Accuracy Calculations – 38
5.3 Hitachi "Better-Instance" Comparison Logic At the request of the vendor, who was concerned with test results' fidelity to the comparison logic inherent in their operational deployments, Hitachi matching accuracy was evaluated through two separate analyses. One Hitachi analysis utilized results from both instances from each Test Subject (this is how other CBT systems were evaluated). This can be thought of as a "both-instance" approach. Another Hitachi analysis, referred to as a "better-instance" approach, was based on the better-performing instance from each Test Subject, as described below. In most operational Hitachi implementations, users typically enroll both the index and middle fingers of the right hand. If the user is not authenticated through the primary finger (typically the middle), he can revert to the fallback finger (typically the index). A user may favor a specific finger based on whichever appears to work well for him. In order to maintain fidelity to the “primary finger” concept, better-instance analysis was based on the better-performing instance from each Test Subject. The better-performing instance was that which generated the lowest average comparison score from nine genuine attempts (recall that each Test Subject performed separate three recognition transactions, and that in each transaction up to three samples were acquired from each instance). The hypothesis was that the instance with the lowest average genuine comparison scores would typically be selected by a habituated user, and that this would reduce non-match rates. Once the better instance was determined for each Test Subject, accuracy was analyzed as follows: • At the attempt level, comparisons associated with the better instance are used as the basis of FMR
and FNMR. Therefore roughly ½ of the total available genuine comparisons are utilized. • At the transaction level, transactions associated with the better instance are used as the basis of T-
FMR and T-FNMR. The number of transactions is identical to the number used in the "both instance" approach, but each transaction is comprised of fewer samples.
Results presented in Sections 7 and 8 are based on the better-instance approach. Annex A presents Hitachi both-instance results. Relative to a both-instance approach, a better-instance approach should generate results as follows: • Attempt-level FNMR, being based on the better-performing instance, should decrease. This is the
primary motivation of the better-instance analysis. • Transactional FNMR may increase because each transaction is comprised of three better-instance
attempts as opposed to six attempts across both instances. • Attempt-level FMR should be relatively unchanged. • Transactional FMR may decrease because there are fewer attempts within each transaction.

Copyright © 2006 International Biometric Group
September 2006 CBT Round 6 Public Report International Biometric Group Comparison Processes and Accuracy Calculations – 39
5.4 Calculating FAR and FRR Capture errors (FTA, FTE) can be combined formulaically with comparison errors (FMR, FNMR) to generate full-system error rates. False Accept Rate (FAR) is the proportion of zero-effort non-genuine transactions incorrectly accepted. FAR is calculated as follows:
FAR = FMR * (1 – FTA) False Reject Rate (FRR) is the proportion of genuine verification transactions incorrectly denied. FRR is calculated as follows:
FRR = FTA + FNMR * (1 – FTA) The methods by which these metrics are generated vary at the attempt and transaction levels. To avoid over-complicating results presentation, these metrics are not rendered in this Report. However, the metrics presented in this Report (FNMR, FMR, T-FNMR, T-FMR, FTA, T-FTA, and FTE), along with underlying score data, are sufficient for generation of FAR and FRR

Copyright © 2006 International Biometric Group
September 2006 CBT Round 6 Public Report International Biometric Group Results: Enrollment, Acquisition, and Transaction Duration – 40
6 Results: Enrollment, Acquisition, and Transaction Duration
This section presents results for enrollment, sample capture, and transaction duration. The following definitions are normally used in calculation of acquisition error rates: • Failure-To-Enroll Rate (FTE): proportion of enrollment transactions in which the device is unable to
complete the enrollment process • Failure-To-Acquire Rate (FTA): proportion of recognition attempts in which the device is unable to
acquire or locate an image or signal of sufficient quality • Transactional Failure-To-Acquire Rate (T-FTA): proportion of recognition transactions in which the
device is unable to acquire or locate an image or signal of sufficient quality In CBT, acquisition data is collected at the attempt and transaction level (transactions are comprised of multiple attempts). Therefore an additional metric is required to measure the failures to acquire at the transaction level as opposed to the attempt level. 6.1 Enrollment Rates In CBT, enrollment was a real-time event, such that the Test Operator was aware at the completion of the enrollment transaction whether a Test Subject had successfully enrolled. Recall that each enrollment transaction was comprised of up to two enrollment attempts. If a Test Subject enrolled fewer than two instances in his first enrollment attempt (e.g. the right hand but not the left hand), an additional attempt was triggered in which any instance that failed to enroll were re-acquired. It is only after failed enrollment in this second attempt that a given instance would be considered a failure to enroll. Recall also that each Test Subject executed two completely separate enrollment transactions, one directly after the other. Enrollment results were tabulated separately for each of the two enrollment transactions that Test Subjects executed. Slightly fewer than 1300 enrollment transactions were executed in each system, two for each of the approximately 650 Visit 1’s executed. Reduction in FTE from Enrollment Transaction 1 to Enrollment Transaction 2 may be related to increased familiarity with the device. Terminology used in Table 12 through Table 14 below is as follows: • The Sum: Enrollment Transactions 1&2 column represents the total of the columns to the left. • Transactions with Zero Instances Enrolled corresponds to transactions in which no samples were
successfully enrolled. In these transactions, Test Subjects will have executed two enrollment attempts per instance prior to the instance being declared a failure to enroll. This figure, shown in bold in Table 12 through Table 13, is the basis of FTE calculation. This assumes that in an operational system enrollment of one of two instances would be sufficient to constitute an enrollment.
• Transactions with One Instance Enrolled corresponds to transactions in which exactly one of two
instances was successfully enrolled. In these transactions, Test Subjects will have executed two enrollment attempts for the instance that was not successfully enrolled.
• Transactions with Two Instances Enrolled corresponds to transactions in which both instances were
successfully enrolled. In these transactions, Test Subjects will have executed either one or two enrollment attempts per instance, depending on whether both samples were enrolled in the first attempt.

Copyright © 2006 International Biometric Group
September 2006 CBT Round 6 Public Report International Biometric Group Results: Enrollment, Acquisition, and Transaction Duration – 41
Fujitsu Enrollment Transaction 1
Enrollment Transaction 2
Sum: Enrollment Transactions 1&2
Transactions with Zero Instances Enrolled 1 0.16% 0 0.00% 1 0.08%Transactions with One Instance Enrolled 12 1.86% 8 1.24% 20 1.55%
Transactions with Two Instances Enrolled 632 97.98% 637 98.76% 1269 98.37%Total Transactions 645 100.00% 645 100.00% 1290 100.00%
Table 12: Fujitsu Enrollment Results
Hitachi Enrollment Transaction 1
Enrollment Transaction 2
Sum: Enrollment Transactions 1&2
Transactions with Zero Instances Enrolled 1 0.16% 0 0.00% 1 0.08%Transactions with One Instance Enrolled 4 0.62% 2 0.31% 6 0.47%
Transactions with Two Instances Enrolled 637 99.22% 640 99.69% 1277 99.45%Total Transactions 642 100.00% 642 100.00% 1284 100.00%
Table 13: Hitachi Enrollment Results
IrisGuard Enrollment Transaction 1
Enrollment Transaction 2
Sum: Enrollment Transactions 1&2
Transactions with Zero Instances Enrolled 7 1.09% 11 1.71% 18 1.40%Transactions with One Instance Enrolled 36 5.61% 36 5.61% 72 5.61%
Transactions with Two Instances Enrolled 599 93.30% 595 92.68% 1194 92.99%Total Transactions 642 100.00% 642 100.00% 1284 100.00%
Table 14: IrisGuard Enrollment Results Hitachi and Fujitsu achieved FTE rates that can be considered exceptionally low for this type of testing. Both systems failed to enroll only a single transaction out of nearly 1300. Hitachi, furthermore, was able to enroll both the middle and index finger in all but 7 enrollment transactions. IrisGuard FTE, while higher than that of Hitachi and Fujitsu, is the lowest that we have observed for any iris recognition system, including those iris recognition systems that IBG evaluated in 2005's Independent Testing of Iris Recognition Technology17 (a test based on a very similar methodology to CBT Round 6). Enrollment rates in operational systems may differ substantially from those encountered in CBT based on an application's enrollment policy. For example, if a deployer were considering a policy in which both instances had to enroll for the user to register, then the "Only One Instance Enrolled" row would provide the most operationally relevant data.
17 http://www.biometricgroup.com/reports/public/ITIRT%20-%20Final%20Report.pdf

Copyright © 2006 International Biometric Group
September 2006 CBT Round 6 Public Report International Biometric Group Results: Enrollment, Acquisition, and Transaction Duration – 42
6.2 Enrollment Transaction Durations Table 15 shows enrollment transaction durations for each system as described above in 4.4. Maximum duration is not shown because such values may have been inclusive of interaction between the Test Operator and the Test Subject. Typical enrollment maximum enrollment durations were on the order of 3-4 minutes, including reorientation of Test Subjects.
Fujitsu Hitachi IrisGuard Min (seconds) 32.6 17.9 34.1
Median (seconds) 61.7 33.3 44.5 Mean (seconds) 66.8 38.4 50.8
Table 15: Enrollment Transaction Durations Hitachi median enrollment duration is the lowest of the three systems tested, although each system delivered enrollment transaction duration within the general performance bounds of most 1:1 applications. Of the three systems tested, Hitachi's presentation method was the least ambiguous. As discussed in 4.2.1, IrisGuard was tested through PrivateID enrollment software that required a minimum of four attempts to enroll. IrisGuard stated that its device supported enrollment via one multi-capture presentation, and that four presentations (as required by the PrivateID implementation that IBG was provided) were unnecessary. Based on this assertion, had IrisGuard been tested on a PrivateID implementation that required fewer enrollments, enrollment transaction duration would likely have been substantially shorter. Enrollment duration, of all CBT metrics, is most likely to be dependent on the constraints of a given application. For example, employee enrollment in a human resources department might occupy several minutes while paperwork is being filled out. Conversely, enrollment in a Civil ID program may need to be conducted within seconds in order to address throughput requirements. Further, the application software utilized for enrollment can be as much of determinant of performance as interaction between Test Subject and sensor.
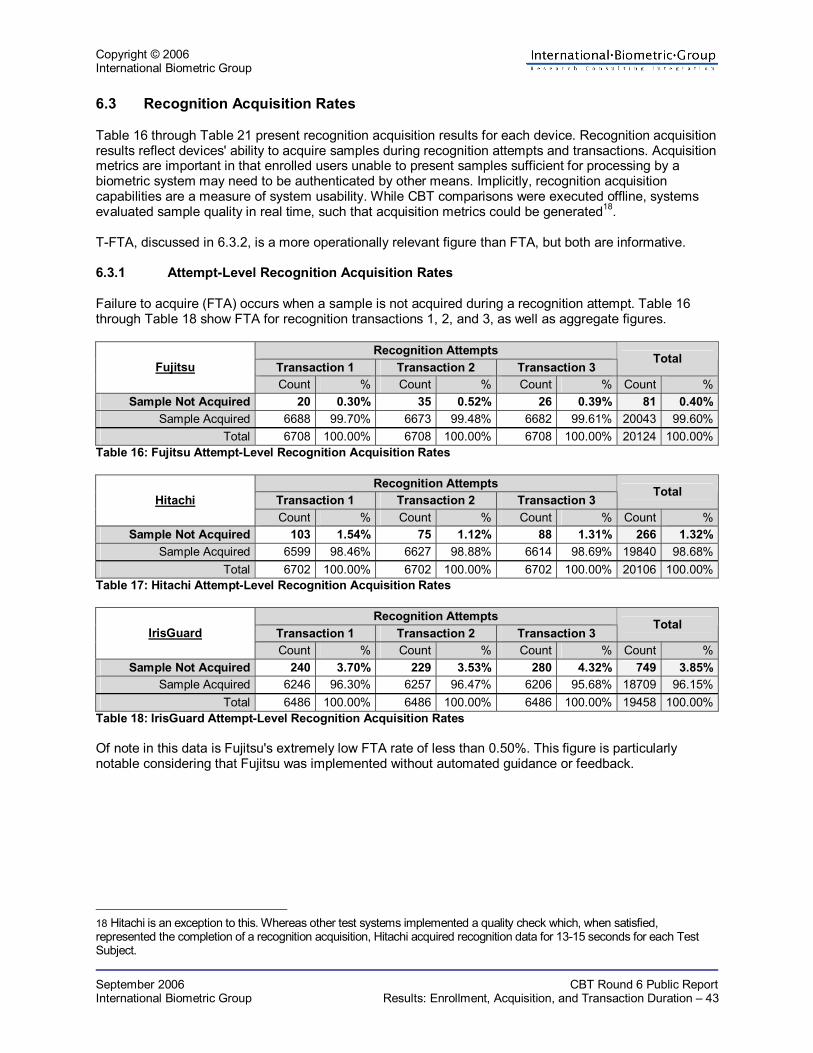
Copyright © 2006 International Biometric Group
September 2006 CBT Round 6 Public Report International Biometric Group Results: Enrollment, Acquisition, and Transaction Duration – 43
6.3 Recognition Acquisition Rates Table 16 through Table 21 present recognition acquisition results for each device. Recognition acquisition results reflect devices' ability to acquire samples during recognition attempts and transactions. Acquisition metrics are important in that enrolled users unable to present samples sufficient for processing by a biometric system may need to be authenticated by other means. Implicitly, recognition acquisition capabilities are a measure of system usability. While CBT comparisons were executed offline, systems evaluated sample quality in real time, such that acquisition metrics could be generated18. T-FTA, discussed in 6.3.2, is a more operationally relevant figure than FTA, but both are informative. 6.3.1 Attempt-Level Recognition Acquisition Rates Failure to acquire (FTA) occurs when a sample is not acquired during a recognition attempt. Table 16 through Table 18 show FTA for recognition transactions 1, 2, and 3, as well as aggregate figures.
Recognition Attempts Transaction 1 Transaction 2 Transaction 3
Total Fujitsu
Count % Count % Count % Count %Sample Not Acquired 20 0.30% 35 0.52% 26 0.39% 81 0.40%
Sample Acquired 6688 99.70% 6673 99.48% 6682 99.61% 20043 99.60%Total 6708 100.00% 6708 100.00% 6708 100.00% 20124 100.00%
Table 16: Fujitsu Attempt-Level Recognition Acquisition Rates
Recognition Attempts Transaction 1 Transaction 2 Transaction 3
Total Hitachi
Count % Count % Count % Count %Sample Not Acquired 103 1.54% 75 1.12% 88 1.31% 266 1.32%
Sample Acquired 6599 98.46% 6627 98.88% 6614 98.69% 19840 98.68%Total 6702 100.00% 6702 100.00% 6702 100.00% 20106 100.00%
Table 17: Hitachi Attempt-Level Recognition Acquisition Rates
Recognition Attempts Transaction 1 Transaction 2 Transaction 3
Total IrisGuard
Count % Count % Count % Count %Sample Not Acquired 240 3.70% 229 3.53% 280 4.32% 749 3.85%
Sample Acquired 6246 96.30% 6257 96.47% 6206 95.68% 18709 96.15%Total 6486 100.00% 6486 100.00% 6486 100.00% 19458 100.00%
Table 18: IrisGuard Attempt-Level Recognition Acquisition Rates Of note in this data is Fujitsu's extremely low FTA rate of less than 0.50%. This figure is particularly notable considering that Fujitsu was implemented without automated guidance or feedback.
18 Hitachi is an exception to this. Whereas other test systems implemented a quality check which, when satisfied, represented the completion of a recognition acquisition, Hitachi acquired recognition data for 13-15 seconds for each Test Subject.

Copyright © 2006 International Biometric Group
September 2006 CBT Round 6 Public Report International Biometric Group Results: Enrollment, Acquisition, and Transaction Duration – 44
6.3.2 Transactional Recognition Acquisition Rates Transactional failure to acquire occurs when no samples are acquired in a recognition transaction (all six attempts are "fail to acquire"). Terminology used in Table 19 through Table 21 is as follows: • Zero Instances Acquired represents transactions in which no samples were successfully acquired
for either instance. Shown in bold below, this is the basis of T-FTA. • One Instance Acquired represents transactions in which at least one sample was successfully
acquired for one instance, but no samples were acquired for the other instance. In this event, the number of samples acquired could be 1, 2, or 3.
• Two Instances Acquired represents transactions in which at least one sample was successfully
acquired for both instances. As shown below, the vast majority of transactions fall into this category. In this case, the number of samples acquired could be 2, 3, 4, 5, or 6, depending on the number of samples acquired per instance.
Results are presented separately for each of the three recognition transactions and aggregated in the far-right columns.
Recognition Transactions Transaction 1 Transaction 2 Transaction 3
Total Fujitsu
Count % Count % Count % Count %Zero Instances Acquired 0 0.00% 3 0.27% 2 0.18% 5 0.15%
One Instance Acquired 3 0.27% 2 0.18% 1 0.09% 6 0.18%Two Instances Acquired 1115 99.73% 1113 99.55% 1115 99.73% 3343 99.67%
Total Transactions 1118 100.00% 1118 100.00% 1118 100.00% 3354 100.00%Table 19: Fujitsu Transactional Recognition Acquisition Rates
Recognition Transactions Transaction 1 Transaction 2 Transaction 3
Total Hitachi
Count % Count % Count % Count %Zero Instances Acquired 1 0.09% 0 0.00% 1 0.09% 2 0.06%
One Instance Acquired 5 0.45% 7 0.63% 3 0.27% 15 0.45%Two Instances Acquired 1111 99.46% 1110 99.37% 1113 99.64% 3334 99.49%
Total Transactions 1117 100.00% 1117 100.00% 1117 100.00% 3351 100.00%Table 20: Hitachi Transactional Recognition Acquisition Rates
Recognition Transactions Transaction 1 Transaction 2 Transaction 3
Total IrisGuard
Count % Count % Count % Count %Zero Instances Acquired 0 0.00% 0 0.00% 2 0.19% 2 0.06%
One Instance Acquired 10 0.93% 16 1.48% 15 1.39% 41 1.26%Two Instances Acquired 1071 99.07% 1065 98.52% 1064 98.43% 3200 98.67%
Total Transactions 1081 100.00% 1081 100.00% 1081 100.00% 3243 100.00%Table 21: IrisGuard Transactional Recognition Acquisition Rates T-FTA rates were universally very low. All systems were able to acquire at least one sufficient-quality sample in over 99.5% of transactions.

Copyright © 2006 International Biometric Group
September 2006 CBT Round 6 Public Report International Biometric Group Results: Enrollment, Acquisition, and Transaction Duration – 45
Table 22 provides another perspective on recognition transaction acquisition capabilities. In each recognition transaction, between 0 and 6 samples could be acquired. The table shows the number of transactions in which all six samples were acquired as well as the number of transactions in which fewer than six samples were acquired.
Samples Acquired per Recognition Transaction <6 6
Count % Count % Fujitsu 40 1.19% 3314 98.81% Hitachi 175 5.22% 3176 94.78%
IrisGuard 437 13.48% 2806 86.52% Table 22: Samples Acquired per Recognition Transaction Fujitsu acquired all possible samples in nearly 99% of its recognition transactions. Hitachi acquired all possible samples in approximately 95% of its recognition transactions. 6.4 Recognition Attempt Duration Recognition attempt duration is an operationally relevant figure, measured as described above in 4.4. Table 23 shows recognition attempt durations for each system. These figures are based solely on successful recognition attempts – those in which a sample was acquired. Recognition attempt duration is highly relevant to throughput in high-volume applications.
Recognition Attempt Duration (seconds)
Fujitsu Hitachi IrisGuardMedian 2.13 1.23 4.22
Mean 2.14 1.77 5.10Table 23: Recognition Attempt Duration Vascular recognition systems' attempt duration was lower than that of iris recognition, perhaps in part because the former are based on placement of the hand or finger against an alignment apparatus while the latter is contactless. Hitachi is the fastest among the three tested systems in both mean and median duration. It is likely that implementation of IrisGuard software able to complete enrollments with fewer than four samples would have resulted in lower attempt durations.

Copyright © 2006 International Biometric Group
September 2006 CBT Round 6 Public Report International Biometric Group Results: Accuracy by Comparison Type – 46
7 Results: Accuracy by Comparison Type
7.1 Presentation of Accuracy Results CBT accuracy results are presented from several perspectives based on the different types of comparison trials and analysis that were performed. • Same-Day Attempts are trials in which Visit 1 recognition samples are compared against enrollment
templates created on the same day. All genuine and impostor attempts are utilized to calculate error rates. This generates Same-Day FMR and Same-Day FNMR.
• Different-Day Attempts are trials in which Visit 2 recognition samples are compared against
enrollment templates created days or weeks earlier. All genuine and impostor attempts are utilized to calculate error rates. This generates Different-Day FMR and Different-Day FNMR. Different-Day FNMR is typically higher than Same-Day FMR for several reasons: Test Subjects may interact with the capture device in a slightly different fashion than in their first recognition transaction, the biometric characteristic may have changed since enrollment, and temporal factors may impact the feature extraction process.
• Same-Day Transactions are trials in which Visit 1 recognition samples are compared against
enrollment templates created on the same day. The strongest comparison score from each recognition transaction (“best-of-six”) is utilized to calculate error rates. This generates Same-Day T-FMR and Same-Day T-FNMR.
• Different-Day Transactions are trials in which Visit 2 recognition samples are compared against
enrollment templates created days or weeks earlier. The strongest comparison score from each recognition transaction (“best-of-six”) is utilized to calculate error rates. This generates Different-Day T-FMR and Different-Day T-FNMR.
Building on these fundamental perspectives, accuracy results are presented in the following formats: • at specific operating points that show genuine error rates at a fixed impostor error rates • at equal error rates that show error rates at the operating point where the difference between
genuine and impostor error rates is closest to zero • through DET curves and tables that show performance across a range of observed comparison
scores DET curves are generally seen as the most useful method of accuracy results presentation, as a deployer can determine which operating point might satisfy his needs for different systems.

Copyright © 2006 International Biometric Group
September 2006 CBT Round 6 Public Report International Biometric Group Results: Accuracy by Comparison Type – 47
7.2 Accuracy Formulae The following formulae are used in calculation of comparison error rates19. Attempt-level accuracy is measured through the following formulae (FTE and FTA are not included):
Genuine attempts that generate comparison score below threshold False Non-Match Rate (FNMR) = Total genuine attempts
Impostor attempts that generate comparison score above threshold False Match Rate (FMR) =
Total impostor attempts Transactional accuracy is measured through the following formulae (FTE and FTA are not included):
Genuine transactions that generate comparison score below threshold Transactional False Non-Match Rate (T-FNMR) = Total genuine transactions
Impostor transactions that generate comparison score above threshold Transactional False Match Rate (T-FMR) =
Total impostor transactions
19 FMR, FNMR, T-FMR, and T-FNMR generation is discussed in Section 5.2.

Copyright © 2006 International Biometric Group
September 2006 CBT Round 6 Public Report International Biometric Group Results: Accuracy by Comparison Type – 48
7.3 Sample and Comparison Volumes Table 24 shows the total number of enrollment templates and recognition samples acquired.
Visit 1 Visit 2 TotalFujitsu Enrollment Templates 2534 2534Hitachi Enrollment Templates 2560 2560
IrisGuard Enrollment Templates 2343 2343Fujitsu Recognition Samples 11,482 8555 20,037Hitachi Recognition Samples 11,484 8514 19,998
IrisGuard Recognition Samples 10,412 8192 18,604Table 24: Total Enrollment Templates and Recognition Samples Table 25 through Table 28 show the total number of genuine and impostor comparisons and transactions utilized in evaluate accuracy. The number of Hitachi comparisons (genuine and impostor) is roughly half that of Fujitsu and IrisGuard due to the "better instance" analysis applied to the Hitachi data described in 5.3. The number of transactions is roughly 1/6 the number of comparisons for all systems because each transaction was comprised of up to 6 attempts.
Same-Day Different-Day Total Fujitsu 21,867 16,392 38,259 Hitachi 11,341 8254 19,595
IrisGuard 19,389 14,919 34,308 Total 52,597 39,565 92,162
Table 25: Total Genuine Comparisons
Same-Day Different-Day Total Fujitsu 3685 2754 6439 Hitachi 3819 2784 6603
IrisGuard 3447 2639 6086 Total 10,951 8177 19,128
Table 26: Total Genuine Transactions
Same-Day Different-Day Total Fujitsu 27,834,104 21,323,619 49,157,723 Hitachi 14,368,975 10,473,698 24,842,673
IrisGuard 23,764,127 18,771,120 42,535,247 Total 65,967,206 50,568,437 116,535,643
Table 27: Total Impostor Comparisons
Same-Day Different-Day Total Fujitsu 4,658,548 3,561,690 8,220,238 Hitachi 4,838,688 3,530,115 8,381,483
IrisGuard 4,130,329 3,250,947 7,381,276 Total 13,627,565 10,342,752 23,970,317
Table 28: Total Impostor Transactions

Copyright © 2006 International Biometric Group
September 2006 CBT Round 6 Public Report International Biometric Group Results: Accuracy by Comparison Type – 49
7.4 Error Rates at Specified FMR and T-FMR Table 29 and Table 30 present genuine error rates – FNMR and T-FNMR – at specific FMR and T-FMR values. Systems are frequently evaluated based on their genuine error rates at specific impostor error rates. Many systems are configured to provide 0.10% or 0.01% FMR, such that the likelihood of a false match is 1 in 1000 or 1 in 10,000 (respectively). Therefore it is useful to examine genuine error rates at these specific impostor error rates. Error rates presented in this section do not include acquisition failures (FTA, T-FTA, or FTE). Fujitsu results are shown separately in Table 31. Because Fujitsu generated decisions, not scores, we were unable to measure genuine error rates at impostor error rates of precisely 0.1% and 0.01%. However, one can easily compare Fujitsu, Hitachi, and IrisGuard results across the three tables. Table 29 shows Hitachi and IrisGuard FNMR and T-FNMR at 0.10% FMR and 0.10% T-FMR. Values in bold represent Different-Day T-FNMR, which is in most cases the most operationally realistic figure. Recall that Hitachi results reflect the "better-instance" methodology described in 5.3. This methodology inflates T-FNMR because the second instance is not used to calculate T-FNMR. Annex A shows Hitachi results when both instances are used to calculate T-FNMR; this provides a more direct basis for system vs. system comparison of T-FNMR.
Genuine Error Rates at 0.10% FMR / T-FMR Attempt-Level (FNMR) Transactional (T-FNMR) Same-Day Different-Day Same-Day Different-Day
Hitachi 0.77% 3.02% 0.34% 1.94%IrisGuard 1.54% 1.88% 0.58% 1.06%
Table 29: Genuine Error Rates at 0.10% FMR / T-FMR While IrisGuard provided a T-FNMR of just over 1.00% at T-FMR of 0.10%, this is not a typical operating point for in its deployments. IrisGuard systems are typically configured with a much lower FMR, on the order of 0.0001%. It is worth noting that at this "operational" threshold – not shown in the table above – IrisGuard T-FNMR was only 1.33%. Therefore even at a substantially lower T-FMR, IrisGuard delivers lower T-FNMR than Hitachi. Hitachi Same-Day FNMR and T-FNMR were lower than those of IrisGuard, while Hitachi Different-Day FNMR and T-FNMR were higher than those of IrisGuard. Table 30 shows FNMR and T-FNMR at 0.01% FMR and T-FMR. Results do not include acquisition failures. Values in bold represent transactional, Different-Day T-FNMR, which is in most cases the most operationally realistic figure.
Genuine Error Rates at 0.01% FMR / T-FMR Attempt-Level (FNMR) Transactional (T-FNMR) Same-Day Different-Day Same-Day Different-Day
Hitachi 1.26% 4.72% 0.68% 2.77%IrisGuard 1.76% 2.14% 0.70% 1.17%
Table 30: Genuine Error Rates at 0.01% FMR / T-FMR While Hitachi still generates lower Same-Day FNMR and T-FNMR than IrisGuard, the gap is not as pronounced. Further, IrisGuard's Different-Day T-FNMR is substantially lower than that of Hitachi.

Copyright © 2006 International Biometric Group
September 2006 CBT Round 6 Public Report International Biometric Group Results: Accuracy by Comparison Type – 50
Table 31 shows Fujitsu FMR, FNMR, T-FMR, and T-FNMR for the three thresholds at which Fujitsu was tested.
Attempt-Level Transactional Same-Day Different-Day Same-Day Different-Day
FNMR FMR FNMR FMR T-FNMR T-FMR T-FNMR T-FMR Low Security 3.13% 0.0380% 6.17% 0.0395% 0.22% 0.1766% 0.33% 0.1831%
Default 4.23% 0.0118% 8.52% 0.0135% 0.57% 0.0559% 0.69% 0.0629%High Security 5.64% 0.0018% 11.86% 0.0007% 0.87% 0.0091% 1.42% 0.0042%
Table 31: Fujitsu Error Rates at Observed Thresholds While Fujitsu attempt-level FNMR was relatively high, Fujitsu Different-Day T-FNMR of 0.69% was lower than that of any competing technology at the corresponding Different-Day T-FMR. For all systems, Different-Day comparison error rates were higher than Same-Day comparison error rates. For some systems, the increase in genuine error rates was pronounced, whereas for others it was modest. Increases in Same-Day and Different-Day genuine error rates have been attributable to one or more of the following: • Test Subjects may be unable to reproduce the presentation method used in the Visit 1, particularly if
a long period elapsed between Visit 1 and Visit 2. • Since the recognition sample capture applications may not provide the same type of user feedback as
would an operational system, Test Subjects may not have received the type of positive reinforcement that accompanies successful presentation. This would be particularly true of applications in which users interact with biometric devices on a frequent basis.
• The measurability of the biometric characteristic may have changed based on some temporal or
environmental factor. • Inherent aspects of the biometric characteristic may have changed based on some temporal or
environmental factor. Recognizing that the testing environment is unable to completely replicate an operational environment, it is still worth considering systems' relative increases in Different-Day genuine comparison error rates. This is a potential indicator of the degree to which habituation is a factor in a biometric system's performance. 7.5 Equal Error Rates Table 32 shows equal error rates, the error pair at which the difference between genuine and impostor error rates is closest to zero. These results do not include acquisition failures. Fujitsu results are not shown because the system generated decisions, not scores, and performance was not observed at this specific operating point.
Attempt-Level Transactional
FMR FNMR T-FMR T-FNMRSame-Day 0.5449% 0.55% 0.3003% 0.29%
Hitachi Different-Day 2.0336% 2.04% 1.3706% 1.36%
Same-Day 1.2850% 1.27% 0.5412% 0.55%IrisGuard
Different-Day 1.6093% 1.58% 0.8516% 0.87%Table 32: Equal Error Rates Equal error rates can be informative, but they are not representative of performance in most operational systems. Both IrisGuard and Hitachi provide much lower FMR and T-FMR in operational systems.

Copyright © 2006 International Biometric Group
September 2006 CBT Round 6 Public Report International Biometric Group Results: Accuracy by Comparison Type – 51
7.6 Overview of Results Tables and DET Curves Performance in Sections 7.7 and 7.8 is rendered through results tables and detection error tradeoff (DET) curves. Results tables show observed comparison error rates at 72 different thresholds for Hitachi and for 90 different thresholds for IrisGuard. Since Fujitsu does not output score values, comparison error rates can only be shown at three thresholds. The range of thresholds was selected based on the incidence of observed errors and on consideration of operationally realistic values. DET curves plot error pairs (e.g. FNMR and FMR) across a range of values. Left- and lower-most DET curves indicate lower comparison error rates. DET curves can be used to identify the point at which one wishes to operate one's system – e.g. at 0.01% FMR or 1.00% FNMR – and estimate the corresponding genuine or impostor error rate at that operating point. While DET curves will ideally be smooth through the full range of performance, at the right- and bottom-hand side of the curve, plots may become "stepped", indicating that the number of genuine or impostor errors at these points is unchanged while the counterpart error type changes. In order to maintain readability and to focus on reasonable or differentiated performance ranges, the DETs below show error rates across the following ranges: • FNMR and T-FNMR: 100% to 0.01% • FMR and T-FMR: 100% to 0.0001% False non-match rates and false match rates are calculated by dividing the number of errors at a given threshold by the total number of genuine and impostor comparisons executed, respectively. The total number of genuine and impostor comparisons executed for each comparison type precedes each results table. Because certain devices acquired more data than others for certain comparison types, it is more appropriate to use error rates than the number of errors when comparing device performance. In many operational deployments, users are permitted to execute multiple attempts, such that FNMR is lower than observed in single-attempt tests. If the Report reader were to focus on either attempt-level or transactional comparison error rates, the latter is more operationally realistic.
Copyright © 2006 International Biometric Group
September 2006 CBT Round 6 Public Report International Biometric Group Results: Accuracy by Comparison Type – 52
7.7 Attempt-Level Results This section shows FNMR and FMR for single-attempt comparisons of enrollment templates and recognition samples. Neither FTE nor FTA is factored into these error rates. FNMR and FMR are presented for the following comparison types: • Same-Day • Different-Day

Cop
yrig
ht ©
200
6
Inte
rnat
iona
l Bio
met
ric G
roup
Se
ptem
ber 2
006
C
BT R
ound
6 P
ublic
Rep
ort
Inte
rnat
iona
l Bio
met
ric G
roup
R
esul
ts: A
ccur
acy
by C
ompa
rison
Typ
e –
53
7.7.
1 At
tem
pt-L
evel
DET
s (A
ll Sy
stem
s)
Fi
gure
15:
Atte
mpt
-Lev
el D
ETs
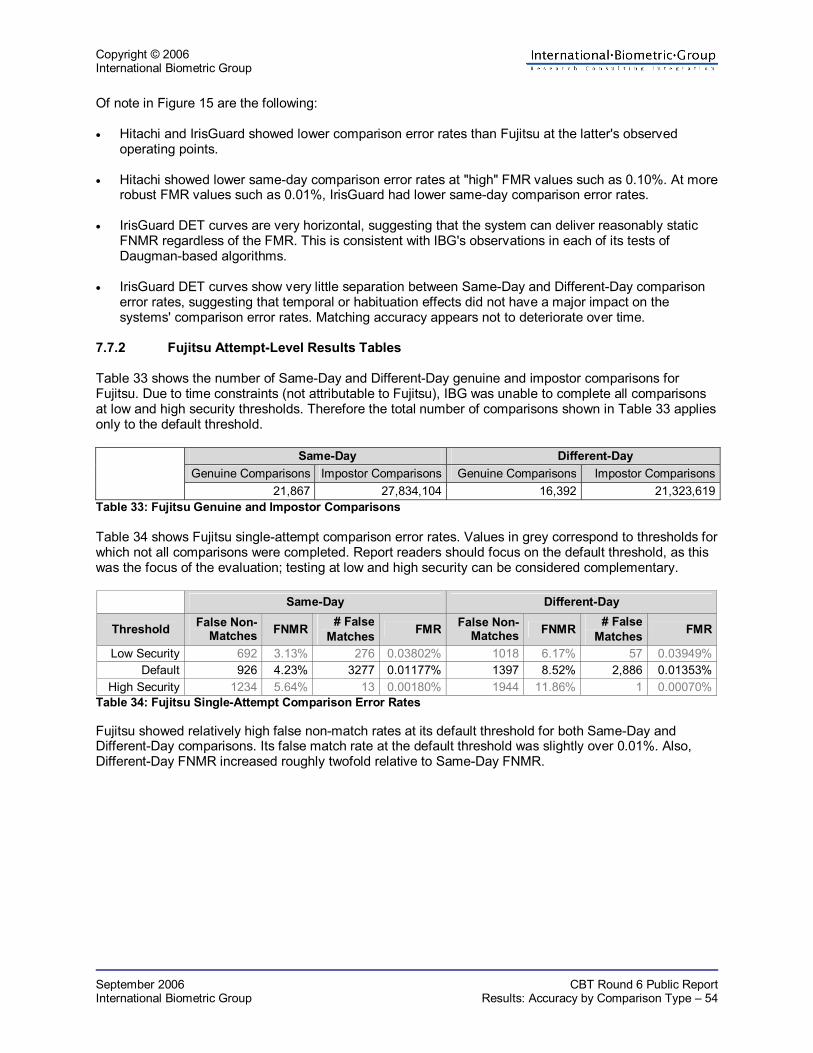
Copyright © 2006 International Biometric Group
September 2006 CBT Round 6 Public Report International Biometric Group Results: Accuracy by Comparison Type – 54
Of note in Figure 15 are the following: • Hitachi and IrisGuard showed lower comparison error rates than Fujitsu at the latter's observed
operating points. • Hitachi showed lower same-day comparison error rates at "high" FMR values such as 0.10%. At more
robust FMR values such as 0.01%, IrisGuard had lower same-day comparison error rates. • IrisGuard DET curves are very horizontal, suggesting that the system can deliver reasonably static
FNMR regardless of the FMR. This is consistent with IBG's observations in each of its tests of Daugman-based algorithms.
• IrisGuard DET curves show very little separation between Same-Day and Different-Day comparison
error rates, suggesting that temporal or habituation effects did not have a major impact on the systems' comparison error rates. Matching accuracy appears not to deteriorate over time.
7.7.2 Fujitsu Attempt-Level Results Tables Table 33 shows the number of Same-Day and Different-Day genuine and impostor comparisons for Fujitsu. Due to time constraints (not attributable to Fujitsu), IBG was unable to complete all comparisons at low and high security thresholds. Therefore the total number of comparisons shown in Table 33 applies only to the default threshold.
Same-Day Different-Day Genuine Comparisons Impostor Comparisons Genuine Comparisons Impostor Comparisons
21,867 27,834,104 16,392 21,323,619Table 33: Fujitsu Genuine and Impostor Comparisons Table 34 shows Fujitsu single-attempt comparison error rates. Values in grey correspond to thresholds for which not all comparisons were completed. Report readers should focus on the default threshold, as this was the focus of the evaluation; testing at low and high security can be considered complementary.
Same-Day Different-Day
Threshold False Non-Matches FNMR # False
Matches FMR False Non-Matches FNMR # False
Matches FMR
Low Security 692 3.13% 276 0.03802% 1018 6.17% 57 0.03949%Default 926 4.23% 3277 0.01177% 1397 8.52% 2,886 0.01353%
High Security 1234 5.64% 13 0.00180% 1944 11.86% 1 0.00070%Table 34: Fujitsu Single-Attempt Comparison Error Rates Fujitsu showed relatively high false non-match rates at its default threshold for both Same-Day and Different-Day comparisons. Its false match rate at the default threshold was slightly over 0.01%. Also, Different-Day FNMR increased roughly twofold relative to Same-Day FNMR.
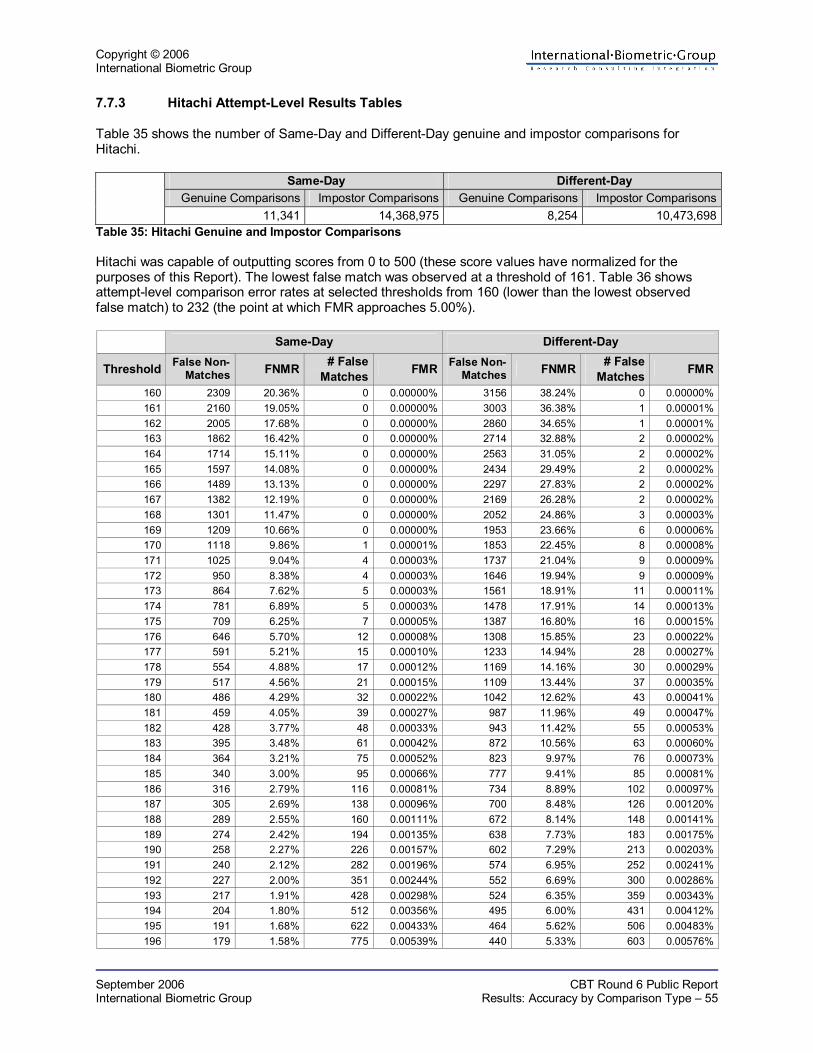
Copyright © 2006 International Biometric Group
September 2006 CBT Round 6 Public Report International Biometric Group Results: Accuracy by Comparison Type – 55
7.7.3 Hitachi Attempt-Level Results Tables Table 35 shows the number of Same-Day and Different-Day genuine and impostor comparisons for Hitachi.
Same-Day Different-Day Genuine Comparisons Impostor Comparisons Genuine Comparisons Impostor Comparisons
11,341 14,368,975 8,254 10,473,698Table 35: Hitachi Genuine and Impostor Comparisons Hitachi was capable of outputting scores from 0 to 500 (these score values have normalized for the purposes of this Report). The lowest false match was observed at a threshold of 161. Table 36 shows attempt-level comparison error rates at selected thresholds from 160 (lower than the lowest observed false match) to 232 (the point at which FMR approaches 5.00%).
Same-Day Different-Day
Threshold False Non-Matches FNMR # False
Matches FMR False Non-Matches FNMR # False
Matches FMR
160 2309 20.36% 0 0.00000% 3156 38.24% 0 0.00000%161 2160 19.05% 0 0.00000% 3003 36.38% 1 0.00001%162 2005 17.68% 0 0.00000% 2860 34.65% 1 0.00001%163 1862 16.42% 0 0.00000% 2714 32.88% 2 0.00002%164 1714 15.11% 0 0.00000% 2563 31.05% 2 0.00002%165 1597 14.08% 0 0.00000% 2434 29.49% 2 0.00002%166 1489 13.13% 0 0.00000% 2297 27.83% 2 0.00002%167 1382 12.19% 0 0.00000% 2169 26.28% 2 0.00002%168 1301 11.47% 0 0.00000% 2052 24.86% 3 0.00003%169 1209 10.66% 0 0.00000% 1953 23.66% 6 0.00006%170 1118 9.86% 1 0.00001% 1853 22.45% 8 0.00008%171 1025 9.04% 4 0.00003% 1737 21.04% 9 0.00009%172 950 8.38% 4 0.00003% 1646 19.94% 9 0.00009%173 864 7.62% 5 0.00003% 1561 18.91% 11 0.00011%174 781 6.89% 5 0.00003% 1478 17.91% 14 0.00013%175 709 6.25% 7 0.00005% 1387 16.80% 16 0.00015%176 646 5.70% 12 0.00008% 1308 15.85% 23 0.00022%177 591 5.21% 15 0.00010% 1233 14.94% 28 0.00027%178 554 4.88% 17 0.00012% 1169 14.16% 30 0.00029%179 517 4.56% 21 0.00015% 1109 13.44% 37 0.00035%180 486 4.29% 32 0.00022% 1042 12.62% 43 0.00041%181 459 4.05% 39 0.00027% 987 11.96% 49 0.00047%182 428 3.77% 48 0.00033% 943 11.42% 55 0.00053%183 395 3.48% 61 0.00042% 872 10.56% 63 0.00060%184 364 3.21% 75 0.00052% 823 9.97% 76 0.00073%185 340 3.00% 95 0.00066% 777 9.41% 85 0.00081%186 316 2.79% 116 0.00081% 734 8.89% 102 0.00097%187 305 2.69% 138 0.00096% 700 8.48% 126 0.00120%188 289 2.55% 160 0.00111% 672 8.14% 148 0.00141%189 274 2.42% 194 0.00135% 638 7.73% 183 0.00175%190 258 2.27% 226 0.00157% 602 7.29% 213 0.00203%191 240 2.12% 282 0.00196% 574 6.95% 252 0.00241%192 227 2.00% 351 0.00244% 552 6.69% 300 0.00286%193 217 1.91% 428 0.00298% 524 6.35% 359 0.00343%194 204 1.80% 512 0.00356% 495 6.00% 431 0.00412%195 191 1.68% 622 0.00433% 464 5.62% 506 0.00483%196 179 1.58% 775 0.00539% 440 5.33% 603 0.00576%

Copyright © 2006 International Biometric Group
September 2006 CBT Round 6 Public Report International Biometric Group Results: Accuracy by Comparison Type – 56
Same-Day Different-Day
Threshold False Non-Matches FNMR # False
Matches FMR False Non-Matches FNMR # False
Matches FMR
197 164 1.45% 947 0.00659% 426 5.16% 714 0.00682%198 157 1.38% 1163 0.00809% 409 4.96% 850 0.00812%199 143 1.26% 1442 0.01004% 394 4.77% 1021 0.00975%200 142 1.25% 1786 0.01243% 374 4.53% 1234 0.01178%201 136 1.20% 2221 0.01546% 361 4.37% 1495 0.01427%202 131 1.16% 2768 0.01926% 345 4.18% 1870 0.01785%203 122 1.08% 3362 0.02340% 335 4.06% 2300 0.02196%204 117 1.03% 4152 0.02890% 320 3.88% 2812 0.02685%205 113 1.00% 5148 0.03583% 310 3.76% 3478 0.03321%206 104 0.92% 6333 0.04407% 293 3.55% 4297 0.04103%207 102 0.90% 7712 0.05367% 286 3.46% 5215 0.04979%208 96 0.85% 9488 0.06603% 272 3.30% 6352 0.06065%209 90 0.79% 11564 0.08048% 263 3.19% 7743 0.07393%210 87 0.77% 13995 0.09740% 252 3.05% 9487 0.09058%211 82 0.72% 17043 0.11861% 248 3.00% 11694 0.11165%212 80 0.71% 20718 0.14419% 243 2.94% 14275 0.13629%213 77 0.68% 25164 0.17513% 240 2.91% 17418 0.16630%214 74 0.65% 30499 0.21226% 233 2.82% 21136 0.20180%215 69 0.61% 36937 0.25706% 227 2.75% 25781 0.24615%216 68 0.60% 44505 0.30973% 219 2.65% 31259 0.29845%217 66 0.58% 53387 0.37154% 213 2.58% 37955 0.36238%218 65 0.57% 64130 0.44631% 205 2.48% 45966 0.43887%219 63 0.56% 77150 0.53692% 200 2.42% 55314 0.52812%220 57 0.50% 92471 0.64355% 197 2.39% 66532 0.63523%221 56 0.49% 110748 0.77074% 190 2.30% 80011 0.76392%222 54 0.48% 132262 0.92047% 182 2.20% 95900 0.91563%223 53 0.47% 157777 1.09804% 178 2.16% 114630 1.09446%224 52 0.46% 187777 1.30682% 174 2.11% 136533 1.30358%225 51 0.45% 222831 1.55078% 171 2.07% 162243 1.54905%226 48 0.42% 264176 1.83852% 170 2.06% 192422 1.83719%227 47 0.41% 312292 2.17338% 167 2.02% 227800 2.17497%228 46 0.41% 368227 2.56265% 164 1.99% 268682 2.56530%229 45 0.40% 432766 3.01181% 160 1.94% 315704 3.01426%230 45 0.40% 507596 3.53258% 158 1.91% 369850 3.53123%231 43 0.38% 593358 4.12944% 154 1.87% 432531 4.12969%232 43 0.38% 690934 4.80851% 150 1.82% 503882 4.81093%
Table 36: Hitachi Single-Attempt Comparison Error Rates

Copyright © 2006 International Biometric Group
September 2006 CBT Round 6 Public Report International Biometric Group Results: Accuracy by Comparison Type – 57
7.7.4 IrisGuard Attempt-Level Results Tables Table 37 shows the number of Same-Day and Different-Day genuine and impostor comparisons for IrisGuard.
Same-Day Different-Day
Genuine Comparisons Impostor Comparisons Genuine Comparisons Impostor Comparisons 19,389 23,764,127 14,919 18,771,120
Table 37: IrisGuard Genuine and Impostor Comparisons IrisGuard was capable of outputting scores (in the form of Hamming Distances) from 0.00 to 0.50. Lower scores represent stronger matches. The lowest false match was observed at a threshold of 0.284. Table 38 shows attempt-level transactional comparison error rates at selected thresholds from 0.270 (lower than the lowest observed false match) to 0.365. IrisGuard systems utilize a 1:1 matching threshold at or just below 0.33. This operational range is shown in red below.
Same-Day Different-Day
Threshold False Non-Matches FNMR # False
Matches FMR False Non-Matches FNMR # False
Matches FMR
0.270 948 4.89% 0 0.00000% 829 5.56% 0 0.00000%0.271 933 4.81% 0 0.00000% 809 5.42% 0 0.00000%0.272 921 4.75% 0 0.00000% 798 5.35% 0 0.00000%0.273 911 4.70% 0 0.00000% 785 5.26% 0 0.00000%0.274 904 4.66% 0 0.00000% 775 5.19% 0 0.00000%0.275 895 4.62% 0 0.00000% 764 5.12% 0 0.00000%0.276 879 4.53% 0 0.00000% 756 5.07% 0 0.00000%0.277 862 4.45% 0 0.00000% 740 4.96% 0 0.00000%0.278 852 4.39% 0 0.00000% 728 4.88% 0 0.00000%0.279 839 4.33% 0 0.00000% 720 4.83% 0 0.00000%0.280 825 4.25% 0 0.00000% 708 4.75% 0 0.00000%0.281 811 4.18% 0 0.00000% 699 4.69% 0 0.00000%0.282 797 4.11% 0 0.00000% 692 4.64% 0 0.00000%0.283 791 4.08% 0 0.00000% 684 4.58% 0 0.00000%0.284 782 4.03% 0 0.00000% 673 4.51% 1 0.00001%0.285 772 3.98% 0 0.00000% 663 4.44% 1 0.00001%0.286 764 3.94% 0 0.00000% 653 4.38% 1 0.00001%0.287 751 3.87% 0 0.00000% 642 4.30% 1 0.00001%0.288 744 3.84% 0 0.00000% 633 4.24% 1 0.00001%0.289 735 3.79% 0 0.00000% 619 4.15% 2 0.00001%0.290 720 3.71% 0 0.00000% 610 4.09% 2 0.00001%0.291 711 3.67% 0 0.00000% 604 4.05% 2 0.00001%0.292 701 3.62% 0 0.00000% 596 3.99% 2 0.00001%0.293 693 3.57% 0 0.00000% 586 3.93% 2 0.00001%0.294 686 3.54% 0 0.00000% 577 3.87% 2 0.00001%0.295 676 3.49% 0 0.00000% 572 3.83% 2 0.00001%0.296 664 3.42% 0 0.00000% 562 3.77% 2 0.00001%0.297 655 3.38% 0 0.00000% 557 3.73% 2 0.00001%0.298 647 3.34% 0 0.00000% 551 3.69% 3 0.00002%0.299 641 3.31% 0 0.00000% 545 3.65% 3 0.00002%0.300 636 3.28% 0 0.00000% 537 3.60% 3 0.00002%0.301 627 3.23% 0 0.00000% 530 3.55% 3 0.00002%0.302 615 3.17% 1 0.00000% 528 3.54% 3 0.00002%0.303 609 3.14% 1 0.00000% 517 3.47% 3 0.00002%0.304 602 3.10% 1 0.00000% 511 3.43% 3 0.00002%0.305 600 3.09% 1 0.00000% 503 3.37% 4 0.00002%
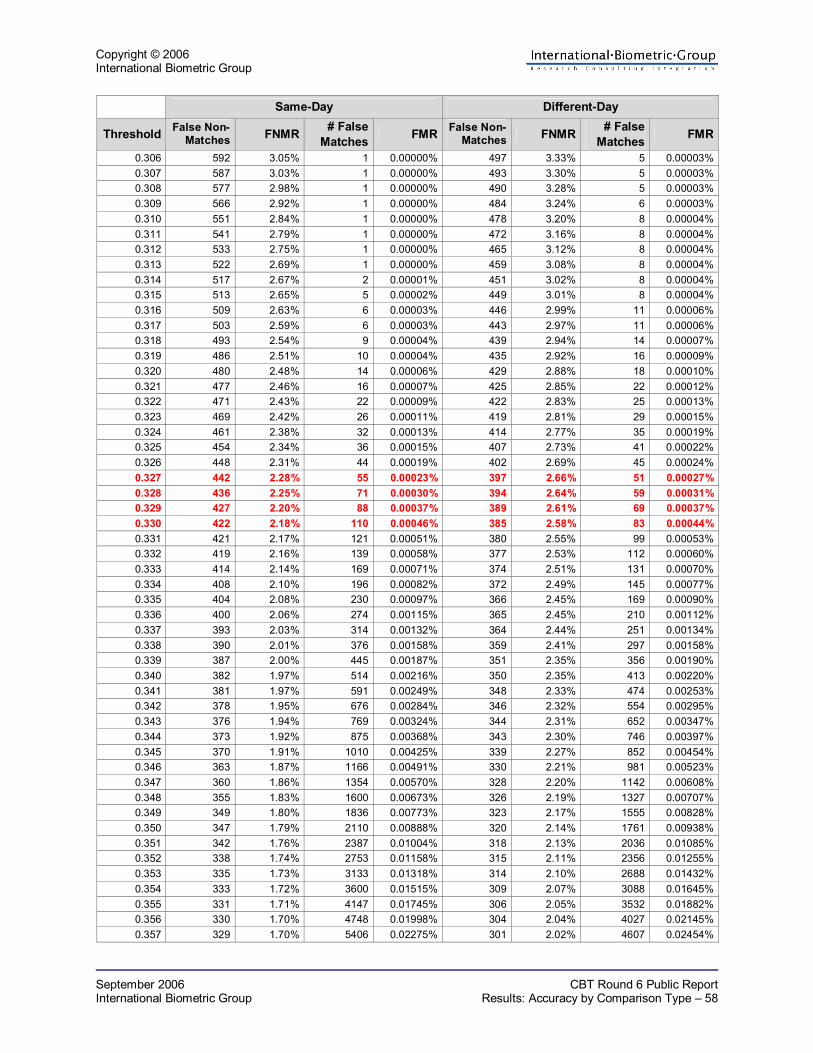
Copyright © 2006 International Biometric Group
September 2006 CBT Round 6 Public Report International Biometric Group Results: Accuracy by Comparison Type – 58
Same-Day Different-Day
Threshold False Non-Matches FNMR # False
Matches FMR False Non-Matches FNMR # False
Matches FMR
0.306 592 3.05% 1 0.00000% 497 3.33% 5 0.00003%0.307 587 3.03% 1 0.00000% 493 3.30% 5 0.00003%0.308 577 2.98% 1 0.00000% 490 3.28% 5 0.00003%0.309 566 2.92% 1 0.00000% 484 3.24% 6 0.00003%0.310 551 2.84% 1 0.00000% 478 3.20% 8 0.00004%0.311 541 2.79% 1 0.00000% 472 3.16% 8 0.00004%0.312 533 2.75% 1 0.00000% 465 3.12% 8 0.00004%0.313 522 2.69% 1 0.00000% 459 3.08% 8 0.00004%0.314 517 2.67% 2 0.00001% 451 3.02% 8 0.00004%0.315 513 2.65% 5 0.00002% 449 3.01% 8 0.00004%0.316 509 2.63% 6 0.00003% 446 2.99% 11 0.00006%0.317 503 2.59% 6 0.00003% 443 2.97% 11 0.00006%0.318 493 2.54% 9 0.00004% 439 2.94% 14 0.00007%0.319 486 2.51% 10 0.00004% 435 2.92% 16 0.00009%0.320 480 2.48% 14 0.00006% 429 2.88% 18 0.00010%0.321 477 2.46% 16 0.00007% 425 2.85% 22 0.00012%0.322 471 2.43% 22 0.00009% 422 2.83% 25 0.00013%0.323 469 2.42% 26 0.00011% 419 2.81% 29 0.00015%0.324 461 2.38% 32 0.00013% 414 2.77% 35 0.00019%0.325 454 2.34% 36 0.00015% 407 2.73% 41 0.00022%0.326 448 2.31% 44 0.00019% 402 2.69% 45 0.00024%0.327 442 2.28% 55 0.00023% 397 2.66% 51 0.00027%0.328 436 2.25% 71 0.00030% 394 2.64% 59 0.00031%0.329 427 2.20% 88 0.00037% 389 2.61% 69 0.00037%0.330 422 2.18% 110 0.00046% 385 2.58% 83 0.00044%0.331 421 2.17% 121 0.00051% 380 2.55% 99 0.00053%0.332 419 2.16% 139 0.00058% 377 2.53% 112 0.00060%0.333 414 2.14% 169 0.00071% 374 2.51% 131 0.00070%0.334 408 2.10% 196 0.00082% 372 2.49% 145 0.00077%0.335 404 2.08% 230 0.00097% 366 2.45% 169 0.00090%0.336 400 2.06% 274 0.00115% 365 2.45% 210 0.00112%0.337 393 2.03% 314 0.00132% 364 2.44% 251 0.00134%0.338 390 2.01% 376 0.00158% 359 2.41% 297 0.00158%0.339 387 2.00% 445 0.00187% 351 2.35% 356 0.00190%0.340 382 1.97% 514 0.00216% 350 2.35% 413 0.00220%0.341 381 1.97% 591 0.00249% 348 2.33% 474 0.00253%0.342 378 1.95% 676 0.00284% 346 2.32% 554 0.00295%0.343 376 1.94% 769 0.00324% 344 2.31% 652 0.00347%0.344 373 1.92% 875 0.00368% 343 2.30% 746 0.00397%0.345 370 1.91% 1010 0.00425% 339 2.27% 852 0.00454%0.346 363 1.87% 1166 0.00491% 330 2.21% 981 0.00523%0.347 360 1.86% 1354 0.00570% 328 2.20% 1142 0.00608%0.348 355 1.83% 1600 0.00673% 326 2.19% 1327 0.00707%0.349 349 1.80% 1836 0.00773% 323 2.17% 1555 0.00828%0.350 347 1.79% 2110 0.00888% 320 2.14% 1761 0.00938%0.351 342 1.76% 2387 0.01004% 318 2.13% 2036 0.01085%0.352 338 1.74% 2753 0.01158% 315 2.11% 2356 0.01255%0.353 335 1.73% 3133 0.01318% 314 2.10% 2688 0.01432%0.354 333 1.72% 3600 0.01515% 309 2.07% 3088 0.01645%0.355 331 1.71% 4147 0.01745% 306 2.05% 3532 0.01882%0.356 330 1.70% 4748 0.01998% 304 2.04% 4027 0.02145%0.357 329 1.70% 5406 0.02275% 301 2.02% 4607 0.02454%

Copyright © 2006 International Biometric Group
September 2006 CBT Round 6 Public Report International Biometric Group Results: Accuracy by Comparison Type – 59
Same-Day Different-Day
Threshold False Non-Matches FNMR # False
Matches FMR False Non-Matches FNMR # False
Matches FMR
0.358 327 1.69% 6152 0.02589% 298 2.00% 5252 0.02798%0.359 322 1.66% 6991 0.02942% 295 1.98% 5982 0.03187%0.360 318 1.64% 7974 0.03355% 293 1.96% 6763 0.03603%0.361 315 1.62% 9104 0.03831% 291 1.95% 7699 0.04102%0.362 313 1.61% 10377 0.04367% 291 1.95% 8742 0.04657%0.363 312 1.61% 11884 0.05001% 290 1.94% 10027 0.05342%0.364 307 1.58% 13552 0.05703% 288 1.93% 11379 0.06062%0.365 305 1.57% 15444 0.06499% 284 1.90% 12818 0.06829%
Table 38: IrisGuard Single-Attempt Comparison Error Rates

Copyright © 2006 International Biometric Group
September 2006 CBT Round 6 Public Report International Biometric Group Results: Accuracy by Comparison Type – 60
7.8 Transactional Results This section shows results for transactions in which the strongest score generated through comparison of all recognition samples acquired in a transaction (which can range from 1-6) is used to calculate accuracy. Neither FTE nor FTA is factored into these error rates. T-FNMR and T-FMR are presented for the following transaction types: • Same-Day • Different-Day

Cop
yrig
ht ©
200
6
Inte
rnat
iona
l Bio
met
ric G
roup
Se
ptem
ber 2
006
C
BT R
ound
6 P
ublic
Rep
ort
Inte
rnat
iona
l Bio
met
ric G
roup
R
esul
ts: A
ccur
acy
by C
ompa
rison
Typ
e –
61
7.8.
1 Tr
ansa
ctio
nal D
ETs
(All
Syst
ems)
Fi
gure
16:
Tra
nsac
tiona
l DET
s
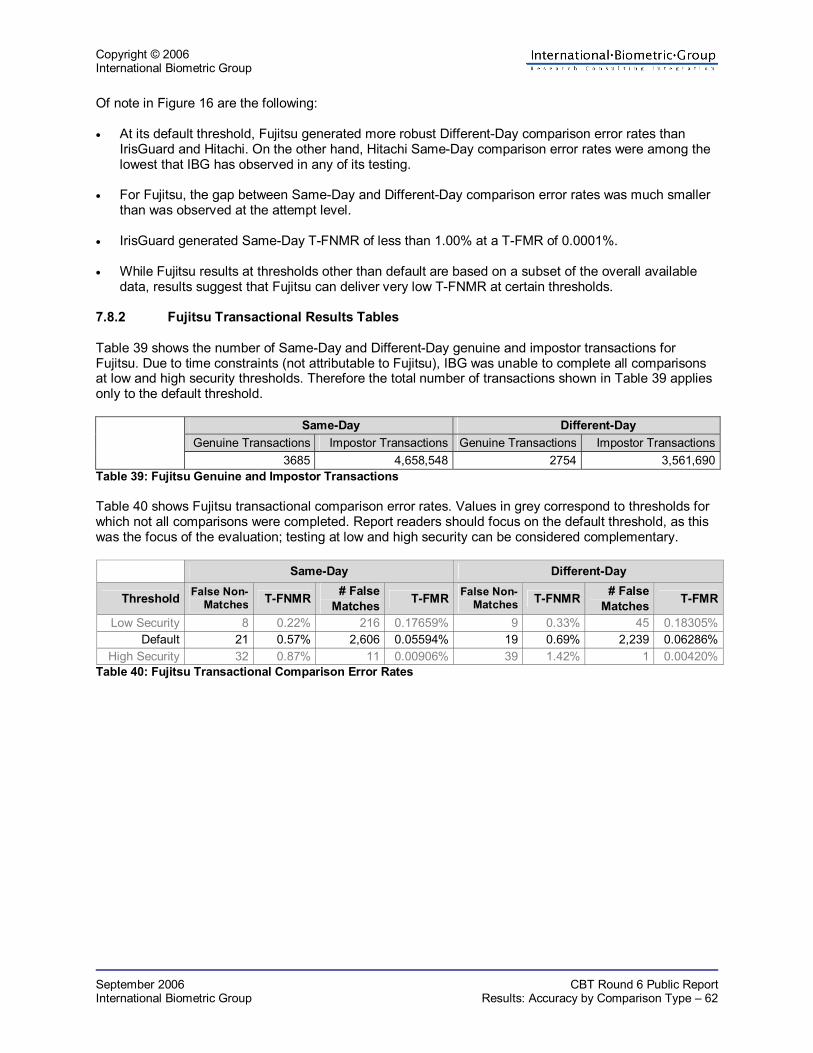
Copyright © 2006 International Biometric Group
September 2006 CBT Round 6 Public Report International Biometric Group Results: Accuracy by Comparison Type – 62
Of note in Figure 16 are the following: • At its default threshold, Fujitsu generated more robust Different-Day comparison error rates than
IrisGuard and Hitachi. On the other hand, Hitachi Same-Day comparison error rates were among the lowest that IBG has observed in any of its testing.
• For Fujitsu, the gap between Same-Day and Different-Day comparison error rates was much smaller
than was observed at the attempt level. • IrisGuard generated Same-Day T-FNMR of less than 1.00% at a T-FMR of 0.0001%. • While Fujitsu results at thresholds other than default are based on a subset of the overall available
data, results suggest that Fujitsu can deliver very low T-FNMR at certain thresholds. 7.8.2 Fujitsu Transactional Results Tables Table 39 shows the number of Same-Day and Different-Day genuine and impostor transactions for Fujitsu. Due to time constraints (not attributable to Fujitsu), IBG was unable to complete all comparisons at low and high security thresholds. Therefore the total number of transactions shown in Table 39 applies only to the default threshold.
Same-Day Different-Day Genuine Transactions Impostor Transactions Genuine Transactions Impostor Transactions
3685 4,658,548 2754 3,561,690Table 39: Fujitsu Genuine and Impostor Transactions Table 40 shows Fujitsu transactional comparison error rates. Values in grey correspond to thresholds for which not all comparisons were completed. Report readers should focus on the default threshold, as this was the focus of the evaluation; testing at low and high security can be considered complementary.
Same-Day Different-Day
Threshold False Non-Matches T-FNMR # False
Matches T-FMR False Non-Matches T-FNMR # False
Matches T-FMR
Low Security 8 0.22% 216 0.17659% 9 0.33% 45 0.18305%Default 21 0.57% 2,606 0.05594% 19 0.69% 2,239 0.06286%
High Security 32 0.87% 11 0.00906% 39 1.42% 1 0.00420%Table 40: Fujitsu Transactional Comparison Error Rates

Copyright © 2006 International Biometric Group
September 2006 CBT Round 6 Public Report International Biometric Group Results: Accuracy by Comparison Type – 63
7.8.3 Hitachi Transactional Results Tables Table 41 shows the number of Same-Day and Different-Day genuine and impostor transactions for Hitachi.
Same-Day Different-Day Genuine Transactions Impostor Transactions Genuine Transactions Impostor Transactions
3819 4,838,688 2784 3,530,115Table 41: Hitachi Genuine and Impostor Transactions Hitachi was capable of outputting scores from 0 to 500 (normalized). The lowest false match was observed at a threshold of 161. Table 42 shows transactional comparison error rates at selected thresholds from 160 (lower than the lowest observed false match) to 232 (the point at which T-FMR approaches 5.00%).
Same-Day Different-Day
Threshold False Non-Matches T-FNMR # False
Matches T-FMR False Non-Matches T-FNMR # False
Matches T-FMR
160 374 9.79% 0 0.00000% 695 24.96% 0 0.00000%161 347 9.09% 0 0.00000% 646 23.20% 1 0.00003%162 313 8.20% 0 0.00000% 603 21.66% 1 0.00003%163 284 7.44% 0 0.00000% 571 20.51% 2 0.00006%164 257 6.73% 0 0.00000% 536 19.25% 2 0.00006%165 245 6.42% 0 0.00000% 507 18.21% 2 0.00006%166 227 5.94% 0 0.00000% 475 17.06% 2 0.00006%167 216 5.66% 0 0.00000% 439 15.77% 2 0.00006%168 201 5.26% 0 0.00000% 408 14.66% 2 0.00006%169 184 4.82% 0 0.00000% 384 13.79% 5 0.00014%170 162 4.24% 1 0.00002% 360 12.93% 5 0.00014%171 149 3.90% 4 0.00008% 328 11.78% 5 0.00014%172 135 3.53% 4 0.00008% 303 10.88% 5 0.00014%173 117 3.06% 5 0.00010% 284 10.20% 6 0.00017%174 99 2.59% 5 0.00010% 266 9.55% 9 0.00025%175 84 2.20% 7 0.00014% 250 8.98% 10 0.00028%176 78 2.04% 8 0.00017% 236 8.48% 13 0.00037%177 73 1.91% 11 0.00023% 223 8.01% 16 0.00045%178 71 1.86% 12 0.00025% 206 7.40% 16 0.00045%179 68 1.78% 15 0.00031% 195 7.00% 19 0.00054%180 67 1.75% 25 0.00052% 183 6.57% 24 0.00068%181 60 1.57% 30 0.00062% 171 6.14% 29 0.00082%182 59 1.54% 34 0.00070% 163 5.85% 32 0.00090%183 55 1.44% 43 0.00089% 144 5.17% 38 0.00107%184 51 1.34% 53 0.00109% 137 4.92% 46 0.00130%185 47 1.23% 65 0.00134% 127 4.56% 50 0.00141%186 45 1.18% 80 0.00165% 118 4.24% 61 0.00172%187 45 1.18% 96 0.00198% 114 4.09% 76 0.00215%188 40 1.05% 115 0.00237% 109 3.92% 89 0.00252%189 39 1.02% 133 0.00275% 104 3.74% 107 0.00302%190 35 0.92% 160 0.00330% 96 3.45% 128 0.00362%191 31 0.81% 199 0.00411% 92 3.30% 160 0.00452%192 31 0.81% 247 0.00510% 90 3.23% 191 0.00540%193 30 0.79% 295 0.00609% 86 3.09% 232 0.00656%194 29 0.76% 355 0.00733% 84 3.02% 278 0.00786%195 28 0.73% 436 0.00900% 80 2.87% 326 0.00921%196 24 0.63% 551 0.01138% 75 2.69% 391 0.01105%

Copyright © 2006 International Biometric Group
September 2006 CBT Round 6 Public Report International Biometric Group Results: Accuracy by Comparison Type – 64
Same-Day Different-Day
Threshold False Non-Matches T-FNMR # False
Matches T-FMR False Non-Matches T-FNMR # False
Matches T-FMR
197 21 0.55% 685 0.01414% 75 2.69% 468 0.01323%198 21 0.55% 846 0.01747% 71 2.55% 568 0.01606%199 20 0.52% 1048 0.02164% 67 2.41% 691 0.01953%200 20 0.52% 1292 0.02667% 64 2.30% 847 0.02394%201 17 0.45% 1606 0.03316% 63 2.26% 1025 0.02897%202 17 0.45% 1985 0.04098% 61 2.19% 1277 0.03610%203 16 0.42% 2392 0.04938% 59 2.12% 1588 0.04489%204 15 0.39% 2947 0.06084% 56 2.01% 1961 0.05543%205 14 0.37% 3619 0.07471% 55 1.98% 2414 0.06824%206 13 0.34% 4438 0.09162% 54 1.94% 2939 0.08308%207 13 0.34% 5374 0.11095% 54 1.94% 3540 0.10006%208 13 0.34% 6531 0.13483% 50 1.80% 4309 0.12180%209 13 0.34% 7927 0.16365% 50 1.80% 5228 0.14778%210 13 0.34% 9553 0.19722% 48 1.72% 6455 0.18246%211 12 0.31% 11549 0.23843% 48 1.72% 7910 0.22359%212 12 0.31% 13967 0.28835% 47 1.69% 9592 0.27113%213 11 0.29% 16862 0.34812% 47 1.69% 11663 0.32968%214 11 0.29% 20361 0.42036% 46 1.65% 14072 0.39777%215 10 0.26% 24512 0.50605% 46 1.65% 17116 0.48381%216 10 0.26% 29383 0.60662% 43 1.54% 20625 0.58300%217 10 0.26% 34993 0.72243% 43 1.54% 24954 0.70537%218 10 0.26% 41781 0.86257% 42 1.51% 29994 0.84783%219 10 0.26% 49905 1.03029% 42 1.51% 35828 1.01274%220 10 0.26% 59467 1.22770% 40 1.44% 42834 1.21078%221 10 0.26% 70953 1.46483% 38 1.36% 51226 1.44799%222 9 0.24% 84218 1.73869% 36 1.29% 61035 1.72526%223 9 0.24% 99679 2.05788% 35 1.26% 72506 2.04951%224 9 0.24% 117974 2.43559% 34 1.22% 85669 2.42159%225 9 0.24% 138958 2.86880% 33 1.19% 100922 2.85274%226 9 0.24% 163321 3.37178% 33 1.19% 118570 3.35159%227 9 0.24% 191329 3.95001% 33 1.19% 139030 3.92993%228 9 0.24% 223666 4.61761% 33 1.19% 162546 4.59465%229 9 0.24% 260345 5.37485% 33 1.19% 189133 5.34618%230 9 0.24% 302369 6.24244% 33 1.19% 219355 6.20046%231 9 0.24% 349810 7.22187% 31 1.11% 254137 7.18363%232 9 0.24% 402843 8.31674% 31 1.11% 293094 8.28482%
Table 42: Hitachi Transactional Comparison Error Rates
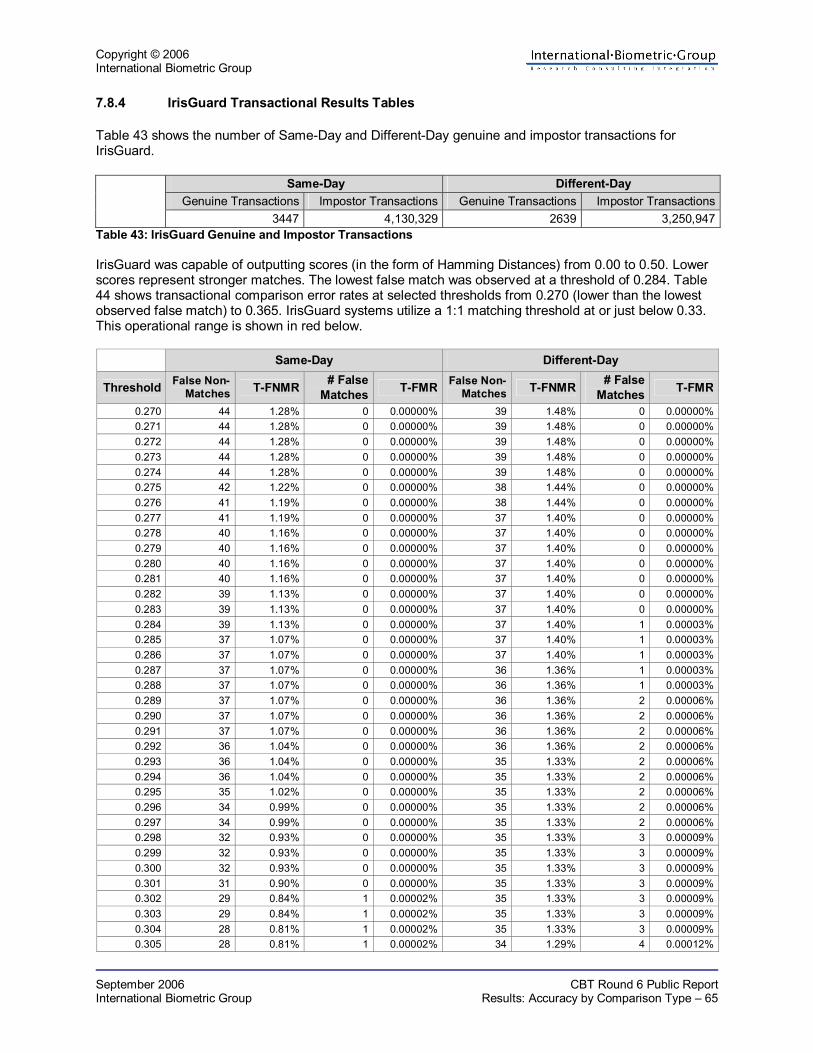
Copyright © 2006 International Biometric Group
September 2006 CBT Round 6 Public Report International Biometric Group Results: Accuracy by Comparison Type – 65
7.8.4 IrisGuard Transactional Results Tables Table 43 shows the number of Same-Day and Different-Day genuine and impostor transactions for IrisGuard.
Same-Day Different-Day Genuine Transactions Impostor Transactions Genuine Transactions Impostor Transactions
3447 4,130,329 2639 3,250,947Table 43: IrisGuard Genuine and Impostor Transactions IrisGuard was capable of outputting scores (in the form of Hamming Distances) from 0.00 to 0.50. Lower scores represent stronger matches. The lowest false match was observed at a threshold of 0.284. Table 44 shows transactional comparison error rates at selected thresholds from 0.270 (lower than the lowest observed false match) to 0.365. IrisGuard systems utilize a 1:1 matching threshold at or just below 0.33. This operational range is shown in red below.
Same-Day Different-Day
Threshold False Non-Matches T-FNMR # False
Matches T-FMR False Non-Matches T-FNMR # False
Matches T-FMR
0.270 44 1.28% 0 0.00000% 39 1.48% 0 0.00000%0.271 44 1.28% 0 0.00000% 39 1.48% 0 0.00000%0.272 44 1.28% 0 0.00000% 39 1.48% 0 0.00000%0.273 44 1.28% 0 0.00000% 39 1.48% 0 0.00000%0.274 44 1.28% 0 0.00000% 39 1.48% 0 0.00000%0.275 42 1.22% 0 0.00000% 38 1.44% 0 0.00000%0.276 41 1.19% 0 0.00000% 38 1.44% 0 0.00000%0.277 41 1.19% 0 0.00000% 37 1.40% 0 0.00000%0.278 40 1.16% 0 0.00000% 37 1.40% 0 0.00000%0.279 40 1.16% 0 0.00000% 37 1.40% 0 0.00000%0.280 40 1.16% 0 0.00000% 37 1.40% 0 0.00000%0.281 40 1.16% 0 0.00000% 37 1.40% 0 0.00000%0.282 39 1.13% 0 0.00000% 37 1.40% 0 0.00000%0.283 39 1.13% 0 0.00000% 37 1.40% 0 0.00000%0.284 39 1.13% 0 0.00000% 37 1.40% 1 0.00003%0.285 37 1.07% 0 0.00000% 37 1.40% 1 0.00003%0.286 37 1.07% 0 0.00000% 37 1.40% 1 0.00003%0.287 37 1.07% 0 0.00000% 36 1.36% 1 0.00003%0.288 37 1.07% 0 0.00000% 36 1.36% 1 0.00003%0.289 37 1.07% 0 0.00000% 36 1.36% 2 0.00006%0.290 37 1.07% 0 0.00000% 36 1.36% 2 0.00006%0.291 37 1.07% 0 0.00000% 36 1.36% 2 0.00006%0.292 36 1.04% 0 0.00000% 36 1.36% 2 0.00006%0.293 36 1.04% 0 0.00000% 35 1.33% 2 0.00006%0.294 36 1.04% 0 0.00000% 35 1.33% 2 0.00006%0.295 35 1.02% 0 0.00000% 35 1.33% 2 0.00006%0.296 34 0.99% 0 0.00000% 35 1.33% 2 0.00006%0.297 34 0.99% 0 0.00000% 35 1.33% 2 0.00006%0.298 32 0.93% 0 0.00000% 35 1.33% 3 0.00009%0.299 32 0.93% 0 0.00000% 35 1.33% 3 0.00009%0.300 32 0.93% 0 0.00000% 35 1.33% 3 0.00009%0.301 31 0.90% 0 0.00000% 35 1.33% 3 0.00009%0.302 29 0.84% 1 0.00002% 35 1.33% 3 0.00009%0.303 29 0.84% 1 0.00002% 35 1.33% 3 0.00009%0.304 28 0.81% 1 0.00002% 35 1.33% 3 0.00009%0.305 28 0.81% 1 0.00002% 34 1.29% 4 0.00012%
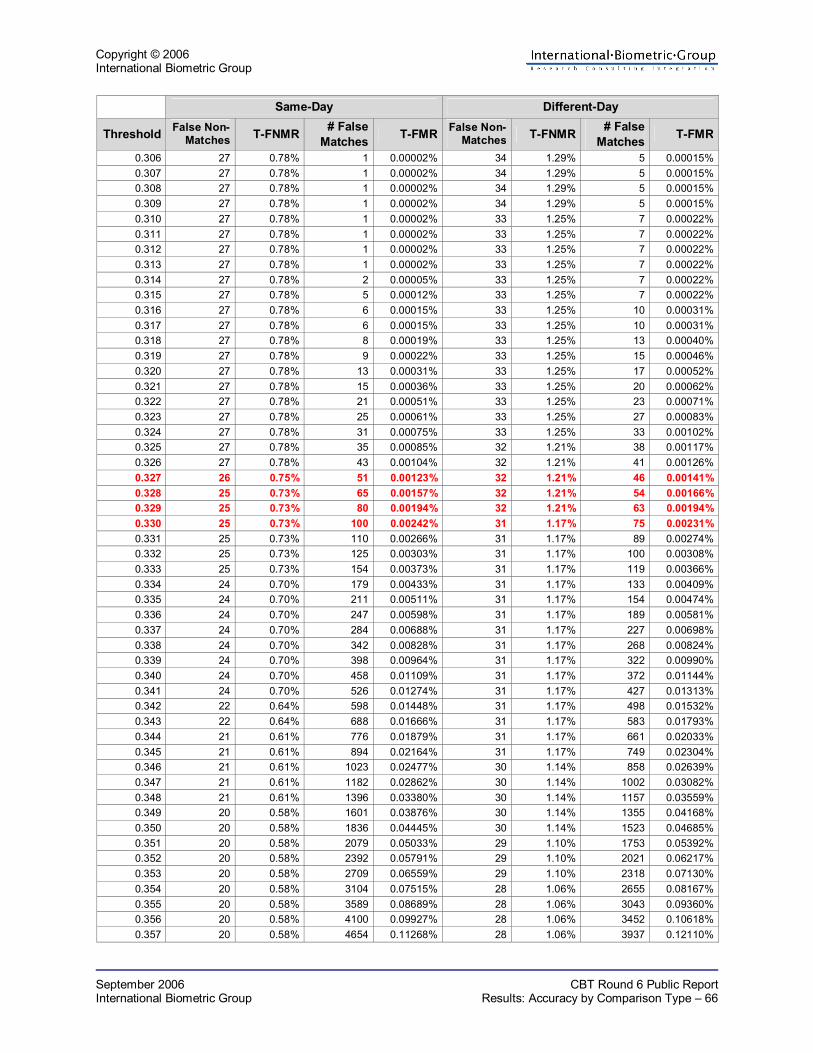
Copyright © 2006 International Biometric Group
September 2006 CBT Round 6 Public Report International Biometric Group Results: Accuracy by Comparison Type – 66
Same-Day Different-Day
Threshold False Non-Matches T-FNMR # False
Matches T-FMR False Non-Matches T-FNMR # False
Matches T-FMR
0.306 27 0.78% 1 0.00002% 34 1.29% 5 0.00015%0.307 27 0.78% 1 0.00002% 34 1.29% 5 0.00015%0.308 27 0.78% 1 0.00002% 34 1.29% 5 0.00015%0.309 27 0.78% 1 0.00002% 34 1.29% 5 0.00015%0.310 27 0.78% 1 0.00002% 33 1.25% 7 0.00022%0.311 27 0.78% 1 0.00002% 33 1.25% 7 0.00022%0.312 27 0.78% 1 0.00002% 33 1.25% 7 0.00022%0.313 27 0.78% 1 0.00002% 33 1.25% 7 0.00022%0.314 27 0.78% 2 0.00005% 33 1.25% 7 0.00022%0.315 27 0.78% 5 0.00012% 33 1.25% 7 0.00022%0.316 27 0.78% 6 0.00015% 33 1.25% 10 0.00031%0.317 27 0.78% 6 0.00015% 33 1.25% 10 0.00031%0.318 27 0.78% 8 0.00019% 33 1.25% 13 0.00040%0.319 27 0.78% 9 0.00022% 33 1.25% 15 0.00046%0.320 27 0.78% 13 0.00031% 33 1.25% 17 0.00052%0.321 27 0.78% 15 0.00036% 33 1.25% 20 0.00062%0.322 27 0.78% 21 0.00051% 33 1.25% 23 0.00071%0.323 27 0.78% 25 0.00061% 33 1.25% 27 0.00083%0.324 27 0.78% 31 0.00075% 33 1.25% 33 0.00102%0.325 27 0.78% 35 0.00085% 32 1.21% 38 0.00117%0.326 27 0.78% 43 0.00104% 32 1.21% 41 0.00126%0.327 26 0.75% 51 0.00123% 32 1.21% 46 0.00141%0.328 25 0.73% 65 0.00157% 32 1.21% 54 0.00166%0.329 25 0.73% 80 0.00194% 32 1.21% 63 0.00194%0.330 25 0.73% 100 0.00242% 31 1.17% 75 0.00231%0.331 25 0.73% 110 0.00266% 31 1.17% 89 0.00274%0.332 25 0.73% 125 0.00303% 31 1.17% 100 0.00308%0.333 25 0.73% 154 0.00373% 31 1.17% 119 0.00366%0.334 24 0.70% 179 0.00433% 31 1.17% 133 0.00409%0.335 24 0.70% 211 0.00511% 31 1.17% 154 0.00474%0.336 24 0.70% 247 0.00598% 31 1.17% 189 0.00581%0.337 24 0.70% 284 0.00688% 31 1.17% 227 0.00698%0.338 24 0.70% 342 0.00828% 31 1.17% 268 0.00824%0.339 24 0.70% 398 0.00964% 31 1.17% 322 0.00990%0.340 24 0.70% 458 0.01109% 31 1.17% 372 0.01144%0.341 24 0.70% 526 0.01274% 31 1.17% 427 0.01313%0.342 22 0.64% 598 0.01448% 31 1.17% 498 0.01532%0.343 22 0.64% 688 0.01666% 31 1.17% 583 0.01793%0.344 21 0.61% 776 0.01879% 31 1.17% 661 0.02033%0.345 21 0.61% 894 0.02164% 31 1.17% 749 0.02304%0.346 21 0.61% 1023 0.02477% 30 1.14% 858 0.02639%0.347 21 0.61% 1182 0.02862% 30 1.14% 1002 0.03082%0.348 21 0.61% 1396 0.03380% 30 1.14% 1157 0.03559%0.349 20 0.58% 1601 0.03876% 30 1.14% 1355 0.04168%0.350 20 0.58% 1836 0.04445% 30 1.14% 1523 0.04685%0.351 20 0.58% 2079 0.05033% 29 1.10% 1753 0.05392%0.352 20 0.58% 2392 0.05791% 29 1.10% 2021 0.06217%0.353 20 0.58% 2709 0.06559% 29 1.10% 2318 0.07130%0.354 20 0.58% 3104 0.07515% 28 1.06% 2655 0.08167%0.355 20 0.58% 3589 0.08689% 28 1.06% 3043 0.09360%0.356 20 0.58% 4100 0.09927% 28 1.06% 3452 0.10618%0.357 20 0.58% 4654 0.11268% 28 1.06% 3937 0.12110%
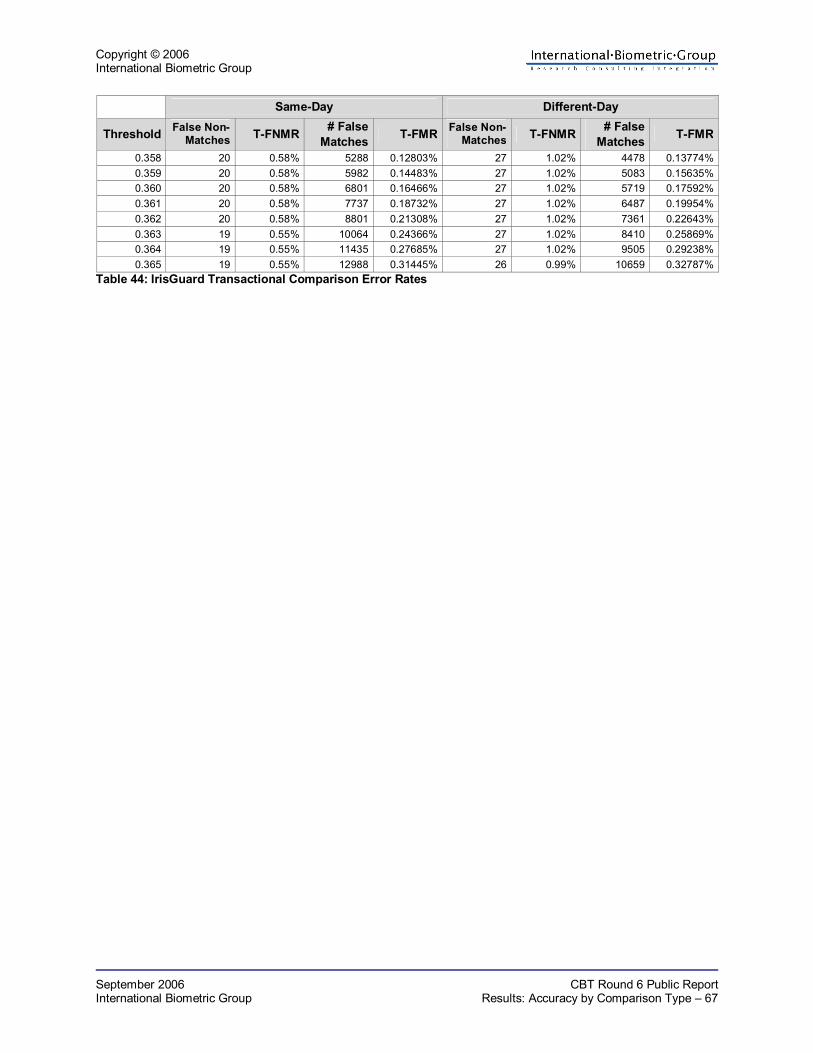
Copyright © 2006 International Biometric Group
September 2006 CBT Round 6 Public Report International Biometric Group Results: Accuracy by Comparison Type – 67
Same-Day Different-Day
Threshold False Non-Matches T-FNMR # False
Matches T-FMR False Non-Matches T-FNMR # False
Matches T-FMR
0.358 20 0.58% 5288 0.12803% 27 1.02% 4478 0.13774%0.359 20 0.58% 5982 0.14483% 27 1.02% 5083 0.15635%0.360 20 0.58% 6801 0.16466% 27 1.02% 5719 0.17592%0.361 20 0.58% 7737 0.18732% 27 1.02% 6487 0.19954%0.362 20 0.58% 8801 0.21308% 27 1.02% 7361 0.22643%0.363 19 0.55% 10064 0.24366% 27 1.02% 8410 0.25869%0.364 19 0.55% 11435 0.27685% 27 1.02% 9505 0.29238%0.365 19 0.55% 12988 0.31445% 26 0.99% 10659 0.32787%
Table 44: IrisGuard Transactional Comparison Error Rates

Copyright © 2006 International Biometric Group
September 2006 CBT Round 6 Public Report International Biometric Group Results: Accuracy by System – 68
8 Results: Accuracy by System
8.1 Presentation of Accuracy Results Table 45 through Table 47 provide comparison results tables for each system inclusive of Same-Day, Different-Day, attempt-level, and transactional results. This data is identical to that presented in Section 7, but from a system perspective as opposed to a comparison-type perspective. Comparison error rates are also shown through DETs in Figure 17 through Table 19. Although DET axes are labeled FMR and FNMR, transactional error rates are measured in terms of T-FMR and T-FNMR. The following abbreviations apply: • T: Threshold • FNM: False Non-Matches (Count) • FNMR: False Non-Match Rate • FM: False Matches (Count) • FMR: False Match Rate • T-FNMR: Transactional False Non-Match Rate • T-FMR: Transactional False Match Rate

Cop
yrig
ht ©
200
6
Inte
rnat
iona
l Bio
met
ric G
roup
Se
ptem
ber 2
006
C
BT R
ound
6 P
ublic
Rep
ort
Inte
rnat
iona
l Bio
met
ric G
roup
Res
ults
: Acc
urac
y by
Sys
tem
– 6
9
8.2
Fujit
su R
esul
t Tab
le a
nd D
ETs
Atte
mpt
-Lev
el
Tran
sact
iona
l
Sam
e-D
ay
Diff
eren
t-Day
Sa
me-
Day
D
iffer
ent-D
ay
T FN
M
FNM
R
FM
FMR
FNM
FNM
RFM
FMR
FNM
T-FN
MR
FM
T-FM
RFN
MT-
FNM
RFM
T-FM
RLo
w
692
3.13
%
276
0.03
802%
1018
6.17
%57
0.03
949%
80.
22%
21
60.
1765
9%9
0.33
%45
0.18
305%
Def
ault
926
4.23
%
3277
0.
0117
7%13
978.
52%
2886
0.01
353%
210.
57%
26
060.
0559
4%19
0.69
%22
390.
0628
6%H
igh
12
34
5.64
%
13
0.00
180%
1944
11.8
6%1
0.00
070%
320.
87%
11
0.00
906%
391.
42%
10.
0042
0%Ta
ble
45: F
ujits
u C
ompa
rison
Err
or R
ates

Cop
yrig
ht ©
200
6
Inte
rnat
iona
l Bio
met
ric G
roup
Se
ptem
ber 2
006
C
BT R
ound
6 P
ublic
Rep
ort
Inte
rnat
iona
l Bio
met
ric G
roup
Res
ults
: Acc
urac
y by
Sys
tem
– 7
0
Fi
gure
17:
Fuj
itsu
DET
s

Cop
yrig
ht ©
200
6
Inte
rnat
iona
l Bio
met
ric G
roup
Se
ptem
ber 2
006
C
BT R
ound
6 P
ublic
Rep
ort
Inte
rnat
iona
l Bio
met
ric G
roup
Res
ults
: Acc
urac
y by
Sys
tem
– 7
1
8.3
Hita
chi R
esul
t Tab
le a
nd D
ETs
Atte
mpt
-Lev
el
Tran
sact
iona
l
Sam
e-D
ay
Diff
eren
t-Day
Sa
me-
Day
D
iffer
ent-D
ay
T FN
M
FNM
R
FM
FMR
FNM
FNM
RFM
FMR
FNM
T-FN
MR
FM
T-FM
RFN
MT-
FNM
RFM
T-FM
R16
0 23
09
20.3
6%
0 0.
0000
0%31
5638
.24%
00.
0000
0%37
49.
79%
0
0.00
000%
695
24.9
6%0
0.00
000%
161
2160
19
.05%
0
0.00
000%
3003
36.3
8%1
0.00
001%
347
9.09
%
00.
0000
0%64
623
.20%
10.
0000
3%16
2 20
05
17.6
8%
0 0.
0000
0%28
6034
.65%
10.
0000
1%31
38.
20%
0
0.00
000%
603
21.6
6%1
0.00
003%
163
1862
16
.42%
0
0.00
000%
2714
32.8
8%2
0.00
002%
284
7.44
%
00.
0000
0%57
120
.51%
20.
0000
6%16
4 17
14
15.1
1%
0 0.
0000
0%25
6331
.05%
20.
0000
2%25
76.
73%
0
0.00
000%
536
19.2
5%2
0.00
006%
165
1597
14
.08%
0
0.00
000%
2434
29.4
9%2
0.00
002%
245
6.42
%
00.
0000
0%50
718
.21%
20.
0000
6%16
6 14
89
13.1
3%
0 0.
0000
0%22
9727
.83%
20.
0000
2%22
75.
94%
0
0.00
000%
475
17.0
6%2
0.00
006%
167
1382
12
.19%
0
0.00
000%
2169
26.2
8%2
0.00
002%
216
5.66
%
00.
0000
0%43
915
.77%
20.
0000
6%16
8 13
01
11.4
7%
0 0.
0000
0%20
5224
.86%
30.
0000
3%20
15.
26%
0
0.00
000%
408
14.6
6%2
0.00
006%
169
1209
10
.66%
0
0.00
000%
1953
23.6
6%6
0.00
006%
184
4.82
%
00.
0000
0%38
413
.79%
50.
0001
4%17
0 11
18
9.86
%
1 0.
0000
1%18
5322
.45%
80.
0000
8%16
24.
24%
1
0.00
002%
360
12.9
3%5
0.00
014%
171
1025
9.
04%
4
0.00
003%
1737
21.0
4%9
0.00
009%
149
3.90
%
40.
0000
8%32
811
.78%
50.
0001
4%17
2 95
0 8.
38%
4
0.00
003%
1646
19.9
4%9
0.00
009%
135
3.53
%
40.
0000
8%30
310
.88%
50.
0001
4%17
3 86
4 7.
62%
5
0.00
003%
1561
18.9
1%11
0.00
011%
117
3.06
%
50.
0001
0%28
410
.20%
60.
0001
7%17
4 78
1 6.
89%
5
0.00
003%
1478
17.9
1%14
0.00
013%
992.
59%
5
0.00
010%
266
9.55
%9
0.00
025%
175
709
6.25
%
7 0.
0000
5%13
8716
.80%
160.
0001
5%84
2.20
%
70.
0001
4%25
08.
98%
100.
0002
8%17
6 64
6 5.
70%
12
0.
0000
8%13
0815
.85%
230.
0002
2%78
2.04
%
80.
0001
7%23
68.
48%
130.
0003
7%17
7 59
1 5.
21%
15
0.
0001
0%12
3314
.94%
280.
0002
7%73
1.91
%
110.
0002
3%22
38.
01%
160.
0004
5%17
8 55
4 4.
88%
17
0.
0001
2%11
6914
.16%
300.
0002
9%71
1.86
%
120.
0002
5%20
67.
40%
160.
0004
5%17
9 51
7 4.
56%
21
0.
0001
5%11
0913
.44%
370.
0003
5%68
1.78
%
150.
0003
1%19
57.
00%
190.
0005
4%18
0 48
6 4.
29%
32
0.
0002
2%10
4212
.62%
430.
0004
1%67
1.75
%
250.
0005
2%18
36.
57%
240.
0006
8%18
1 45
9 4.
05%
39
0.
0002
7%98
711
.96%
490.
0004
7%60
1.57
%
300.
0006
2%17
16.
14%
290.
0008
2%18
2 42
8 3.
77%
48
0.
0003
3%94
311
.42%
550.
0005
3%59
1.54
%
340.
0007
0%16
35.
85%
320.
0009
0%18
3 39
5 3.
48%
61
0.
0004
2%87
210
.56%
630.
0006
0%55
1.44
%
430.
0008
9%14
45.
17%
380.
0010
7%18
4 36
4 3.
21%
75
0.
0005
2%82
39.
97%
760.
0007
3%51
1.34
%
530.
0010
9%13
74.
92%
460.
0013
0%18
5 34
0 3.
00%
95
0.
0006
6%77
79.
41%
850.
0008
1%47
1.23
%
650.
0013
4%12
74.
56%
500.
0014
1%18
6 31
6 2.
79%
11
6 0.
0008
1%73
48.
89%
102
0.00
097%
451.
18%
80
0.00
165%
118
4.24
%61
0.00
172%
187
305
2.69
%
138
0.00
096%
700
8.48
%12
60.
0012
0%45
1.18
%
960.
0019
8%11
44.
09%
760.
0021
5%18
8 28
9 2.
55%
16
0 0.
0011
1%67
28.
14%
148
0.00
141%
401.
05%
11
50.
0023
7%10
93.
92%
890.
0025
2%18
9 27
4 2.
42%
19
4 0.
0013
5%63
87.
73%
183
0.00
175%
391.
02%
13
30.
0027
5%10
43.
74%
107
0.00
302%
190
258
2.27
%
226
0.00
157%
602
7.29
%21
30.
0020
3%35
0.92
%
160
0.00
330%
963.
45%
128
0.00
362%
191
240
2.12
%
282
0.00
196%
574
6.95
%25
20.
0024
1%31
0.81
%
199
0.00
411%
923.
30%
160
0.00
452%
192
227
2.00
%
351
0.00
244%
552
6.69
%30
00.
0028
6%31
0.81
%
247
0.00
510%
903.
23%
191
0.00
540%
193
217
1.91
%
428
0.00
298%
524
6.35
%35
90.
0034
3%30
0.79
%
295
0.00
609%
863.
09%
232
0.00
656%
194
204
1.80
%
512
0.00
356%
495
6.00
%43
10.
0041
2%29
0.76
%
355
0.00
733%
843.
02%
278
0.00
786%

Cop
yrig
ht ©
200
6
Inte
rnat
iona
l Bio
met
ric G
roup
Se
ptem
ber 2
006
C
BT R
ound
6 P
ublic
Rep
ort
Inte
rnat
iona
l Bio
met
ric G
roup
Res
ults
: Acc
urac
y by
Sys
tem
– 7
2
Atte
mpt
-Lev
el
Tran
sact
iona
l
Sam
e-D
ay
Diff
eren
t-Day
Sa
me-
Day
D
iffer
ent-D
ay
T FN
M
FNM
R
FM
FMR
FNM
FNM
RFM
FMR
FNM
T-FN
MR
FM
T-FM
RFN
MT-
FNM
RFM
T-FM
R19
5 19
1 1.
68%
62
2 0.
0043
3%46
45.
62%
506
0.00
483%
280.
73%
43
60.
0090
0%80
2.87
%32
60.
0092
1%19
6 17
9 1.
58%
77
5 0.
0053
9%44
05.
33%
603
0.00
576%
240.
63%
55
10.
0113
8%75
2.69
%39
10.
0110
5%19
7 16
4 1.
45%
94
7 0.
0065
9%42
65.
16%
714
0.00
682%
210.
55%
68
50.
0141
4%75
2.69
%46
80.
0132
3%19
8 15
7 1.
38%
11
63
0.00
809%
409
4.96
%85
00.
0081
2%21
0.55
%
846
0.01
747%
712.
55%
568
0.01
606%
199
143
1.26
%
1442
0.
0100
4%39
44.
77%
1021
0.00
975%
200.
52%
10
480.
0216
4%67
2.41
%69
10.
0195
3%20
0 14
2 1.
25%
17
86
0.01
243%
374
4.53
%12
340.
0117
8%20
0.52
%
1292
0.02
667%
642.
30%
847
0.02
394%
201
136
1.20
%
2221
0.
0154
6%36
14.
37%
1495
0.01
427%
170.
45%
16
060.
0331
6%63
2.26
%10
250.
0289
7%20
2 13
1 1.
16%
27
68
0.01
926%
345
4.18
%18
700.
0178
5%17
0.45
%
1985
0.04
098%
612.
19%
1277
0.03
610%
203
122
1.08
%
3362
0.
0234
0%33
54.
06%
2300
0.02
196%
160.
42%
23
920.
0493
8%59
2.12
%15
880.
0448
9%20
4 11
7 1.
03%
41
52
0.02
890%
320
3.88
%28
120.
0268
5%15
0.39
%
2947
0.06
084%
562.
01%
1961
0.05
543%
205
113
1.00
%
5148
0.
0358
3%31
03.
76%
3478
0.03
321%
140.
37%
36
190.
0747
1%55
1.98
%24
140.
0682
4%20
6 10
4 0.
92%
63
33
0.04
407%
293
3.55
%42
970.
0410
3%13
0.34
%
4438
0.09
162%
541.
94%
2939
0.08
308%
207
102
0.90
%
7712
0.
0536
7%28
63.
46%
5215
0.04
979%
130.
34%
53
740.
1109
5%54
1.94
%35
400.
1000
6%20
8 96
0.
85%
94
88
0.06
603%
272
3.30
%63
520.
0606
5%13
0.34
%
6531
0.13
483%
501.
80%
4309
0.12
180%
209
90
0.79
%
1156
4 0.
0804
8%26
33.
19%
7743
0.07
393%
130.
34%
79
270.
1636
5%50
1.80
%52
280.
1477
8%21
0 87
0.
77%
13
995
0.09
740%
252
3.05
%94
870.
0905
8%13
0.34
%
9553
0.19
722%
481.
72%
6455
0.18
246%
211
82
0.72
%
1704
3 0.
1186
1%24
83.
00%
1169
40.
1116
5%12
0.31
%
1154
90.
2384
3%48
1.72
%79
100.
2235
9%21
2 80
0.
71%
20
718
0.14
419%
243
2.94
%14
275
0.13
629%
120.
31%
13
967
0.28
835%
471.
69%
9592
0.27
113%
213
77
0.68
%
2516
4 0.
1751
3%24
02.
91%
1741
80.
1663
0%11
0.29
%
1686
20.
3481
2%47
1.69
%11
663
0.32
968%
214
74
0.65
%
3049
9 0.
2122
6%23
32.
82%
2113
60.
2018
0%11
0.29
%
2036
10.
4203
6%46
1.65
%14
072
0.39
777%
215
69
0.61
%
3693
7 0.
2570
6%22
72.
75%
2578
10.
2461
5%10
0.26
%
2451
20.
5060
5%46
1.65
%17
116
0.48
381%
216
68
0.60
%
4450
5 0.
3097
3%21
92.
65%
3125
90.
2984
5%10
0.26
%
2938
30.
6066
2%43
1.54
%20
625
0.58
300%
217
66
0.58
%
5338
7 0.
3715
4%21
32.
58%
3795
50.
3623
8%10
0.26
%
3499
30.
7224
3%43
1.54
%24
954
0.70
537%
218
65
0.57
%
6413
0 0.
4463
1%20
52.
48%
4596
60.
4388
7%10
0.26
%
4178
10.
8625
7%42
1.51
%29
994
0.84
783%
219
63
0.56
%
7715
0 0.
5369
2%20
02.
42%
5531
40.
5281
2%10
0.26
%
4990
51.
0302
9%42
1.51
%35
828
1.01
274%
220
57
0.50
%
9247
1 0.
6435
5%19
72.
39%
6653
20.
6352
3%10
0.26
%
5946
71.
2277
0%40
1.44
%42
834
1.21
078%
221
56
0.49
%
1107
48
0.77
074%
190
2.30
%80
011
0.76
392%
100.
26%
70
953
1.46
483%
381.
36%
5122
61.
4479
9%22
2 54
0.
48%
13
2262
0.
9204
7%18
22.
20%
9590
00.
9156
3%9
0.24
%
8421
81.
7386
9%36
1.29
%61
035
1.72
526%
223
53
0.47
%
1577
77
1.09
804%
178
2.16
%11
4630
1.09
446%
90.
24%
99
679
2.05
788%
351.
26%
7250
62.
0495
1%22
4 52
0.
46%
18
7777
1.
3068
2%17
42.
11%
1365
331.
3035
8%9
0.24
%
1179
742.
4355
9%34
1.22
%85
669
2.42
159%
225
51
0.45
%
2228
31
1.55
078%
171
2.07
%16
2243
1.54
905%
90.
24%
13
8958
2.86
880%
331.
19%
1009
222.
8527
4%22
6 48
0.
42%
26
4176
1.
8385
2%17
02.
06%
1924
221.
8371
9%9
0.24
%
1633
213.
3717
8%33
1.19
%11
8570
3.35
159%
227
47
0.41
%
3122
92
2.17
338%
167
2.02
%22
7800
2.17
497%
90.
24%
19
1329
3.95
001%
331.
19%
1390
303.
9299
3%22
8 46
0.
41%
36
8227
2.
5626
5%16
41.
99%
2686
822.
5653
0%9
0.24
%
2236
664.
6176
1%33
1.19
%16
2546
4.59
465%
Tabl
e 46
: Hita
chi C
ompa
rison
Err
or R
ates

Cop
yrig
ht ©
200
6
Inte
rnat
iona
l Bio
met
ric G
roup
Se
ptem
ber 2
006
C
BT R
ound
6 P
ublic
Rep
ort
Inte
rnat
iona
l Bio
met
ric G
roup
Res
ults
: Acc
urac
y by
Sys
tem
– 7
3
Fi
gure
18:
Hita
chi D
ETs
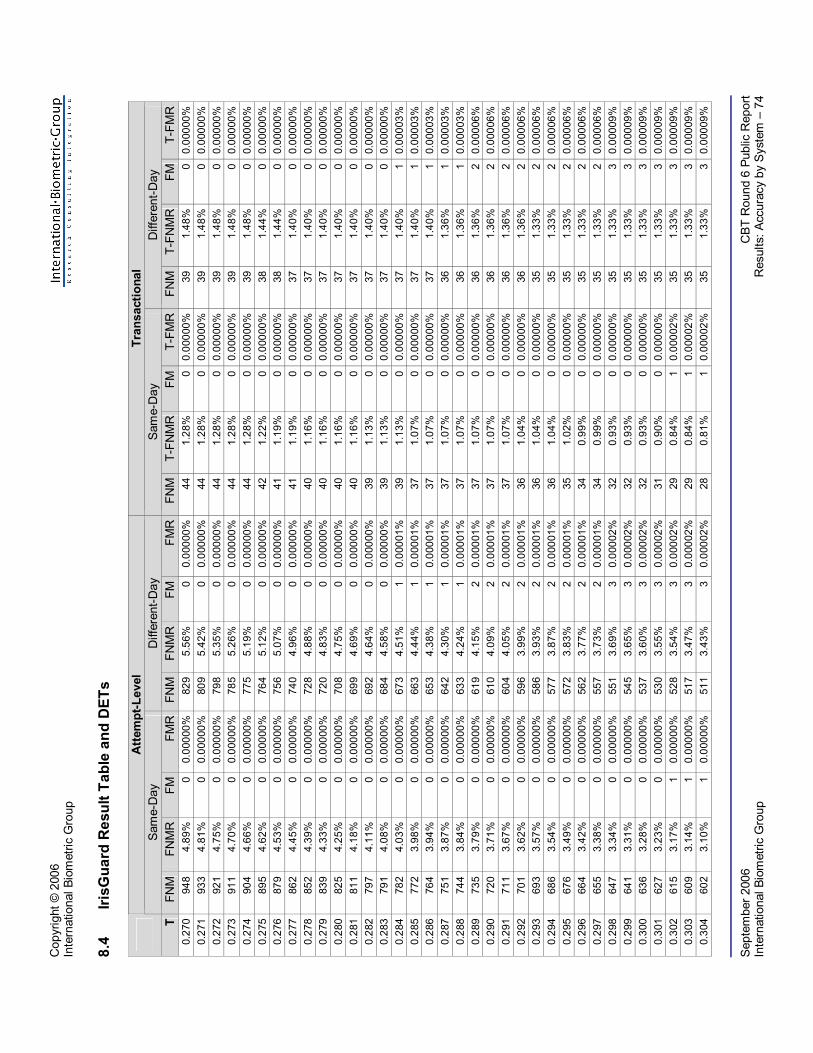
Cop
yrig
ht ©
200
6
Inte
rnat
iona
l Bio
met
ric G
roup
Se
ptem
ber 2
006
C
BT R
ound
6 P
ublic
Rep
ort
Inte
rnat
iona
l Bio
met
ric G
roup
Res
ults
: Acc
urac
y by
Sys
tem
– 7
4
8.4
IrisG
uard
Res
ult T
able
and
DET
s
A
ttem
pt-L
evel
Tr
ansa
ctio
nal
Sa
me-
Day
D
iffer
ent-D
ay
Sam
e-D
ay
Diff
eren
t-Day
T
FNM
FN
MR
FM
FM
RFN
MFN
MR
FMFM
RFN
MT-
FNM
R
FMT-
FMR
FNM
T-FN
MR
FMT-
FMR
0.27
0 94
8 4.
89%
0
0.00
000%
829
5.56
%0
0.00
000%
441.
28%
0
0.00
000%
391.
48%
00.
0000
0%0.
271
933
4.81
%
0 0.
0000
0%80
95.
42%
00.
0000
0%44
1.28
%
00.
0000
0%39
1.48
%0
0.00
000%
0.27
2 92
1 4.
75%
0
0.00
000%
798
5.35
%0
0.00
000%
441.
28%
0
0.00
000%
391.
48%
00.
0000
0%0.
273
911
4.70
%
0 0.
0000
0%78
55.
26%
00.
0000
0%44
1.28
%
00.
0000
0%39
1.48
%0
0.00
000%
0.27
4 90
4 4.
66%
0
0.00
000%
775
5.19
%0
0.00
000%
441.
28%
0
0.00
000%
391.
48%
00.
0000
0%0.
275
895
4.62
%
0 0.
0000
0%76
45.
12%
00.
0000
0%42
1.22
%
00.
0000
0%38
1.44
%0
0.00
000%
0.27
6 87
9 4.
53%
0
0.00
000%
756
5.07
%0
0.00
000%
411.
19%
0
0.00
000%
381.
44%
00.
0000
0%0.
277
862
4.45
%
0 0.
0000
0%74
04.
96%
00.
0000
0%41
1.19
%
00.
0000
0%37
1.40
%0
0.00
000%
0.27
8 85
2 4.
39%
0
0.00
000%
728
4.88
%0
0.00
000%
401.
16%
0
0.00
000%
371.
40%
00.
0000
0%0.
279
839
4.33
%
0 0.
0000
0%72
04.
83%
00.
0000
0%40
1.16
%
00.
0000
0%37
1.40
%0
0.00
000%
0.28
0 82
5 4.
25%
0
0.00
000%
708
4.75
%0
0.00
000%
401.
16%
0
0.00
000%
371.
40%
00.
0000
0%0.
281
811
4.18
%
0 0.
0000
0%69
94.
69%
00.
0000
0%40
1.16
%
00.
0000
0%37
1.40
%0
0.00
000%
0.28
2 79
7 4.
11%
0
0.00
000%
692
4.64
%0
0.00
000%
391.
13%
0
0.00
000%
371.
40%
00.
0000
0%0.
283
791
4.08
%
0 0.
0000
0%68
44.
58%
00.
0000
0%39
1.13
%
00.
0000
0%37
1.40
%0
0.00
000%
0.28
4 78
2 4.
03%
0
0.00
000%
673
4.51
%1
0.00
001%
391.
13%
0
0.00
000%
371.
40%
10.
0000
3%0.
285
772
3.98
%
0 0.
0000
0%66
34.
44%
10.
0000
1%37
1.07
%
00.
0000
0%37
1.40
%1
0.00
003%
0.28
6 76
4 3.
94%
0
0.00
000%
653
4.38
%1
0.00
001%
371.
07%
0
0.00
000%
371.
40%
10.
0000
3%0.
287
751
3.87
%
0 0.
0000
0%64
24.
30%
10.
0000
1%37
1.07
%
00.
0000
0%36
1.36
%1
0.00
003%
0.28
8 74
4 3.
84%
0
0.00
000%
633
4.24
%1
0.00
001%
371.
07%
0
0.00
000%
361.
36%
10.
0000
3%0.
289
735
3.79
%
0 0.
0000
0%61
94.
15%
20.
0000
1%37
1.07
%
00.
0000
0%36
1.36
%2
0.00
006%
0.29
0 72
0 3.
71%
0
0.00
000%
610
4.09
%2
0.00
001%
371.
07%
0
0.00
000%
361.
36%
20.
0000
6%0.
291
711
3.67
%
0 0.
0000
0%60
44.
05%
20.
0000
1%37
1.07
%
00.
0000
0%36
1.36
%2
0.00
006%
0.29
2 70
1 3.
62%
0
0.00
000%
596
3.99
%2
0.00
001%
361.
04%
0
0.00
000%
361.
36%
20.
0000
6%0.
293
693
3.57
%
0 0.
0000
0%58
63.
93%
20.
0000
1%36
1.04
%
00.
0000
0%35
1.33
%2
0.00
006%
0.29
4 68
6 3.
54%
0
0.00
000%
577
3.87
%2
0.00
001%
361.
04%
0
0.00
000%
351.
33%
20.
0000
6%0.
295
676
3.49
%
0 0.
0000
0%57
23.
83%
20.
0000
1%35
1.02
%
00.
0000
0%35
1.33
%2
0.00
006%
0.29
6 66
4 3.
42%
0
0.00
000%
562
3.77
%2
0.00
001%
340.
99%
0
0.00
000%
351.
33%
20.
0000
6%0.
297
655
3.38
%
0 0.
0000
0%55
73.
73%
20.
0000
1%34
0.99
%
00.
0000
0%35
1.33
%2
0.00
006%
0.29
8 64
7 3.
34%
0
0.00
000%
551
3.69
%3
0.00
002%
320.
93%
0
0.00
000%
351.
33%
30.
0000
9%0.
299
641
3.31
%
0 0.
0000
0%54
53.
65%
30.
0000
2%32
0.93
%
00.
0000
0%35
1.33
%3
0.00
009%
0.30
0 63
6 3.
28%
0
0.00
000%
537
3.60
%3
0.00
002%
320.
93%
0
0.00
000%
351.
33%
30.
0000
9%0.
301
627
3.23
%
0 0.
0000
0%53
03.
55%
30.
0000
2%31
0.90
%
00.
0000
0%35
1.33
%3
0.00
009%
0.30
2 61
5 3.
17%
1
0.00
000%
528
3.54
%3
0.00
002%
290.
84%
1
0.00
002%
351.
33%
30.
0000
9%0.
303
609
3.14
%
1 0.
0000
0%51
73.
47%
30.
0000
2%29
0.84
%
10.
0000
2%35
1.33
%3
0.00
009%
0.30
4 60
2 3.
10%
1
0.00
000%
511
3.43
%3
0.00
002%
280.
81%
1
0.00
002%
351.
33%
30.
0000
9%

Cop
yrig
ht ©
200
6
Inte
rnat
iona
l Bio
met
ric G
roup
Se
ptem
ber 2
006
C
BT R
ound
6 P
ublic
Rep
ort
Inte
rnat
iona
l Bio
met
ric G
roup
Res
ults
: Acc
urac
y by
Sys
tem
– 7
5
Atte
mpt
-Lev
el
Tran
sact
iona
l
Sam
e-D
ay
Diff
eren
t-Day
Sa
me-
Day
D
iffer
ent-D
ay
T FN
M
FNM
R
FM
FMR
FNM
FNM
RFM
FMR
FNM
T-FN
MR
FM
T-FM
RFN
MT-
FNM
RFM
T-FM
R0.
305
600
3.09
%
1 0.
0000
0%50
33.
37%
40.
0000
2%28
0.81
%
10.
0000
2%34
1.29
%4
0.00
012%
0.30
6 59
2 3.
05%
1
0.00
000%
497
3.33
%5
0.00
003%
270.
78%
1
0.00
002%
341.
29%
50.
0001
5%0.
307
587
3.03
%
1 0.
0000
0%49
33.
30%
50.
0000
3%27
0.78
%
10.
0000
2%34
1.29
%5
0.00
015%
0.30
8 57
7 2.
98%
1
0.00
000%
490
3.28
%5
0.00
003%
270.
78%
1
0.00
002%
341.
29%
50.
0001
5%0.
309
566
2.92
%
1 0.
0000
0%48
43.
24%
60.
0000
3%27
0.78
%
10.
0000
2%34
1.29
%5
0.00
015%
0.31
0 55
1 2.
84%
1
0.00
000%
478
3.20
%8
0.00
004%
270.
78%
1
0.00
002%
331.
25%
70.
0002
2%0.
311
541
2.79
%
1 0.
0000
0%47
23.
16%
80.
0000
4%27
0.78
%
10.
0000
2%33
1.25
%7
0.00
022%
0.31
2 53
3 2.
75%
1
0.00
000%
465
3.12
%8
0.00
004%
270.
78%
1
0.00
002%
331.
25%
70.
0002
2%0.
313
522
2.69
%
1 0.
0000
0%45
93.
08%
80.
0000
4%27
0.78
%
10.
0000
2%33
1.25
%7
0.00
022%
0.31
4 51
7 2.
67%
2
0.00
001%
451
3.02
%8
0.00
004%
270.
78%
2
0.00
005%
331.
25%
70.
0002
2%0.
315
513
2.65
%
5 0.
0000
2%44
93.
01%
80.
0000
4%27
0.78
%
50.
0001
2%33
1.25
%7
0.00
022%
0.31
6 50
9 2.
63%
6
0.00
003%
446
2.99
%11
0.00
006%
270.
78%
6
0.00
015%
331.
25%
100.
0003
1%0.
317
503
2.59
%
6 0.
0000
3%44
32.
97%
110.
0000
6%27
0.78
%
60.
0001
5%33
1.25
%10
0.00
031%
0.31
8 49
3 2.
54%
9
0.00
004%
439
2.94
%14
0.00
007%
270.
78%
8
0.00
019%
331.
25%
130.
0004
0%0.
319
486
2.51
%
10
0.00
004%
435
2.92
%16
0.00
009%
270.
78%
9
0.00
022%
331.
25%
150.
0004
6%0.
320
480
2.48
%
14
0.00
006%
429
2.88
%18
0.00
010%
270.
78%
13
0.00
031%
331.
25%
170.
0005
2%0.
321
477
2.46
%
16
0.00
007%
425
2.85
%22
0.00
012%
270.
78%
15
0.00
036%
331.
25%
200.
0006
2%0.
322
471
2.43
%
22
0.00
009%
422
2.83
%25
0.00
013%
270.
78%
21
0.00
051%
331.
25%
230.
0007
1%0.
323
469
2.42
%
26
0.00
011%
419
2.81
%29
0.00
015%
270.
78%
25
0.00
061%
331.
25%
270.
0008
3%0.
324
461
2.38
%
32
0.00
013%
414
2.77
%35
0.00
019%
270.
78%
31
0.00
075%
331.
25%
330.
0010
2%0.
325
454
2.34
%
36
0.00
015%
407
2.73
%41
0.00
022%
270.
78%
35
0.00
085%
321.
21%
380.
0011
7%0.
326
448
2.31
%
44
0.00
019%
402
2.69
%45
0.00
024%
270.
78%
43
0.00
104%
321.
21%
410.
0012
6%0.
327
442
2.28
%
55
0.00
023%
397
2.66
%51
0.00
027%
260.
75%
51
0.00
123%
321.
21%
460.
0014
1%0.
328
436
2.25
%
71
0.00
030%
394
2.64
%59
0.00
031%
250.
73%
65
0.00
157%
321.
21%
540.
0016
6%0.
329
427
2.20
%
88
0.00
037%
389
2.61
%69
0.00
037%
250.
73%
80
0.00
194%
321.
21%
630.
0019
4%0.
330
422
2.18
%
110
0.00
046%
385
2.58
%83
0.00
044%
250.
73%
10
00.
0024
2%31
1.17
%75
0.00
231%
0.33
1 42
1 2.
17%
12
1 0.
0005
1%38
02.
55%
990.
0005
3%25
0.73
%
110
0.00
266%
311.
17%
890.
0027
4%0.
332
419
2.16
%
139
0.00
058%
377
2.53
%11
20.
0006
0%25
0.73
%
125
0.00
303%
311.
17%
100
0.00
308%
0.33
3 41
4 2.
14%
16
9 0.
0007
1%37
42.
51%
131
0.00
070%
250.
73%
15
40.
0037
3%31
1.17
%11
90.
0036
6%0.
334
408
2.10
%
196
0.00
082%
372
2.49
%14
50.
0007
7%24
0.70
%
179
0.00
433%
311.
17%
133
0.00
409%
0.33
5 40
4 2.
08%
23
0 0.
0009
7%36
62.
45%
169
0.00
090%
240.
70%
21
10.
0051
1%31
1.17
%15
40.
0047
4%0.
336
400
2.06
%
274
0.00
115%
365
2.45
%21
00.
0011
2%24
0.70
%
247
0.00
598%
311.
17%
189
0.00
581%
0.33
7 39
3 2.
03%
31
4 0.
0013
2%36
42.
44%
251
0.00
134%
240.
70%
28
40.
0068
8%31
1.17
%22
70.
0069
8%0.
338
390
2.01
%
376
0.00
158%
359
2.41
%29
70.
0015
8%24
0.70
%
342
0.00
828%
311.
17%
268
0.00
824%
0.33
9 38
7 2.
00%
44
5 0.
0018
7%35
12.
35%
356
0.00
190%
240.
70%
39
80.
0096
4%31
1.17
%32
20.
0099
0%0.
340
382
1.97
%
514
0.00
216%
350
2.35
%41
30.
0022
0%24
0.70
%
458
0.01
109%
311.
17%
372
0.01
144%
0.34
1 38
1 1.
97%
59
1 0.
0024
9%34
82.
33%
474
0.00
253%
240.
70%
52
60.
0127
4%31
1.17
%42
70.
0131
3%
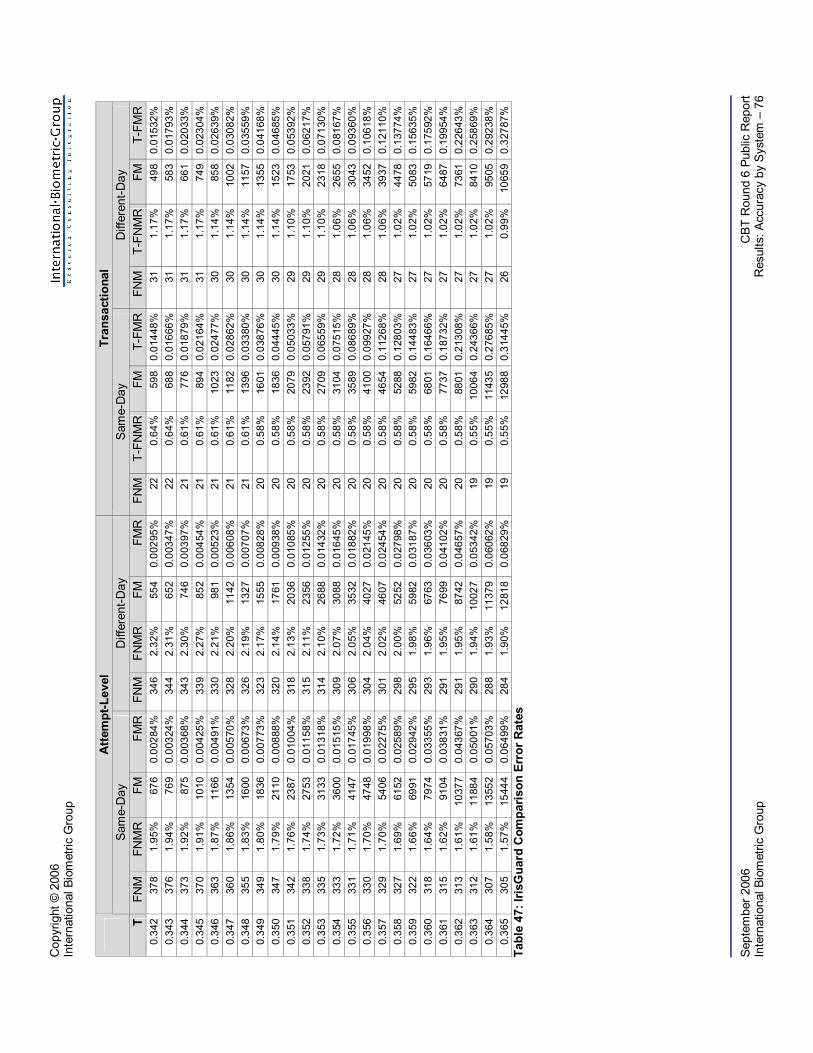
Cop
yrig
ht ©
200
6
Inte
rnat
iona
l Bio
met
ric G
roup
Se
ptem
ber 2
006
C
BT R
ound
6 P
ublic
Rep
ort
Inte
rnat
iona
l Bio
met
ric G
roup
Res
ults
: Acc
urac
y by
Sys
tem
– 7
6
Atte
mpt
-Lev
el
Tran
sact
iona
l
Sam
e-D
ay
Diff
eren
t-Day
Sa
me-
Day
D
iffer
ent-D
ay
T FN
M
FNM
R
FM
FMR
FNM
FNM
RFM
FMR
FNM
T-FN
MR
FM
T-FM
RFN
MT-
FNM
RFM
T-FM
R0.
342
378
1.95
%
676
0.00
284%
346
2.32
%55
40.
0029
5%22
0.64
%
598
0.01
448%
311.
17%
498
0.01
532%
0.34
3 37
6 1.
94%
76
9 0.
0032
4%34
42.
31%
652
0.00
347%
220.
64%
68
80.
0166
6%31
1.17
%58
30.
0179
3%0.
344
373
1.92
%
875
0.00
368%
343
2.30
%74
60.
0039
7%21
0.61
%
776
0.01
879%
311.
17%
661
0.02
033%
0.34
5 37
0 1.
91%
10
10
0.00
425%
339
2.27
%85
20.
0045
4%21
0.61
%
894
0.02
164%
311.
17%
749
0.02
304%
0.34
6 36
3 1.
87%
11
66
0.00
491%
330
2.21
%98
10.
0052
3%21
0.61
%
1023
0.02
477%
301.
14%
858
0.02
639%
0.34
7 36
0 1.
86%
13
54
0.00
570%
328
2.20
%11
420.
0060
8%21
0.61
%
1182
0.02
862%
301.
14%
1002
0.03
082%
0.34
8 35
5 1.
83%
16
00
0.00
673%
326
2.19
%13
270.
0070
7%21
0.61
%
1396
0.03
380%
301.
14%
1157
0.03
559%
0.34
9 34
9 1.
80%
18
36
0.00
773%
323
2.17
%15
550.
0082
8%20
0.58
%
1601
0.03
876%
301.
14%
1355
0.04
168%
0.35
0 34
7 1.
79%
21
10
0.00
888%
320
2.14
%17
610.
0093
8%20
0.58
%
1836
0.04
445%
301.
14%
1523
0.04
685%
0.35
1 34
2 1.
76%
23
87
0.01
004%
318
2.13
%20
360.
0108
5%20
0.58
%
2079
0.05
033%
291.
10%
1753
0.05
392%
0.35
2 33
8 1.
74%
27
53
0.01
158%
315
2.11
%23
560.
0125
5%20
0.58
%
2392
0.05
791%
291.
10%
2021
0.06
217%
0.35
3 33
5 1.
73%
31
33
0.01
318%
314
2.10
%26
880.
0143
2%20
0.58
%
2709
0.06
559%
291.
10%
2318
0.07
130%
0.35
4 33
3 1.
72%
36
00
0.01
515%
309
2.07
%30
880.
0164
5%20
0.58
%
3104
0.07
515%
281.
06%
2655
0.08
167%
0.35
5 33
1 1.
71%
41
47
0.01
745%
306
2.05
%35
320.
0188
2%20
0.58
%
3589
0.08
689%
281.
06%
3043
0.09
360%
0.35
6 33
0 1.
70%
47
48
0.01
998%
304
2.04
%40
270.
0214
5%20
0.58
%
4100
0.09
927%
281.
06%
3452
0.10
618%
0.35
7 32
9 1.
70%
54
06
0.02
275%
301
2.02
%46
070.
0245
4%20
0.58
%
4654
0.11
268%
281.
06%
3937
0.12
110%
0.35
8 32
7 1.
69%
61
52
0.02
589%
298
2.00
%52
520.
0279
8%20
0.58
%
5288
0.12
803%
271.
02%
4478
0.13
774%
0.35
9 32
2 1.
66%
69
91
0.02
942%
295
1.98
%59
820.
0318
7%20
0.58
%
5982
0.14
483%
271.
02%
5083
0.15
635%
0.36
0 31
8 1.
64%
79
74
0.03
355%
293
1.96
%67
630.
0360
3%20
0.58
%
6801
0.16
466%
271.
02%
5719
0.17
592%
0.36
1 31
5 1.
62%
91
04
0.03
831%
291
1.95
%76
990.
0410
2%20
0.58
%
7737
0.18
732%
271.
02%
6487
0.19
954%
0.36
2 31
3 1.
61%
10
377
0.04
367%
291
1.95
%87
420.
0465
7%20
0.58
%
8801
0.21
308%
271.
02%
7361
0.22
643%
0.36
3 31
2 1.
61%
11
884
0.05
001%
290
1.94
%10
027
0.05
342%
190.
55%
10
064
0.24
366%
271.
02%
8410
0.25
869%
0.36
4 30
7 1.
58%
13
552
0.05
703%
288
1.93
%11
379
0.06
062%
190.
55%
11
435
0.27
685%
271.
02%
9505
0.29
238%
0.36
5 30
5 1.
57%
15
444
0.06
499%
284
1.90
%12
818
0.06
829%
190.
55%
12
988
0.31
445%
260.
99%
1065
90.
3278
7%Ta
ble
47: I
risG
uard
Com
paris
on E
rror
Rat
es

Cop
yrig
ht ©
200
6
Inte
rnat
iona
l Bio
met
ric G
roup
Se
ptem
ber 2
006
C
BT R
ound
6 P
ublic
Rep
ort
Inte
rnat
iona
l Bio
met
ric G
roup
Res
ults
: Acc
urac
y by
Sys
tem
– 7
7
Fi
gure
19:
Iris
Gua
rd D
ETs
Copyright © 2006 International Biometric Group
September 2006 CBT Round 6 Public Report International Biometric Group Annexes – 78
9 Results Summary
Systems tested in CBT Round 6 have each found considerable success in high-profile implementations outside the U.S. – Fujitsu and Hitachi in Japan, and IrisGuard in the Middle East. However, prior to CBT Round 6, limited independent test results were publicly available on these systems' performance. Based on CBT Round 6 results, each system excelled at many different aspects of performance, such that IrisGuard, Hitachi, and Fujitsu can each be considered very high-performing systems for the types of applications that CBT models. The low failure to enroll and failure to acquire rates generated by all systems was surprising, particularly for vascular recognition systems. Failure to enroll is an often-overlooked metric; it is well-known that systems can improve accuracy by increasing the proportion of samples that fail the enrollment process. Enrollment capabilities are essential to decision-making in large-scale, mass-market systems. Even at the attempt level for recognition sample capture, Fujitsu and Hitachi were able to capture a very high percentage of hands and fingers, respectively. Hitachi and to a lesser degree Fujitsu also showed comparatively short Enrollment Transaction Duration and Recognition Attempt Duration. This data may help address the question of vascular recognition's usability for a high percentage of the population. Hitachi provided highly robust 1:1 FNMR at various thresholds, and also provided very rapid sample capture. Based on CBT Round 6 results, one might speculate that a highly-habituated population would perform very well on the Hitachi system due to its very low Same-Day FNMR. At its default threshold, Fujitsu Different-Day T-FNMR (the most operationally relevant accuracy metric) was lower than that of other systems. Fujitsu T-FNMR increased only slightly between Same- and Different-Day Transactions. Fujitsu would likely have benefited from providing a development kit that output scores as opposed to match / no-match decisions, as this would have enabled generation of more granular results. In sum, vascular recognition – a modality seen as novel in the U.S. – appears to be a very serious competitor to fingerprint, hand geometry, and certain iris recognition systems used in large-scale 1:1 access control, logical access, and consumer ID applications. The systems tested provided a strong combination of usability and accuracy. IrisGuard was implemented on an Iridian software platform that differs from the native architecture typically used in operational deployments. On review of draft test results, IrisGuard stated that its platform provides much more rapid capture than the software tested in CBT Round 6, and also that the Iridian PrivateID implementation required more enrollment presentations than was necessary. Since this negatively impacted IrisGuard capture speed and capture rates, and potentially its FNMR, IrisGuard results must be reviewed guardedly. This notwithstanding, IrisGuard accuracy and usability were such that it is, in many respects, the most robust all-around iris recognition system that IBG has tested. Genuine error rates increased only slightly between Same- and Different-Day. IrisGuard T-FNMR of 1.33% at T-FMR of 0.0001% was by far the lowest in CBT Round 6 and was on par with any commercial iris recognition system IBG has evaluated. Round 6 was the first round of CBT to have incorporated real-time data collection and offline comparison, which introduced many challenges. Among the more difficult elements to address were (1) maintaining operational realism during the capture process absent real-time comparison and (2) balancing vendor desire for customized implementation with the need to enforce consistent capture and comparison concepts of operations. Despite the complexities associated with this type of testing, we believe that the combination of usability and accuracy results generated in Comparative Biometric Testing provides deployers, vendors, and technology partners with unique insights into end-to-end system performance. In addition to the CBT Round 6 Public Report, IBG offers a CBT Round 6 Private Report that contains additional analyses and data, including Test Subject-specific performance and demographic trends.
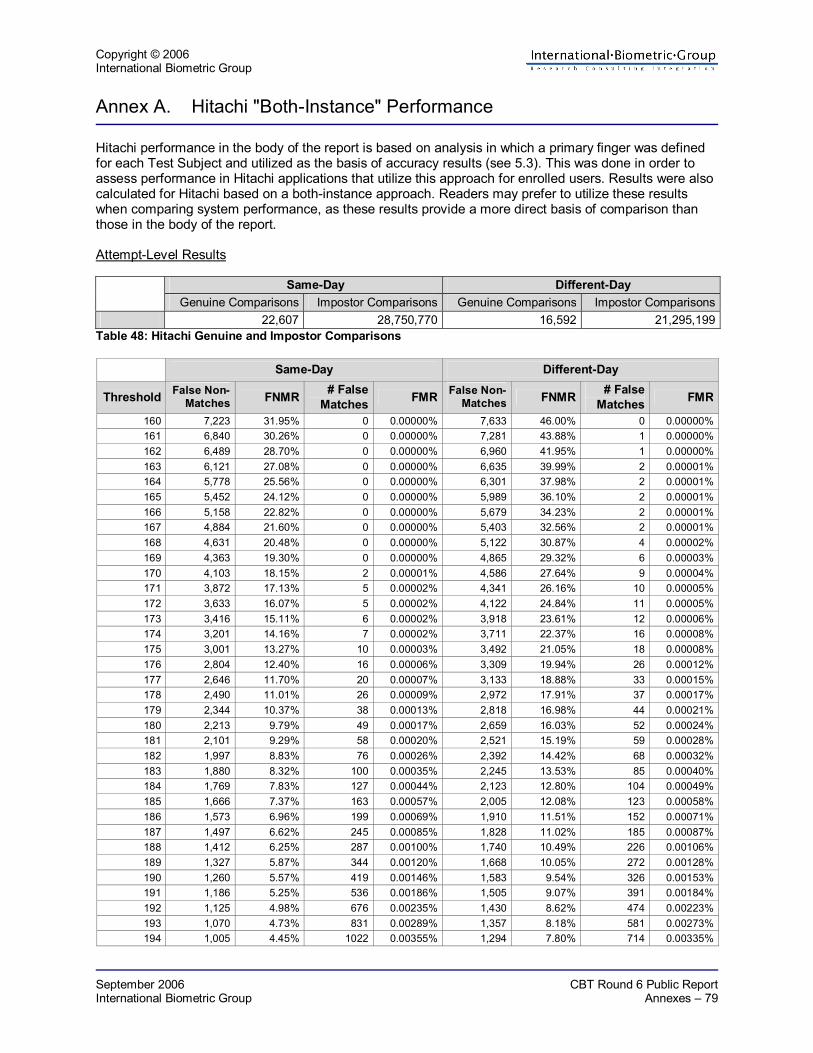
Copyright © 2006 International Biometric Group
September 2006 CBT Round 6 Public Report International Biometric Group Annexes – 79
Annex A. Hitachi "Both-Instance" Performance
Hitachi performance in the body of the report is based on analysis in which a primary finger was defined for each Test Subject and utilized as the basis of accuracy results (see 5.3). This was done in order to assess performance in Hitachi applications that utilize this approach for enrolled users. Results were also calculated for Hitachi based on a both-instance approach. Readers may prefer to utilize these results when comparing system performance, as these results provide a more direct basis of comparison than those in the body of the report. Attempt-Level Results
Same-Day Different-Day
Genuine Comparisons Impostor Comparisons Genuine Comparisons Impostor Comparisons 22,607 28,750,770 16,592 21,295,199
Table 48: Hitachi Genuine and Impostor Comparisons
Same-Day Different-Day
Threshold False Non-Matches FNMR # False
Matches FMR False Non-Matches FNMR # False
Matches FMR
160 7,223 31.95% 0 0.00000% 7,633 46.00% 0 0.00000%161 6,840 30.26% 0 0.00000% 7,281 43.88% 1 0.00000%162 6,489 28.70% 0 0.00000% 6,960 41.95% 1 0.00000%163 6,121 27.08% 0 0.00000% 6,635 39.99% 2 0.00001%164 5,778 25.56% 0 0.00000% 6,301 37.98% 2 0.00001%165 5,452 24.12% 0 0.00000% 5,989 36.10% 2 0.00001%166 5,158 22.82% 0 0.00000% 5,679 34.23% 2 0.00001%167 4,884 21.60% 0 0.00000% 5,403 32.56% 2 0.00001%168 4,631 20.48% 0 0.00000% 5,122 30.87% 4 0.00002%169 4,363 19.30% 0 0.00000% 4,865 29.32% 6 0.00003%170 4,103 18.15% 2 0.00001% 4,586 27.64% 9 0.00004%171 3,872 17.13% 5 0.00002% 4,341 26.16% 10 0.00005%172 3,633 16.07% 5 0.00002% 4,122 24.84% 11 0.00005%173 3,416 15.11% 6 0.00002% 3,918 23.61% 12 0.00006%174 3,201 14.16% 7 0.00002% 3,711 22.37% 16 0.00008%175 3,001 13.27% 10 0.00003% 3,492 21.05% 18 0.00008%176 2,804 12.40% 16 0.00006% 3,309 19.94% 26 0.00012%177 2,646 11.70% 20 0.00007% 3,133 18.88% 33 0.00015%178 2,490 11.01% 26 0.00009% 2,972 17.91% 37 0.00017%179 2,344 10.37% 38 0.00013% 2,818 16.98% 44 0.00021%180 2,213 9.79% 49 0.00017% 2,659 16.03% 52 0.00024%181 2,101 9.29% 58 0.00020% 2,521 15.19% 59 0.00028%182 1,997 8.83% 76 0.00026% 2,392 14.42% 68 0.00032%183 1,880 8.32% 100 0.00035% 2,245 13.53% 85 0.00040%184 1,769 7.83% 127 0.00044% 2,123 12.80% 104 0.00049%185 1,666 7.37% 163 0.00057% 2,005 12.08% 123 0.00058%186 1,573 6.96% 199 0.00069% 1,910 11.51% 152 0.00071%187 1,497 6.62% 245 0.00085% 1,828 11.02% 185 0.00087%188 1,412 6.25% 287 0.00100% 1,740 10.49% 226 0.00106%189 1,327 5.87% 344 0.00120% 1,668 10.05% 272 0.00128%190 1,260 5.57% 419 0.00146% 1,583 9.54% 326 0.00153%191 1,186 5.25% 536 0.00186% 1,505 9.07% 391 0.00184%192 1,125 4.98% 676 0.00235% 1,430 8.62% 474 0.00223%193 1,070 4.73% 831 0.00289% 1,357 8.18% 581 0.00273%194 1,005 4.45% 1022 0.00355% 1,294 7.80% 714 0.00335%

Copyright © 2006 International Biometric Group
September 2006 CBT Round 6 Public Report International Biometric Group Annexes – 80
Same-Day Different-Day
Threshold False Non-Matches FNMR # False
Matches FMR False Non-Matches FNMR # False
Matches FMR
195 953 4.22% 1268 0.00441% 1,222 7.36% 880 0.00413%196 908 4.02% 1571 0.00546% 1,157 6.97% 1084 0.00509%197 861 3.81% 1974 0.00687% 1,112 6.70% 1323 0.00621%198 827 3.66% 2439 0.00848% 1,068 6.44% 1616 0.00759%199 775 3.43% 3016 0.01049% 1,025 6.18% 1980 0.00930%200 744 3.29% 3709 0.01290% 966 5.82% 2458 0.01154%201 702 3.11% 4596 0.01599% 918 5.53% 3036 0.01426%202 666 2.95% 5696 0.01981% 872 5.26% 3784 0.01777%203 633 2.80% 6967 0.02423% 844 5.09% 4701 0.02208%204 606 2.68% 8648 0.03008% 807 4.86% 5790 0.02719%205 580 2.57% 10656 0.03706% 773 4.66% 7167 0.03366%206 557 2.46% 13156 0.04576% 737 4.44% 8854 0.04158%207 535 2.37% 16091 0.05597% 713 4.30% 10887 0.05112%208 514 2.27% 19767 0.06875% 680 4.10% 13367 0.06277%209 490 2.17% 24133 0.08394% 654 3.94% 16402 0.07702%210 476 2.11% 29426 0.10235% 623 3.75% 20112 0.09444%211 459 2.03% 35900 0.12487% 602 3.63% 24825 0.11658%212 446 1.97% 43570 0.15154% 584 3.52% 30400 0.14276%213 431 1.91% 52952 0.18418% 572 3.45% 37092 0.17418%214 411 1.82% 64079 0.22288% 555 3.34% 45249 0.21248%215 395 1.75% 77401 0.26921% 537 3.24% 54972 0.25814%216 384 1.70% 93243 0.32431% 517 3.12% 66612 0.31280%217 367 1.62% 111951 0.38938% 500 3.01% 80637 0.37866%218 361 1.60% 134478 0.46774% 485 2.92% 97395 0.45736%219 347 1.53% 161406 0.56140% 475 2.86% 117063 0.54972%220 332 1.47% 193124 0.67172% 466 2.81% 140581 0.66015%221 321 1.42% 231119 0.80387% 454 2.74% 168553 0.79151%222 306 1.35% 275408 0.95792% 436 2.63% 201538 0.94640%223 300 1.33% 328467 1.14246% 423 2.55% 240408 1.12893%224 293 1.30% 389955 1.35633% 412 2.48% 286155 1.34375%225 283 1.25% 462189 1.60757% 404 2.43% 339745 1.59541%226 268 1.19% 546858 1.90206% 397 2.39% 402262 1.88898%227 266 1.18% 645566 2.24539% 388 2.34% 474906 2.23011%228 260 1.15% 760500 2.64515% 380 2.29% 559271 2.62628%229 251 1.11% 892839 3.10544% 371 2.24% 657121 3.08577%230 243 1.07% 1045666 3.63700% 363 2.19% 769562 3.61378%231 233 1.03% 1220474 4.24501% 355 2.14% 899366 4.22333%232 227 1.00% 1419930 4.93875% 347 2.09% 1046997 4.91659%
Table 49: Hitachi Single-Attempt "Both-Instance" Results

Copyright © 2006 International Biometric Group
September 2006 CBT Round 6 Public Report International Biometric Group Annexes – 81
Transactional Results
Same-Day Different-Day
Genuine Transactions Impostor Transactions Genuine Transactions Impostor TransactionsHitachi 3,827 4,856,464 2,807 3,601,195
Table 50: Hitachi Genuine and Impostor Transactions
Same-Day Different-Day
Threshold False Non-Matches T-FNMR # False
Matches T-FMR False Non-Matches T-FNMR # False
Matches T-FMR
160 263 6.87% 0 0.00000% 428 15.25% 0 0.00000%161 241 6.30% 0 0.00000% 384 13.68% 1 0.00003%162 215 5.62% 0 0.00000% 344 12.26% 1 0.00003%163 200 5.23% 0 0.00000% 315 11.22% 2 0.00006%164 180 4.70% 0 0.00000% 288 10.26% 2 0.00006%165 172 4.49% 0 0.00000% 265 9.44% 2 0.00006%166 161 4.21% 0 0.00000% 241 8.59% 2 0.00006%167 146 3.81% 0 0.00000% 217 7.73% 2 0.00006%168 138 3.61% 0 0.00000% 200 7.13% 3 0.00008%169 122 3.19% 0 0.00000% 187 6.66% 5 0.00014%170 107 2.80% 2 0.00004% 170 6.06% 6 0.00017%171 99 2.59% 5 0.00010% 155 5.52% 6 0.00017%172 87 2.27% 5 0.00010% 139 4.95% 6 0.00017%173 73 1.91% 6 0.00012% 129 4.60% 7 0.00019%174 62 1.62% 7 0.00014% 116 4.13% 11 0.00031%175 55 1.44% 10 0.00021% 108 3.85% 12 0.00033%176 52 1.36% 12 0.00025% 100 3.56% 15 0.00042%177 51 1.33% 16 0.00033% 93 3.31% 20 0.00056%178 50 1.31% 20 0.00041% 86 3.06% 21 0.00058%179 47 1.23% 29 0.00060% 84 2.99% 24 0.00067%180 46 1.20% 39 0.00080% 74 2.64% 31 0.00086%181 43 1.12% 46 0.00095% 73 2.60% 36 0.00100%182 42 1.10% 55 0.00113% 70 2.49% 42 0.00117%183 42 1.10% 75 0.00154% 60 2.14% 55 0.00153%184 37 0.97% 95 0.00196% 56 2.00% 69 0.00192%185 34 0.89% 122 0.00251% 52 1.85% 81 0.00225%186 32 0.84% 149 0.00307% 50 1.78% 102 0.00283%187 32 0.84% 176 0.00362% 49 1.75% 124 0.00344%188 31 0.81% 212 0.00437% 43 1.53% 154 0.00428%189 29 0.76% 250 0.00515% 42 1.50% 183 0.00508%190 27 0.71% 310 0.00638% 41 1.46% 222 0.00616%191 26 0.68% 392 0.00807% 41 1.46% 275 0.00764%192 26 0.68% 492 0.01013% 39 1.39% 333 0.00925%193 25 0.65% 605 0.01246% 35 1.25% 411 0.01141%194 25 0.65% 737 0.01518% 33 1.18% 504 0.01400%195 24 0.63% 915 0.01884% 31 1.10% 625 0.01736%196 23 0.60% 1141 0.02349% 30 1.07% 764 0.02122%197 22 0.57% 1436 0.02957% 30 1.07% 928 0.02577%198 22 0.57% 1765 0.03634% 29 1.03% 1145 0.03180%199 21 0.55% 2156 0.04439% 29 1.03% 1417 0.03935%200 21 0.55% 2636 0.05428% 29 1.03% 1763 0.04896%201 18 0.47% 3266 0.06725% 29 1.03% 2185 0.06067%202 18 0.47% 4019 0.08276% 28 1.00% 2689 0.07467%203 17 0.44% 4886 0.10061% 27 0.96% 3321 0.09222%204 16 0.42% 6035 0.12427% 27 0.96% 4089 0.11355%

Copyright © 2006 International Biometric Group
September 2006 CBT Round 6 Public Report International Biometric Group Annexes – 82
Same-Day Different-Day
Threshold False Non-Matches T-FNMR # False
Matches T-FMR False Non-Matches T-FNMR # False
Matches T-FMR
205 15 0.39% 7382 0.15200% 26 0.93% 5013 0.13920%206 15 0.39% 9073 0.18682% 26 0.93% 6122 0.17000%207 14 0.37% 11015 0.22681% 25 0.89% 7436 0.20649%208 14 0.37% 13418 0.27629% 23 0.82% 9086 0.25231%209 14 0.37% 16278 0.33518% 23 0.82% 11073 0.30748%210 13 0.34% 19639 0.40439% 23 0.82% 13585 0.37724%211 12 0.31% 23725 0.48852% 23 0.82% 16588 0.46062%212 12 0.31% 28586 0.58862% 22 0.78% 20073 0.55740%213 12 0.31% 34421 0.70877% 22 0.78% 24265 0.67380%214 12 0.31% 41248 0.84934% 21 0.75% 29386 0.81601%215 12 0.31% 49452 1.01827% 21 0.75% 35443 0.98420%216 12 0.31% 59081 1.21654% 21 0.75% 42553 1.18164%217 12 0.31% 70268 1.44690% 21 0.75% 51068 1.41808%218 12 0.31% 83572 1.72084% 21 0.75% 61049 1.69524%219 12 0.31% 99231 2.04328% 21 0.75% 72625 2.01669%220 12 0.31% 117710 2.42378% 21 0.75% 86325 2.39712%221 12 0.31% 139841 2.87948% 21 0.75% 102514 2.84667%222 12 0.31% 164864 3.39473% 21 0.75% 121362 3.37005%223 12 0.31% 194460 4.00415% 20 0.71% 143163 3.97543%224 12 0.31% 228421 4.70344% 20 0.71% 168212 4.67101%225 12 0.31% 267384 5.50573% 20 0.71% 197047 5.47171%226 12 0.31% 311965 6.42371% 20 0.71% 229868 6.38310%227 12 0.31% 363142 7.47750% 20 0.71% 267110 7.41726%228 12 0.31% 421195 8.67287% 20 0.71% 309788 8.60237%229 12 0.31% 486446 10.01646% 20 0.71% 358120 9.94448%230 12 0.31% 560223 11.53562% 20 0.71% 412192 11.44598%231 12 0.31% 642026 13.22003% 19 0.68% 473097 13.13722%232 12 0.31% 732789 15.08894% 19 0.68% 540121 14.99838%
Table 51: Hitachi Transactional "Both-Instance" Results

Copyright © 2006 International Biometric Group
September 2006 CBT Round 6 Public Report International Biometric Group Annexes – 83
Annex B. Test Management System Interface
The TMS Test Subject Menu Page and Subject Profile provided access to real-time test statistics and schedule status. Figure 20 and Figure 21 show two TMS interfaces.
Figure 20: Test Subject Management Menu The TMS Test Subject Profile Page provided information on each Test Subject's visit(s).
Figure 21: Test Subject Profile Page

Copyright © 2006 International Biometric Group
September 2006 CBT Round 6 Public Report International Biometric Group Annexes – 84
Annex C. Enrollment and Acquisition Application GUIs
Figure 22 through Figure 24 show representative GUIs for each CBT system. With the exception of Hitachi, none of the interfaces were meant to be viewed or utilized by Test Subjects. All systems except Hitachi showed a real-time or post-acquisition image, though Fujitsu’s images were obfuscated. Fujitsu and Hitachi utilized vendor-provided GUIs, while IBG implemented the IrisGuard GUI.
Figure 22: IrisGuard GUI
Figure 23: Fujitsu GUI

Copyright © 2006 International Biometric Group
September 2006 CBT Round 6 Public Report International Biometric Group Annexes – 85
Figure 24: Hitachi GUI

Copyright © 2006 International Biometric Group
September 2006 CBT Round 6 Public Report International Biometric Group Annexes – 86
Annex D. Test Scripts
This annex reproduces scripts and directions used by Test Operators to direct Test Subject interaction with CBT devices. D1 Introductory Narrative Test Operators read the following to Test Subjects prior to testing.
Today you’ll be interacting with different kinds of biometric devices: iris, fingerprint, and face recognition. Each device takes several pictures of iris, fingerprint, or face. This information will be used to study how well these devices can tell people apart. Testing takes about 1 hour, and you’ll be standing for most of this time. I’ll give you instructions on each device. You’ll need to follow these instructions step by step. [[for users with glasses]] For some of the tests, we’ll ask you to take off your glasses. If you have trouble seeing what you need to see, tell me, and we’ll start that device over with your glasses on. [[enter iris enrollment room]] We’ll test the iris devices first then fingerprint and face. For each iris device, you’ll need to open your eyes a bit and try to keep you eye focused on one spot without blinking too much.”
D2 Fujitsu Fujitsu General Instructions
The Test Operator records instances of unusual or unexpected device operations for entry into Test Subject data sheet.
For each transaction, the right and left palm are enrolled separately. The default process is to enroll the right palm then the left palm. If the Test Subject's right hand is damaged, the Test Subject should enroll his left hand. If the order of collection – or the specific palm positions collected – differs from "right palm" then "left palm", note this on the test sheet and immediately enter this information into TMS once you are done with the Test Subject.
The Test Operator should demonstrate proper usage by sitting down at the Test Subject's chair while the Test Subject stands and observes. Then, once proper usage has been demonstrated, the Test Subject should be seated at the Test Subject chair. When the Test Subject makes practice attempts (placing his hand on the reader), the Test Operator should stand and observe the hand placement from different positions (i.e. the Test Operator cannot gauge proper positioning from a seated position).
If the Test Subject is so tall or short that he has difficulty presenting his palm to the device properly, adjust the chair.
Rings should be removed. If the ring cannot be removed, use the alternate hand. If the Test Subject has a tattoo on the target palm, use the alternate hand. If the Test Subject has a bandage on the target hand, use the alternate hand.
If the Test Subject clearly does not understand or is not following instructions, cancel the acquisition, re-instruct, and begin the application again. During enrollment, we err on the side of extra instruction and guidance, even during the attempt and transaction. During recognition, guidance is provided prior to the first transaction but not during the attempt or transaction.
Fujitsu Introductory Narrative This is a vein recognition device. It reads the patterns in your palm to verify your identity. You will place your right and left hands several times to enroll and be recognized by the system. Each presentation will last several seconds. I will instruct you on how to use the device, and the system
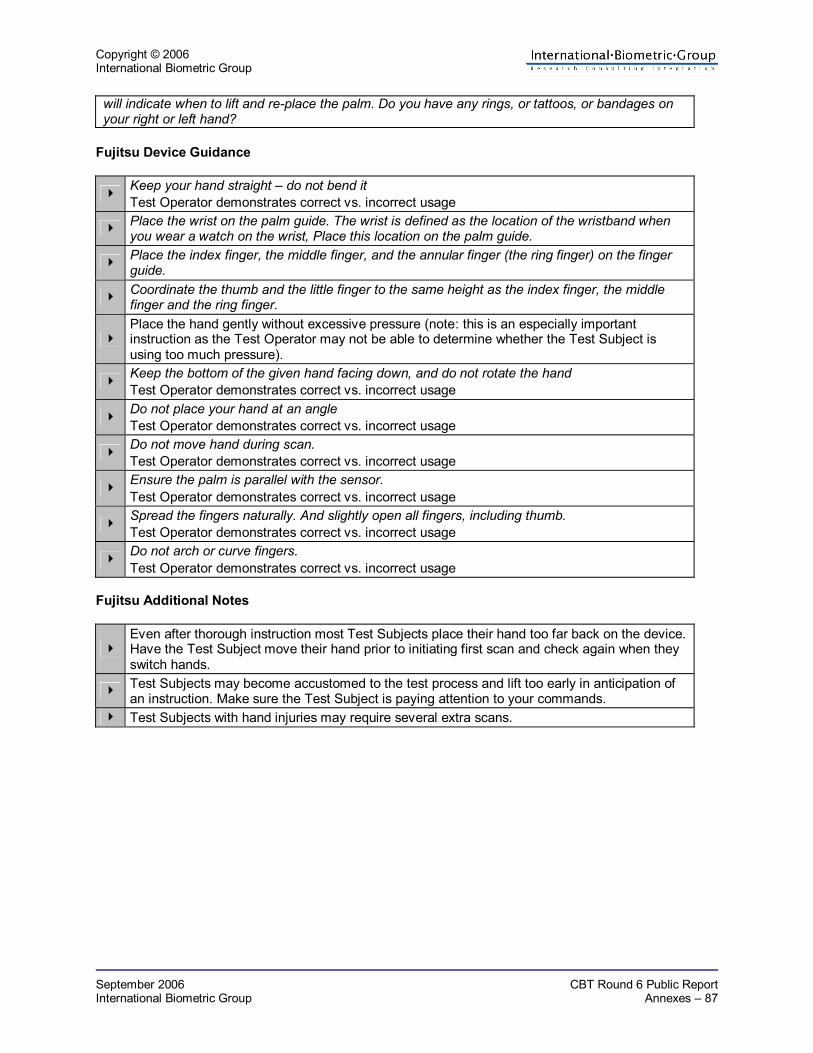
Copyright © 2006 International Biometric Group
September 2006 CBT Round 6 Public Report International Biometric Group Annexes – 87
will indicate when to lift and re-place the palm. Do you have any rings, or tattoos, or bandages on your right or left hand?
Fujitsu Device Guidance
Keep your hand straight – do not bend it Test Operator demonstrates correct vs. incorrect usage
Place the wrist on the palm guide. The wrist is defined as the location of the wristband when you wear a watch on the wrist, Place this location on the palm guide.
Place the index finger, the middle finger, and the annular finger (the ring finger) on the finger guide.
Coordinate the thumb and the little finger to the same height as the index finger, the middle finger and the ring finger.
Place the hand gently without excessive pressure (note: this is an especially important instruction as the Test Operator may not be able to determine whether the Test Subject is using too much pressure).
Keep the bottom of the given hand facing down, and do not rotate the hand Test Operator demonstrates correct vs. incorrect usage
Do not place your hand at an angle Test Operator demonstrates correct vs. incorrect usage
Do not move hand during scan. Test Operator demonstrates correct vs. incorrect usage
Ensure the palm is parallel with the sensor. Test Operator demonstrates correct vs. incorrect usage
Spread the fingers naturally. And slightly open all fingers, including thumb. Test Operator demonstrates correct vs. incorrect usage
Do not arch or curve fingers. Test Operator demonstrates correct vs. incorrect usage
Fujitsu Additional Notes
Even after thorough instruction most Test Subjects place their hand too far back on the device. Have the Test Subject move their hand prior to initiating first scan and check again when they switch hands.
Test Subjects may become accustomed to the test process and lift too early in anticipation of an instruction. Make sure the Test Subject is paying attention to your commands.
Test Subjects with hand injuries may require several extra scans.
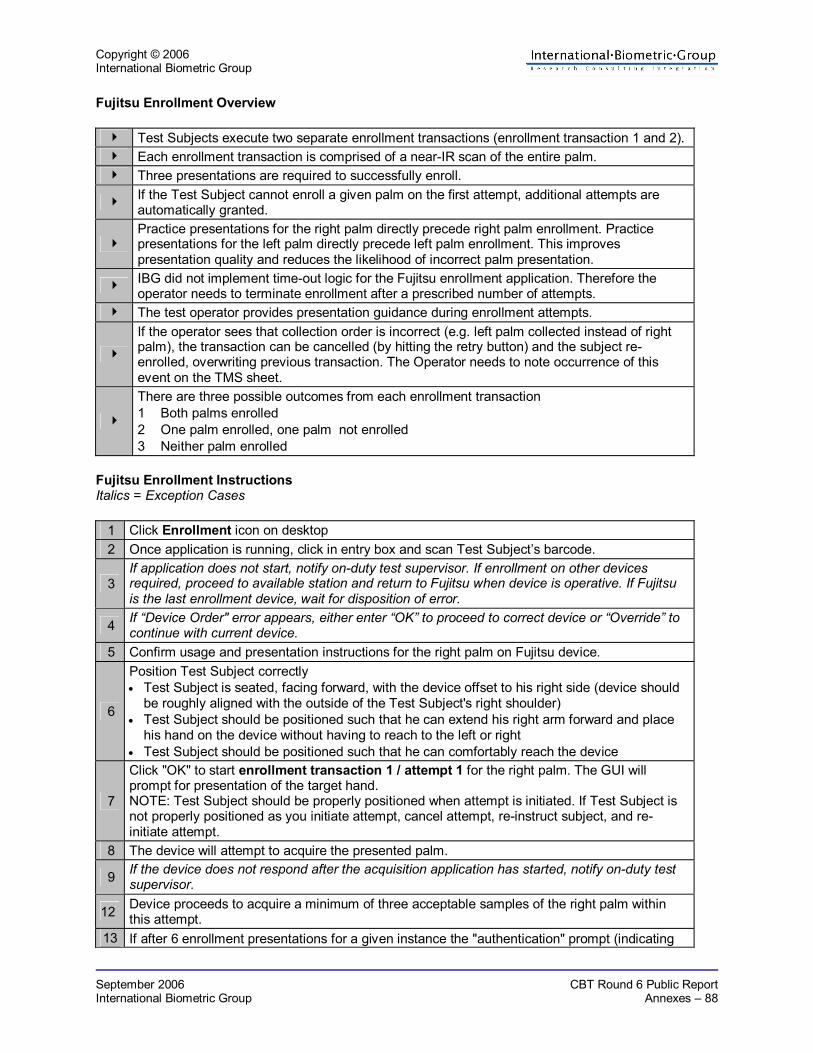
Copyright © 2006 International Biometric Group
September 2006 CBT Round 6 Public Report International Biometric Group Annexes – 88
Fujitsu Enrollment Overview
Test Subjects execute two separate enrollment transactions (enrollment transaction 1 and 2). Each enrollment transaction is comprised of a near-IR scan of the entire palm. Three presentations are required to successfully enroll.
If the Test Subject cannot enroll a given palm on the first attempt, additional attempts are automatically granted.
Practice presentations for the right palm directly precede right palm enrollment. Practice presentations for the left palm directly precede left palm enrollment. This improves presentation quality and reduces the likelihood of incorrect palm presentation.
IBG did not implement time-out logic for the Fujitsu enrollment application. Therefore the operator needs to terminate enrollment after a prescribed number of attempts.
The test operator provides presentation guidance during enrollment attempts.
If the operator sees that collection order is incorrect (e.g. left palm collected instead of right palm), the transaction can be cancelled (by hitting the retry button) and the subject re-enrolled, overwriting previous transaction. The Operator needs to note occurrence of this event on the TMS sheet.
There are three possible outcomes from each enrollment transaction 1 Both palms enrolled 2 One palm enrolled, one palm not enrolled 3 Neither palm enrolled
Fujitsu Enrollment Instructions Italics = Exception Cases
1 Click Enrollment icon on desktop 2 Once application is running, click in entry box and scan Test Subject’s barcode.
3 If application does not start, notify on-duty test supervisor. If enrollment on other devices required, proceed to available station and return to Fujitsu when device is operative. If Fujitsu is the last enrollment device, wait for disposition of error.
4 If “Device Order" error appears, either enter “OK” to proceed to correct device or “Override” to continue with current device.
5 Confirm usage and presentation instructions for the right palm on Fujitsu device.
6
Position Test Subject correctly • Test Subject is seated, facing forward, with the device offset to his right side (device should
be roughly aligned with the outside of the Test Subject's right shoulder) • Test Subject should be positioned such that he can extend his right arm forward and place
his hand on the device without having to reach to the left or right • Test Subject should be positioned such that he can comfortably reach the device
7
Click "OK" to start enrollment transaction 1 / attempt 1 for the right palm. The GUI will prompt for presentation of the target hand. NOTE: Test Subject should be properly positioned when attempt is initiated. If Test Subject is not properly positioned as you initiate attempt, cancel attempt, re-instruct subject, and re-initiate attempt.
8 The device will attempt to acquire the presented palm.
9 If the device does not respond after the acquisition application has started, notify on-duty test supervisor.
12 Device proceeds to acquire a minimum of three acceptable samples of the right palm within this attempt.
13 If after 6 enrollment presentations for a given instance the "authentication" prompt (indicating

Copyright © 2006 International Biometric Group
September 2006 CBT Round 6 Public Report International Biometric Group Annexes – 89
that one additional presentation is required to enroll) is not reached, hit "Retry". This clears the first enrollment presentation and begins a new enrollment transaction for that hand. If after 6 additional presentations of this instance enrollment is still unsuccessful, hit "Cancel" and mark the instance as a failure to enroll.
14 If the palm was not enrolled in enrollment transaction 1 / attempt 1, the application proceeds to enrollment transaction 1 / attempt 2. Click "OK" to initiate enrollment transaction 1 / attempt 2 and repeat steps 8-12.
15 If sufficient samples are acquired, the application will indicate successful enrollment, and the transaction is complete. The application proceeds to enrollment transaction 1 / attempt 1 for the left palm. Go to step 5 to provide usage instructions for the left palm and repeat steps 6-14.
16 With enrollment transaction 1 completed for the left and right palms, the application cycles through steps 6-15, performing enrollment transaction 2.
Fujitsu Recognition Overview
Test Subjects execute three separate recognition transactions (recognition transactions 1, 2, and 3) for both the right and left palms.
Each recognition transaction is comprised of three recognition attempts. A total of 18 palm samples are acquired: (3*3) for the right and left hands.
There are two possible outcomes from each recognition attempt 1 Palm vein successfully acquired 2 Palm vein not successfully acquired Attempts in which a palm vein sample cannot be acquired may be attributable to time-out or to device decision.
If the operator sees that collection order is incorrect (e.g. left palm vein collected instead of right), the transaction can be terminated and the recognition transaction re-executed, overwriting the previous transaction. The Operator needs to note occurrence of this event on the TMS sheet.
Within each recognition transaction, 0, 1, 2, or 3 palm vein samples may be acquired. Fujitsu Recognition Instructions Italics = Exception Cases
1 Click Recognition icon on desktop 2 Once application is running, click in entry box and scan Test Subject’s barcode
3 If application does not start, notify on-duty test supervisor. If recognition on other devices required, proceed to available station and return to Palm vein when device is operative. If Palm vein is the last recognition device, wait for disposition of error.
4 If “Device Order" error appears, either enter “OK” to proceed to correct device or “Override” to continue with current device.
5 Confirm usage and presentation instructions for the right palm.
6
Position Test Subject correctly • Test Subject is seated, facing forward, with the device offset to his right side (device should
be roughly aligned with the outside of the Test Subject's right shoulder) • Test Subject should be positioned such that he can extend his right arm forward and place
his hand on the device without having to reach to the left or right • Test Subject should be positioned such that he can comfortably reach the device
7
Click "OK" to start recognition transaction 1 / attempt 1 for the right palm vein. The operator should say "place" to prompt the subject to action at the same moment that "OK" is clicked. This is the only feedback to be provided. NOTE: If Test Subject is not properly positioned as you initiate attempt, cancel attempt, re-

Copyright © 2006 International Biometric Group
September 2006 CBT Round 6 Public Report International Biometric Group Annexes – 90
instruct subject, and re-initiate attempt. 8 If application does not respond, notify on-duty test supervisor. 9 Device attempts to acquire a right palm sample.
11 Instruct the user to "lift" when user has completed the recognition attempt
13 Press "OK" to acquire right palm samples in recognition transaction 1 / attempt 2. Repeat steps 6-13.
14 If the third attempt is a failure, the application moves to the next transaction.
15 Press "OK" to acquire right palm samples in recognition transaction 1 / attempt 3. Repeat steps 6-13.
16 If a sufficient-quality sample is not acquired, application returns a very brief error flag and prompts the operator to press "OK" to proceed to the next transaction.
17 Repeat steps 6-17 for recognition transaction 2, attempts 1-3. 18 Repeat steps 6-17 for recognition transaction 3, attempts 1-3. 19 With right palm processing complete, left palm capture begins. 20 Repeat steps 5-19 for the left palm.
D3 IrisGuard IrisGuard General Instructions
The Test Operator records instances of unusual or unexpected device operations for entry into Test Subject data sheet.
The device provides audio feedback/instructions to the Test Subject; laptop sounds must be audible.
For each Test Subject, both the left and right irises are enrolled. In each enrollment transaction, the left iris is enrolled, then the right iris. Two separate enrollment transactions are executed.
For recognition, three left iris samples are acquired in each of three transactions, such that a total of up to 9 left iris samples are acquired. Then three right samples are acquired for each of three transactions, such that a total of up to 9 right iris samples are acquired.
The status box in the middle of the application will indicate which iris, which transaction, and which attempt you are currently engaged in.
If the Test Subject has glasses, these should be removed for enrollment. If a Test Subject cannot see his iris in the mirror during enrollment after having removed his glasses, the transaction should be terminated and reinitiated with glasses on. Recognition sample capture can take place with glasses on. Note whether the Test Subject is an eyeglass wearer and whether eyeglasses were worn during enrollment and/or verification.
The camera and chair need to be adjusted so that the Test Subject can look directly at the mirror. The Test Subject's eyes should be not be looking "up" or "down" at the camera, although the Test Subject's eyes may be higher than the camera.
Each Test Subject should be seated comfortably in the chair with their hands on their lap or at their sides. Test Subjects should be notified that all contact with the table should be avoided to ensure minimal camera wobble. Test Operators should also avoid unnecessary contact with the table while the camera is live.
If the Test Subject clearly does not understand or is not following instructions, cancel the acquisition, re-instruct, and begin the application again. During enrollment, we err on the side of extra instruction and guidance, even during the transaction. During recognition, guidance is provided prior to interaction but not during the transaction.

Copyright © 2006 International Biometric Group
September 2006 CBT Round 6 Public Report International Biometric Group Annexes – 91
IrisGuard Introductory Narrative This is an iris recognition device. It reads your eye patterns to verify your identity. You'll look at the reflection of your eye in a mirror within the device. The device will enroll and recognize your iris over the course of multiple transactions. On my direction, you will alternate between the left and right eyes. I will instruct you on how to use the device. The system makes one sound when you are positioned correctly and another sound when it is taking a picture.
IrisGuard Device Guidance The following instructions are provided to the Test Subject prior to device usage.
Look directly at your eye in the mirror – do not turn your head. Test Operator demonstrates correct vs. incorrect usage
Keep your eye open wide. To keep from squinting, you may need to cover (but not close) your opposite eye with your hand while keeping both eyes open Test Operator demonstrates covering alternate eye
You can start from a distance of roughly six inches to have the iris acquired; a voice command will further instruct you depending on the distance you are away from the device for proper iris acquisition. Test Operator demonstrates correct usage
The camera will verbally instruct you to “please look into the mirror.” Make sure the Test Subject understands that all he/she is required to do is look directly forward into the mirror (not move forward into it).
The IrisGuard device will verbally instruct you to “move forward” or “move back” a little from the device (please keep eye wide open and as centered as possible during this procedure). Test Operator demonstrates correct usage
When the camera acquires a successful picture, it will verbally “thank you for your cooperation.” IrisGuard Enrollment Overview
Test Subjects execute two separate enrollment transactions (enrollment transaction 1 and 2). Each enrollment transaction is comprised of enrollment of both the left and right irises. A minimum of 8 presentations is required for each iris to successfully enroll.
The Test Subject should be comfortable locating his left iris then moving to the right iris and vice versa. You should not proceed to the enrollment application until the Test Subject can consistently move into range and have his iris acquired.
The Test Operator is responsible for providing presentation guidance during enrollment attempts.
If the operator sees that collection order is incorrect (e.g. left iris collected instead of right), the transaction can be terminated and the subject re-enrolled, overwriting previous transaction. The Operator needs to note occurrence of this event on the TMS sheet.
There are three possible outcomes from each enrollment transaction 1 Both irises enrolled 2 One iris enrolled, one iris not enrolled 3 Neither irises enrolled
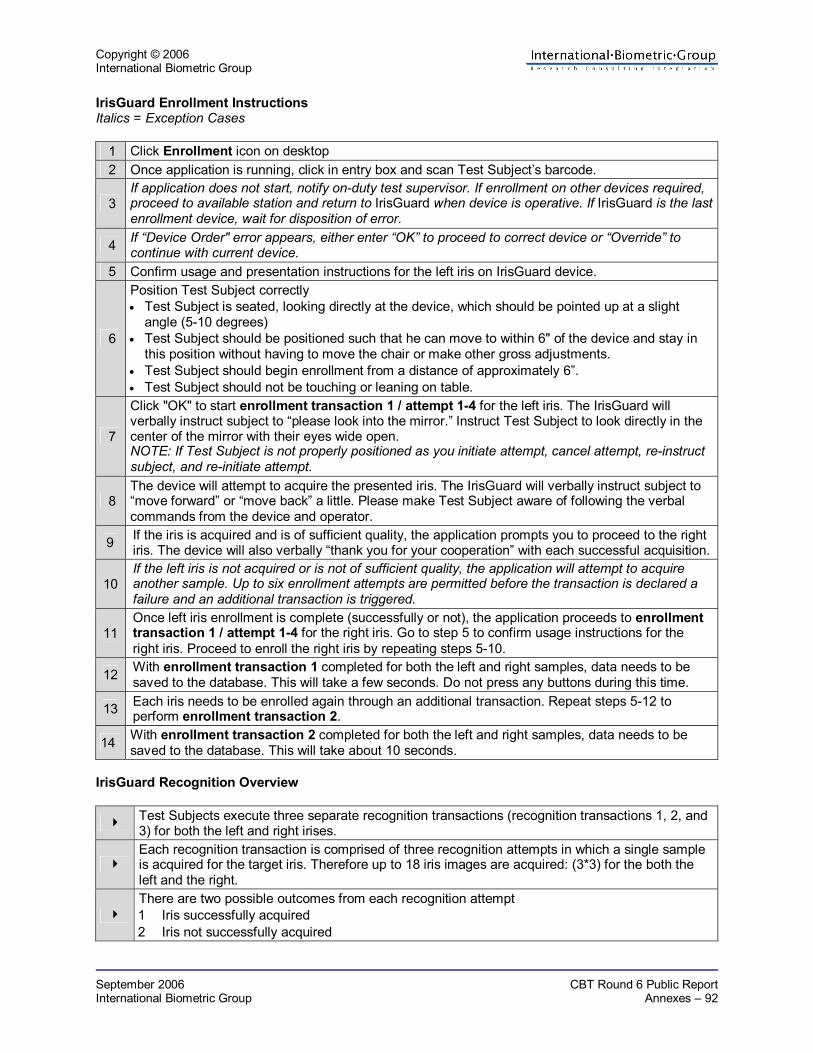
Copyright © 2006 International Biometric Group
September 2006 CBT Round 6 Public Report International Biometric Group Annexes – 92
IrisGuard Enrollment Instructions Italics = Exception Cases
1 Click Enrollment icon on desktop 2 Once application is running, click in entry box and scan Test Subject’s barcode.
3 If application does not start, notify on-duty test supervisor. If enrollment on other devices required, proceed to available station and return to IrisGuard when device is operative. If IrisGuard is the last enrollment device, wait for disposition of error.
4 If “Device Order" error appears, either enter “OK” to proceed to correct device or “Override” to continue with current device.
5 Confirm usage and presentation instructions for the left iris on IrisGuard device.
6
Position Test Subject correctly • Test Subject is seated, looking directly at the device, which should be pointed up at a slight
angle (5-10 degrees) • Test Subject should be positioned such that he can move to within 6" of the device and stay in
this position without having to move the chair or make other gross adjustments. • Test Subject should begin enrollment from a distance of approximately 6”. • Test Subject should not be touching or leaning on table.
7
Click "OK" to start enrollment transaction 1 / attempt 1-4 for the left iris. The IrisGuard will verbally instruct subject to “please look into the mirror.” Instruct Test Subject to look directly in the center of the mirror with their eyes wide open. NOTE: If Test Subject is not properly positioned as you initiate attempt, cancel attempt, re-instruct subject, and re-initiate attempt.
8 The device will attempt to acquire the presented iris. The IrisGuard will verbally instruct subject to “move forward” or “move back” a little. Please make Test Subject aware of following the verbal commands from the device and operator.
9 If the iris is acquired and is of sufficient quality, the application prompts you to proceed to the right iris. The device will also verbally “thank you for your cooperation” with each successful acquisition.
10 If the left iris is not acquired or is not of sufficient quality, the application will attempt to acquire another sample. Up to six enrollment attempts are permitted before the transaction is declared a failure and an additional transaction is triggered.
11 Once left iris enrollment is complete (successfully or not), the application proceeds to enrollment transaction 1 / attempt 1-4 for the right iris. Go to step 5 to confirm usage instructions for the right iris. Proceed to enroll the right iris by repeating steps 5-10.
12 With enrollment transaction 1 completed for both the left and right samples, data needs to be saved to the database. This will take a few seconds. Do not press any buttons during this time.
13 Each iris needs to be enrolled again through an additional transaction. Repeat steps 5-12 to perform enrollment transaction 2.
14 With enrollment transaction 2 completed for both the left and right samples, data needs to be saved to the database. This will take about 10 seconds.
IrisGuard Recognition Overview
Test Subjects execute three separate recognition transactions (recognition transactions 1, 2, and 3) for both the left and right irises.
Each recognition transaction is comprised of three recognition attempts in which a single sample is acquired for the target iris. Therefore up to 18 iris images are acquired: (3*3) for the both the left and the right.
There are two possible outcomes from each recognition attempt 1 Iris successfully acquired 2 Iris not successfully acquired
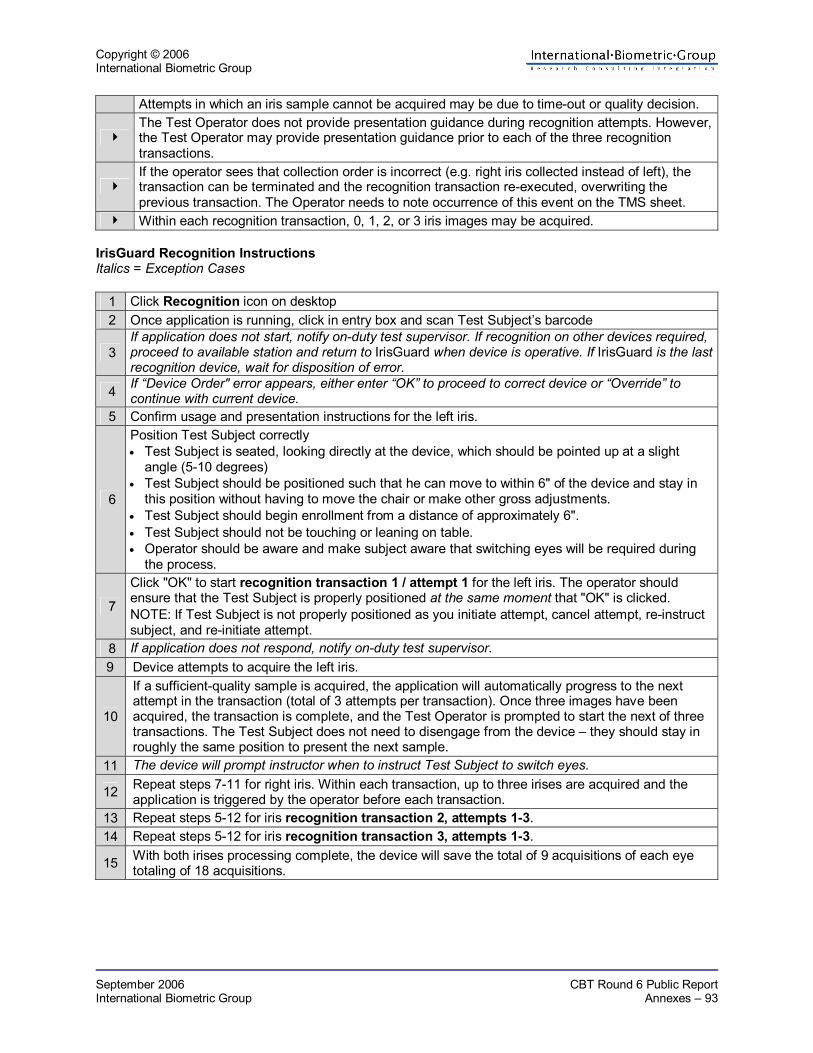
Copyright © 2006 International Biometric Group
September 2006 CBT Round 6 Public Report International Biometric Group Annexes – 93
Attempts in which an iris sample cannot be acquired may be due to time-out or quality decision.
The Test Operator does not provide presentation guidance during recognition attempts. However, the Test Operator may provide presentation guidance prior to each of the three recognition transactions.
If the operator sees that collection order is incorrect (e.g. right iris collected instead of left), the transaction can be terminated and the recognition transaction re-executed, overwriting the previous transaction. The Operator needs to note occurrence of this event on the TMS sheet.
Within each recognition transaction, 0, 1, 2, or 3 iris images may be acquired. IrisGuard Recognition Instructions Italics = Exception Cases
1 Click Recognition icon on desktop 2 Once application is running, click in entry box and scan Test Subject’s barcode
3 If application does not start, notify on-duty test supervisor. If recognition on other devices required, proceed to available station and return to IrisGuard when device is operative. If IrisGuard is the last recognition device, wait for disposition of error.
4 If “Device Order" error appears, either enter “OK” to proceed to correct device or “Override” to continue with current device.
5 Confirm usage and presentation instructions for the left iris.
6
Position Test Subject correctly • Test Subject is seated, looking directly at the device, which should be pointed up at a slight
angle (5-10 degrees) • Test Subject should be positioned such that he can move to within 6" of the device and stay in
this position without having to move the chair or make other gross adjustments. • Test Subject should begin enrollment from a distance of approximately 6". • Test Subject should not be touching or leaning on table. • Operator should be aware and make subject aware that switching eyes will be required during
the process.
7
Click "OK" to start recognition transaction 1 / attempt 1 for the left iris. The operator should ensure that the Test Subject is properly positioned at the same moment that "OK" is clicked. NOTE: If Test Subject is not properly positioned as you initiate attempt, cancel attempt, re-instruct subject, and re-initiate attempt.
8 If application does not respond, notify on-duty test supervisor. 9 Device attempts to acquire the left iris.
10
If a sufficient-quality sample is acquired, the application will automatically progress to the next attempt in the transaction (total of 3 attempts per transaction). Once three images have been acquired, the transaction is complete, and the Test Operator is prompted to start the next of three transactions. The Test Subject does not need to disengage from the device – they should stay in roughly the same position to present the next sample.
11 The device will prompt instructor when to instruct Test Subject to switch eyes.
12 Repeat steps 7-11 for right iris. Within each transaction, up to three irises are acquired and the application is triggered by the operator before each transaction.
13 Repeat steps 5-12 for iris recognition transaction 2, attempts 1-3. 14 Repeat steps 5-12 for iris recognition transaction 3, attempts 1-3.
15 With both irises processing complete, the device will save the total of 9 acquisitions of each eye totaling of 18 acquisitions.

Copyright © 2006 International Biometric Group
September 2006 CBT Round 6 Public Report International Biometric Group Annexes – 94
D4 Hitachi Hitachi General Instructions
The Test Operator records instances of unusual or unexpected device operations for entry into Test Subject data sheet.
The device provides feedback to the Test Subject through the PC. The Test Subject should be positioned such that he or she can easily see the monitor (this can be done by positioning the monitor such that the Test Subject can see it). Ensure that the Test Subject is positioned correctly relative to the device.
For each transaction, the middle and index fingers are enrolled separately. The default process is to enroll the right middle first, then the right index. If the Test Subject's right index finger, right middle finger, or right hand is damaged, the Test Subject should enroll his left middle then left index fingers. If the order of collection – or the specific finger positions collected – differ from "right middle" then "right index", note this on the test sheet and immediately enter this information into TMS once you are done with the Test Subject.
The Test Operator should demonstrate proper usage by sitting down at the Test Subject's chair while the Test Subject stands and observes. Then, once proper usage has been demonstrated, the Test Subject should be seated at the Test Subject chair. When the Test Subject makes practice attempts (placing his finger on the reader), the Test Operator should stand and observe the finger placement from different positions (i.e. the Test Operator cannot gauge proper positioning from a seated position).
If the Test Subject is so tall or short that he has difficulty presenting his fingerprint to the device properly, adjust the chair.
Rings should be removed. If the ring cannot be removed, use the alternate hand. If the Test Subject has a tattoo on the target finger, use the alternate hand. If the Test Subject has a bandage on the target finger, use the alternate hand.
If the Test Subject clearly does not understand or is not following instructions, cancel the acquisition, re-instruct, and begin the application again. During enrollment, we err on the side of extra instruction and guidance, even during the attempt and transaction. During recognition, guidance is provided prior to the first transaction but not during the attempt or transaction.
Hitachi Introductory Narrative This is a vein recognition device. It reads the patterns in your finger to verify your identity. You will place your right middle and right index fingers several times each in order to enroll and be recognized by the system. Each presentation will last several seconds. I will instruct you on how to use the device, and the system will indicate when to lift and re-place the finger. I will also tell you which finger to present. Do you have any rings, or tattoos, or bandages on your right middle or right index fingers?
Hitachi Device Guidance The following instructions are provided to the Test Subject prior to device usage. The operator has already determined by this point whether the right or left hand should be enrolled based on the presence of bandages or injuries.
Keep your finger straight – do not bend it Test Operator demonstrates correct vs. incorrect usage
The tip of the finger should rest gently against the base of the LED. The recommended method is to place the finger just past the LED and slide the hand back (toward the subject) into place until it rests in the indentation. Test Operator demonstrates correct vs. incorrect usage

Copyright © 2006 International Biometric Group
September 2006 CBT Round 6 Public Report International Biometric Group Annexes – 95
The tip and base of the finger, as well as the palm, will all gently touch the reader Test Operator demonstrates correct vs. incorrect usage
Place the finger in the center of the reader, not to the side Test Operator demonstrates correct vs. incorrect usage
Place the finger gently without excessive pressure (note: this is important, because the Test Operator may not be able to determine whether the Test Subject is using too much pressure).
Keep the bottom of the finger facing down, and do not rotate the finger Test Operator demonstrates correct vs. incorrect usage
Do not place your finger at an angle Test Operator demonstrates correct vs. incorrect usage
Do not place two fingers over the reader Test Operator demonstrates correct vs. incorrect usage
Hold the finger still while it is being read Hitachi Special Notes
Pay special attention to the base of the finger – subjects tend to arch their fingers after several scans and this will stop the device
Make sure the Test Subject knows to lift his or her hand completely off the device between scans (not doing so stalls the device)
People who have calloused hands may have trouble (try switching to less worn fingers)
Test Subjects unfamiliar with the device may apply too much pressure as they believe they are taking a fingerprint or do not understand the nature of the device. (Remind subjects they do not need to press down)
Hitachi Enrollment Overview
Test Subjects execute two separate enrollment transactions (enrollment transaction 1 and 2). Each enrollment transaction is comprised of middle and index finger enrollment attempts. Each enrollment attempt lasts up to 90 seconds for each finger. Four presentations are required to successfully enroll.
If the Test Subject cannot enroll a given finger on the first attempt, additional attempts are automatically granted until the 90-second limit is reached. Most enrollment transactions should be completed within one enrollment attempt.
Practice presentations for the right middle finger directly precede right middle finger enrollment. Practice presentations for the right index finger directly precede right index finger enrollment. This improves presentation quality and reduces the likelihood of incorrect finger presentation.
The Test Operator is responsible for providing presentation guidance during enrollment attempts.
If the application is not responding to an enrollment presentation within 4 seconds (i.e. the messages on the GUI do not change), the finger is not being recognized. Instruct subject to lift and re-place.
If the operator sees that collection order is incorrect (e.g. middle finger collected instead of index), the transaction can be terminated and the subject re-enrolled, overwriting previous transaction. The Operator needs to note occurrence of this event on the TMS sheet.
There are three possible outcomes from each enrollment transaction • Both fingers enrolled • One finger enrolled, one finger not enrolled • Neither fingers enrolled

Copyright © 2006 International Biometric Group
September 2006 CBT Round 6 Public Report International Biometric Group Annexes – 96
Hitachi Enrollment Instructions Italics = Exception Cases 16 Click Enrollment icon on desktop 17 Once application is running, click in entry box and scan Test Subject’s barcode.
18 If application does not start, notify on-duty test supervisor. If enrollment on other devices required, proceed to available station and return to Hitachi when device is operative. If Hitachi is the last enrollment device, wait for disposition of error.
19 If “Device Order" error appears, either enter “OK” to proceed to correct device or “Override” to continue with current device.
20 Confirm usage and presentation instructions for the right middle finger on Hitachi device.
21
Position Test Subject correctly • Test Subject is seated, facing forward, with the device offset to his right side (device should be
roughly aligned with the outside of the Test Subject's right shoulder) • Test Subject should be positioned such that he can extend his right arm forward and place his
fingers on the device without having to reach to the left or right • Test Subject should be positioned such that he can comfortably reach the device • Test Subject should be able to see the monitor by glancing slightly to the left of the positioned
device
22
Click "OK" to start enrollment transaction 1 / attempt 1 for the right middle finger (the first finger). The GUI will prompt for presentation of the target finger. NOTE: Test Subject should be properly positioned when attempt is initiated. If Test Subject is not properly positioned as you initiate attempt, cancel attempt, re-instruct subject, and re-initiate attempt.
23 The device will attempt to acquire the presented finger.
24 If the device does not respond after the acquisition application has started, notify on-duty test supervisor.
25 If the application is not responding to an enrollment presentation within 4 seconds (i.e. the messages on the GUI do not change), the finger is not being recognized. Instruct subject to lift and re-place.
26 A visual indicator (in the form of a green check mark on the GUI) signals that the Test Subject should lift and, if necessary, re-place his finger.
27 Device proceeds to acquire a minimum of four acceptable samples of the right middle finger within this attempt. Three samples are for enrollment, the fourth is for verification.
28 If the finger was not enrolled in enrollment transaction 1 / attempt 1, the application proceeds to enrollment transaction 1 / attempt 2. Click "OK" to initiate enrollment transaction 1 / attempt 2 and repeat steps 8-12.
29
If sufficient samples are acquired, the application will indicate successful enrollment, and the transaction is complete. The application proceeds to enrollment transaction 1 / attempt 1 for the right index finger. Go to step 5 to provide usage instructions for the index finger and repeat steps 5-13.
30
With enrollment transaction 1 completed for both the right middle and right index fingers, the application cycles through steps 7-14, performing enrollment transaction 2. If the left middle and left index were collected in the first transaction, collect left middle and left index in the next enrollment transaction.
Hitachi Recognition Overview
Test Subjects execute three separate recognition transactions (recognition transactions 1, 2, and 3) for both the index and middle fingers.
Each recognition transaction is comprised of three recognition attempts in which a stream of samples is acquired for the target finger. Therefore a total of 18 fingers are acquired: (3*3) for the

Copyright © 2006 International Biometric Group
September 2006 CBT Round 6 Public Report International Biometric Group Annexes – 97
middle and index.
Each recognition attempt requires approximately 14 seconds from the point of initial finger acquisition. If the finger is not acquired, the transaction times out within 30 seconds.
If the application is not responding to a presentation within 4 seconds (i.e. the messages on the GUI do not change), the finger is not being recognized. Instruct subject to lift and re-place.
There are two possible outcomes from each recognition attempt • Finger successfully acquired • Finger not successfully acquired
Attempts in which a finger sample cannot be acquired may be attributable to time-out or to device decision.
If the operator sees that collection order is incorrect (e.g. middle finger collected instead of index), the transaction can be terminated and the recognition transaction re-executed, overwriting the previous transaction. The Operator needs to note occurrence of this event on the TMS sheet.
Within each recognition transaction, 0, 1, 2, or 3 fingers images may be acquired. Hitachi Recognition Instructions Italics = Exception Cases
1 Click Recognition icon on desktop 2 Once application is running, click in entry box and scan Test Subject’s barcode
3 If application does not start, notify on-duty test supervisor. If recognition on other devices required, proceed to available station and return to Hitachi when device is operative. If Hitachi is the last recognition device, wait for disposition of error.
4 If “Device Order" error appears, either enter “OK” to proceed to correct device or “Override” to continue with current device.
5 Confirm usage and presentation instructions for the right middle finger.
6
Position Test Subject correctly • Test Subject is seated, facing forward, with the device offset to his right side (device should be
roughly aligned with the outside of the Test Subject's right shoulder) • Test Subject should be positioned such that he can extend his right arm forward and place his
fingers on the device without having to reach to the left or right • Test Subject should be positioned such that he can comfortably reach the device • Test Subject should be able to see the monitor by glancing slightly to the left of the positioned
device
7
Click "OK" to start recognition transaction 1 / attempt 1 for the right middle finger. The operator should say "place" to prompt the subject to action at the same moment that "OK" is clicked. This is the only feedback to be provided. NOTE: If Test Subject is not properly positioned as you initiate attempt, cancel attempt, re-instruct subject, and re-initiate attempt.
8 If application does not respond, notify on-duty test supervisor. 9 Device attempts to acquire a right middle finger sample.
10 A visual indicator (in the form of a green check mark on the GUI) signals that the sample has been acquired successfully and that the Test Subject should lift his finger.
11 Instruct the user to "lift" when user has completed the recognition attempt 12 If a sufficient-quality finger sample is not acquired, application will return a very brief error flag.
13 Press "OK" to acquire right middle finger samples in recognition transaction 1 / attempt 2. Repeat steps 6-13.
14 If the third attempt is a failure, the application moves to the next transaction.
15 Press "OK" to acquire right middle finger samples in recognition transaction 1 / attempt 3. Repeat steps 6-13.
Copyright © 2006 International Biometric Group
September 2006 CBT Round 6 Public Report International Biometric Group Annexes – 98
16 If a sufficient-quality finger sample is not acquired, application returns a very brief error flag and prompts the operator to press "OK" to proceed to the next transaction.
17 Repeat steps 6-17 for recognition transaction 2, attempts 1-3. 18 Repeat steps 6-17 for recognition transaction 3, attempts 1-3. 19 With right middle finger processing complete, right index finger processing begins. 20 Repeat steps 5-19 for the right index finger.
21 If positions other than the primary (right middle and right index) were collected during enrollment, collect these same positions during recognition (this will either be listed in the TMS notes or on the operator manual notes). Note on the TMS which positions were collected.

Copyright © 2006 International Biometric Group
September 2006 CBT Round 6 Public Report International Biometric Group Annexes – 99
Annex E. CBT Functional Requirements
The following information was shared with participating vendors to describe the functional requirements for the Enrollment, Recognition Sample Capture, and Comparison Applications that IBG develops to execute CBT. Overview This document outlines functional requirements for three separate applications that IBG develops to execute Comparative Biometric Testing (CBT): • CBT Enrollment Application • CBT Recognition Sample capture Application • CBT Comparison Application Systems tested in CBT are evaluated through applications that IBG designs, develops, and integrates by means of vendor-provided software development kits. This document provides vendors with an overview of the functions that IBG implements in each of the three applications. Vendors are asked to review this document to facilitate discussions with IBG on integration of their product into the CBT test environment. Modifications to off-the-shelf acquisition and comparison applications may be required for certain test functions. IBG works with vendors to ensure that implementation of the CBT Test Applications is sufficient to enable testing while remaining faithful to native device functions and capabilities. CBT Enrollment Application Overview The CBT Enrollment Application generates enrollment templates for all Test Subjects. Enrollment templates are subsequently used as the basis of offline comparison against recognition samples. IBG analyzes results from the CBT Enrollment Application to generate failure to enroll rates (FTE) and enrollment transaction durations. Although not outlined in the functional requirements below, IBG executes two separate enrollment transactions for each Test Subject. IBG uses externally-linked identifiers to associate the Test Subject's two enrollments. Also, certain modalities and systems allow enrollment of multiple instances, such as two fingerprints or two irises. In this case enrollment requirements are modified to collect enrollments from multiple instances. In most cases no more than two separate instances are enrolled. Functional Requirements The CBT Enrollment Application executes or enables the following functions: 1. Allow operator to enter a 6-digit Test Subject Identifier through a GUI. 2. Allow operator to hit "OK" button to start enrollment transaction. 3. Provide a GUI through which enrollment progress can be monitored, if applicable. 4. Create an enrollment template for the enrollment transaction 5. Save this template to a database on a local or network PC.

Copyright © 2006 International Biometric Group
September 2006 CBT Round 6 Public Report International Biometric Group Annexes – 100
• For some technologies, multiple enrollment templates are created for each Test Subject. IBG
works with vendors to maintain their native template-generation capabilities while still effecting 1:1 offline matching.
• Save enrollment templates to the storage apparatus in a fashion that does not impact
recognition sample capture duration, e.g. subsequent to each transaction.
6. Record the number of presentations required to enroll, IF this number is variable.
• If all enrollment transactions always require the same number of presentations, then this does not need to be recorded.
7. If the device cannot successfully enroll a Test Subject within 90 seconds, the application times out. 8. For Test Subjects unable to enroll successfully (through failure to enroll or time out), automatically
trigger an Additional Effort enrollment transaction.
• The application presents the message "Unable to enroll in first transaction. Please press OK to proceed to Additional Effort enrollment". The operator clicks "OK" and the application proceeds with a second enrollment transaction for this same Test Subject. This Additional Effort enrollment transaction is identical to the standard enrollment transaction.
9. Indicate to the operator that an enrollment transaction is completed and whether enrollment was
completed successfully. 10. Record the duration of each enrollment transaction.
• Enrollment transaction duration is measured from the point at which the operator hits "OK" in
the CBT Enrollment Application to (1) successful creation of an enrollment template; OR (2) attempt time out; OR (3) application declares that the Test Subject cannot enroll.
• If the Test Subject required an Additional Effort transaction to enroll, transaction durations for the standard and the Additional Effort enrollment transactions are recorded separately.
11. Save the image(s) used to create enrollment templates, if applicable.
• Modalities such as fingerprint and face recognition may be more likely to support this capability than modalities such as hand geometry.
12. Record failures to enroll.
• A failure to enroll only occurs once the Test Subject has failed both the standard and the
Additional Effort enrollment transactions. 13. Record enrollment quality statistics for successful enrollments, if available. 14. Record statistics on why enrollment failed, if available. CBT Recognition Sample Capture Application Overview The CBT Recognition Sample Capture Application acquires recognition samples in a format suitable for subsequent offline 1:1 matching against enrollment templates. IBG analyzes recognition sample capture attempts and transactions to generate FTA and transaction durations. A total of nine recognition samples are acquired in the course of three separate recognition sample capture transactions. Actual sample-to-

Copyright © 2006 International Biometric Group
September 2006 CBT Round 6 Public Report International Biometric Group Annexes – 101
template comparison does not occur in this application. When IBG designs CBT Recognition Sample Capture Applications, it typically utilizes a recognize or verify call that (1) activates the acquisition device and (2) acquires one or more samples suitable for matching. Depending on the system, quality check mechanisms may need to be invoked separately. This is typically the most difficult design element, as acquisition device vary in their handling of recognition sample capture. For example, a device may continuously acquire and compare images until a match is found. A device may further invoke different matching algorithms at different points in the acquisition sequence. A more difficult case may be if acquisition parameters change based on feedback from the matching algorithm, e.g. low scores. For devices in which real-time comparison is continuous, the objective is to acquire the image array in a native fashion and to emulate real-time comparison through the CBT Matching Application. Also, certain modalities and systems allow for recognition through multiple instances, such as two fingerprints or two irises. In this case recognition sample capture requirements are modified to collect recognition samples from multiple instances. In most cases no more than two separate characteristics are acquired for recognition. Functional Requirements The CBT Recognition Sample Capture Application executes or enables the following functions: 1. Allow operator to enter a 6-digit Test Subject Identifier through a GUI. 2. Provide a GUI through which recognition sample capture progress can be monitored, if applicable.
• This GUI may or may not be viewed by the Test Subject, depending on the device.
3. Allow operator to click "OK" button to start Recognition Sample Capture Transaction 1, Attempt 1. 4. Acquire and save one recognition sample for Recognition Sample Capture Attempt 1.
• Depending on the system, the data object saved may be one or more of the following: a raw image, a processed image, or a feature sample. The feature sample may or may not be structured in the same fashion as an enrollment template. The minimum requirement is that whatever data object is saved must be capable of being compared in an offline fashion against an enrollment template.
• When available, and to the degree that impact on recognition sample capture duration can be
minimized, both image and feature sample should be saved on each attempt. Modalities such as fingerprint and face recognition may be more likely to support this capability than modalities such as hand geometry.
• For certain types of systems (e.g. face recognition), the sample acquired and saved with each
attempt may be an array of samples (see paragraph 2 under Overview). The sample array resulting from a recognition sample capture attempt is saved in the same fashion as an atomic sample.
5. Save samples to the storage apparatus in a fashion that does not impact recognition sample
capture duration, e.g. subsequent to each transaction. 6. After the first recognition sample is acquired, prompt operator to click "OK" to proceed to
Recognition Sample Capture Attempt 2. 7. After the second recognition sample is acquired, prompt operator to click "OK" to proceed to

Copyright © 2006 International Biometric Group
September 2006 CBT Round 6 Public Report International Biometric Group Annexes – 102
Recognition Sample Capture Attempt 3. 8. If the device cannot acquire a given recognition sample within 30 seconds (measured from the point
at which the operator clicks "OK"), stop the acquisition attempt and declare a time out.
• The application logs the time-out event in order to calculate attempt-level FTA 9. Proceed to the next operator-triggered Recognition Sample Capture. 10. Save each of the three recognition samples that comprise Recognition Sample Capture Transaction
1 with a unique Recognition Sample Identifier based on the 6-digit Test Subject ID, the transaction number (1-3), and the attempt number (1-3).
• For example, Test Subject 012345 may have three recognition samples acquired within
Recognition Sample Capture Transaction 1: 012345-1-1, 012345-1-2, and 012345-1-3. • A null value is saved for cases in which the recognition sample was not successfully acquired
such that each Test Subject has nine database entries. • Recognition Sample Capture Transaction 1 is complete once three recognition samples have
been acquired or once some combination of three successful and failed recognition sample capture attempts have occurred.
• For devices in which different types of data objects are saved with each attempt (e.g. both
images and feature vectors), as well as for devices that save sample arrays as opposed to single samples, further system-specific naming convention elements must be defined.
11. Indicate to the operator that Recognition Sample Capture Transaction 1 is completed. 12. Allow operator to hit "OK" button to start Recognition Sample Capture Transaction 2. 13. Acquire three recognition samples (e.g. images, templates, features) within Recognition Sample
Capture Transaction 2, following steps 10 through 12. 14. Save each of the three recognition samples that comprise Recognition Sample Capture Transaction
2 with a unique Recognition Sample Identifier linked to the Test Subject Identifier.
• For example, Test Subject 012345 may have three recognition samples acquired within Recognition Sample Capture Transaction 1: 012345-2-1, 012345-2-2, and 012345-2-3.
15. Indicate to the operator that Recognition Sample Capture Transaction 2 is completed. 16. Repeat steps 10 through 15 for Recognition Sample Capture Transaction 3, incrementing the
naming convention to indicate that the samples acquired are from the third transaction. 17. Record the duration of each recognition attempt.
• Recognition attempt duration is measured from the point at which the operator hits OK in the
CBT Recognition Sample Capture Application to (1) successful acquisition of a recognition sample; OR (2) application time out; OR (3) application declares that the sample is of insufficient quality to acquire.
• Recognition attempt duration is used to calculate recognition transaction duration.
15. Record instances of failure to enroll declared for reasons other than time-out.

Copyright © 2006 International Biometric Group
September 2006 CBT Round 6 Public Report International Biometric Group Annexes – 103
16. Record reasons for recognition sample capture attempt failure, if available. 17. Record recognition sample quality statistics for successful acquisitions, if available. CBT Comparison Application Overview The CBT Comparison Application generates and records comparison scores from each recognition sample-enrollment template comparison. IBG analyzes genuine and impostor comparison scores from each attempt and transaction to generate FAR-FRR-FNMR-FMR and to generate DETs. FTA and/or FTE may also be generated during matching attempts. In order to conduct the volume of comparisons involved in CBT, it is helpful for recognition sample pre-processing steps to be implemented. For example, features might be extracted from a sample at the point of recognition sample capture. This reduces the computational demand on the CBT Matching Application. Also, to support the matching volumes, recognition samples (or features thereof) are typically loaded into RAM. Functional Requirements The CBT Comparison Application executes or enables the following functions: 1. Compare each recognition sample against each enrollment template.
• Depending on FTE as well as the final number of Test Subjects recruited, approximately 1000-
1500 enrollment templates are collected. • Depending on FTA as well as the final number of Test Subjects recruited, approximately 4500-
6570 recognition samples are collected. 2. Record comparison scores resulting from each comparison along with the Recognition Sample
Identifier and Test Subject Identifier. 3. Write comparison scores to a database.
• IBG exports these scores into its own data analysis application.
4. Record a null value and/or error code for comparisons in which matching of the recognition sample
to the enrollment template failed to generate a comparison score. • Depending on the functions of the CBT Recognition Sample Capture Application, failures to
acquire based on recognition sample quality may not be discernible until this point.
Copyright © 2006 International Biometric Group
September 2006 CBT Round 6 Public Report International Biometric Group Annexes – 104
Annex F. Vendor Comments
The following comments were provided by vendors after having reviewed CBT Round 6 results and final report. Fujitsu Comments Summary Vein pattern recognition technologies are relatively new and are unlike from other existing biometric methods; they also have not been formally tested by a third party organization in the past. Two leading vendors, Fujitsu and Hitachi, participated in the CBT for the first time, and both companies’ products achieved a high level of authentication accuracy. These results indicate that vein pattern authentication is a feasible biometrics technology in the security field. Had either company’s product not performed well, the vein pattern authentication technology itself would not have earned the same level of credibility or confidence. Fujitsu is grateful to the IBG staff for all of the work they have done for this test, especially with regards to the adoption by IBG of new matching-related metrics (including real time data collection and off-line cross comparison) for Round 6 of the CBT. The IBG staff executed these in the limited time remaining, and was able to generate meaningful results. Regrettably, however, we recently found that there are some inconsistencies in the testing conditions for each participant’s product. In particular, there are certain unfavorable conditions set in the testing of Fujitsu product: for example, IBG did not implement feedback call and timeout logic feature in Fujitsu’s testing applications. Despite these unfavorable conditions, our product was able to produce the same level of results (and better results for certain metrics) in comparison to other products. Fujitsu believes that this substantiates the quality of our product. Further details on the discrepancies we found with regards to the testing conditions are provided below. Inconsistencies in the testing conditions 1. Hitachi developed its own CBT test applications (including acquisition and matching software) and provided
these applications to IBG prior to testing. Hitachi made modifications to their applications based on pre-test trials executed at IBG offices several weeks before testing.
2. Fujitsu provided our commercially available SDK together with the standard documentations for this to IBG, and
IBG developed the test applications. The Fujitsu test applications that were developed by IBG did not implement those functions that provide guidance, user feedback, and timeout logic. Had Fujitsu been given the opportunity to develop the test applications, it would have been possible to provide the test applications with these functions implemented.*
*The user feedback function would help users to place their hand in the ideal position (or make adjustments) for optimized image acquisition. As such, if the Fujitsu test applications developed by IBG had implemented the feedback function, it would have had a positive influence on the results of the FTE, ETD, FMR, FMNR, T-FMR, T-FNMR (All of the other participants’ test applications all implemented their respective feedback functions) Enrollment 1. Fujitsu achieved a very low ratio with respect to the FTE, which indicates universal user applicability. This is a
remarkable achievement especially for applications deploying this product for large scale projects in public areas.
2. It is likely that enrollment duration was also influenced by the fact that the Fujitsu test applications developed by
IBG did not implement the feedback function; test samples might not have been able to adjust the hand location as smoothly as anticipated due to the lack of feedback from the application, thus causing a delay in the

Copyright © 2006 International Biometric Group
September 2006 CBT Round 6 Public Report International Biometric Group Annexes – 105
enrollment process. Attempt/Transaction In comparing the significance of attempt and transaction metrics, transaction-level accuracy is considered to be the indicator that is closer to the real-world operational accuracy. Fujitsu scored remarkably high accuracy at the transaction-level. On the other hand, Fujitsu did not score as well as other participants at the attempt-level accuracy. This is due to our sensor device’s industrial design which ensures that users may place their hand over the sensor device without having awkward body postures. Requiring users to interface with the device in the most optimized way (such as by adjusting the industrial design of the product) might increase the attempt-level accuracy. However this might also make users feel uncomfortable with the product interface. From a real-world operational stand point, attempt-level accuracy should increase with each user’s learning curve and should approach transaction-level accuracy. Therefore, Fujitsu believes that attempt-level accuracy is not as significant as an indicator of accuracy as transaction-level accuracy. Same-Day/Different-Day The results show that the differences in authentication accuracies between the “same day” and the “different day” are minimal for Fujitsu’s PalmSecure product in comparison to other participants’ products. This indicates that user interface for the product (namely, holding one’s hand over the sensor) is easy for users to become accustomed to, and that this custom is not easily lost over time. The high level of accuracy which Fujitsu’s product scored across days is very meaningful aspect of this product for real-world operations. Fujitsu is grateful for the opportunity to participate in IBG’s test, and believes that these tests will enable end-users to better understand the merits of various biometric technologies. We also appreciate the opportunity to present our post-test comments on the testing methods as summarized above.
Copyright © 2006 International Biometric Group
September 2006 CBT Round 6 Public Report International Biometric Group Annexes – 106
Hitachi Comments While vascular biometrics technology is relatively new to the US market, the birth of Hitachi's finger vein technology derives back more than 10 years, first starting as a key technology in the Hitachi Central Laboratories. There are more than 30 patents pending or registered internationally issued on finger vein and its applications alone, and the advanced accuracy and usability has been known to exceed the legacy fingerprint and facial biometric technology through its numerous years of R&D invested in its enhancement. Fundamentally, finger vein has its definitive value as using unique information found beneath a human being’s skin. We recognized issues in conventional facial, fingerprint and iris biometrics, as it uses information from the visible surface of a human. These types of information are relatively easy to copy and manipulate, whether there is cooperation from the subject person or not. For that very reason, we believe this is a serious roadblock before it is truly accepted in the mainstream security and authentication industry. It is especially important, as this concern is directly linked to privacy issues, which in some applications, is more important than security. We strongly believe Finger vein is the leading technology to eliminate this concern. The biometric information that is collected from a human finger is found underneath a human being’s skin, completely invisible from the human eye. The information is not affected by any external factors, unlike fingerprint which can be easily modified by injuries, abrasive use, or almost anything you do on a weekend. Facial and iris biometrics face the same challenge, as such can be easily altered or blocked. The high enrollment rate displays the technology’s high availability rate, another important factor for mainstream usage. These have been the reasons Finger vein is extremely popular for banking solutions, especially ATM applications in Japan. ATMs face an extremely challenging audience with wide age brackets, profession and background. Fingerprint, facial and iris all came short to be chosen as the primary technology in this application, as the benchmark results did not scale well enough on the privacy and availability factor for the target audience. The results obtained from the benchmark effort in CBT6 are surprisingly in line with the various benchmarks that had been performed in the banking market in Japan. While a microscopic analysis of each data may not reveal its overall value, looking at the test results from a wider perspective will clearly illustrate how it is a strong candidate for applications where conventional biometric technology may have not performed well enough for real time use. The following are some of the analysis Hitachi has done based on the results shown in this report. We strongly recommend that these analyses are considered and valued when choosing a biometric technology for an application. 1. Significance of the Enrollment Transaction Duration As shown in Table 15 and its corresponding table in the Executive Summary, Hitachi proved its unparalleled performance in terms of the enrollment transaction duration. Although this figure may be dependent on the application as pointed out in the Executive Summary, it is still a very significant benchmark in practice. In the CBT report, the enrollment duration was compared to the time spent for application paperwork for enrollment. We believe such may not be applicable for most applications in the real world. The majority of large-scale, ID management systems already have an electronically stored human database that does not require people further paper works for biometrics enrollment. Regardless, the results indicate that Hitachi’s enrollment procedure is simpler and less ambiguous than other modalities. A quick and failure-free enrollment is always one of the critical requirements especially for professional users who have a large number of people to be enrolled. At this point, the CBT result successfully demonstrated Hitachi’s superiority compared to other modalities. 2. Significance of the Recognition Attempt Duration

Copyright © 2006 International Biometric Group
September 2006 CBT Round 6 Public Report International Biometric Group Annexes – 107
Table 23 and its corresponding table in the Executive Summary clearly illustrate Hitachi’s advantage in the recognition attempt duration. The difference between Hitachi’s performance and others are as much as four seconds per attempt, which makes even larger difference in the effectiveness of 1:N matching process, particularly when the number of templates N is large. In CBT-round 6, each vendor’s 1:N matching performance was not assessed, however, it is obvious that the recognition attempt duration is largely responsible for the operational throughput of the entire system. It is needless to mention that this result implies Hitachi’s superiority in 1:N matching time to others. 3. High performance in enrollment and sample data acquiring rate. Hitachi showed extremely high performance in acquiring enrollment and sample data compared to other systems. This is very important, especially when it is applied to the wide range of population in the mass-market. It is matter of course that devices with high FTE tend to achieve better performance as those devices exclude unwanted patterns beforehand. Hitachi's device, however, demonstrated very low FTEs and at the same time achieved significantly high performance in terms of FMR and FNMR. This means that Hitachi's device may possibly be the preferred choice for large-scale systems requiring a wide range of people to be enrolled. It is also important to note that these results are quite identical to the benchmarks done in Japan and Asian countries. This indicates, that racial profiles have no affect to any of the benchmark results. This is another advantage of deploying biometric information underneath the skin instead of the surface. 4. Accuracy results The result was reasonable under such a hard circumstance that the matching process was offline and no guidance was provided during transaction. As shown in Table 29, 30 and their corresponding tables in the Executive Summary, Hitachi’s performance of the Same-Day is the best of all the systems. Different-Day T-FNMR of both-instance is also very competitive. On the other hand, the accuracy of Different-day is not as good as that of Same-day. The difference of the accuracy of Same-Day and Different-Day mainly comes from the way collecting matching data. The Different-day results are not as good as the Same-day results because users sometimes fail to reproduce the position they placed on the first day. In CBT6, no information that indicates the correctness of finger position is given to the users during image capturing and, therefore, they had no chance to improve the finger position. In the real world, however, the matching process is real-time and more interactive. Matching processes are executed one after another on real-time basis and as soon as being accepted, a message will inform the user that the authentication succeeded. Typically, practical systems have several seconds for matching timeout. If the successful message does not come up within the first 1-2 seconds, the user will notice that the position of the finger is improper and, in many cases, try to re-place the finger spontaneously until the device gives a timeout message. Furthermore, in case the first attempt was rejected, another message will appear in order to prompt the user to improve the finger position. This feedback improves the transactional failure to acquire rate and the accuracy of Same-Day as well as the accuracy of Different-Day. In other words, an adequate GUI would easily improve the acquire rate and the accuracy. Our experiences with these practical implementations prove that the accuracy of Different-day becomes as good as that of Same-day in the real world.
Copyright © 2006 International Biometric Group
September 2006 CBT Round 6 Public Report International Biometric Group Annexes – 108
IrisGuard Comments 1. The reported Enrollment and Recognition Duration figures do not reflect the speed of the IG-H100(R) in any way. The unit's throughput is very high and is capable of acquiring 8 images, pre-qualifying them and selecting the best image in under three seconds using IrisGuard Enrollment/Recognition native calls. We believe that this is the fastest performance on the market today considering the pristine quality it offers. We believe that the software used for enrollment, not supplied by IrisGuard, performs repeated and unnecessary calls to the IG-H100(R) driver when one call is more than enough. The authors of the enrollment/recognition software used in the testing (Iridian) do not understand the fact that the IG-H100(R) driver performs more pre-qualifying checks on more than 40 images in a single call. Their enrollment application makes extra un-needed calls which makes both enrollment and recognition longer. Our own, PrivateID enrollment application performs much faster than reported in these tests. 2. As with all biometric devices, and indeed with any type of a new device a user may acquire, the more frequently the device is used, the easier to use it becomes. We are proud that the IG-H100(R) was well designed for man-machine interaction and presented test subjects with a "pleasant" experience. 3. We are pleased with the reported low FNMR for the IG-H100(R) which is a function of the image acquisition device rather than the Iris recognition algorithm. This attests to the quality or the unit's designs, its proper selection of illumination wavelengths and intensities, camera lens technology, firmware and drivers and most of all, field experience accumulated by IrisGuard in over 4 years of successfully deploying the high-demanding UAE Iris Expellee Tracking system with over 10 million users processed from over 160 nationalities in real-time. However, we strongly feel that the true FNMR are much lower than those reported in this test, this is due to the fact that the testing for the FNMR was using brute-force technique to determine FNMR, which is not reflective of true real-time Iris projects. 4. We are not comfortable with the reported Failure to Acquire/Enroll results in these tests; we feel that due to the extra un-needed calls made to the PrivateID driver by the Iridian enrollment/recognition software, and the extra time it is imposing, the test subject cannot maintain his eyes open long enough. There is no need for the extra calls (see point 1 above) and hence if a proper PrivateID enrollment application is used, the time it takes to capture the iris is considerably shorter and hence the subject will not be tired from waiting with their eyes wide open. The H100 was designed to be very quick in order to reduce the time the person needs to keep their eyes open. It should not take more than 3 seconds to acquire the needed image from any subject under any light condition.

Copyright © 2006 International Biometric Group
September 2006 CBT Round 6 Public Report International Biometric Group Annexes – 109
Annex G. Acronyms
CBT Comparative Biometric Testing
DET Detection Error Tradeoff Curve: DET curves plot T-FMR and T-FNMR across a range of operating points. Performance improves as one moves leftward and downward.
EER Equal Error Rate: The operating point at which the difference between genuine and impostor error rates is closest to zero.
FAR False Accept Rate FMR False Match Rate FNMR False Non Match Rate FRR False Reject Rate
FTA Failure to Acquire Rate: proportion of recognition attempts in which the device is unable to acquire or locate an image or signal of sufficient quality
FTE Failure To Enroll Rate: proportion of enrollment transactions in which the device is unable to complete the enrollment process
GUI Graphical User Interface SDK Software Development Kit T-FMR Transactional False Match Rate T-FNMR Transactional False Non Match Rate
T-FTA Transactional Failure To Acquire Rate: proportion of recognition transactions in which no samples were successfully acquired
TMS Test Management System Table 52: Acronyms

Copyright © 2006 International Biometric Group
September 2006 CBT Round 6 Public Report International Biometric Group Annexes – 110
Annex H. References
International Biometric Performance Testing Standards ISO/IEC 19795-1:2006 Information technology - Biometric Performance Testing and Reporting Part 1: Principles and Framework International Organization for Standardization/International Electrotechnical Commission 01-Mar-2006 United States Biometric Performance Testing Standards ANSI/INCITS 409.1-2005 Information technology - Biometric Performance Testing and Reporting Part 1: Principles and Framework InterNational Committee for Information Technology Standards 25-Oct-2005 ANSI/INCITS 409.2-2005 Information technology - Biometric Performance Testing and Reporting Part 2: Technology Testing and Reporting InterNational Committee for Information Technology Standards 25-Oct-2005 ANSI/INCITS 409.3-2005 Information technology - Biometric Performance Testing and Reporting Part 3: Scenario Testing and Reporting InterNational Committee for Information Technology Standards 25-Oct-2005


![Biometric Standards documents/Standards... · Biometric Profiles Biometric [Application] Profile – a conforming subset or combination of base standards used to effect specific biometric](https://static.fdocuments.us/doc/165x107/5f711372ce578d4ee02aea91/biometric-standards-documentsstandards-biometric-profiles-biometric-application.jpg)