COMPARATIVE ASSESSMENT OF THE MACROBENTHIC …
18
Annals of West University of Timişoara, ser. Biology, 2020, vol. 23 (2), pp.265-282 COMPARATIVE ASSESSMENT OF THE MACROBENTHIC FAUNA DIVERSITY AND HEAVY METALS BIOACCUMULATION IN CANAL, OGBE CREEK AND ABULE-AGEGE CREEK IN AKOKA, LAGOS. NIGERIA Kehinde Abike KEMABONTA 1 *, Omuvwie Rhoda UKPERHINE 2 , Fidelia Ijeoma OSUALA 3 , Ismaila Adeniran ADEROLU 4 1, 2 & 3 Department of Zoology, Faculty of Science, University of Lagos, Akoka, Lagos State, Nigeria. 4 Department of Crop Protection, College of Crop Production and Plant Science, Federal University of Agriculture, Abeokuta Ogun State, Nigeria. *Corresponding author’s e-mail: [email protected] Received 17 January 2020; accepted 24 December 2020 ABSTRACT The comparative study of the heavy metal accumulation and the biodiversity of macro-benthic fauna of Ogbe creek, Abule-agege creek and University of Lagos (Unilag) canal (Second Gate) were investigated. Sampling of macro-invertebrates were carried out in each station using a sweep net, all samples were grouped, identified, counted and recorded. Water, sediment and macro-invertebrate samples were taken and analyzed for heavy metals; Cadmium (Cd), Lead (Pb), Zinc (Zn), Nitrate (NO3 2- ) and Phosphate (PO3 2- ). Unilag canal (second gate) recorded the highest physico-chemical parameters (Temperature 28.110 o C ± 30.870 o C; Turbidity 37.700 ± 21.000 NTU; Total Dissolved Solids 0.135 ± 1.730mg/l; Ph 6.470±7.180 and Salinity 0.120 ±0.200g/kg) while Ogbe creek recorded the highest dissolved oxygen (14.730±46.700mg/L). The highest concentrations of heavy metals were recorded in Unilag canal (second gate) followed by Abule-agege creek, while Ogbe creek recorded the least. Assessment of macro-benthic fauna in these locations recorded a total of 17 taxa and 356 individuals. Ogbe creek had the highest diversity of macro-benthic organisms comprising of 8 taxa mostly Insects, Abule-agege creek recorded 3 taxa (mainly Decapoda) while Unilag canal (second gate) had only Chordates (Poecilia reticulata). The species diversity indicated by Margalef`s and Shaanon weiner`s indices respectively were both highest in November due to the increase in the number of species. The rate of bioaccumulation of heavy metals (Cd, Pb, Zn, Nitrate and Phosphate) in Ogbe creek assessed in Penaeus sp, Gyrinus and Physa sp was higher in Physa sp compared to the others. Zinc had the highest concentration while lead had the least in all the organisms. Given the importance of macro-invertebrates in the aquatic ecosystem food chains, which later serve as food for humans, there is need to protect the quality of these water bodies from direct discharge and run offs form urban settlements. KEY WORDS: physico-chemical properties, biodiversity, macro-benthic fauna, creek, canal, macro-invertebrates, sweep net, heavy metals, bioaccumulation INTRODUCTION 265
Transcript of COMPARATIVE ASSESSMENT OF THE MACROBENTHIC …
Annals of West University of Timişoara, ser. Biology, 2020, vol. 23 (2), pp.265-282
COMPARATIVE ASSESSMENT OF THE MACROBENTHICFAUNA DIVERSITY AND HEAVY METALS
BIOACCUMULATION IN CANAL, OGBE CREEK ANDABULE-AGEGE CREEK IN AKOKA, LAGOS. NIGERIA
Kehinde Abike KEMABONTA 1*, Omuvwie Rhoda UKPERHINE 2, Fidelia IjeomaOSUALA3, Ismaila Adeniran ADEROLU 4
1, 2 & 3 Department of Zoology, Faculty of Science, University of Lagos, Akoka, Lagos State, Nigeria.4Department of Crop Protection, College of Crop Production and Plant Science, Federal University of Agriculture,
Abeokuta Ogun State, Nigeria.*Corresponding author’s e-mail: [email protected]
Received 17 January 2020; accepted 24 December 2020
ABSTRACTThe comparative study of the heavy metal accumulation and the biodiversity ofmacro-benthic fauna of Ogbe creek, Abule-agege creek and University of Lagos(Unilag) canal (Second Gate) were investigated. Sampling of macro-invertebrateswere carried out in each station using a sweep net, all samples were grouped,identified, counted and recorded. Water, sediment and macro-invertebratesamples were taken and analyzed for heavy metals; Cadmium (Cd), Lead (Pb),Zinc (Zn), Nitrate (NO3
2-) and Phosphate (PO32-). Unilag canal (second gate)
recorded the highest physico-chemical parameters (Temperature 28.110oC ±30.870oC; Turbidity 37.700 ± 21.000 NTU; Total Dissolved Solids 0.135 ±1.730mg/l; Ph 6.470±7.180 and Salinity 0.120 ±0.200g/kg) while Ogbe creekrecorded the highest dissolved oxygen (14.730±46.700mg/L). The highestconcentrations of heavy metals were recorded in Unilag canal (second gate)followed by Abule-agege creek, while Ogbe creek recorded the least. Assessmentof macro-benthic fauna in these locations recorded a total of 17 taxa and 356individuals. Ogbe creek had the highest diversity of macro-benthic organismscomprising of 8 taxa mostly Insects, Abule-agege creek recorded 3 taxa (mainlyDecapoda) while Unilag canal (second gate) had only Chordates (Poeciliareticulata). The species diversity indicated by Margalef`s and Shaanon weiner`sindices respectively were both highest in November due to the increase in thenumber of species. The rate of bioaccumulation of heavy metals (Cd, Pb, Zn,Nitrate and Phosphate) in Ogbe creek assessed in Penaeus sp, Gyrinus and Physasp was higher in Physa sp compared to the others. Zinc had the highestconcentration while lead had the least in all the organisms. Given the importanceof macro-invertebrates in the aquatic ecosystem food chains, which later serve asfood for humans, there is need to protect the quality of these water bodies fromdirect discharge and run offs form urban settlements.KEY WORDS: physico-chemical properties, biodiversity, macro-benthic fauna,creek, canal, macro-invertebrates, sweep net, heavy metals, bioaccumulationINTRODUCTION
265
KEMABONTA et al: Comparative assessment of the macrobenthic fauna diversity and heavy metalsbioaccumulation in Canal, Ogbe Creek and Abule-Agege Creek in Akoka, Lagos. Nigeria
Benthic macro-invertebrates are organisms without backbones that inhabitthe bottom substrates (sediments, debris, logs, macrophytes, and filamentous algae)of their habitats, for at least part of their life cycle (Resh and Rosenberg, 1993).Benthic macro-invertebrates include insect larvae, Annelids (Leeches),Oligochaetes (worms), Crustaceans (Crayfish and Shrimp), Molluscs (Clams andMussels) and Gastropods (snails). Insect larvae tend to be the most abundantbenthic macro-invertebrates in freshwater aquatic ecosystems. As benthic macro-invertebrates tend to remain in their original habitat, they are affected by localchanges in water quality. By assessing indicator species, diversity, and functionalgroups of the benthic macro-invertebrate community, it is possible to determinewater quality and how it affects the species abundance.
Water pollution is the contamination of water bodies such as lakes, rivers,oceans, aquifers and groundwater. It occurs when pollutants are directly orindirectly discharged into water bodies without adequate treatment to removeharmful compounds. Pollutants such as trace metals can be bio-concentrated byaquatic biota such as macrophytes, macro-invertebrates and fish (USEPA, 1991).
Bio-concentration measurements refer to the monitoring of uptake andretention of pollutants like trace metals in the organs or tissues of organisms. Bio-concentration takes place if the rate of uptake of pollutants by organisms exceedsthe rate of elimination or excretion (Spacie and Hamelink, 1985). Chemicals bio-concentration results in toxicity, which is an environmental threat to exposedorganism . Hence toxicity occurs along the food chain when the contaminatedspecies or substance is consumed or eaten by an organism on the higher trophiclevel (Heng et al., 2004). These chemicals accumulate in the tissues of aquaticorganisms at concentrations many times higher than concentrations in water andmay be biomagnified in the food chain to levels that cause physiologicalimpairment at higher trophic levels and in human consumers (Raposo et al., 2009).The concentration of these heavy metals in natural environment depends on bothnatural and anthropogenic factors, which may play an important physiological role,but, also may impose a toxic effect on biosensors (Arkadiusz et al., 2007).
Coastal areas and inland waters are affected negatively from humanimpact, agricultural and industrial activities. Anthropogenic activities encouragedischarge of untreated animal waste, such as releases from sewage and septic tanks,run-off from agricultural lands, laundering into streams and rivers. Most waterbodies have been subjected to increasing pollution loads with consequent effect onthe quality and health status. This could result in changes of physico-chemicalproperties of water such as temperature (ToC), dissolved oxygen (DO), alkalinity,biological oxygen demand (BOD), nitrates and heavy metal concentrations (Ajaoand Fagade, 2002). Physicochemical variations in these water properties greatlyinfluence the distribution patterns of aquatic organism especially insects due to
266
Annals of West University of Timişoara, ser. Biology, 2020, vol. 23 (2), pp.265-282
their high sensitive to pollution while others are partially or completely tolerant topollution and environmental disturbances (Bauernfeind & Moog, 2000).
Major anthropogenic sources of aquatic pollutants include, Heavy metalssuch as cadmium (Cd), lead (Pb), zinc (Zn), as well as Phosphate (PO4) and Nitrate(NO3) that are culprits in environmental degradation especially in the coastal areas.Additional sources include Fossil fuel combustion, mining, smelting and solidwaste incineration (Stein et al., 1996).
The presence and quantity of these pollutants can be detected by bio-indicators. A bio-indicator is an organism whose response (typical symptoms ormeasurable) reveals the presence of pollutants by its occurrence. These organisms(or communities of organisms) deliver information on alterations in theenvironment or the quantity of environmental pollutants by changes inphysiologically, chemically or behaviourally patterns. The information can bededuced through the study of the content of certain elements or compounds, theirmorphological or cellular structure, metabolic-biochemical processes, behaviourand Population structure(s) (Market 2007).
Water pollution has a direct influence on aquatic ecosystems and thisindirectly influences human health because macrobenthic fauna are part of theaquatic food chain. Previous studies have been carried out on creeks (Ekpo &Saliu, 2006; Etim, 2012) but not much study has been carried out on the canals.Therefore, the objectives of this study is to compare the physico-chemicalproperties and the biodiversity of macro-benthic fauna of Ogbe creek, Abule-agegecreek and Unilag canal (Second Gate).
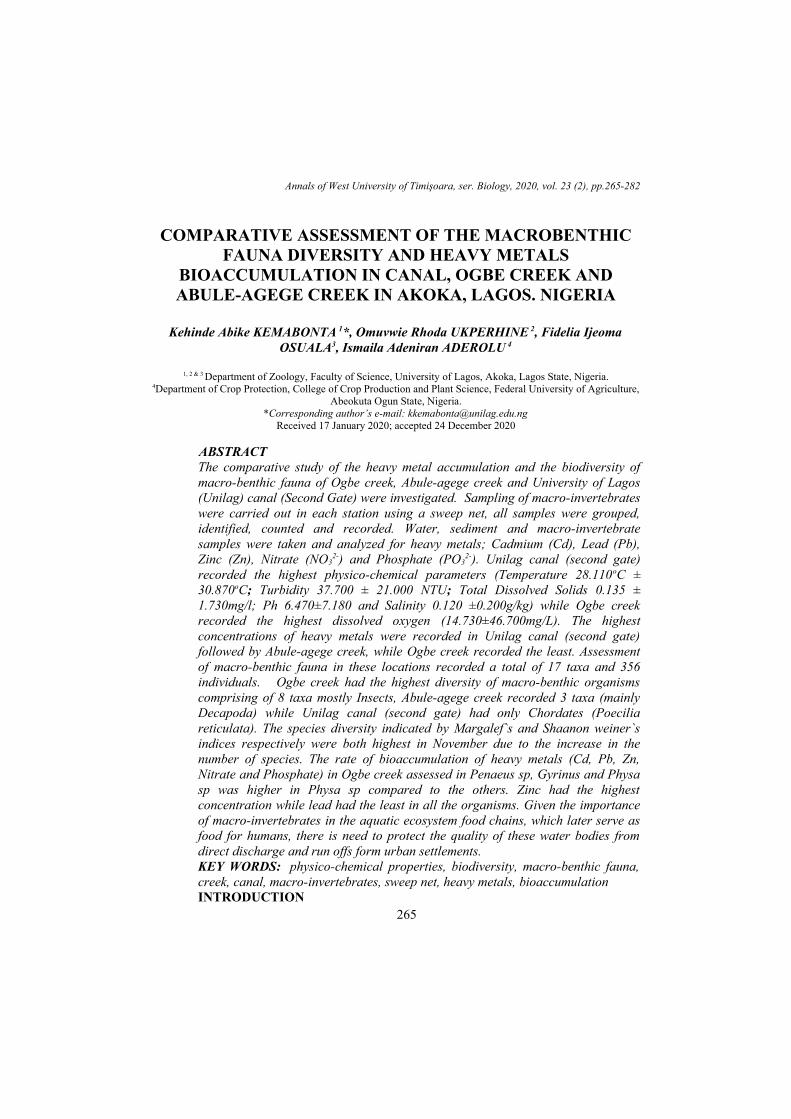
MATERIAL AND METHODDescription of the Study Area. Three (3) sampling stations (I, II & III)
were (Figure1) based on their proximity to structures or human activities that couldpotentially affect water quality and biodiversity.
Station I: Ogbe creek is found on the coast of the University of Lagos,campus, (6° 30° N and longitudes 3° 29’ E) south-west Nigeria, the catchment areais approximately 77,400 m². It is a sluggish no tidal, eutrophic body of water thatdrains into the Lagos Lagoon (Nwankwo & Akinsoji, 1989). The creek experiencesseasonal flooding which introduces a lot of detritus and pollutants from the land. Italso serves as a major drainage channel receiving domestic wastes as well asindustrial effluents from industries in the area (Saliu & Ovuorie, 2006). Thesubstratum is a combination of sand, silt, and clay. The creek harbours manyaquatic plants such as Ipomea aquatica, Pistia stratiotes (Araceae), Azolla pinnata(Azollaceae), Diplazium sammatii (Athyriaceae), Eclipa alba (Asteraceae) andCyperus difformis (Cyperacea) (Ekpo & Saliu, 2006).
267
KEMABONTA et al: Comparative assessment of the macrobenthic fauna diversity and heavy metalsbioaccumulation in Canal, Ogbe Creek and Abule-Agege Creek in Akoka, Lagos. Nigeria
Station II: Abule Abege Creek, located within the University of Lagos,Lagos, Nigeria and is linked to the Lagos Lagoon. The Creek is shallow (≤1m) tidaland sheltered (Saliu & Ovuorie, 2006). It is fed by water from the adjoining LagosLagoon at high tide and at low tide, the water ebbs into the Lagoon. The creekmeanders through a riparian mangrove swamp, which is inundated at high tide andpartially exposed at low tide. Notable riparian flora of the creek includes:Paspalum orbiquilare, Acrotiscum aureum, Phoenix reclinata, Rhizophoraracemosa, Avicenia nitida, Drepanocarpus lunatus and Cyperus articulatus.Notable fauna includes Periopthalmus sp., Balanus pallidus, Chthamalus sp, Ucatangeri, Seserma huzardi, Gryhea gazar, Typanotonus fuscatus var radula andherons that feeds on exposed invertebrates at low tide (Babatunde & Ogunwenmo,2010). The water is murky and turbid, and the substratum is made of clay and mud.
Station III is located at the Second Gate of the University of Lagos, Akokacampus. The water is shallow and slow moving. It receives high amount ofdomestic sewage, runoffs from Car wash and other activities.
Collection of Water and Sediment Samples. Water samples werecollected fortnightly from each sampled stations with 200ml plastic containerswashed with nitric acid to remove any form of contaminants. The sampling periodspanned from October to December. Sampling was usually carried out between thehours of 8:00 am and 12:00 noon. Surface water temperature, pH, dissolvedoxygen, Total dissolved solids, total suspended solids, salinity and biologicaloxygen demand were measured with Horriba (Model DO–5509). Bottom sedimentsamples were collected with a grab at monthly intervals in polythene bags forheavy metals analysis.
Collection of Benthic Samples. Benthic samples were taken using a 0.1m2
Van-veen grab and a sweep net, fortnightly from the study stations from October toDecember, 2014. Each haul of the grab was sieved in the site with a 0.5mm meshsieve and the top portion of the sediment of the first haul at each station waspreserved for sediment analysis. Contents trapped by the net were sorted usingforceps; organisms found were preserved in 70% alcohol. Identification oforganisms was conducted using appropriate keys and works of Mellanby, 1963 andVoshell 2002.
Water and Sediment Analysis. Sediment sample was air-dried in the openlaboratory free from contamination for 72 hrs, by being spread on labeledaluminium foil. The air-dried sediments sample was broken down into small sizeaggregate (powdery form). 5g of the sample was carefully weighed into a clean dry100 ml beaker. Exactly 10ml of concentrated nitric acid (Analar grade) was addedto the sediment in the beaker and heated over a hot plate in a fume cupboard untilthe produced brown fume subsided. The beaker was allowed to cool to near roomtemperature and the mixture was diluted with pure distilled water to twice the
268

Annals of West University of Timişoara, ser. Biology, 2020, vol. 23 (2), pp.265-282
volume. The resulting mixture was then filtered rinsed well and the resultingfiltrate was transferred into 100cm3 standard flask. The volume of the solution inthe standard flask was then made up to 100cm3 and shaken. The resulting solutionwas then aspirated into the flame of Atomic Absorption Spectrophotometer (AAS –Unicam 919 series) using air-acetylene flame for the heavy metals analysis againstsolution of each heavy metal analysed at their respective wave lengths (Milner andWhitesides, 1984).
FIGURE1. University of Lagos Showing the Sampled Stations.
Nitrate and Phosphate Determination. Exactly 10g of sediment samplewas accurately weighed in 100ml beaker 50ml of pure deionised water was addedand stirred gently to breaker the sediment into fine particles. The mixture wasfiltered with 12.0cm Whatman filter paper to obtain a clear solution. The residue inthe filter paper was further rinsed with deionised water and all the filterate
269
KEMABONTA et al: Comparative assessment of the macrobenthic fauna diversity and heavy metalsbioaccumulation in Canal, Ogbe Creek and Abule-Agege Creek in Akoka, Lagos. Nigeria
combined. The volume was made up to 100ml in a standard flask. The clearsolution was used to analyse nitrate and phosphate for their concentrations usingHACH 2500 Spectrophotometer with specific HACH reagents pillows for each ofthe parameters: specific wavelengths was used viz 400nm, 450nm and 890nm fornitrate and phosphate respectively.
Statistical Analysis. Microsoft Excel 2010 was used for graphicalillustrations. Biological indices, Margalef’s index (d); Shannon– Weiner index (H),and Evenness E were used in the calculation of taxa richness, general diversity andevenness determined using PAST software (Green, 1971; Robinson, 1971).Analysis of variance (ANOVA), was used in calculating the mean value of theheavy metals detected in the stations. One- way Analysis of variance and Pearson’scorrelation coefficient were used in the statistical analysis of chemical variables at5% level of significance.
RESULTS AND DISCUSSIONPhysico-Chemical Paramters Results of Water Samples from the
Different Study StationsThe physico-chemical parameters of the study locations from October to
December showed that Station III had the highest temperature (28.110±30.870) inNovember, turbidity and Total Dissolved Solid (TDS) were highest in station IIIand II respectively but lowest in station I.Station II 2 had the highest salinityranging from 0.120 ±0.200 and the lowest pH. Dissolved oxygen was highest inStation I ranging from 12.160±24.530 (Table 1).
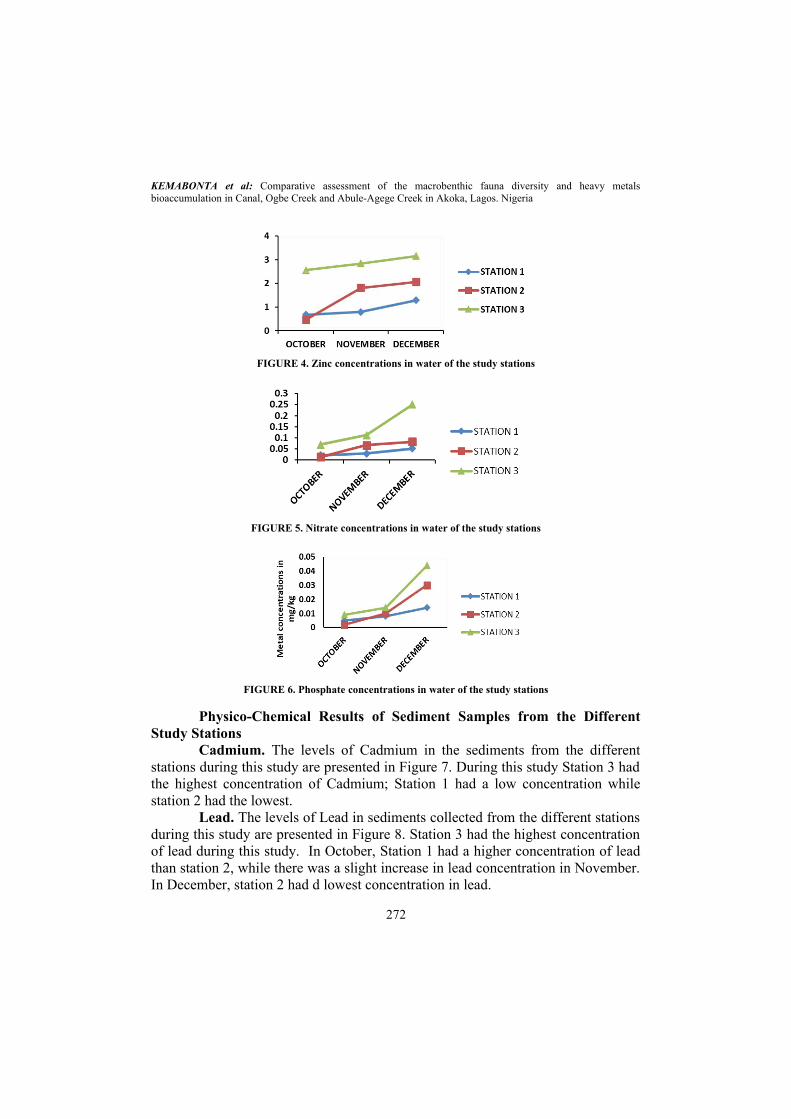
Nitrate. The levels of Nitrate in the water collected from the differentstations during this study are presented in Figure 5. During this study Station IIIrecorded the highest concentrations of nitrate while Station I had the lowest amountof Nitrate (Figure 5).
Phosphate. Station III had the highest concentrations of Phosphate duringthis study. In October Station II had the lowest amount of Phosphate, while inNovember and December Station I had the least amount of Phosphate (Figure 6).
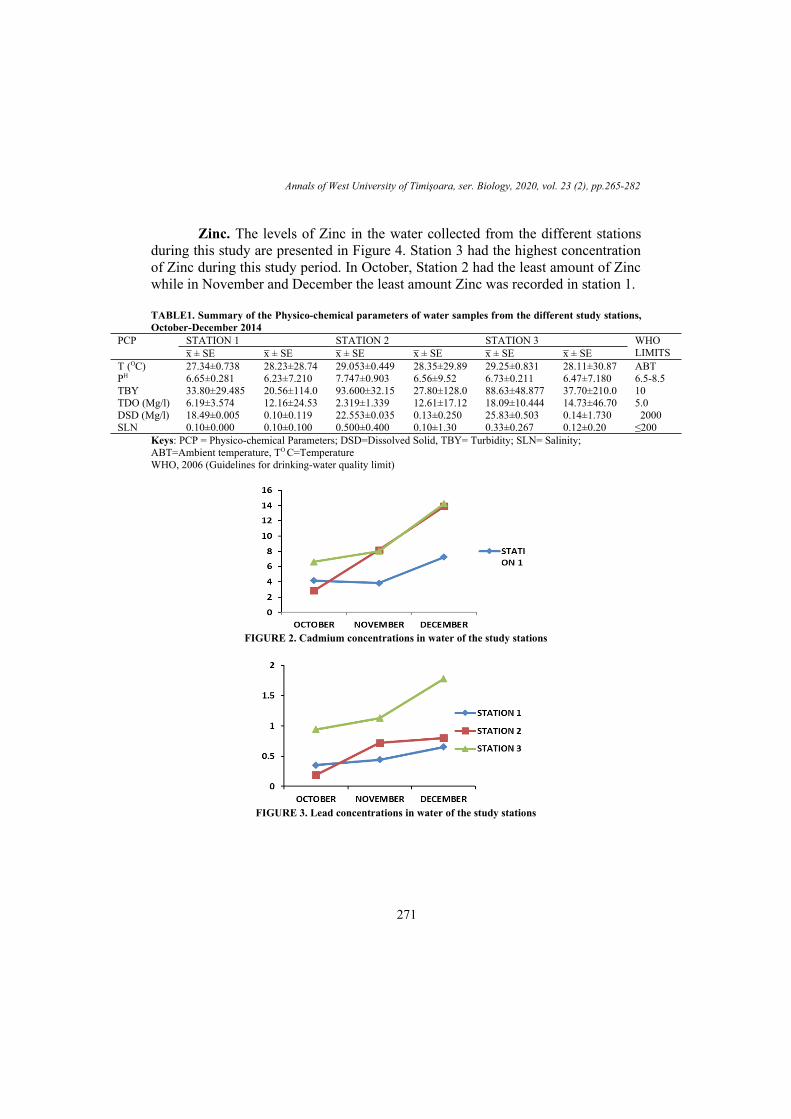
Cadmium. The levels of Cd in water collected from the different stationsduring this study are presented in Figure 2. In October station III had the highestconcentration of Cd, while station I had the least concentration. Station II and IIIhad the highest amount of Cd while station I recorded the least In December, therewas a significant increase in the concentration of Cd in station II (Figure 2)
Lead. The levels of Lead in the water collected from the different stationsduring this study are presented in Figure 3. Station 3 had the highest concentrationlead during the study period. In November, the concentrations of Lead showed aslight increase in all the stations. Station 1 had the lowest concentrations of leadduring the study period.
270
Annals of West University of Timişoara, ser. Biology, 2020, vol. 23 (2), pp.265-282
Zinc. The levels of Zinc in the water collected from the different stationsduring this study are presented in Figure 4. Station 3 had the highest concentrationof Zinc during this study period. In October, Station 2 had the least amount of Zincwhile in November and December the least amount Zinc was recorded in station 1.
TABLE1. Summary of the Physico-chemical parameters of water samples from the different study stations,October-December 2014
PCP STATION 1 STATION 2 STATION 3 WHOLIMITSx̅ ± SE x̅ ± SE x̅ ± SE x̅ ± SE x̅ ± SE x̅ ± SE
T (OC) 27.34±0.738 28.23±28.74 29.053±0.449 28.35±29.89 29.25±0.831 28.11±30.87 ABTPH 6.65±0.281 6.23±7.210 7.747±0.903 6.56±9.52 6.73±0.211 6.47±7.180 6.5-8.5TBY 33.80±29.485 20.56±114.0 93.600±32.15 27.80±128.0 88.63±48.877 37.70±210.0 10TDO (Mg/l) 6.19±3.574 12.16±24.53 2.319±1.339 12.61±17.12 18.09±10.444 14.73±46.70 5.0DSD (Mg/l) 18.49±0.005 0.10±0.119 22.553±0.035 0.13±0.250 25.83±0.503 0.14±1.730 2000SLN 0.10±0.000 0.10±0.100 0.500±0.400 0.10±1.30 0.33±0.267 0.12±0.20 ≤200
Keys: PCP = Physico-chemical Parameters; DSD=Dissolved Solid, TBY= Turbidity; SLN= Salinity; ABT=Ambient temperature, TO C=TemperatureWHO, 2006 (Guidelines for drinking-water quality limit)
FIGURE 2. Cadmium concentrations in water of the study stations
FIGURE 3. Lead concentrations in water of the study stations
271
KEMABONTA et al: Comparative assessment of the macrobenthic fauna diversity and heavy metalsbioaccumulation in Canal, Ogbe Creek and Abule-Agege Creek in Akoka, Lagos. Nigeria
FIGURE 4. Zinc concentrations in water of the study stations
FIGURE 5. Nitrate concentrations in water of the study stations
FIGURE 6. Phosphate concentrations in water of the study stations
Physico-Chemical Results of Sediment Samples from the DifferentStudy Stations
Cadmium. The levels of Cadmium in the sediments from the differentstations during this study are presented in Figure 7. During this study Station 3 hadthe highest concentration of Cadmium; Station 1 had a low concentration whilestation 2 had the lowest.
Lead. The levels of Lead in sediments collected from the different stationsduring this study are presented in Figure 8. Station 3 had the highest concentrationof lead during this study. In October, Station 1 had a higher concentration of leadthan station 2, while there was a slight increase in lead concentration in November.In December, station 2 had d lowest concentration in lead.
272
Annals of West University of Timişoara, ser. Biology, 2020, vol. 23 (2), pp.265-282
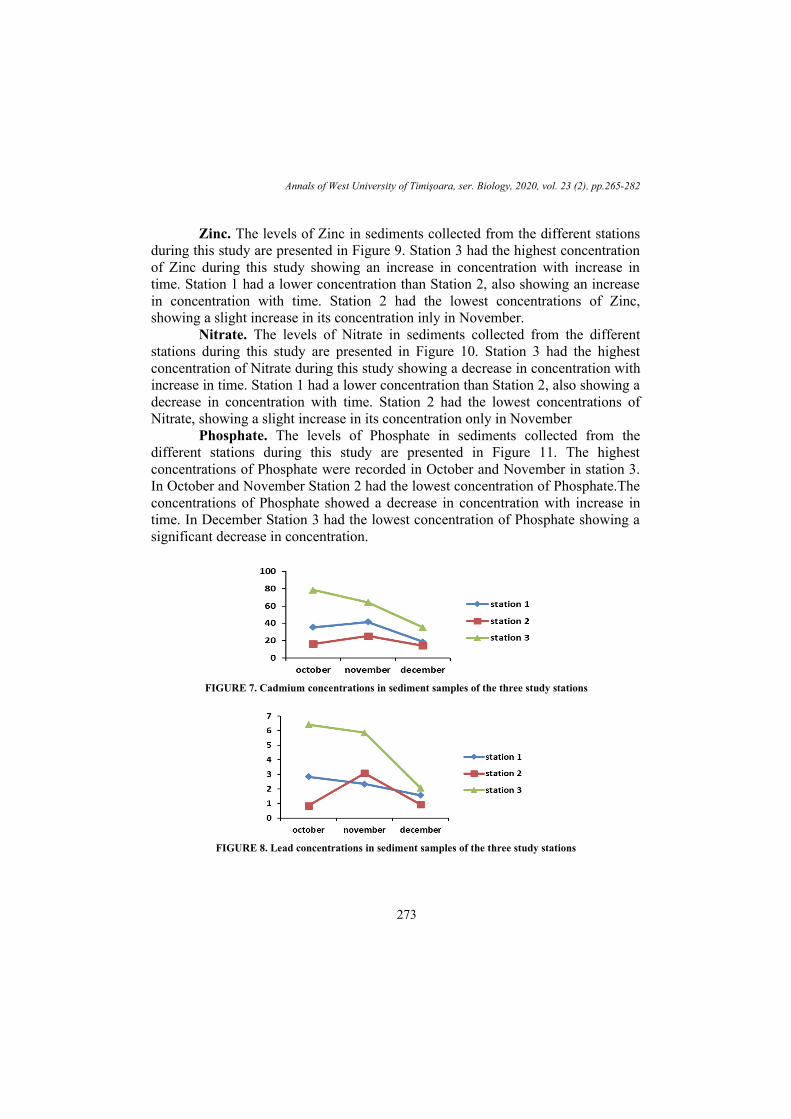
Zinc. The levels of Zinc in sediments collected from the different stationsduring this study are presented in Figure 9. Station 3 had the highest concentrationof Zinc during this study showing an increase in concentration with increase intime. Station 1 had a lower concentration than Station 2, also showing an increasein concentration with time. Station 2 had the lowest concentrations of Zinc,showing a slight increase in its concentration inly in November.
Nitrate. The levels of Nitrate in sediments collected from the differentstations during this study are presented in Figure 10. Station 3 had the highestconcentration of Nitrate during this study showing a decrease in concentration withincrease in time. Station 1 had a lower concentration than Station 2, also showing adecrease in concentration with time. Station 2 had the lowest concentrations ofNitrate, showing a slight increase in its concentration only in November
Phosphate. The levels of Phosphate in sediments collected from thedifferent stations during this study are presented in Figure 11. The highestconcentrations of Phosphate were recorded in October and November in station 3.In October and November Station 2 had the lowest concentration of Phosphate.Theconcentrations of Phosphate showed a decrease in concentration with increase intime. In December Station 3 had the lowest concentration of Phosphate showing asignificant decrease in concentration.
FIGURE 7. Cadmium concentrations in sediment samples of the three study stations
FIGURE 8. Lead concentrations in sediment samples of the three study stations
273
KEMABONTA et al: Comparative assessment of the macrobenthic fauna diversity and heavy metalsbioaccumulation in Canal, Ogbe Creek and Abule-Agege Creek in Akoka, Lagos. Nigeria
FIGURE 9. Zinc concentrations in sediment samples of the three study stations
FIGURE 10. Nitrate concentrations in water samples of the three study stations
FIGURE 11. Phosphate concentrations in water samples of the three study stations
Macrobenthic Invertebrates FaunaSpecies Diversity. A total of 17 macrobenthic taxa comprising 356
individuals include 3 species of Decapoda, 2 species of Odonata, 2 species ofHemiptera, 4 species of Coleoptera 1 species of Diptera, 1 species of spider, 2species of Gastropoda, 1 species of Arachnida and 1 species of Chordata. Theoverall taxa composition, distribution, and abundance of macrobenthicinvertebrates collected during the study period are presented in Table 2. Thenumber of taxa, number of individuals, species diversity and eveness during thisstudy are shown in Table 4. During the study, station I had the highest species
274
Annals of West University of Timişoara, ser. Biology, 2020, vol. 23 (2), pp.265-282
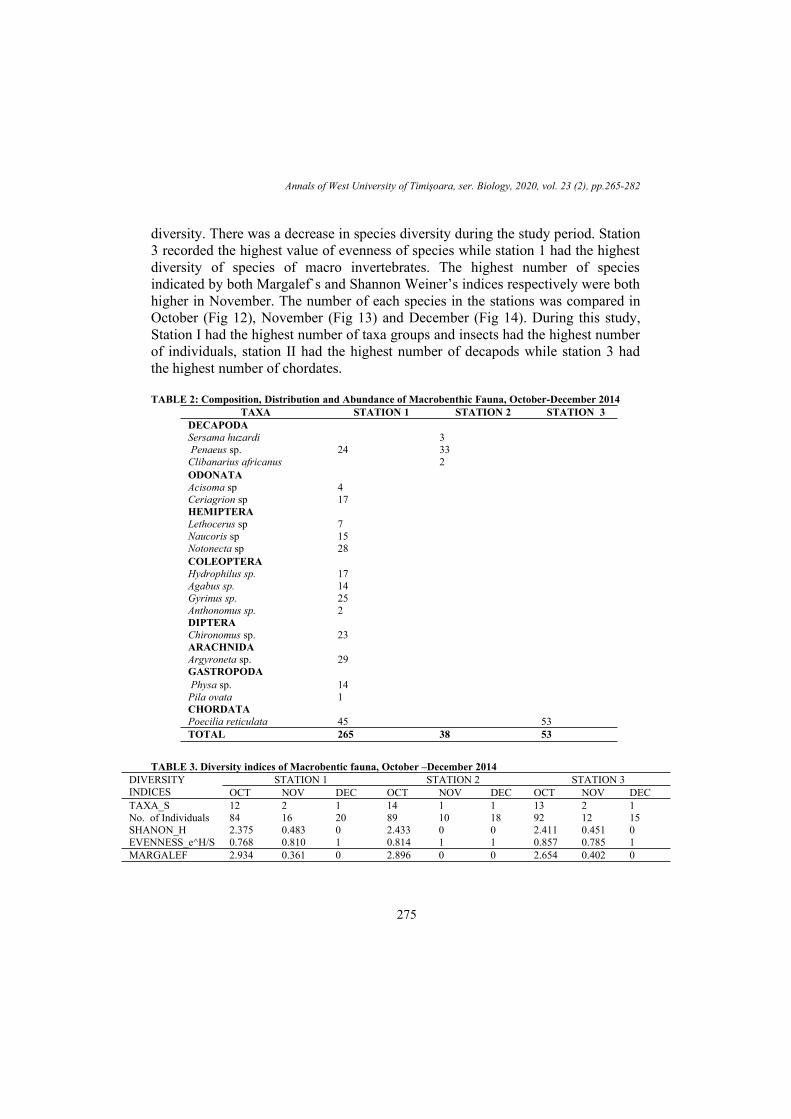
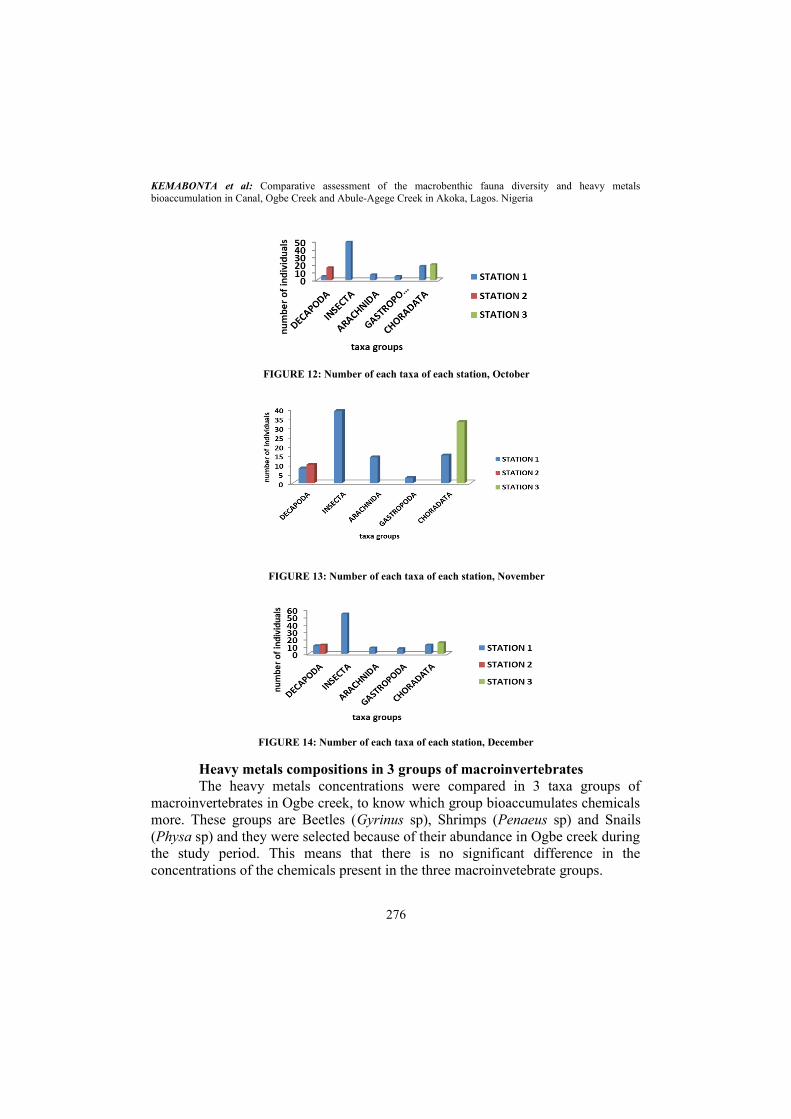
diversity. There was a decrease in species diversity during the study period. Station3 recorded the highest value of evenness of species while station 1 had the highestdiversity of species of macro invertebrates. The highest number of speciesindicated by both Margalef`s and Shannon Weiner’s indices respectively were bothhigher in November. The number of each species in the stations was compared inOctober (Fig 12), November (Fig 13) and December (Fig 14). During this study,Station I had the highest number of taxa groups and insects had the highest numberof individuals, station II had the highest number of decapods while station 3 hadthe highest number of chordates.
TABLE 2: Composition, Distribution and Abundance of Macrobenthic Fauna, October-December 2014TAXA STATION 1 STATION 2 STATION 3
DECAPODA Sersama huzardi 3 Penaeus sp. 24 33Clibanarius africanus 2 ODONATAAcisoma sp 4Ceriagrion sp 17HEMIPTERALethocerus sp 7Naucoris sp 15Notonecta sp 28COLEOPTERAHydrophilus sp. 17Agabus sp. 14Gyrinus sp. 25Anthonomus sp. 2DIPTERAChironomus sp. 23ARACHNIDAArgyroneta sp. 29GASTROPODA Physa sp. 14Pila ovata 1CHORDATAPoecilia reticulata 45 53TOTAL 265 38 53
TABLE 3. Diversity indices of Macrobentic fauna, October –December 2014DIVERSITYINDICES
STATION 1 STATION 2 STATION 3OCT NOV DEC OCT NOV DEC OCT NOV DEC
TAXA_S 12 2 1 14 1 1 13 2 1No. of Individuals 84 16 20 89 10 18 92 12 15SHANON_H 2.375 0.483 0 2.433 0 0 2.411 0.451 0EVENNESS_e^H/S 0.768 0.810 1 0.814 1 1 0.857 0.785 1MARGALEF 2.934 0.361 0 2.896 0 0 2.654 0.402 0
275
KEMABONTA et al: Comparative assessment of the macrobenthic fauna diversity and heavy metalsbioaccumulation in Canal, Ogbe Creek and Abule-Agege Creek in Akoka, Lagos. Nigeria
FIGURE 12: Number of each taxa of each station, October
FIGURE 13: Number of each taxa of each station, November
FIGURE 14: Number of each taxa of each station, December
Heavy metals compositions in 3 groups of macroinvertebratesThe heavy metals concentrations were compared in 3 taxa groups of
macroinvertebrates in Ogbe creek, to know which group bioaccumulates chemicalsmore. These groups are Beetles (Gyrinus sp), Shrimps (Penaeus sp) and Snails(Physa sp) and they were selected because of their abundance in Ogbe creek duringthe study period. This means that there is no significant difference in theconcentrations of the chemicals present in the three macroinvetebrate groups.
276
Annals of West University of Timişoara, ser. Biology, 2020, vol. 23 (2), pp.265-282
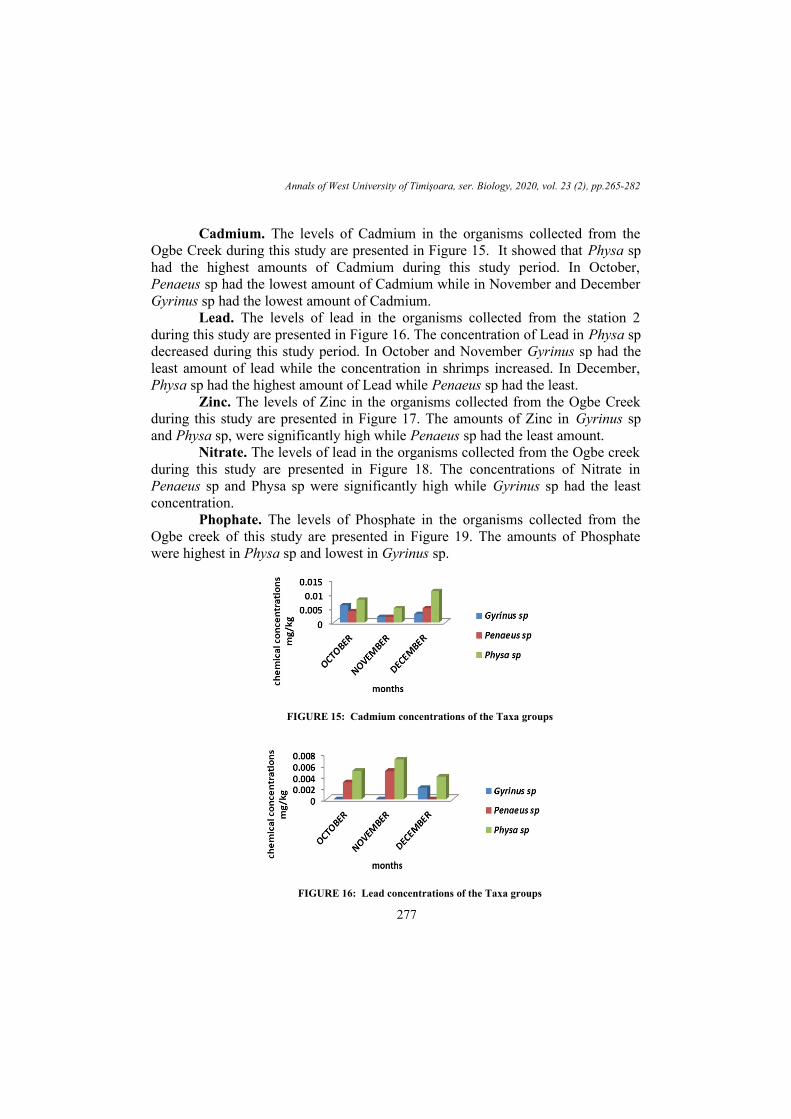
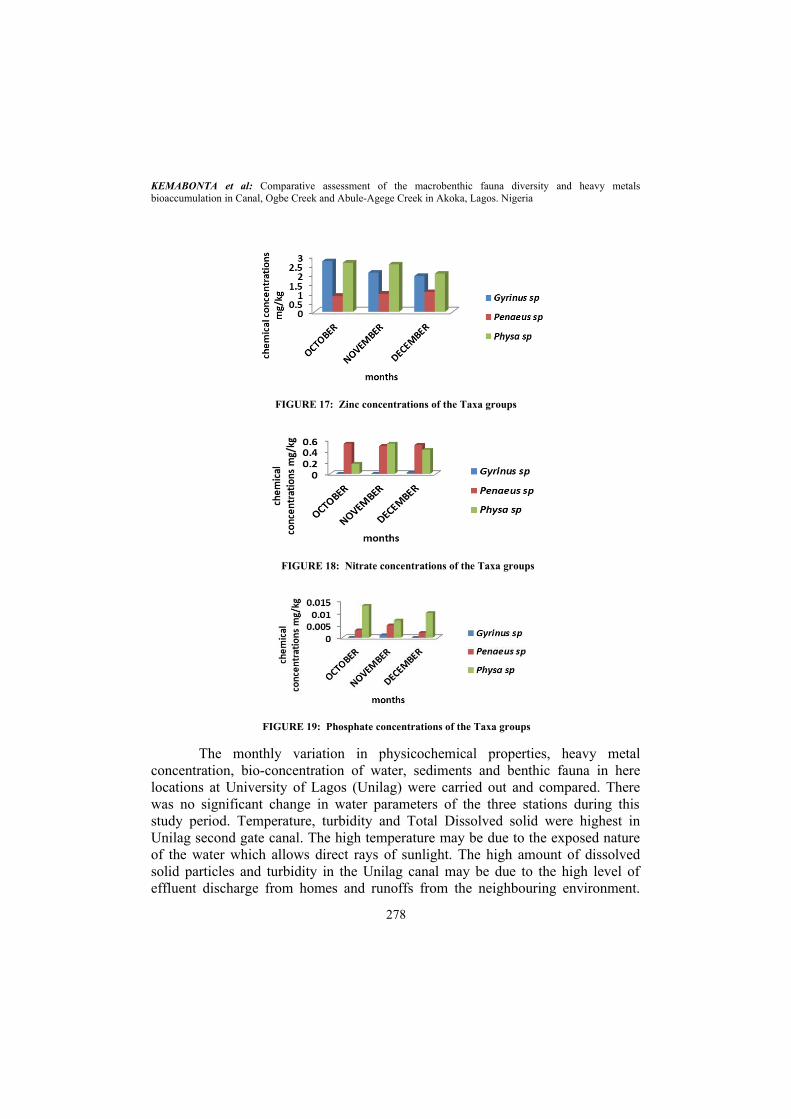
Cadmium. The levels of Cadmium in the organisms collected from theOgbe Creek during this study are presented in Figure 15. It showed that Physa sphad the highest amounts of Cadmium during this study period. In October,Penaeus sp had the lowest amount of Cadmium while in November and DecemberGyrinus sp had the lowest amount of Cadmium. Lead. The levels of lead in the organisms collected from the station 2during this study are presented in Figure 16. The concentration of Lead in Physa spdecreased during this study period. In October and November Gyrinus sp had theleast amount of lead while the concentration in shrimps increased. In December,Physa sp had the highest amount of Lead while Penaeus sp had the least. Zinc. The levels of Zinc in the organisms collected from the Ogbe Creekduring this study are presented in Figure 17. The amounts of Zinc in Gyrinus spand Physa sp, were significantly high while Penaeus sp had the least amount.
Nitrate. The levels of lead in the organisms collected from the Ogbe creekduring this study are presented in Figure 18. The concentrations of Nitrate inPenaeus sp and Physa sp were significantly high while Gyrinus sp had the leastconcentration.
Phophate. The levels of Phosphate in the organisms collected from theOgbe creek of this study are presented in Figure 19. The amounts of Phosphatewere highest in Physa sp and lowest in Gyrinus sp.
FIGURE 15: Cadmium concentrations of the Taxa groups
FIGURE 16: Lead concentrations of the Taxa groups
277
KEMABONTA et al: Comparative assessment of the macrobenthic fauna diversity and heavy metalsbioaccumulation in Canal, Ogbe Creek and Abule-Agege Creek in Akoka, Lagos. Nigeria
FIGURE 17: Zinc concentrations of the Taxa groups
FIGURE 18: Nitrate concentrations of the Taxa groups
FIGURE 19: Phosphate concentrations of the Taxa groups
The monthly variation in physicochemical properties, heavy metalconcentration, bio-concentration of water, sediments and benthic fauna in herelocations at University of Lagos (Unilag) were carried out and compared. Therewas no significant change in water parameters of the three stations during thisstudy period. Temperature, turbidity and Total Dissolved solid were highest inUnilag second gate canal. The high temperature may be due to the exposed natureof the water which allows direct rays of sunlight. The high amount of dissolvedsolid particles and turbidity in the Unilag canal may be due to the high level ofeffluent discharge from homes and runoffs from the neighbouring environment.
278
Annals of West University of Timişoara, ser. Biology, 2020, vol. 23 (2), pp.265-282
Station 2 had the highest salinity content because its source is from the LagosLagoon. Nwankwo (1998), in his study found that the tidal incursion through theLagos harbour as well as freshwater input from run offs and river inflow may alsobe major factors controlling the salinity of lagoons of south-western Nigeria. ThepH in Station Abule-Agege Creek was alkaline compared to the other stations; thismay be linked to the buffer properties of sea water. Similar views have beenreported by Onyema & Okoro (2009) and Doherty & Otitoloju (2010).Furthermore, the biological activity of the coastal zone ensures stable pH, a notablefeature of the marine environment; whereby conditions are remarkably constantover certain areas. The pH in Ogbe Creek exhibited acidic properties with pHvalues ranging from 6.3-7.2.
The presence of trace amounts of heavy metals concentration in the bottomsediment and water of Ogbe Creek confirms the previous reports by Ekpo & Saliu,2006. The concentrations of pollutants in the water increased during the studyperiod. This may be as a result of high amount of evaporation from water surfaceas a result of increased solar radiation at the onset of the dry season. Moreover, theamount of pollutants on the sediments from all the study sites reduced fromOctober to December, this may be as a result of the corresponding increase in thenumber of organisms thereby leading to high uptake of pollutants along with food.The levels of the nutrient elements, PO4- and NO3- were moderately high,suggesting organic pollution and nutrient enrichment of the creek. Metalenrichment of sediment is reflected by the sedimentation of metals ions when theycompete with H+ ions sorption sites in the aquatic environment (Oguzie, 2002). Thephysical process in the area could help the release of solutions rich in heavy metalsinto the bottom sediment of the creek, similar to what was reported for Canadianwaters by Sly (1977). These metals, according to Edginton & Callender (1970) andChoa (1977), have high content of detrital mineral bonds and forms complexes thatis precipitated at river bottom. The observed higher concentration of heavy metalssuch as Cadmium, lead and zinc in the sediment at the stations was effected by run-off.
The direct effects of toxicants typically reduce organism abundance (byincreased mortality or reduced fecundity (Fleeger et al., 2003). The total of 17species of macrobenthic taxa comprising 356 individuals were recorded in Ogbe,Abule- Agege Creeks and Unilag Canal during this study. In this study, highestspecies diversity was observed in Ogbe creek, while Unilag second gate canalrecorded the least diversity of macrobenthic fauna. This was because the number oftaxa in brackish and polluted waters has been known to be fewer than that offreshwater and marine habitat (Victor & Victor, 1992). The presence of leaves,which served as food source for the invertebrates (Marilyn, 1976) and the smallamount of chemical pollutant present in Ogbe Creek encourages sustenance of
279
KEMABONTA et al: Comparative assessment of the macrobenthic fauna diversity and heavy metalsbioaccumulation in Canal, Ogbe Creek and Abule-Agege Creek in Akoka, Lagos. Nigeria
diverse species, compared to Abule-Agege creek and the Canal. Moreover, itallows sediments to settle on the leaves, thus promoting algal growth and othermacroinvertebrates. There was a strong correlation between Cadmium, phosphatesand the months of study at p˃0.01, which shows that the concentrations ofcadmium and phosphate in the water increased with time. Also there was a strongcorrelation between Zinc in water of Ogbe creek, Abule-Agege creek and Unilagsecond gate canal at p˃0.01, showing an overall presence of Zinc in highconcentrations in all the sites. This could be as a result of the connection of Ogbecreek, Abule-agage creek and Unilag Canal (second gate) to the Lagos lagoon.
Sediments are known to be a major bank of trace metals in aquaticecosystems and serve as an indication of the trend and profile of pollution (Gao,2016). The concentrations of heavy metals in the different organisms examined,depends on the profile of the trace metal concentration in the sediments. Theamount of trace chemicals in the Gyrinus sp, Penaeus sp and Physa sp showed thatPhysa sp had high bioaccumulation of chemicals with the exception of nitratewhich was higher in shrimps. The high concentration of trace metals observed inPhysa sp and sediment appears to be greatly enhanced by discharge into Ogbecreek. Moreover, the observed higher levels of trace metals in Physa sp is anindication that ingestion of both sediment and algae might be the primary source ofuptake as observed by Lee et al., (2015). This study corresponds with the heavymetals bioconcentrating ability of freshwater snail Melanoides tuberculata(Forstner & Prosi, 1979) Physa sp therefore are good indicators of metal pollutionin water compared to Gyrinus sp and Penaeus sp.
Zinc had the highest concentration in the organisms ranging between 0.850-2.712. There was no significant difference in the concentration of the chemicals inthe different organisms.
CONCLUSIONThe findings from this study show the effects of physico-chemical properties
on species diversity of macrobenthic fauna. This indicates the effects of humanactivities on the quality of water bodies which affects the sustainability ofmacrobenthic organisms. Macrobenthic fauna are important in creeks and thelagoon, so a decrease in their species or abundance will have an effect on theecosystem food chains. Therefore, there is need to protect the quality of waterbodies by minimizing the discharge of sewage and runoffs.
Recommendations1. Central Sewage Treatment Plant should be constructed in different local government areas to prevent the
direct discharge of sewage and domestic wastes to the lagoon2. There should be construction of canals in a step-wise manner to encourage sedimentation of discharges3. A limit should be set for discharge of canals into the Lagos Lagoon
280
Annals of West University of Timişoara, ser. Biology, 2020, vol. 23 (2), pp.265-282
REFERENCES Ajao E.A., Fagade S.O. 2002. The benthic macroinfauna of Lagos Lagoon. Zoologist, 1(2): 1-15. Arkadiusz N., Jacek K., Agnieszka T, Sylwia M. 2007. Heavy metals in the waters of Dabie Lake in the year
1997-2000 Ecological chemistry and engineering, 14(1): 77-84. Bauernfeind E., Moog O. 2000. Mayflies (Insecta: Ephemenoptera) and the assessment of ecological
integrity: A methodological approach. Hydrobiologia, 135: 155-165. Choa LL 1977. Selective dissolution of manganese oxide from soils and sediments with acidified
hydroxylamine hydroxylamine hydrochloride. Proceedings of American Soil Science Society .36: 457 – 768. Doherty, V.F. and Otitoloju, A.A., 2016. Occurrence and distribution of monocyclic aromatic hydrocarbons
(BTEX) and the impact on macrobenthic community structure in Lagos lagoon, Nigeria. Environmentalmonitoring and assessment, 188(10), p.571.
Edginton D.H., Callender E. 1970. Minor element geochemistry of Lake Michigan Ferromanganese nodules.Earth Planets Science Letters, 8: 97-100.
Ekpo M.P., Saliu J.K. 2006. Preliminary chemical and biological assessment of Ogbe creek, Lagos, Nigeria.West Africa Journal of Applied Ecology, 9, 14-22.
Etim E.U. 2012. Pollution Assessment of the Ebute Meta Creek Impacted by Domestic SewageLagos,Nigeria. Research. Journal of Environmental and Earth Sciences. 4(8): 769-775
Fleeger J.W., Carman K.R., Nisbet R.M. 2003. Indirect effects of contaminants in aquatic ecosystems. TheScience of the Total Environment 317: 207–233
Forstner U., Prosi F., 1979. Biological aspects of freshwater pollution. Heavy metal pollution in freshwaterecosystems. Pergamon Press, Oxford, pp.129-161.
Gao, L., Wang, Z., Shan, J., Chen, J., Tang, C., Yi, M. and Zhao, X., 2016. Distribution characteristics andsources of trace metals in sediment cores from a trans-boundary watercourse: An example from the ShimaRiver, Pearl River Delta. Ecotoxicology and environmental safety, 134, pp.186-195.
Green R. H. 1971. Sampling Design and Statistical method for Environmental biologist. John Willey andSons, Toronto. Ont. 257pp.
Heng L.Y., Mohktar M.B., Rusing S. 2004.The bioaccumulation of trace essential metals by the Freshwatersnail, Turritella spp. Journal of Biological Sciences 4 (4):441-444.
Lee J.H., Birch G.F., Cresswell T., Johansen M.P., Adams M.S., Simpson, S.L., 2015. Dietary ingestion offine sediments and microalgae represent the dominant route of exposure and metal accumulation for Sydneyrock oyster (Saccostrea glomerata): a biokinetic model for Zinc. Aquatic Toxicology, 167, pp.46-54
Mellanby H. 1963. Animal Life in Freshwater. Chapman and Hall Ltd. 308pp. Marilyn C. 1976. Freshwater Fish Pond Culture and Management. Chapman and Hall. 132 Markert B., 2007. Definitions and principles for bioindication and biomonitoring of trace metals in the
environment. Journal of Trace Elements in Medicine and Biology, 21, pp.77-82. Milner B.A., Whiteside P.J. 1984. Introduction to Atomic Absorption Spectrophotometry. 3 rd Edition. Pye
Unicam publishers Limited, Cambridge, England, pp. 4, 7, 25. Nwankwo D.I., 1998. Seasonal changes in phytoplankton composition and diversity in the Epe Lagoon,
Nigeria. Acta Hydrobiologica, 2(40) Nwankwo D.I., Akinsoji, A., 1989. The benthic algal community of a sawdust deposition site in Lagos
Lagoon. Int. J. Ecol. Environ. Sci, 15, pp.197-204. Oguzie F.A. 2002. Variations of the pH and heavy metal concentrations in the lower Ikpoba River in Benin
City, Nigeria. African Journal of Applied Zoology, 2: 13-16. Onyena A.P., Okoro C.A. 2019. Spatio-temporal variations in water and sediment Parameters of Abule
Agege, Abule Eledu, Ogbe, creeks adjoining Lagos Lagoon, Nigeria. Journal of Ecology and The NaturalEnvironment, 11(4), pp.46-54.
Raposo J.C., Bartolomé L., Cortazar E. et al. 2009. Trace Metals in Oysters, Crassotrea sps., from UNESCOProtected Natural Reserve of Urdaibai: Space-Time Observations and Source Identification. Bull EnvironContam Toxicol 83, 223–229.
Resh V.H., Rosenberg D.M eds., 1993. Fresh Freshwater biomonitoring and benthic macroinvertebrates(No. 504.4 FRE). New York, NY, USA:: Chapman & Hall.
Robinson A.H., Robinson P.K. 1971. Seasonal distribution of zooplankton in the Northern basin of lakeChad, Journal of Zoology and Land. 163:25-61.
281
KEMABONTA et al: Comparative assessment of the macrobenthic fauna diversity and heavy metalsbioaccumulation in Canal, Ogbe Creek and Abule-Agege Creek in Akoka, Lagos. Nigeria
Saliu J. K., Ovuorie U. R. 2006. The artificial substrate preference of invertebrates in Ogbe Creek, Lagos,Nigeria. Life Science Journal 4: 77–81.
Sly P.G.A. 1977. A report on studies of the effects of the dredging and disposal in the Great Lake withemphasis on Canadian waters. Science Series. C.C.I.W., Burlington. 1 – 38.
Spacie A, Hamelink J. L. 1985. Bioaccumulation. In: GM Rand and SR Petrocelli (Eds). Fundamental ofAquatic Toxicology: Method and Applications. Hemisphere PublishingCorporation, New York, USA.124-163
Stein E.D., Cohen Y., Winer A.M. 1996. Environmental distribution and transformation of mercurycompounds. Critical Revised Environ. Science and Technology, 26: 1-43
USEPA. 1991. Assessment and control of Bioconcentrable contaminants in surface waters. Office of Healthand Environmental Assessment.US Environmental Protection Agency, Cincinnati, Ohio. pp245
Victor R., Victor J. 1992. Some aspects of the ecology of littoral invertebrates in a coastal Lagoon ofSouthern Oman. Journal of Arid Environments. 37:33-44.
Voshell J.R. Jr. 2002. A Guide to Common Freshwater Invertebrates of North America. McDonald &Woodward Publishing Company, Granville, Ohio. 442pp
World Health Organization (WHO). 2006. Guidelines for drinking-water quality: First addendum to 3rdedition, 1:1.
282