Comparative Architectural Characterization of SPEC CPU2000...
10
Comparative Architectural Characterization of SPEC CPU2000 and CPU2006 Benchmarks on the Intel R Core TM 2 Duo Processor Arun Kejariwal, Alexander V. Veidenbaum Alexandru Nicolau Center for Embedded Computer Systems University of California, Irvine Email: arun [email protected] Xinmin Tian, Milind Girkar Hideki Saito Intel Compiler Lab Intel Corporation Utpal Banerjee Fremont, CA, USA Abstract—SPEC 1 CPU benchmarks are commonly used by compiler writers and architects of general purpose processors for performance evaluation. Since the release of the CPU89 suite, the SPEC CPU benchmark suites have evolved, with applications either removed or added or upgraded. This influences the design decisions for the next generation compilers and microarchitec- tures. In view of the above, it is critical to characterize the applications in the new suite – SPEC CPU2006 – to guide the decision making process. Although similar studies using the retired SPEC CPU benchmark suites have been done in the past, to the best of our knowledge, a thorough performance characterization of CPU2006 and its comparison with CPU2000 has not been done so far. In this paper, we present the above. For this, we compiled the applications in CPU2000 and CPU2006 using the Intel R 2 Fortran/C++ optimizing compiler and executed them, using the reference data sets, on the state-of-the-art Intel Core TM 2 Duo processor. The performance information was collected by using the Intel VTune TM performance analyzer that takes advantage of the built-in hardware performance counters to obtain accurate information on program behavior and its use of processor resources. The focus of this paper is on branch and memory access behavior, the well-known reasons for program performance problems. By analyzing and comparing the L1 data and L2 cache miss rates, branch prediction accuracy, and resource stalls the performance impact in each suite is indirectly determined and described. Not surprisingly, the CPU2006 codes are larger, more complex, and have larger data sets. This leads to higher average L2 cache miss rates and a slight reduction in average IPC compared to the CPU2000 suite. Similarly, the average branch behavior is slightly worse in CPU2006 suite. However, based on processor stall counts branches are much less of a problem. The results presented here are a step towards understanding the SPEC CPU2006 benchmarks and will aid compiler writers in understanding the impact of currently implemented optimizations and in the design of new ones to address the new challenges presented by SPEC CPU2006. Similar opportunities exist for architecture optimization. I. I NTRODUCTION The need for standard performance evaluation has led the development of a large number of benchmarks suites. Different suites have been developed, both in the industry and academia, for the different application domains. For example, the SPEC CPU benchmarks [1] are used for evaluation of general pur- pose processors and their software. Over time, such suites are either upgraded to include the emerging applications or are replaced with new suites. This phenomenon, referred to as evolution, is exemplified by the 5 generations (3 of them have been retired) SPEC CPU benchmarks [1]. 1 Other names and brands may be claimed as the property of others. 2 Intel is a trademark of Intel Corporation in the United States and its subsidiaries in other countries. The SPEC CPU2006 [2] benchmark suite is, arguably, the most complex in the series of SPEC CPU suites released to- date. The inherent characteristics of such a new suite affect the performance that it can achieve on a given processor and system, the success of the compilation process for a given sys- tem, the system architecture requirements, and may influence the design and/or tuning of future processors and compilers. It is therefore important to understand its performance and interaction with compilers and architectures. This paper presents an analysis of the behavior and per- formance of different programs of SPEC CPU2006 [2] and compares them to the programs of SPEC CPU2000 [3] using a state-of-the-art production compiler and architecture: the Intel Fortran/C++ optimizing compiler and a single core of the Intel Core 2 Duo processor. 3 The performance of applications on this type of processor depends on a large number of processor features and parameters and is very difficult to understand. However, it is well understood that two aspects of programs/architectures are key to such an understanding and have a major impact on performance: conditional branches and memory access. We therefore focus our attention on these in order to understand application/compiler/architecture behavior and interaction. The methodology chosen to conduct this study is the following: we executed the benchmarks in SPEC CPU2006 using the reference data sets and collected the hardware performance counter data of the key parameters. The results thus obtained are used to characterize individual applications, compare common applications across the two suites, and compare the average behavior of the two suites. Driven by the results, a qualitative discussion of changes in the benchmarks between the two suites is presented that helps explain the performance differences observed. The main contributions of the paper are as follows: ❚ A performance and behavior characterization of SPEC CPU2000 and CPU2006 using hardware performance counter data (obtained using the Intel VTune 8.0.1 [4] performance analyzer). ❚ An evaluation using state-of-the-art compiler techniques, including whole-program optimization, automatic vector- ization and profile-guided optimization of benchmarks. The importance of using these techniques to obtain best performance has been previously described by Saavedra and Smith in [5]. 3 From hereon, we refer SPEC CPU2006 and SPEC CPU2000 as CPU2006 and CPU2000 respectively. 978-1-4244-1985-2/08/$25.00 ©2008 IEEE 132
Transcript of Comparative Architectural Characterization of SPEC CPU2000...

Comparative Architectural Characterization of SPEC CPU2000 andCPU2006 Benchmarks on the Intel R© CoreTM 2 Duo Processor
Arun Kejariwal, Alexander V. VeidenbaumAlexandru Nicolau
Center for Embedded Computer SystemsUniversity of California, IrvineEmail: arun [email protected]
Xinmin Tian, Milind GirkarHideki Saito
Intel Compiler LabIntel Corporation
Utpal Banerjee
Fremont, CA, USA
Abstract—SPEC1 CPU benchmarks are commonly used bycompiler writers and architects of general purpose processorsfor performance evaluation. Since the release of the CPU89 suite,the SPEC CPU benchmark suites have evolved, with applicationseither removed or added or upgraded. This influences the designdecisions for the next generation compilers and microarchitec-tures. In view of the above, it is critical to characterize theapplications in the new suite – SPEC CPU2006 – to guidethe decision making process. Although similar studies using theretired SPEC CPU benchmark suites have been done in thepast, to the best of our knowledge, a thorough performancecharacterization of CPU2006 and its comparison with CPU2000has not been done so far. In this paper, we present the above.For this, we compiled the applications in CPU2000 and CPU2006using the Intel R©2 Fortran/C++ optimizing compiler and executedthem, using the reference data sets, on the state-of-the-artIntel CoreTM2 Duo processor. The performance information wascollected by using the Intel VTuneTMperformance analyzer thattakes advantage of the built-in hardware performance countersto obtain accurate information on program behavior and its useof processor resources. The focus of this paper is on branch andmemory access behavior, the well-known reasons for programperformance problems. By analyzing and comparing the L1data and L2 cache miss rates, branch prediction accuracy, andresource stalls the performance impact in each suite is indirectlydetermined and described. Not surprisingly, the CPU2006 codesare larger, more complex, and have larger data sets. This leadsto higher average L2 cache miss rates and a slight reductionin average IPC compared to the CPU2000 suite. Similarly,the average branch behavior is slightly worse in CPU2006suite. However, based on processor stall counts branches aremuch less of a problem. The results presented here are a steptowards understanding the SPEC CPU2006 benchmarks and willaid compiler writers in understanding the impact of currentlyimplemented optimizations and in the design of new ones toaddress the new challenges presented by SPEC CPU2006. Similaropportunities exist for architecture optimization.
I. INTRODUCTION
The need for standard performance evaluation has led thedevelopment of a large number of benchmarks suites. Differentsuites have been developed, both in the industry and academia,for the different application domains. For example, the SPECCPU benchmarks [1] are used for evaluation of general pur-pose processors and their software. Over time, such suites areeither upgraded to include the emerging applications or arereplaced with new suites. This phenomenon, referred to asevolution, is exemplified by the 5 generations (3 of them havebeen retired) SPEC CPU benchmarks [1].
1Other names and brands may be claimed as the property of others.2Intel is a trademark of Intel Corporation in the United States and its
subsidiaries in other countries.
The SPEC CPU2006 [2] benchmark suite is, arguably, themost complex in the series of SPEC CPU suites released to-date. The inherent characteristics of such a new suite affectthe performance that it can achieve on a given processor andsystem, the success of the compilation process for a given sys-tem, the system architecture requirements, and may influencethe design and/or tuning of future processors and compilers.It is therefore important to understand its performance andinteraction with compilers and architectures.
This paper presents an analysis of the behavior and per-formance of different programs of SPEC CPU2006 [2] andcompares them to the programs of SPEC CPU2000 [3] using astate-of-the-art production compiler and architecture: the IntelFortran/C++ optimizing compiler and a single core of theIntel Core 2 Duo processor.3 The performance of applicationson this type of processor depends on a large number ofprocessor features and parameters and is very difficult tounderstand. However, it is well understood that two aspects ofprograms/architectures are key to such an understanding andhave a major impact on performance: conditional branches andmemory access. We therefore focus our attention on these inorder to understand application/compiler/architecture behaviorand interaction.
The methodology chosen to conduct this study is thefollowing: we executed the benchmarks in SPEC CPU2006using the reference data sets and collected the hardwareperformance counter data of the key parameters. The resultsthus obtained are used to characterize individual applications,compare common applications across the two suites, andcompare the average behavior of the two suites. Driven by theresults, a qualitative discussion of changes in the benchmarksbetween the two suites is presented that helps explain theperformance differences observed.The main contributions of the paper are as follows:
z A performance and behavior characterization of SPECCPU2000 and CPU2006 using hardware performancecounter data (obtained using the Intel VTune 8.0.1 [4]performance analyzer).
z An evaluation using state-of-the-art compiler techniques,including whole-program optimization, automatic vector-ization and profile-guided optimization of benchmarks.The importance of using these techniques to obtain bestperformance has been previously described by Saavedraand Smith in [5].
3From hereon, we refer SPEC CPU2006 and SPEC CPU2000 as CPU2006and CPU2000 respectively.
978-1-4244-1985-2/08/$25.00 ©2008 IEEE132

z An analysis of the evolution of both (i) the applicationscommon in CPU2000 and CPU2006 and (ii) the suites asa whole.
z A discussion elucidating that memory performance is-sues are more significant then branch performance in theemerging applications.
Although we present analysis of evolution of the SPEC CPUbenchmarks, the analysis methodology presented can be usedfor other benchmarks suites as well.
The rest of the paper is organized as follows: Section IIpresents a brief description of the CoreTM2 Duo microar-chitecture. Section III overviews the evaluation methodol-ogy and briefs about the applications in the newly releasedSPEC CPU2006 benchmark suite. Sections IV–VIII presentresults on the evolution of CPU2000 to CPU2006 based ona number of performance metrics such as IPC, instructiondistribution, branch misprediction ratio, cache behavior, andcertain resource stalls. Finally, in Section IX we conclude withdirections for future work.
II. PROCESSOR DESCRIPTION
The Intel Core
MMX/SSE
FP Move
Branch
ALU
MMX/SSE
FP Move
Branch
ALU
MMX/SSE
FP Move
Branch
ALU
ReOrder Buffer
Decode
Instruction Queue
Instruction Fetch
and PreDecode
CodeµROM
Load
Memory
ReOrder Buffer
L1 D−Cache and DTLB
Schedulers
4
5
4
Rename/Alloc
Store
In−
ord
er f
ron
t en
dO
OO
pa
rt o
f ex
ecu
tion
Shared L2
Cache
4M
Fig. 1. High-level microarchitecture of IntelCore 2 Duo
2 Duo is based onthe Pentium R©M755/745processor, withmicroarchitecturalenhancements andfabricated usingthe 65nm processtechnology [6]. Ahigh-level blockdiagram of theIntel Core 2 Duomicroarchitecture is shown in Figure 1. According to [7], [8],it can decode 4 Intel x86 instructions and can issue 5 µops percycle. The ReOrder Buffer (ROB) can support 96 instructionsin flight. It has a 32-entry unified reservation station. Thepipeline is 14 stages long. The L1 data and instruction cacheare 32KB each and are 8-way associative. The L2 (unified)cache is 4MB in size and is 16-way associative. In additionto the Pentium M processor’s [9] branch predictor, TheIntel Core 2 Duo also supports two additional predictors: aloop detector and an indirect branch predictor [9]. Further,it supports all the instruction-set extensions of the Pentium4 including SSE, EM64T, VT and LT, and a single cycleexecution of the 128-bit SSE instructions.
The Intel Core Core 2 Duo provides an added functionalitycalled micro- and macro-ops fusion wherein related instruc-tions, such as compare and branch, are fused into one µop.The reduction in the number of µops increases the efficiencyof ROB and also reduces energy consumption. In order tofurther improve the effectiveness of the front end, Intel Core2 Duo introduces the use of Extended Stack Pointer (ESP)tracker [10], that performs most of the stack pointer updatesby dedicated hardware within the front-end rather then waiting
for free execution resources on the out-of-order part of themachine.
To achieve higher power savings, the instruction fetch andthe predecoder are powered off when the instruction queuereplays tight code loops. The Intel Core 2 Duo E6700 delivers40% more performance while consuming 40% less power thanthe Pentium D Processor 960 [6].A. Out-of-Order related enhancements
The Out-of-Order (OOO) part of the processor was en-hanced in several ways:
p Additional execution unit was added.p New instructions were introduced, viz., 128-bit packed-add, 128-bit packed-multiply, 128-bit packed-load, 128-bit packed-store.
p Many internal structures that aim to support efficientresource management for OOO were extended to facil-itate exploitation of higher levels of parallelism from asingle instruction stream.
As a result of the above, the Intel Core 2 Duo can achievedouble the compute throughput per clock as compared to theprevious processor generations.B. Memory Subsystem
The memory subsystem was improved mainly by two tech-niques: the use of HW memory disambiguation and the useof enhanced prefetching techniques.
Memory access
Line Fill
Buffers (LFB)
FIFO
L1 code cache
(32K)
L1 data cache
(32K)
IP Prefetcher
DCU Streamer
(16 entries)
L2 Prefetcher
L2 StreamerL2 cache
(4 M)
Trigger Source
Information Gathering
Fig. 2. Prefetcher structure
consists of twosteps: calculatingthe address andaccessing (reador write) thememory. At runtime, the systemgathers all thememory requests(read and write) in a structure called the Memory ReorderBuffer (MOB) in which some of the addresses are knownwhile others are unknown. If out-of-order access to the mainmemory is allowed, previous systems allowed reads to bypasswrites only if the address of the write was known and didnot collide with the address of the read. The Intel Core 2Duo introduces a new mechanism that allows data to be readspeculatively, even if the address of the write it bypassesis yet unknown, and a recovery mechanism for reading thewrong data, if the write address bypassed did collide with theread. In order to reduce the number of addresses that causesmis-speculation a structure is added that keeps the history ofmis-speculated reads to avoid reading their data speculativelyin the future.
In order to mitigate the increasing pressure on the memoryhierarchy, the size of all the internal structures was increasedin the Intel Core 2 Duo to support the out-of-order orderingof the memory operations and the “lazy” writes to memory.C. Hardware prefetching mechanisms
The Intel Core 2 Duo has 6 different prefetchers withineach die, aiming at tracking different memory patterns. The
133

prefetcher structure is shown in Figure 2 [6]. Each of the coreshas two different prefetchers, aiming at patterns of the accessesto the instruction cache as well as to the data cache. There aretwo types of prefetchers that track accesses to the L2 cache.In addition to the hardware prefetchers describe above, thesoftware can also issue prefetch instruction as was supportedin the previous generations.
III. CHARACTERIZATION APPROACH
Benchmark characterization can be accomplished in a num-ber of ways: via simulation, via software-only measurementssuch as basic block profiling, via the use of hardware per-formance counters, et cetera [11]. The more complex andtime sensitive characterization requires either detailed timingsimulation or the hardware (counter) based measurements.Both techniques have their pros and cons and neither can fullyexplain many interdependent interactions in very complex out-of-order processors.
For instance, simulation-based studies may not executelibrary or OS code, do not model all aspects of a full processoror memory system, may not have a compiler capable ofgenerating quality code for the architectural model et cetera.On the other hand, a simulator allows one to vary architecturalparameters and enable/disable system features, e.g., prefetch-ing or vector units, to evaluate their impact.
Hardware performance counter-based characterization, onthe other hand, can only evaluate a single compiler/architecturecombination but it is a complete hardware system executingan operating system, compiler run-time system, and libraries.The effect of hardware accelerators such as vector units orprefetchers, very important for good performance on certaincodes, is fully “modeled”. One also has to be very carefulin setting up the measurements to avoid the “external” in-fluence on the collected data. This includes eliminating theeffects of multi-programming and system daemons, of powermanagement features, and in general avoiding the effects ofnon-deterministic system behavior.
We chose the second approach and evaluated the benchmarksuite behavior on one type of processor, the Intel Core 2 Duoand using the Intel production compiler. However, we believethat while the results represent this particular system the trendswill remain the same for other “similar” processors. In fact,one can argue that any measurements on a real processorrepresent an upper bound as they show what has already beenachieved.
Processor Intel R©CoreTM2 Duo Processor (E8800) , 2.4 GHzMemory 2 GB, DDR 800, dual-channel, non-ECC
L1 D-Cache 32 KBL1 I-Cache 32 KBL2 Cache 4 MBBus Speed 1066 MHz
Compiler Flags -O3 -Qansi alias -Qprof gen -Qprof use -QxP -Qipo -FaOS Microsoft R©Windows XP Professional Version 2002 (Service pack 2)
TABLE IEXPERIMENTAL SETUP
The detailed system configuration is given in Table I, whichalso gives the compiler flag settings and the OS used. TheIntel VTuneTM8.0.1 [4] performance analyzer was used tocollect and access the hardware performance counters. The
performance data collection process is briefly discussed in thenext subsection.
The compiler has a direct impact on the behavior andperformance of application codes. The compiler used in thisstudy has a unique combination of capabilities which, webelieve, significantly improve the resutls. These include:a) whole program optimization, lack of which has a critical
impact on the performance of non-regular codes.b) support for auto-vectorization, the impact of which on
overall performance has been demonstrated by Bik et al.[12].
c) support for profile-guided optimization (pgo), which canprovide run-time information otherwise unavailable to thecompiler during optimiztion phase.
A. Data CollectionAs mentioned above, we wanted to investigate the behavior
of the benchmarks with respect to branch and memory accessbehavior. We could not present either the official SPEC ratesor absolute execution times, so we report IPC data for overallperformance. Other data collected includes branch predictionaccuracy, L1D cache misses, L2 cache misses, as well asinstruction distribution and resource stalls.
Prior to data collection, we disabled the EIST (EnhancedIntel SpeedStep R©Technology) [13] option in the BIOS. Thisis very critical so as to eliminate any adverse effects on theperformance collection process due to dynamic adjustmentof processor voltage and frequency (supported under EIST).In addition, the system was isolated from the network andother things such as the screen saver were turned off. Themeasurements were performed on a single core of the dual-core processor. The program was “pinned” to a single core inorder to prevent process migration on context switches.
The Intel VTune 8.0.1 performance analyzer [4] uses thehardware performance counters to collect performance datafor a number of specified hardware events. Given that onthe Core 2 Duo processor at most 4 events can be sampledsimultaneously, we ran each application multiple times. Ar-guably this could potentially affect the data collected. Forinstance, the first run of a program does not have pages inmemory and therefore may suffer from more system events ascompared to subsequent runs for which the pages may alreadybe in memory. In order to assess the potential impact of theabove, 403.gcc was run 3 times using the reference data setsand the value of following counters were measured in eachrun: data TLB misses (DTLB_MISSES.ANY), cycle countof resources stalls (RESOURCE_STALLS.ANY) and the totalnumber of clock cycles (CPU_CLK_UNHALTED.REF). Thepercentage deviation in the values of the second and the thirdruns w.r.t. the first run is given in Table II. From the table itis evident that the variation in performance data from one runto another is negligible.
% Deviation DTLB_MISSES.ANY RESOURCE_STALLS.ANY CPU_CLK_UNHALTED.REF
2nd w.r.t. 1st 0.317 0.09 0.0523rd w.r.t. 1st 0.136 0.01 0.025
TABLE IIPERFORMANCE VARIATION BETWEEN RUNS
134

Fig. 3. IPC Variation
In the rest of paper we present performance and behaviorcharacterization of CPU2006 and compare it with CPU2000.Performance data for the entire SPEC2000 suite is presented,but for SPEC2006 benchmarks 434.zeusmp, 465.tontoand 481.wrf2 are omitted as their build failed with profile-guided optimizations.
IV. INSTRUCTIONS PER CYCLE
The IPC value signifies the amount of instruction level par-allelism (ILP) that can be achieved using a given compiler andprocessor. The IPC is shown in Figure 3 for the applications inCPU2000 and CPU2006. The IPC was computed by taking theratio of the number of events corresponding to the followinghardware performance counters:CPU_CLK_UNHALTED.REF: This event counts the numberof clock cycles when the core is not in the halt state.INST_RETIRED.ANY: This event counts the number ofretired instructions.
In general, we observe that a lower IPC is achieved forapplications in CPU2006 than the ones in CPU2000. Forinstance, an IPC of 1.04 is achieved for 403.gcc, whereas anIPC of 1.33 is achieved for 176.gcc. The lower IPC value ofemerging applications can, in part, be attributed to their largedata sets and memory footprints as well as their increasedcomplexity. The former may cause an increase in the numberof cache misses or page faults. The latter stems in part fromthe use of advanced language features such as namespaces,
templates, use of high level data structures provided by stan-dard libraries such as STL [14], Boost [15] and large scaleuse of pointers. The use of constructs of such libraries makesprogram analysis more difficult, thereby adversely affectingprogram optimization. For example, 483.xalancbmk inCPU2006 uses the STL routines extensively; in contrast, noneof the applications in CPU2000 use the STL library. Likewise,Perl of CPU2006 is much larger in size and much morecomplex than the one in CPU2000 as it supports severalperformance enhancements such as a new implementationof ithreads and provides many new features. The highercomplexity of CPU2006 applications is also reflected by thehigher instruction count — 9.95× and 7.9×, on an average,for integer and floating-point applications, respectively. Theincreased program complexity is also likely to adverselyaffect memory hierarchy performance and branch predictionaccuracy and result in lower IPC. Another important reasonfor the decrease in IPC value is the non-regular nature (C++vs Fortran77) of the modern applications – there are 5 C++based applications in CPU2006 as compared to 1 in CPU2000.The non-regular nature can be attributed to the use of advancelanguage features which makes compile time optimizationmore difficult.
The IPC variation for the applications common to boththe suites and for the suites as a whole is summarized inTable III. In both cases the average IPC has decreased, albeit
135

Fig. 4. Breakdown of retired instructionsby a small amount. The variance in IPC across the commonas well as all the applications is higher in CPU2006 than inCPU2000. In addition, in CPU2000 as well as CPU2006, ahigher IPC is achieved for integer applications than floating-point applications.
Arith. Mean Std. Dev.
CommonApps
CPU2006 1.16 0.63CPU2000 1.31 0.63
Entire Suite
CINT2006 1.18 0.47CINT2000 1.33 0.43CFP2006 1.05 0.5CFP2000 1.16 0.41
TABLE IIIIPC SUMMARY
As mentioned earlier, the use of libraries limits advancedcompile-time program optimization and may partly explainthe decrease in IPC for CPU2006. This calls for wider useand development of advanced techniques for post-link andrun-time optimizations to enable aggressive whole programoptimization.
It should be noted that the compiler writers had six years ofexperience with the CPU2000 to add capabilites for generatingbetter code, while for CPU2006 this has not yet been done.Similarly, the processor designers had access to CPU2000early in the design process to use it for micro-architectureoptimization. Thus one can expect that the performance ofSPEC CPU2006 suite will improve on future generations ofIntel processors and compilers.
V. INSTRUCTION ANALYSIS
Figure 4 shows the instruction breakdown for CPU2000and CPU2006. Note that the breakdown is presented w.r.t.the number of retired instructions, not number of executedinstructions. The latter is higher as instructions executed alonga mispredicted branch path do not retire. We obtained theinstruction mix using the following hardware performancecounters:INST_RETIRED.LOADS: This event counts the number ofretired loads.INST_RETIRED.STORES: This event counts the number ofretired stores.INST_RETIRED.BRANCHES: This event counts the numberof retired branches.The instruction mix reflects the contribution of each type ofinstruction to program behavior.
From the figure we note that loads/stores account for 40–45% and over 50% of the total number of retired instructionsin integer and floating-point applications respectively. Thisis mainly due to the fact that the IA-32 ISA has a smallnumber of registers. This forces the compiler to use manyload and stores in spill code. The effect of the large numberof load/store operations is significantly reduced by the useof hardware/software prefetching, elimination of redundantload/stores and store-to-load forwarding in the Intel Core 2Duo processor.
136
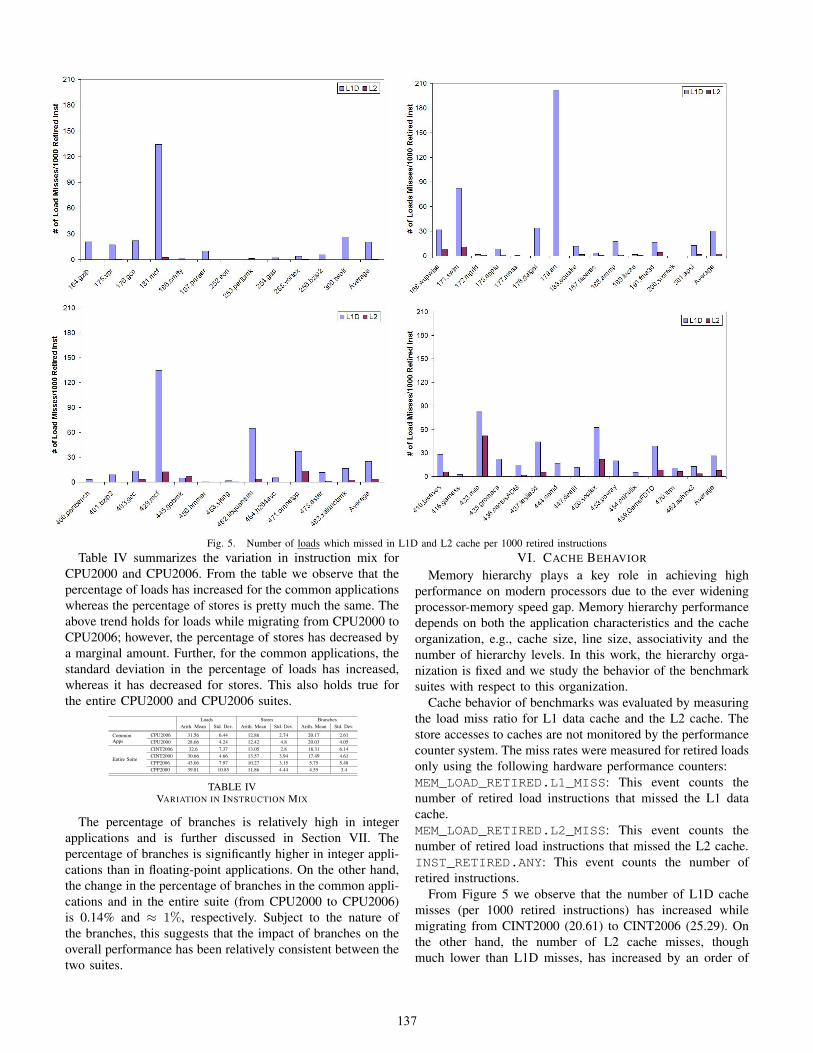
Fig. 5. Number of loads which missed in L1D and L2 cache per 1000 retired instructionsTable IV summarizes the variation in instruction mix for
CPU2000 and CPU2006. From the table we observe that thepercentage of loads has increased for the common applicationswhereas the percentage of stores is pretty much the same. Theabove trend holds for loads while migrating from CPU2000 toCPU2006; however, the percentage of stores has decreased bya marginal amount. Further, for the common applications, thestandard deviation in the percentage of loads has increased,whereas it has decreased for stores. This also holds true forthe entire CPU2000 and CPU2006 suites.
Loads Stores BranchesArith. Mean Std. Dev. Arith. Mean Std. Dev. Arith. Mean Std. Dev.
CommonApps
CPU2006 31.56 6.44 12.86 2.74 20.17 2.61CPU2000 28.66 4.24 12.42 4.8 20.03 4.05
Entire Suite
CINT2006 32.6 7.37 13.05 2.8 18.31 6.14CINT2000 30.66 4.66 13.57 3.94 17.49 4.61CFP2006 43.06 7.97 10.27 3.15 5.75 5.48CFP2000 39.81 10.85 11.86 4.44 4.55 3.4
TABLE IVVARIATION IN INSTRUCTION MIX
The percentage of branches is relatively high in integerapplications and is further discussed in Section VII. Thepercentage of branches is significantly higher in integer appli-cations than in floating-point applications. On the other hand,the change in the percentage of branches in the common appli-cations and in the entire suite (from CPU2000 to CPU2006)is 0.14% and ≈ 1%, respectively. Subject to the nature ofthe branches, this suggests that the impact of branches on theoverall performance has been relatively consistent between thetwo suites.
VI. CACHE BEHAVIOR
Memory hierarchy plays a key role in achieving highperformance on modern processors due to the ever wideningprocessor-memory speed gap. Memory hierarchy performancedepends on both the application characteristics and the cacheorganization, e.g., cache size, line size, associativity and thenumber of hierarchy levels. In this work, the hierarchy orga-nization is fixed and we study the behavior of the benchmarksuites with respect to this organization.
Cache behavior of benchmarks was evaluated by measuringthe load miss ratio for L1 data cache and the L2 cache. Thestore accesses to caches are not monitored by the performancecounter system. The miss rates were measured for retired loadsonly using the following hardware performance counters:MEM_LOAD_RETIRED.L1_MISS: This event counts thenumber of retired load instructions that missed the L1 datacache.MEM_LOAD_RETIRED.L2_MISS: This event counts thenumber of retired load instructions that missed the L2 cache.INST_RETIRED.ANY: This event counts the number ofretired instructions.
From Figure 5 we observe that the number of L1D cachemisses (per 1000 retired instructions) has increased whilemigrating from CINT2000 (20.61) to CINT2006 (25.29). Onthe other hand, the number of L2 cache misses, thoughmuch lower than L1D misses, has increased by an order of
137

Fig. 6. Branch misprediction ratemagnitude — 0.35 in CINT2000 and 3.72 in CINT2006. “Realprograms” keep evolving — they execute more instructionsand use larger data sets, as reflected in these new benchmarks.
The average number of L2 cache misses has increasedby more than 3× in the case of floating-point applications— 7.58 in CFP2006 and 2.21 in CFP2000. If two pro-grams, 433.milc and 450.soplex, are excluded the theincrease in CFP2006 L2 miss rate becomes much smaller. ForCINT2006 the L2 miss rate is dominated by 429.mcf and471.omnetpp. As expected, the floating-point applicationsincur more than 2× the number of L2 cache misses comparedto the integer applications. This can be attributed to the largerdata sets of the floating-point applications. In fact, this trendis consistent with CPU95 as reported in [16]. From above,we can conclude that the emerging applications place moredemand on the cache system.
L1D Misses L2 MissesArith. Mean Std. Dev. Arith. Mean Std. Dev.
CommonApps
CPU2006 40.09 63.31 4.07 5.9CPU2000 40.84 62.83 0.72 1.2
Entire Suite
CINT2006 25.29 39.13 3.72 4.85CINT2000 20.61 36.97 0.35 0.72CFP2006 26.69 23.02 7.58 14.03CFP2000 30.32 53.86 2.21 3.35
TABLE VVARIATION IN CACHE PERFORMANCE
Table V summarizes the variation in cache behavior acrossboth suites. Note that the number of L1D cache misses(per 1000 retired instructions) is smaller for CFP2006 than
CFP2000. This is due to the high number of L1D cache missesincurred by one application: 179.art — 201.6 per 1000retired instructions — and is reflected in the high standarddeviation in the number of L1D cache misses for CFP2000. Ingeneral, the average number of misses for integer and floatingpoint benchmarks in each suite is completely dominated byone or two programs. Thus the standard deviations that arehigher than the averages. This is especially true for L2 misses.
VII. BRANCH BEHAVIOR
This section analyzes branch behavior by looking at branchprediction rates and a detailed distribution of branch types.For this, we measured the branch misprediction rate for bothCPU2000 and CPU2006. We used the following hardwareperformance counters:BR_INST_EXEC: This event counts all executed branches(not necessarily retired).BR_MISSP_EXEC: This event counts the number of mispre-dicted branch instructions that were executed.
As will be seen later in this section, the above includesbranches other than conditional and shows mis-predictions dueto branch direction mis-prediction as well as to other reasons.Also note that the mis-prediction rates are shown for ALLexecuted branches.
Figure 6 shows the branch misprediction rate for CPU2000and CPU2006. In both the suites, integer applications incurhigher number of mispredictions. Also, we note that applica-
138

Fig. 7. Breakdown of branches executedtions in the latter incurs more mispredictions than the former.In CINT2000, 175.vpr incurs the highest mispredictionrate of 10.2%, whereas 473.astar of CINT2006 incursa misprediction rate of 12.89%. On the other hand, theaverage misprediction rate in CFP2006 is noticeably higherthan in CFP2000. In CFP2000, 183.equake incurs thehighest misprediction rate of 6.27%, whereas in CFP2006,435.gromacs incurs a misprediction rate of 6.45%.
Arith. Mean Std. Dev.
CommonApps
CPU2006 3.75 1.91CPU2000 4.42 2.69
Entire Suite
CINT2006 5.35 4.05CINT2000 5.08 3.18CFP2006 2.47 2.02CFP2000 1.12 1.63
TABLE VIBRANCH PREDICTION SUMMARY
The misprediction averages for the two suites and thecommon benchamrks are shown in Table VI. Overall, themispredictions are higher, on average, in CPU2006 than theywere in CPU2000. Large standard deviation for CINT2006and CINT 2000 indicate that a few benchmarks dominate: 2in CINT 2000 and 3 in CINT2006. CFP2006 has significantlylarger misprediction rates compared to CFP2000. For commonapplications in the CINT suites, the average misprediction rateactually went down, even though the codes became larger andmore complex.
Thus an increase in benchmark complexity does notnecesserily mean an increase in branch misprediction rates.
Let us look in more detail at two applications, gcc and bzip,common across the suites. As can be seen in Table VII, there isa significant decrease in conditional branch misprediction ratesfor 401.bzip2 and 403.gcc. At the same time, other typesbranches, may become harder to predict. For instance, returnsin 401.bzip2, although the number of such instructions ismuch smaller than conditional branches.
403.gcc 176.gcc 401.bzip2 256.bzip2
Conditional 2.68 3.46 5.69 8.47Indirect 6.9 23.84 0 0Return 3.66 6.63 18.02 10.33
TABLE VIIMISPREDICTION RATE FOR DIFFERENT BRANCHES IN gcc AND bzip2
Figure 7 reports the percentage of the various types ofbranches as a percentage of the total branch instructionsexecuted. The data was obtained using the following hardwareperformance counters:BR_INST_EXEC: This event counts the number of branchinstructions executed.BR_CND_EXEC: This event counts the number of conditionalbranch instructions executed.BR_IND_EXEC: This event counts the number of indirectbranch instructions executed.BR_CALL_EXEC: This event counts the number of CALLinstructions executed.BR_RET_EXEC: This event counts the number of RET in-structions executed.
139

Fig. 8. Resource Stalls incurredFrom the figure we observe that conditional branches con-
stitute the majority (more than 85% for integer and more than90% for floating-point applications) of the total number ofbranches executed. Indirect branches constitute, on an average,1.5% of the total branches executed with a small standarddeviation.
VIII. RESOURCE STALLS
So far we have looked at the branch and memory hierarchybehavior of the two application suites in isolation. In addition,the data we obtained such as cache miss rates or branch mis-prediction rates cannot be directly related to overall perfor-mance or IPC rates. Another set of hardware performancecounters in the Core2 Duo gives us an opportunity to do this,albeit still indirectly in a “black box”-like approach. Thesecounters measure various resource stalls. The counters usedare given below:
Ê RESOURCE_STALLS.BR_MISS_CLEAR: This eventcounts the number of cycles after a branch mispredictionis detected at execution and until the branch and all olderµops retire.
Ë RESOURCE_STALLS.LD_ST: This event counts thenumber of cycles when the pipeline has exceeded loador store limit or is waiting to commit all stores.
Ì RESOURCE_STALLS.ROB_FULL: This event countsthe number of cycles when the number of instructionsin the pipeline waiting for retirement reached the limitthe processor can handle.
Í RESOURCE_STALLS.RS_FULL: This event counts thenumber of cycles when the number of instructions inthe pipeline waiting for execution reached the limit theprocessor can handle.
Î CYCLES_L1I_MEM_STALLED: This event counts thenumber of cycles for which an instruction fetch stalls.
Figure 8 shows the different types of resource stalls per 1000retired instructions, for both CPU2000 and CPU2006. Notethat these stalls may be overlapped with the execution latencyof the previously executing instructions or, in some cases, witheach other. Therefore, the absolute impact of each stall onthe overall performance still cannot be determined [16]. Ingeneral, the figure shows that the number of resource stallshas increased while migrating from CPU2000 to CPU2006.
Let us first briefly discuss Î, L1 I-cache stalls. Theyoccur but are negligible in CINT2000 and 2006. They arelargely non-existent in CFP2000. But in CFP2006, due to436.cactusADM, they are large. 436.cactusADM behav-ior is explained by one very large loop that does not fit intothe L1I cache. Overall, L1 I-cache misses do not affect thebenchmark performance.
The stalls corresponding to branch mispredictions Ê haveincreased by a factor of 1.17 and 3.92 for integer and floating-point applications respectively. This tracks the increase in mis-prediction rates shown in Table VI. While large, this increasedoes not make branch mispredict stalls dominant, either onaverage or in any of the benchmarks. One can thus conclude
140

that the hard work of improving branch predictors is payingoff and their impact on performance is not dominant, even inprograms with largest amount of such stalls.
The next three types of stalls: Ë LD/ST queue (LSQ)full stalls, Ì ROB full stalls, and Í reservation station(RS) full, are “inter-related”. For instance, we observethat the ROB is never the largest of these three and canconclude that it seldom fills up. The other two structures,the RS or the LSQ are full much more often and thuswe can conclude that they fill up first. The largest LSQstalls are observed in benchmarks with high L1D and L2miss rates: 429.mcf, 471.omnetpp in CINT2006and 410.bwaves, 433.milc, 437.leslie,450.soplex, 459.GemsFDTD in CFP2006. Thesituation is similar in CPU2000. Thus one can conclude thatthis happens due to memory access on L2 misses and thatthey significantly affect performance. The reservation stationalso becomes frequently full in the same benchmarks with ahigh L2 miss rate, sometimes contributing many more stallcycles than the LSQ, e.g., 429.mcf, 471.omnetpp,433.milc, 450.soplex. But not always as can beseen in 410.bwawes, 437.leslie. In many otherbenchmarks that do not have a significant LSQ stallcomponent the RS stalls are the primary cause of stalls andthus the reason for IPC/performance loss. This happens onmemory accesses even in these benchmarks but also due todata dependences, especially on other types of long latencyinstructions such as divide, square root, et cetera.
IX. CONCLUSION
This paper presented a characterization and evaluation ofthe new SPEC CPU2006 benchmark suite using hardwareperformance counter measurements on the Intel Core Duoprocessor (using a single CPU). It also compared the new suitewith the CPU2000 suite, based on the applications common toboth of them. It should be noted that the hardware performancecounter data always directly explain performance impact.Based on the analysis we make the following conclusions:
p First, the new SPEC suite is characterized by morecomplex codes, larger data sets and thus memory require-ments, and the use of more advanced software technologysuch as component libraries and more benchmarks inobject-oriented languages. As a result, the overall IPCfor the new suite has decreased slightly from CPU2000and is of the order of 1.15 for this 4-wide issue processor.
p Second, the instruction mix (at the “micro-op” level) isheavy with load/store instructions which together com-prise slightly over 45% of the total. Combined withlarger memory footprint this leads to a higher L1D, forCINT2006, and L2 load miss rates, even with a 4MBL2 cache (store miss rates could not be measured). Thedecrease in the average number of L1D misses, fromCFP2006 to CFP2000, is due to one outlier: 179.artin CFP2000. Excluding 179.art, the average numberof L1D misses in CFP2000 is 17.14 which is less thanthat of CFP2006 (= 26.69).
p Third, CPU2006 has a higher percentage of branchesthan CPU2000. The branch misprediction rates haveincreased on average, albeit by a small amount, whilemigrating from CPU2000 to CPU2006. In many commonapplications across the two suites the mis-prediction ratewent down. The stalls due to branch misprediction areshown to be, on an average, quite small and are not themain reason of the IPC values observed.
p Fourth, the main cause of the high stall rates are theload/store queues and the reservation station filling up.The former is due to the high L2 cache miss rates,increased in the new suite. The latter is likely due to datadependencies and long latency instructions – in particularL1D misses that hit in L2 – as well as divides or squareroots. The reorder buffer getting full is not commonamong both suites and does not add significant stalls inmost benchmarks.
p Fifth, the averages for branch mispredictions and L2misses are largely determined by a very small number ofprograms as evident from the high standard deviations.However, the stall behavior summarized above is true forthe majority of the CPU2006 and CPU2000 programs andexplains the reasons for relatively similar IPC rates.
As future work, we plan to explore the impact of set ofcompiler optimizations used and their relative ordering.
X. ACKNOWLEDGMENTSThe authors would like to thank Avi Mendelson (Intel
Corporation, Haifa, Israel) for his help with developing thecharacterization approach and the analysis.
REFERENCES[1] “SPEC CPU Benchmarks,” http://www.spec.org/benchmarks.html.[2] “SPEC CPU2006,” http://www.spec.org/cpu2006.[3] “SPEC CPU2000,” http://www.spec.org/cpu2000.[4] “Intel R©VTuneTMPerformance Analyzer 8.0.1 for Windows,” http://
www.intel.com/cd/software/products/asmo-na/eng/vtune/219898.htm.[5] R. H. Saavedra and A. J. Smith, “Performance characterization of
optimizing compilers,” IEEE TOSE, vol. 21, no. 7, pp. 615–628, 1995.[6] J. Doweck, “Inside the CoreTMmicroarchitecture,” in Hot Chips, Stanford
University, Aug. 2006.[7] ——, “Intel R©smart memory access: Minimizing latency on
intel R©coreTMmicroarchitecture,” 2006, www.intel.com/technology/magazine/computing/smart-memory-access-0906.pdf.
[8] K. Krewell, “Intel Looks to Core for Success,” in MicroprocessorReport, 2006.
[9] S. Gochman, R. Ronnen, I. Anati, A. Berkovits, T. Kurts, A. Naveh,A. Saeed, Z. Sperber, and R. C. Valentine, “The Intel R©Pentium R©M:Microarchitecture and performance,” Intel Technology Journal, vol. 7,no. 2, May 2003.
[10] M. Bekerman, A. Yoaz, F. Gabbay, S. Jourdan, M. Kalaev, and R. Ronen,“Early load address resolution via register tracking,” in Proceedings ofISCA, 2000, pp. 306–315.
[11] D. Ofelt and J. L. Hennessy, “Efficient performance prediction for mod-ern microprocessors,” In Proceedings of the 2000 ACM SIGMETRICSInternational Conference on Measurement and Modeling of ComputerSystems, 2000, pp. 229–239.
[12] A. J. C. Bik, M. Girkar, P. M. Grey, and X. Tian, “Automatic detectionof saturation and clipping idioms,” In Proceedings of LCPC, 2002, pp.61–74.
[13] “Enhanced Intel SpeedStep R©Technology,” http://www3.intel.com/cd/channel/reseller/asmo-na/eng/203838.htm.
[14] “Standard Template Library Programmer’s Guide,” http://www.sgi.com/tech/stl/.
[15] “Boost C++ Standard Library,” http://boost.org/.[16] D. Bhandarkar and J. Ding, “Performance characterization of the
pentium R©pro processor,” In Proceedings of HPCA, 1997, pp. 288–299.
141