Comparative Anatomy of Primate Skulls
11
Inferring primary tumor sites from mutation spectra: a meta-analysis of histology-specific aberrations in cancer-derived cell lines Felix Dietlein 1,2, ∗ and Wolfgang Eschner 1,2 1 Center for Integrated Oncology, 2 Department of Nuclear Medicine, University Hospital of Cologne, Kerpener Str. 62, Cologne 50937, Germany Received July 10, 2013; Revised September 26, 2013; Accepted October 23, 2013 Next-generation sequencing technologies have led to profound characterization of mutation spectra for several cancer types. Hence, we sought to systematically compare genomic aberrations between primary tumors and cancer lines. For this, we compiled publically available sequencing data of 1651 genes across 905 cell lines. We used them to characterize 23 distinct primary tumor sites by a novel approach that is based on Bayesian spam-filtering techniques. Thereby, we confirmed the strong overall similarity of alterations between patient samples and cell culture. However, we also identified several suspicious mutations, which had not been asso- ciated with their cancer types before. Based on these characterizations, we developed the inferring cancer ori- gins from mutation spectra (ICOMS) tool. On our cell line collection, the algorithm reached a prediction specificity rate of 79%, which strongly variegated between primary cancer sites. On an independent validation cohort of 431 primary tumor samples, we observed a similar accuracy of 71%. Additionally, we found that ICOMS could be employed to deduce further attributes from mutation spectra, including sub-histology and com- pound sensitivity. Thus, thorough classification of site-specific mutation spectra for cell lines may decipher fur- ther genome – phenotype associations in cancer. INTRODUCTION Over the past years, targeted therapies have tremendously affected the clinical outcome of several cancer types (1 – 6). The rationale of these personalized approaches is to exploit the individual biology of tumor lesions by specific kinase inhibitors (7). So far, most cancer-specific therapeutically amenable targets have been deciphered in cell culture models (8 – 10). Bearing in mind the enormous efforts devoted to the elucidation of mutation spectra of primary tumors (11 – 15), we aimed at developing a pan-cancer characterization of functionally relevant aberrations in cell lines. Recently, sequencing data of large cohorts of patient samples [The Cancer Genome Atlas (TCGA)] (11) and cell lines [Cancer Cell Line Encyclopedia (CCLE)] (16) became publically available. We used them to establish a genomic classification, linking a gene to the cancer type, in which it is most frequently mutated. Based on this, we developed a com- putational tool, which infers cancer origins from mutation spectra (ICOMS). We demonstrate its application to predict multiple cell line characteristics from mutation spectra, including its primary site, sub-histology and response to specific kinase inhibitors. This study involved sequencing data of 1651 genes across 905 cell lines derived from 23 distinct primary sites [CCLE database, (16)] (Fig. 1A). We validated our findings using a collection of 431 independent primary tumor samples [TCGA database (11 – 15)] (Fig. 1A). RESULTS A pan-cancer association between primary tumor sites and cell line mutation spectra Our first aim was to capture the spectrum of characteristic muta- tions for each cancer type. To this end, we examined hybrid capture sequencing data of 905 cancer cell lines (Supplementary Material, Table S1) derived from 23 distinct primary tumor sites ∗ To whom correspondence should be addressed at: Department of Nuclear Medicine, University Hospital of Cologne, Kerpener Str. 62, Cologne 50937, Germany. Tel: +49 221 478 5024; Fax: +49 221 478 89085; Email: [email protected] # The Author 2013. Published by Oxford University Press. All rights reserved. For Permissions, please email: [email protected] Human Molecular Genetics, 2014, Vol. 23, No. 6 1527–1537 doi:10.1093/hmg/ddt539 Advance Access published on October 26, 2013 Downloaded from https://academic.oup.com/hmg/article-abstract/23/6/1527/733856 by guest on 05 April 2019
Transcript of Comparative Anatomy of Primate Skulls

Inferring primary tumor sites from mutation spectra:a meta-analysis of histology-specific aberrationsin cancer-derived cell lines
Felix Dietlein1,2,∗ and Wolfgang Eschner1,2
1Center for Integrated Oncology, 2Department of Nuclear Medicine, University Hospital of Cologne, Kerpener
Str. 62, Cologne 50937, Germany
Received July 10, 2013; Revised September 26, 2013; Accepted October 23, 2013
Next-generation sequencing technologies have led to profound characterization of mutation spectra for severalcancer types. Hence, we sought to systematically compare genomic aberrations between primary tumors andcancer lines. For this, we compiled publically available sequencing data of 1651 genes across 905 cell lines.We used them to characterize 23 distinct primary tumor sites by a novel approach that is based on Bayesianspam-filtering techniques. Thereby, we confirmed the strong overall similarity of alterations between patientsamples and cell culture. However, we also identified several suspicious mutations, which had not been asso-ciated with their cancer types before. Based on these characterizations, we developed the inferring cancer ori-gins from mutation spectra (ICOMS) tool. On our cell line collection, the algorithm reached a predictionspecificity rate of 79%, which strongly variegated between primary cancer sites. On an independent validationcohort of 431 primary tumor samples, we observed a similar accuracy of 71%. Additionally, we found thatICOMS could be employed to deduce further attributes from mutation spectra, including sub-histology and com-pound sensitivity. Thus, thorough classification of site-specific mutation spectra for cell lines may decipher fur-ther genome–phenotype associations in cancer.
INTRODUCTION
Over the past years, targeted therapies have tremendouslyaffected the clinical outcome of several cancer types (1–6).The rationale of these personalized approaches is to exploit theindividual biology of tumor lesions by specific kinase inhibitors(7). So far, most cancer-specific therapeutically amenable targetshave been deciphered in cell culture models (8–10). Bearing inmind the enormous efforts devoted to the elucidation of mutationspectra of primary tumors (11–15), we aimed at developing apan-cancer characterization of functionally relevant aberrationsin cell lines.
Recently, sequencing data of large cohorts of patientsamples [The Cancer Genome Atlas (TCGA)] (11) and celllines [Cancer Cell Line Encyclopedia (CCLE)] (16) becamepublically available. We used them to establish a genomicclassification, linking a gene to the cancer type, in which it ismost frequently mutated. Based on this, we developed a com-putational tool, which infers cancer origins from mutation
spectra (ICOMS). We demonstrate its application to predictmultiple cell line characteristics from mutation spectra, includingits primary site, sub-histology and response to specific kinaseinhibitors.
This study involved sequencing data of 1651 genes across 905cell lines derived from 23 distinct primary sites [CCLE database,(16)] (Fig. 1A). We validated our findings using a collectionof 431 independent primary tumor samples [TCGA database(11–15)] (Fig. 1A).
RESULTS
A pan-cancer association between primarytumor sites and cell line mutation spectra
Our first aim was to capture the spectrum of characteristic muta-tions for each cancer type. To this end, we examined hybridcapture sequencing data of 905 cancer cell lines (SupplementaryMaterial, Table S1) derived from 23 distinct primary tumor sites
∗To whom correspondence should be addressed at: Department of Nuclear Medicine, University Hospital of Cologne, Kerpener Str. 62, Cologne 50937,Germany. Tel: +49 221 478 5024; Fax: +49 221 478 89085; Email: [email protected]
# The Author 2013. Published by Oxford University Press. All rights reserved.For Permissions, please email: [email protected]
Human Molecular Genetics, 2014, Vol. 23, No. 6 1527–1537doi:10.1093/hmg/ddt539Advance Access published on October 26, 2013
Dow
nloaded from https://academ
ic.oup.com/hm
g/article-abstract/23/6/1527/733856 by guest on 05 April 2019

Figure 1. (A) Schematic outline of the five main steps in this study. (B) Selective (purple frame) and frequent (brown frame) biologically relevant meta-mutations ofeight cancer types (histology-specific colors) are listed in mutation index descending order. Gene name, selected amino acid changes, mutation index as well ashistology-specific (green) and total (red) counts are recorded.
1528 Human Molecular Genetics, 2014, Vol. 23, No. 6
Dow
nloaded from https://academ
ic.oup.com/hm
g/article-abstract/23/6/1527/733856 by guest on 05 April 2019

(CCLE database). For each mutation, we recorded its recurrencein the CCLE data set, counted the number of cancer types, forwhich it most frequently occurred (rating), and calculated its mu-tation index as a novel measure to assess its feasibility for char-acterizing a certain primary site (Supplementary Material,Table S2 and Methods).
Altogether, we found that the CCLE data set contained 3435groups of recurrent mutations. Of these, 2490 (72%) were select-ive, i.e. associated with a single primary site (SupplementaryMaterial, Table S2, green). Further, the mutation index of2534 mutations (74%) was high enough to serve as an acceptablegenomic predictor. Both criteria were fulfilled for 1993 (58%)distinct recurrent mutations.
Next, we clustered these mutations to a panel of 2717 meta-mutations (Supplementary Material, Table S3), groups of genomicalterations in the same gene that can be combined for primary sitecharacterization. Of these, we selected 1131 (42%) meta-mutations,which were unambiguously associated with a single cancer type(Supplementary Material, Table S3, green). They constituted ourgenomic classification of cancer types.
The number of selective meta-mutations varied greatly betweenprimary tumor sites (SupplementaryMaterial,Fig.S1A),but did notcorrelate significantly with their a priori representation in the totalcell line cohort (P¼ 0.093, Supplementary Material, Fig. S1B).However, we observed significant correlation (P¼ 0.002) withthe average count of mutations per sample (Supplementary Mater-ial, Fig. S2).
Finally, we studied the functional relevance of the strongestgenomic predictors of our primary site classification (Fig. 1B).For this, we sorted meta-mutations by mutation indices (Supple-mentary Material, Table S3) and compared them with previousreports in literature. Functionally prominent mutations wereclassified into frequent and selective aberrations; missensemutations were scored by PolyPhen (version 2) algorithm (17),which assessed their disruption of the global protein structure(Fig. 1B).
In concordance with previous studies, we associated muta-tions of KRAS, TP53, EGFR, STK11 (18–23) and DDR2 (24)with lung cancer, mutations of BRAF (25–27) with melanoma,mutations of NRAS (28–31) and MYC (32–34) with hemato-logical malignancies, mutations of ARID1A (35–38) andPTEN (39–44) with endometrium cancer, mutations of APC(14,45–47) and BMPR2 (48–50) with colorectal cancer, muta-tions of TSHR (51–54) and TPO (55,56) with thyroid cancer andmutations of VHL (57–61) with kidney cancer. A detailed exam-ination can be found in the Supplementary Material, MutationAnnotation.
Of note, we also recovered typical domains of gain-of-functionmutations, e.g. L858R substitutions and exon 19 deletions forEGFR (62), amino acid substitutions at G12, Q16 for KRAS(21,63–65) as well as V600E mutations for BRAF (25–27)(Fig. 1B). Additionally, we observed that loss-of-function muta-tions dispersed over the whole amino acid sequence of tumor sup-pressor genes, such as ARID1A (35–38), APC (14,45–47) andVHL (57–61) (Fig. 1B and Supplementary Material, Table S3).Thus, tumor suppressors could be differentiated from proto-oncogenes by analysis of meta-mutation spectra.
Owing to their specificity and high mutation index, mutationsin BCL3, MLL3 (lung), JAK1, ERBB3, RBL2, ALDH7A1 andHMMR (endometrium), P2RX7, RAC1 and IRS1 (blood),
MEN1, FANCI, FANCB and PAX8 (skin) as well as SACS,ROCK1, JARID2 and TET1 (large intestine) showed up asnovel promising targets (Fig. 1B and Supplementary Material,Table S3), which had, to the best of our knowledge, not beenassociated with their respective primary sites before.
Computational prediction of primary tumor sitesby ICOMS algorithm
We employed this classification tocomputationallypredictprimarysites of cell lines by ICOMS algorithm, a novel computational toolthatwe developed to infercancer origins from mutationspectra.Foreach cell line, we calculated its mutation-derived coefficientsaccording to the 23 distinct primary sites (Supplementary Mater-ial, Table S4).
Plotting mutation-derived coefficients against cancer types un-raveled their strong accumulation on the diagonal (Fig. 2). Thisreflected their discriminatory power, on which the outcome of theICOMS algorithm was highly dependent. For 20 of 23 histotypes,coefficients were significantly superior in the group of samples,for which pathological diagnoses matched, compared with comple-mentary control groups (homoscedastic T-test: endometrium, P¼3.7 × 102114; blood, P¼ 5.1 × 10264; kidney, P¼ 9.8 × 10293;lung, P¼ 1.9 × 10238; prostate, P¼ 1.8 × 10282; skin, P ¼6.4 × 10260; thyroid, P ¼ 1.7 × 10295, etc.) (Fig. 2 and Supple-mentary Material, Table S4).
However, distribution shapes of mutation coefficients (Fig. 2and Supplementary Material, Fig. S3) strongly varied betweencancer types, e.g. coefficients of hematological and lung malig-nancies were broadly spread (average control groups: 1.69 and5.83) with prominent site-specific amplitudes (coefficient peaks:8.03 and 15.73). On the contrary, coefficient baseline (averagecontrol group: 0.01) and amplitudes (2.05) were low for kidneytumors (Supplementary Material, Fig. S3 and Table S4).
This was considered in our algorithm design both by the inde-pendent choice of upper and lower thresholds of mutation coef-ficients (Supplementary Material, Table S5) and by the hierarchyof cancer types according to the histology order (SupplementaryMaterial, Fig. S4), which resolved ICOMS diagnosis conflicts. Inorder to optimize upper and lower mutation coefficient thresh-olds, we calculated two ROC analogs (66) per primary site (Sup-plementary Material, Fig. S3). Naturally, strong a priorirepresentations (e.g. breast, large intestine and ovary) allowedlower choice of both coefficients, whereas less focal distribu-tions (e.g. blood and lung) required isolated increase of thelower threshold (Supplementary Material, Table S5).
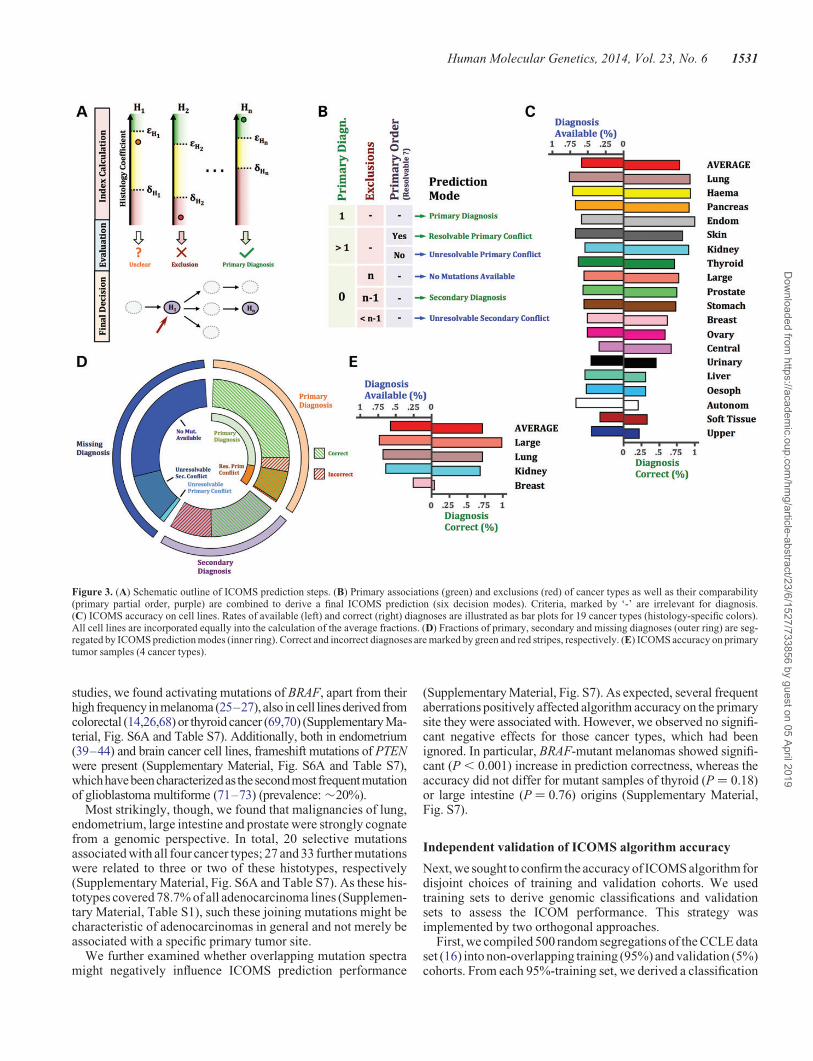
Based on this optimal calibration, we performed the ICOMSalgorithm on the whole CCLE data set (Fig. 3A,B). We calcu-lated both the fraction of samples, for which a computationaldiagnosis was available (available diagnoses, i.e. sensitivity)and the portion of these, for which computational diagnosismatched CCLE cell line annotation (correct diagnoses, i.e. spe-cificity) (Fig. 3C and Supplementary Material, Table S6).
Overall, the ICOMS algorithm achieved sensitivity and speci-ficity rates of 58 and 71%, respectively, which strongly variedbetween cancer types (Fig. 3C). Surprisingly, no significant as-sociation of performance with a priori representation in thetotal cell line cohort (P ¼ 0.064) was perceived. Particularly,breast (rank: 11) and central nervous system (rank: 13) achievedlow performance results (specificity ≤65%), whereas the
Human Molecular Genetics, 2014, Vol. 23, No. 6 1529
Dow
nloaded from https://academ
ic.oup.com/hm
g/article-abstract/23/6/1527/733856 by guest on 05 April 2019

weakly represented origins of endometrium (rank: 4), pancreas(rank: 3) and kidney (rank: 6) cancer had excellent accuracyrates (specificity ≥90%) (Fig. 3C).
Comparing the histology distribution in the total cell linecohort to the panel of cell lines, for which a computational diagnosiswas available, confirmed these findings (Supplementary Material,Fig. S5). Lung (P , 0.0001) and blood (P¼ 0.008) malignancieswere significantly over-represented in the former, whereas primarysites of bone (P ¼ 0.0003), oesophagus (P ¼ 0.042), soft tissue(P ¼ 0.049), upper aerodigestive tract (P ¼ 0.0024) and centralnervous (P ¼ 0.036)malignancies, which had achieved weak per-formance rates, were underrepresented. Additionally, enlargingthe histology distribution of mismatches, revealed blood (36 mis-matches), lung (32 mismatches), pancreas (11 mismatches) andbreast (8 mismatches) to be the most frequent targets of incorrectpredictions (Supplementary Material, Fig. S5).
Finally, we examined whether ICOMS prediction mode varie-gated specificity rate (Fig. 3D, Supplementary Material, Table S6).ICOMS derived its diagnosis either from positive histology selec-tion (primary diagnosis, 36%) or from exclusion of residual histo-types (secondary diagnosis, 24%) (Fig. 3B,D). On the contrary,unavailability of an ICOMS diagnosis was caused either by un-availability of predictive mutations or by incompatible combin-ation of predictive mutations (primary and secondary diagnosis
conflicts); the former alternative dominated (71%) the group of un-available diagnoses in our data set (Fig. 3D). Notably, specificitywas significantly superior for primary compared with secondarydiagnoses (P , 0.0001). This suggests that diagnosis modes canbe interpreted as distinct levels of diagnosis validity (Fig. 3B,Dand Supplementary Material, Table S6).
Systematic characterization of overlaps betweenmeta-mutation spectra
Our cancer origin classification followed a winner-take-all strat-egy (67), which made it robust against minor changes in low-frequency histology-mutation associations as well as inadequateprimary site annotations in the training set (Supplementary Ma-terial, Methods). Hence, merely the most probable primary siteof each mutation was considered for prediction (Fig. 1B and Sup-plementary Material, Table S3), so that we assessed whetherstrong overlaps of mutation spectra might negatively affectICOMS accuracy (Fig. 3C,D).
First, we systematically characterized the overlaps of specificmeta-mutations (SupplementaryMaterial,Fig.S6A andTableS7)by generalizing the definition of the rating gt (Supplementary Ma-terial, Fig. S6B and Methods). We detected nine inter-histologicoverlaps of mutation spectra. In concordance with previous
Figure 2. Bar plots of mutation coefficients for cell lines (ordinate) against cancer types (abscissa), segregated by correct (green), incorrect (red) and missing (blue)ICOMS diagnoses. Color intensities mirror accumulation of mutation coefficients in each field.
1530 Human Molecular Genetics, 2014, Vol. 23, No. 6
Dow
nloaded from https://academ
ic.oup.com/hm
g/article-abstract/23/6/1527/733856 by guest on 05 April 2019
studies, we found activating mutations of BRAF, apart from theirhigh frequency inmelanoma (25–27), also incell lines derived fromcolorectal (14,26,68) or thyroid cancer (69,70) (Supplementary Ma-terial, Fig. S6A and Table S7). Additionally, both in endometrium(39–44) and brain cancer cell lines, frameshift mutations of PTENwere present (Supplementary Material, Fig. S6A and Table S7),whichhavebeencharacterizedas thesecondmost frequentmutationof glioblastoma multiforme (71–73) (prevalence: �20%).
Most strikingly, though, we found that malignancies of lung,endometrium, large intestine and prostate were strongly cognatefrom a genomic perspective. In total, 20 selective mutationsassociated with all four cancer types; 27 and 33 further mutationswere related to three or two of these histotypes, respectively(Supplementary Material, Fig. S6A and Table S7). As these his-totypes covered 78.7% of all adenocarcinoma lines (Supplemen-tary Material, Table S1), such these joining mutations might becharacteristic of adenocarcinomas in general and not merely beassociated with a specific primary tumor site.
We further examined whether overlapping mutation spectramight negatively influence ICOMS prediction performance
(Supplementary Material, Fig. S7). As expected, several frequentaberrations positively affected algorithm accuracy on the primarysite they were associated with. However, we observed no signifi-cant negative effects for those cancer types, which had beenignored. In particular, BRAF-mutant melanomas showed signifi-cant (P , 0.001) increase in prediction correctness, whereas theaccuracy did not differ for mutant samples of thyroid (P ¼ 0.18)or large intestine (P ¼ 0.76) origins (Supplementary Material,Fig. S7).
Independent validation of ICOMS algorithm accuracy
Next, we sought to confirm the accuracy of ICOMS algorithm fordisjoint choices of training and validation cohorts. We usedtraining sets to derive genomic classifications and validationsets to assess the ICOM performance. This strategy wasimplemented by two orthogonal approaches.
First, we compiled 500 random segregations of the CCLE dataset (16) into non-overlapping training (95%) and validation (5%)cohorts. From each 95%-training set, we derived a classification
Figure 3. (A) Schematic outline of ICOMS prediction steps. (B) Primary associations (green) and exclusions (red) of cancer types as well as their comparability(primary partial order, purple) are combined to derive a final ICOMS prediction (six decision modes). Criteria, marked by ‘-’ are irrelevant for diagnosis.(C) ICOMS accuracy on cell lines. Rates of available (left) and correct (right) diagnoses are illustrated as bar plots for 19 cancer types (histology-specific colors).All cell lines are incorporated equally into the calculation of the average fractions. (D) Fractions of primary, secondary and missing diagnoses (outer ring) are seg-regated by ICOMS prediction modes (inner ring). Correct and incorrect diagnoses are marked by green and red stripes, respectively. (E) ICOMS accuracy on primarytumor samples (4 cancer types).
Human Molecular Genetics, 2014, Vol. 23, No. 6 1531
Dow
nloaded from https://academ
ic.oup.com/hm
g/article-abstract/23/6/1527/733856 by guest on 05 April 2019

of cancer types; subsequently, we employed it to performICOMS on the complementary 5%-validation set with unalteredchoices of thresholds. For each partition, we recorded ICOMSperformance (availability and correctness) both on the total val-idation set as well as on each histology subset (SupplementaryMaterial, Figs. S8 and S9).
As expected, ICOMS performance rates varied strongly, inparticular for cancer types, which were weakly represented inthe total cell line cohort. However, average rates were close toour previous prediction outcomes on the total CCLE data set(DTotal � 2%, DMax ¼ 6.2%) for 19 of 23 cancer types (Supple-mentary Material, Figs. S8 and S9). This provided a first confirm-ation of the general validity of our approach on cancer cell lines.
Secondly, we rated the performance of ICOMS on an inde-pendent validation panel of 431 patient tumor samples [TCGAdatabase (11–15)], which comprised equal portions of cancersoriginating from lung, kidney, breast and large intestine (Supple-mentary Material, Table S8). As the genes, which were capturedby CCLE and TCGA platforms, only partially overlapped, fre-quencies of some mutations were shifted between cell lines andprimary tumors (Supplementary Material, Fig. S10). Hence,mutation-derived coefficients of TCGA samples calculated onthe CCLE classification were naturally lower (e.g. large intestine,P ¼ 2.9 × 1028; lung, P ¼ 3.7 × 1024) than coefficients ofCCLE cell lines, so that mutation index thresholds had to beadapted for primary tumors (Supplementary Material, Table S9).
With this calibration, ICOMS achieved average sensitivity(58%) and specificity (71%) rates on TCGA samples, whichwere comparable with cell lines (Fig. 3E and Supplementary Ma-terial, Fig. S11 and Table S10). Concordantly, also primarytumors of large intestine, lung and kidney reached excellent out-comes (sensitivity ≥64%; specificity ≥68%), whereas predic-tion performance was still unsatisfactory for breast cancer(Fig. 3E, Supplementary Material, Fig. S11 and Table S10).
Clinical application of ICOMS algorithm
Several recent studies (74–79) have endeavored enormous tech-nical efforts to isolate circulating tumor cells (CTCs), whichhave sloughed off cancerous tissue, from peripheral patientblood. As typically only few tumor cells circulate in patientblood [5–50 CTCs per teaspoon of blood (79)], current diagnos-tic techniques are limited.
Although the sensitivity and specificity rates, which ICOMSreached on CCLE and TCGA data sets, were far too low forsafe clinical application, we exemplarily tested clinical feasibilityof ICOMS for this diagnostic purpose (Supplementary Material,Fig. S12). We analyzed sequencing data (68 cancer-associatedgenes) of CTCs, which were collected from peripheral blood oftwo colorectal cancer patients (80) according to our CCLE classi-fication (Supplementary Material, Table S3). Both samples werecorrectly allocated to large intestine. While diagnosis of Patient 1was unambiguous (secondary diagnosis), a diagnosis conflict(large intestine versus lung) had to be resolved for Patient 2 (Sup-plementary Material, Fig. S12).
Further application of mutation index classificationsand ICOMS prediction algorithm
Finally, we tested two further potential applications of ourclassification and prediction procedures (Fig. 4 and Supplementary
Material, Fig. S13). Parallel to classifications of general cancertypes, we first used our algorithms to render cancer sub-histologies.
For lung cancer, we found unique annotations for 148 of 172cell lines (Supplementary Material, Table S1), from which wederived a genomic lung cancer classification (Fig. 4). Again,we found that several strong genomic predictors were in concord-ance with literature (Fig. 4A). Mutations in KRAS (18,20,21,23),ALK (3,81,82), EGFR (1,2,18,20,21) and STK11 (18–20) wereassociated with the adenocarcinoma subtype, whereas alterationsof RB1 (83,84) and PTEN (83,85) predicted the small-cell (SCLC)histology (Fig. 4A). Mutation indices of large-cell (P ¼ 4.37 ×1027, LCLC) and squamous-cell (P ¼ 1.93 × 1028, SQLC) car-cinomas differed significantly from residual lung tumors. Theyhave been reported to exhibit higher spontaneous mutation rates(83), resulting in less recurrent and characteristic mutations,which could be used for sub-histology classification.
Nevertheless, mutation indices still showed strong accumula-tion on the diagonal (Fig. 4B) and discriminatory powers of mu-tation indices were strongly significant for small-cell (P ¼6.91 × 10229), large-cell (P ¼ 2.89 × 10218), squamous-cell(P ¼ 1.29 × 1028) and adenocarcinomas (P ¼ 5.77 × 10217).Accordingly, ICOMS performance was satisfactory on lungcancer in general (sensitivity: 81.1%, specificity: 95.0%)(Fig. 4C). The same held true for all subtypes except for large-cell carcinoma, which was erroneously mapped to small-celland adenocarcinomas in 33% of all diagnoses (Fig. 4C). Onthe TCGA lung cancer cohort (104 adenocarcinomas), ICOMSreached performance rates of 64.4% (sensitivity) and 97.0%(specificity), respectively (Fig. 4D).
Secondly, we sought to infer cell line response to specifickinase inhibitors from mutation spectra (Supplementary Mater-ial, Fig. S13). To thisend,we involvedscreeningdata of threecom-pounds (Erlotinib, PLX4720 and LBW242) across large panels ofcancer cell lines (n¼ 450; 443; 450) (Supplementary Material,Fig. S13A,B,C). In concordance with other studies (1,2), mutantEGFR was identified as strongest sensitivity marker for theEGFR-inhibitor Erlotinib (Supplementary Material, Fig. S13D).As reported previously (4,5,86), the BRAF-inhibitor PLX4720 dis-played strongest potency in BRAF-mutant lines (SupplementaryMaterial,Fig.S13E). The IRS1 gene,knownto modulate BRAFad-diction (87), was also associated with PLX4720 sensitivity. In con-trast, the TP53 gene emerged as strong predictor for PLX4720resistance, as the majority of sensitive lines (72%) were derivedfrom melanoma, which is known to exhibit low TP53 mutation fre-quency (88–90) (Supplementary Material, Fig. S13E). Moregenomic diversity was observed for the IAP-inhibitor LBW242(Supplementary Material, Fig. S13F). Here, mutations in FBXW7and NFKB2 pointed to alterations in pathways, which have beenassociated with the antineoplastic effect of IAP inhibitors in com-bination with steroids (91–94).
DISCUSSION
Our study developed a comprehensive framework of mathemat-ical approaches, which systematically capture the informationabout primary tumor sites that are conveyed by the mutationspectra of cell lines (Fig. 1A). For this purpose, we developeda novel mutation index, by which we established a classificationof site-specific genomic aberrations for each cancer type (Fig. 1B
1532 Human Molecular Genetics, 2014, Vol. 23, No. 6
Dow
nloaded from https://academ
ic.oup.com/hm
g/article-abstract/23/6/1527/733856 by guest on 05 April 2019

and Supplementary Material, Table S3). Based on this, we intro-duced ICOMS (Fig. 3A,B), a computational tool to infer theorigin of a cell line merely from its mutation spectrum (Supple-mentary Material, Tables S6 and S10). We demonstrated that therange of potential ICOMS applications might be extended, in-cluding the discrimination of sub-histologies (Fig. 4) as well asthe pre-selection of a suitable therapy regimen (SupplementaryMaterial, Fig. S13). In summary, we derive the following threemain conclusions from our analyses:
(1) Strong ICOMS performance on an independent cohortof primary tumors (Fig. 3E and Supplementary Material,TableS10)suggested that thisapproachmayamendmolecular-pathologic diagnostic procedures of tumor classification inambiguous cases. We exemplarily demonstrated its clinicalfeasibility to sequencing data of circulating tumor cells(Supplementary Material, Fig. S12).
(2) Tumor-specific mutation spectra differed strongly in size,recurrence and specificity between cancer types (Fig. 1Band Supplementary Material, Table S3). For this reason,cell lines of certain primary sites could be easier allocatedby ICOMS than others (Fig. 3C,E). This aspect shouldbe considered for further design and interpretation of cell
culture studies; it provides a way to identify those celllines, which are genomically marked-off and carry muta-tions that are characteristic of their respective origin.
(3) We employed mutation indices to characterize spectra ofgenomic aberrations that are characteristic of a particularcancer type. Thorough comparison to literature revealedthat these spectra were mainly in concordance with previousstudies (Fig. 1B and Supplementary Material, Mutation An-notation) (11–15,18–61). However, we also identifiedsome novel promising aberrations, which had not been asso-ciated with the respective histology before. Yet, most ofthese novel associations between cancer origin and mutationare still on an unconfirmed level and require further valid-ation by an independent sequencing method.
MATERIALS AND METHODS
Sequencing data and annotation of cell lines and patienttumor samples
We downloaded hybrid capture sequencing data of 905 cell lines(Supplementary Material, Table S1) as MAF-files from Broad-Novartis Cancer Cell Line Encyclopedia (CCLE) Download
Figure 4. (A) Biologically relevant meta-mutations of lung cancer subtypes are listed in mutation index descending order. (B) Bar plots of mutation-derived coeffi-cients of lung cancer subtypes. Color intensities mirror accumulation of mutation coefficients in each field. (C) ICOMS accuracy on lung cancer subtypes. All cell linesare incorporated equally into the calculation of the average fractions. (D) Mapping of annotated (top, TCGA) to predicted (bottom, ICOMS) lung cancer subtypes of104 primary lung adenocarcinoma samples. Samples, for which no computational diagnosis is available, are stained in navy blue.
Human Molecular Genetics, 2014, Vol. 23, No. 6 1533
Dow
nloaded from https://academ
ic.oup.com/hm
g/article-abstract/23/6/1527/733856 by guest on 05 April 2019

Portal (http://www.broadinstitute.org/ccle/home) (16). Add-itionally, we used CCLE cell line response data (half maximalgrowth inhibitory concentrations, GI50s) to the specific kinaseinhibitors Erlotinib, PLX4720 and LBW242 (Supplementary Ma-terial, Fig. S13A,B,C). Further cell line annotation data (primarytumor site and sub-histology type) were compiled from the CCLEdatabase (16) or, if not annotated, directly from the cell line pro-vider (ATCC, DSMZ, HSRRB and ECACC) (SupplementaryMaterial, Table S1).
Mutation calling data of 431 patient samples (MAF-files) wereobtained from TCGA (11) Data Portal (Data Matrix Access,https://tcga-data.nci.nih.gov/tcga/dataAccessMatrix.htm)(Supple-mentary Material, Table S8). These data had been submitted byBroad Institute (Lung Adenocarcinoma and Kidney Renal ClearCell Carcinoma) (12,13), Baylor College of Medicine (ColonAdenocarcinoma) (14) and Washington University School ofMedicine (Breast Invasive Carcinoma) (15). For each of thesecancer types, we selected �100 random samples for download(Supplementary Material, Table S8). Our analysis further includedsequencing data (68 cancer-associated genes) of circulating tumorcells (Supplementary Material, Fig. S12), collected from peripheralblood of two colorectal cancer patients (80).
Characterization of mutations by recurrence, ratingand mutation index
We called a mutation recurrent, if at least one independent mu-tation was tractable in the data set, so that the affected aminoacids of the two aberrations were displaced by at most oneposition (Supplementary Material, Table S2).
For each recurrent mutation, we determined its rating and mu-tation index. The rating denoted the number of cancer types, forwhich the mutation was predominantly detected (mutation asso-ciated types) (Supplementary Material, Methods). The mutationindex lt served as overall measure for the qualification of a mu-tation to discriminate between tissues. We derived the latter froma weighted product of conditional occurrence and histology like-lihood, incorporating histology-specific occurrence (mutationfrequency in mutation-associated histotypes), mutation-specificoccurrence (conditional probability of a mutation-associatedhistology upon mutation detection) and mutation renderingratio (ratio of frequency in mutation-associated histotypes andfrequency in the gt next most common histologies) (Supplemen-tary Material, Table S2 and Methods).
Based on this, we termed a mutation selective, if exactly onehistology was discriminated from the others, i.e. gt = 1 (Supple-mentary Material, Table S2, green). We considered a mutation asqualified for characterizing its associated cancer types, if lt ≥ 1.5.The latter threshold was derived from overall analysis ofhistology-wise specificity-sensitivity-patterns (receiver operatingcharacteristic (ROC) curves (66), data not shown).
Choice of meta-mutations
For each cancer type, we compiled a characteristic list of pair-wise disjoint meta-mutations (Supplementary Material,Table S3). The latter are collections of genomic alterations inthe same gene that can be combined for predicting a primarysite. We obtained them by maximizing a cardinality-penalizedversion of the mutation index lt (Supplementary Material,
Methods). We included all optimized meta-mutations, whichassociated with a single cancer type, in our genomic classifica-tion (Supplementary Material, Table S3, green). For each com-bination of gene and primary site, this resulted in one of thefollowing four relation types:
No Association the gene bears no meta-mutations, which areselective for the respective cancer type. Amino Acid Specific As-sociation the gene bears a collection of at most three recurrentaberrations, which are characteristic of the respective primarysite. Dissimilar alterations of the gene can still be associatedwith other sites. Mutation Recurrence Association the group ofrecurrent mutations detected in the gene is linked to the respect-ive tissue. Complete Mutation Spectrum Association all muta-tions in the gene, including sporadic alterations, are linked tothe respective tissue (Supplementary Material, Table S3 andMethods).
Inferring cancer origins from mutation spectra (ICOMS)
The ICOMS prediction procedure is composed of three mainsteps (Fig. 3A,B) and uses sample-wise mutation spectra, twocoefficient thresholds 1H≥dH (Supplementary Material, TablesS5 and S9) for each histotype H (upper threshold 1H, lowerthreshold dH), as well as a partial histology order (Supplemen-tary Material, Fig. S4) as input.
Given a mutation spectrum, we computed histology-specificmutation coefficients mH (Fig. 2 and Supplementary Material,Table S4) (step 1) and compared them with upper and lower thresh-olds 1H and dH (step 2) (Supplementary Material, Table S5). An Hwas associated as primary histotype, if the corresponding mH
exceeded 1H, whereas histologies, for which mH undercut dH,were excluded from further analysis of the mutation spectrum(excluded histotype) (Fig. 3A). For the residual histotypes, we didnot draw any conclusion (secondary histotype) in this step.
Finally, these assessments were combined to derive histologypredictions (step 3) (Fig. 3B, Supplementary Material, Tables S6and S10). If a unique histology had been primarily associated instep 2, it was chosen as computational diagnosis (primary diag-nosis). In case more than one existed, we tested whether the set ofprimary associations gained a unique maximum with respect tothe partial histology order defined in the input. If so (resolvableprimary diagnosis conflict), the maximum was chosen as finalprediction; if not, no diagnosis was available (unresolvableprimary diagnosis conflict). In case no primary histotypes wereavailable, we studied the set of secondary associations further.If the latter was unique, this sole histology was selected as pre-diction (secondary diagnosis); if the set was either empty (nomutations available) or not unique, then no diagnosis was avail-able (secondary diagnosis conflict) (Fig. 3B,D and Supplemen-tary Material, Methods).
Parameter calibration for ICOMS algorithm
In order to optimize upper and lower mutation coefficient thresh-olds (Supplementary Material, Tables S5 and S9), we calculatedtwo ROC analogs (66) per primary site (Supplementary Mater-ial, Fig. S3 and Methods). More precisely, we continuouslyvaried for each cancer type its associated mutation coefficientthreshold. We determined the fraction of samples, whichexceeded this threshold, separately for cell lines of the respective
1534 Human Molecular Genetics, 2014, Vol. 23, No. 6
Dow
nloaded from https://academ
ic.oup.com/hm
g/article-abstract/23/6/1527/733856 by guest on 05 April 2019

cancer type (n1, matched curve) as well as the complementarysubset (n2, control curve). Given (1|y1) and (1|y2) as coordinatesof matched and control curves, choosing 1 as upper thresholdresults in y1n1 correct and y2 n2 incorrect primary associations.Hence, the ratio y1n1/y2 n2 served as optimization term ofthe upper threshold. Analogously, given (d|y1) and (d|y2) ascoor-dinates of matched and control curves, setting the lower cutoff to dproduces1–y1 incorrectand1–y2 correctexclusionsofcancer typesfromdiagnosis, so that thequotient (n2 − y2n2)/(n1 − y1n1) servedas optimization term of the lower threshold (SupplementaryMaterial, Fig. S3).
Also the choice of a primary partial order (SupplementaryMaterial, Fig. S4) was carried out by a greedy algorithm tech-nique, iteratively selecting a new relation by maximizing the dif-ference between correct and incorrect primary conflict solutions.More precisely, starting from an empty set, a relation H1 . H2
was added, if the ratio of correct and incorrect primary conflictsolutions derived from the additional respective relation was atleast 3. If multiple alternatives for the subsequent choice existed,we selected the relation, for which the difference between correctand incorrect solutions was maximal. Finally, the primary partialorder was defined as convex hull of the relations selected (Supple-mentary Material, Fig. S4 and Methods).
Inferring compound sensitivity from mutation spectra
We dichotomically clustered cell lines into resistant and sensi-tive groups, according to their response (half maximal growth in-hibitory concentrations, GI50) to the specific kinase inhibitorsErlotinib (EGFR), PLX4720 (BRAF) or LBW242 (IAP) (Sup-plementary Material, Fig. S13A,B,C). As expected, resistantgroups were strongly over-represented (�97%) in the total cellline cohort. For each compound, we therefore compiled 50random cell line panels, which included all sensitive lines aswell as an equal number of resistant cell lines. For each randompanel, we determined a genomic sensitivity classification, com-prising meta-mutations and their mutation indices. We employedthem to calculate weighted averages of mutation indices, whereresistant and sensitive groups were equally assessed with contrarysigns (Supplementary Material, Fig. S13D,E,F). Similarly, wecalculated the weighted fraction of subsets (selective fraction),which rendered a meta-mutation as predictor for either of thetwo groups. Finally, we sorted the meta-mutations of eachgroup by mutation indices, in order to decipher the strongestgenomic markers for compound sensitivity or resistance (Supple-mentary Material, Fig. S13D,E,F).
SUPPLEMENTARY MATERIAL
Supplementary Material is available at HMG online.
ACKNOWLEDGEMENTS
We thank Drs. Markus Dietlein, Alexander Drzezga, FlorianMalchers, Martin Peifer, H. Christian Reinhardt and RomanK. Thomas for support and fruitful discussions.
FUNDING
Felix Dietlein is supported by the Deutsche Krebshilfe throughMildred-Scheel-Doktorandenprogramm (Grant 110770).
Conflict of Interest statement. None declared.
REFERENCES
1. Lynch, T.J., Bell, D.W., Sordella, R., Gurubhagavatula, S., Okimoto, R.A.,Brannigan, B.W., Harris, P.L., Haserlat, S.M., Supko, J.G., Haluska, F.G.et al. (2004) Activating mutations in the epidermal growth factor receptorunderlying responsiveness of non-small-cell lung cancer to gefitinib.N. Engl. J. Med., 350, 2129–2139.
2. Rosell, R., Carcereny, E., Gervais, R., Vergnenegre, A., Massuti, B., Felip,E., Palmero, R., Garcia-Gomez, R., Pallares, C., Sanches, J.M. et al. (2012)Erlotinib versus standard chemotherapy as first-line treatment for Europeanpatients with advanced EGFR mutation-positive non-small-cell lung cancer(EURTAC): a multicentre, open-label, randomised phase 3 trial. LancetOncol., 13, 239–246.
3. Kwak, E.L., Bang, Y.J., Camidge, D.R., Shaw, A.T., Solomon, B., Maki,R.G., Ou, S.H., Dezube, B.J., Janne, P.A., Costa, D.B. et al. (2010)Anaplastic lymphoma kinase inhibition in non-small-cell lung cancer.N. Engl. J. Med., 363, 1693–1703.
4. Flaherty, K.T., Infante, J.R., Daud, A., Gonzalez, R., Kefford, R.F., Sosman,J., Hamid, O., Schuchter, L., Cebon, J., Ibrahim, N. et al. (2012) CombinedBRAF and MEK inhibition in melanoma with BRAF V600 mutations.N. Engl. J. Med., 367, 1694–1703.
5. Bollag, G., Hirth, P., Tsai, J., Zhang, J., Ibrahim, P.N., Cho, H., Spevak, W.,Zhang, C., Zhang, Y., Habets, G. et al. (2010) Clinical efficacy of a RAFinhibitor needs broad target blockade in BRAF-mutant melanoma. Nature,467, 596–599.
6. Verma, S., Miles, D., Gianni, L., Krop, I.E., Welslau, M., Baselga, J.,Pegram, M., Oh, D.Y., Dieras, V., Guardino, E. et al. (2012) Trastuzumabemtansine for HER2-positive advanced breast cancer. N. Engl. J. Med., 367,1783–1791.
7. Harris, T. (2010) Gene and drug matrix for personalized cancer therapy. Nat.Rev. Drug Discov., 9, 660.
8. Garnett, M.J., Edelman, E.J., Heidorn, S.J., Greenman, C.D., Dastur, A.,Lau, K.W., Greninger, P., Thompson, I.R., Luo, X., Soares, J. et al. (2012)Systematic identification of genomic markers of drug sensitivity in cancercells. Nature, 483, 570–575.
9. Sos, M.L., Dietlein, F., Peifer, M., Schottle, J., Balke-Want, H., Muller, C.,Koker, M., Richters, A., Heynck, S., Malchers, F. et al. (2012) A frameworkfor identification of actionable cancer genome dependencies in small celllung cancer. Proc. Natl. Acad. Sci. USA., 109, 17034–17039.
10. Sos, M.L., Michel, K., Zander, T., Weiss, J., Frommolt, P., Peifer, M., Li, D.,Ullrich, R., Koker, M., Fischer, M. et al. (2009) Predicting drugsusceptibility of non-small cell lung cancers based on genetic lesions.J. Clin.Invest., 119, 1727–1740.
11. Network TCGAR (2008) Comprehensive genomic characterization defineshuman glioblastoma genes and core pathways. Nature, 455, 1061–1068.
12. Network CGAR (2012) Comprehensive genomic characterization ofsquamous cell lung cancers. Nature, 489, 519–525.
13. Network TCGAR (2013) Comprehensive molecular characterization ofclear cell renal cell carcinoma. Nature, 499, 43–49.
14. Network CGA (2012) Comprehensive molecular characterization of humancolon and rectal cancer. Nature, 487, 330–337.
15. Network CGA (2012) Comprehensive molecular portraits of human breasttumours. Nature, 490, 61–70.
16. Barretina, J., Caponigro, G., Stransky, N., Venkatesan, K., Margolin, A.A.,Kim, S., Wilson, C.J., Lehar, J., Kryukov, G.V., Sonkin, D. et al. (2012) TheCancer Cell Line Encyclopedia enables predictive modelling of anticancerdrug sensitivity. Nature, 483, 603–607.
17. Adzhubei, I.A., Schmidt, S., Peshkin, L., Ramensky, V.E., Gerasimova, A.,Bork, P., Kondrashov, A.S. and Sunyaev, S.R. (2010) A method and serverfor predicting damaging missense mutations. Nat. Methods, 7, 248–249.
18. Ding, L., Getz, G., Wheeler, D.A., Mardis, E.R., McLellan, M.D., Cibulskis,K., Sougnez, C., Greulich, H., Muzny, D.M., Morgan, M.B. et al. (2008)Somatic mutations affect key pathways in lung adenocarcinoma. Nature,455, 1069–1075.
19. Sanchez-Cespedes, M., Parrella, P., Esteller, M., Nomoto, S., Trink, B.,Engles, J.M., Westra, W.H., Herman, J.G. and Sidransky, D. (2002)Inactivation of LKB1/STK11 is a common event in adenocarcinomas of thelung. Cancer Res., 62, 3659–3662.
20. Gao, B., Sun, Y., Zhang, J., Ren, Y., Fang, R., Han, X., Shen, L., Liu, X.Y.,Pao, W., Chen, H. et al. (2010) Spectrum of LKB1, EGFR, and KRAS
Human Molecular Genetics, 2014, Vol. 23, No. 6 1535
Dow
nloaded from https://academ
ic.oup.com/hm
g/article-abstract/23/6/1527/733856 by guest on 05 April 2019

mutations in Chinese lung adenocarcinomas. J. Thorac. Oncol., 5, 1130–1135.
21. Dogan, S., Shen, R., Ang, D.C., Johnson, M.L., D’Angelo, S.P., Paik, P.K.,Brzostowski, E.B., Riely, G.J., Kris, M.G., Zakowski, M.F. et al. (2012)Molecular epidemiology of EGFR and KRAS mutations in 3,026 lungadenocarcinomas: higher susceptibility of women to smoking-relatedKRAS-mutant cancers. Clin. Cancer Res., 18, 6169–6177.
22. Liu, C.X., Li,Y., Obermoeller-McCormick,L.M.,Schwartz, A.L. and Bu, G.(2001) The putative tumor suppressor LRP1B, a novel member of the lowdensity lipoprotein (LDL) receptor family, exhibits both overlapping anddistinct properties with the LDL receptor-related protein. J. Biol. Chem.,276, 28889–28896.
23. Riely, G.J., Marks, J. and Pao, W. (2009) KRAS mutations in non-small celllung cancer. Proc. Am. Thorac. Soc., 6, 201–205.
24. Hammerman, P.S., Sos, M.L., Ramos, A.H., Xu, C., Dutt, A., Zhou, W.,Brace, L.E., Woods, B.A., Lin, W., Zhang, J. et al. (2011) Mutations in theDDR2 kinase gene identify a novel therapeutic target in squamous cell lungcancer. Cancer Discov., 1, 78–89.
25. Davies, H., Bignell, G.R., Cox, C., Stephens, P., Edkins, S., Clegg, S.,Teague, J., Woffendin, H., Garnett, M.J., Bottomley, W. et al. (2002)Mutations of the BRAF gene in human cancer. Nature, 417, 949–954.
26. Safaee Ardekani, G., Jafarnejad, S.M., Tan, L., Saeedi, A. and Li, G. (2012)The prognostic value of BRAF mutation in colorectal cancer and melanoma:a systematic review and meta-analysis. PLoS One, 7, e47054.
27. Chapman, P.B., Hauschild, A., Robert, C., Haanen, J.B., Ascierto, P., Larkin,J., Dummer, R., Garbe, C., Testori, A., Maio, M. et al. (2011) Improvedsurvival with vemurafenib in melanoma with BRAF V600E mutation.N. Engl. J. Med., 364, 2507–2516.
28. Bowen, D.T., Frew, M.E., Hills, R., Gale, R.E., Wheatley, K., Groves, M.J.,Langabeer, S.E., Kottaridis, P.D., Moorman, A.V., Burnett, A.K. et al.(2005) RAS Mutation in acute myeloid leukemia is associated with distinctcytogenetic subgroups but does not influence outcome in patients youngerthan 60 years. Blood, 106, 2113–2119.
29. Bacher, U., Haferlach, T., Schoch, C., Kern, W. and Schnittger, S. (2006)Implications of NRAS mutations in AML: a study of 2502 patients. Blood,107, 3847–3853.
30. Farr, C.J., Saiki, R.K., Erlich, H.A., McCormick, F. and Marshall, C.J.(1988) Analysis of RAS gene mutations in acute myeloid leukemia bypolymerase chain reaction and oligonucleotide probes. Proc. Natl. Acad.Sci. U. S. A., 85, 1629–1633.
31. Neubauer, A., Maharry, K., Mrozek, K., Thiede, C., Marcucci, G., Paschka,P., Mayer, R.J., Larson, R.A., Liu, E.T. and Bloomfield, C.D. (2008) Patientswith acute myeloid leukemia and RAS mutations benefit most frompostremission high-dose cytarabine: a Cancer and Leukemia Group B study.J. Clin. Oncol., 26, 4603–4609.
32. Bahram, F., von der Lehr, N., Cetinkaya, C. and Larsson, L.G. (2000) c-Mychot spot mutations in lymphomas result in inefficient ubiquitination anddecreased proteasome-mediated turnover. Blood, 95, 2104–2110.
33. Bhatia, K., Spangler, G., Gaidano, G., Hamdy, N., Dalla-Favera, R. andMagrath, I. (1994) Mutations in the coding region of c-myc occur frequentlyin acquired immunodeficiency syndrome-associated lymphomas. Blood, 84,883–888.
34. Smith-Sørensen, B., Hijmans, E.M., Beijersbergen, R.L. and Bernards, R.(1996) Functional analysis of burkitt’s lymphoma mutant c-Myc proteins.J. Biol. Chem., 271, 5513–5518.
35. Le Gallo, M., O’Hara, A.J., Rudd, M.L., Urick, M.E., Hansen, N.F., O’Neil,N.J., Price, J.C., Zhang, S., England, B.M., Godwin, A.K. et al. (2012)Exome sequencing of serous endometrial tumors identifies recurrent somaticmutations in chromatin-remodeling and ubiquitin ligase complex genes.Nat. Genet., 44, 1310–1315.
36. Maeda, D. and Shih, I.E.M. (2013) Pathogenesis and the role of ARID1Amutation in endometriosis-related ovarian neoplasms. Adv. Anat. Pathol.,20, 45–52.
37. Wu, J.N. and Roberts, C.W. (2013) ARID1A mutations in cancer: anotherepigenetic tumor suppressor? Cancer Discov., 3, 35–43.
38. Wiegand, K.C., Lee, A.F., Al-Agha, O.M., Chow, C., Kalloger, S.E., Scott,D.W., Steidl, C., Wiseman, S.M., Gascoyne, R.D., Gilks, B. et al. (2011)Loss of BAF250a (ARID1A) is frequent in high-grade endometrialcarcinomas. J. Pathol., 224, 328–333.
39. Risinger, J.I., Hayes, A.K., Berchuck, A. and Barrett, J.C. (1997) PTEN/MMAC1 mutations in endometrial cancers. Cancer Res., 57, 4736–4738.
40. Kong, D., Suzuki, A., Zou, T.T., Sakurada, A., Kemp, L.W., Wakatsuki, S.,Yokoyama, T., Yamakawa, H., Furukawa, T., Sato, M. et al. (1997) PTEN1
is frequently mutated in primary endometrial carcinomas. Nat. Genet., 17,143–144.
41. Bussaglia, E., del Rio, E., Matias-Guiu, X. and Prat, J. (2000) PTENmutations in endometrial carcinomas: a molecular and clinicopathologicanalysis of 38 cases. Hum. Pathol., 31, 312–317.
42. Dedes, K.J., Wetterskog, D., Mendes-Pereira, A.M., Natrajan, R., Lambros,M.B., Geyer, F.C., Vatcheva, R., Savage, K., Mackay, A., Lord, C.J. et al.(2010) PTEN Deficiency in endometrioid endometrial adenocarcinomaspredicts sensitivity to PARP inhibitors. Sci. Transl. Med., 2, 53ra75.
43. Risinger, J.I., Hayes, K., Maxwell, G.L., Carney, M.E., Dodge, R.K., Barrett,J.C. and Berchuck, A. (1998) PTEN mutation in endometrial cancers isassociated with favorable clinical and pathologic characteristics. Clin.
Cancer Res., 4, 3005–3010.44. Tashiro, H., Blazes, M.S., Wu, R., Cho, K.R., Bose, S., Wang, S.I., Li, J.,
Parsons, R. and Ellenson, L.H. (1997) Mutations in PTEN are frequent inendometrial carcinoma but rare in other common gynecologicalmalignancies. Cancer Res., 57, 3935–3940.
45. Rowan, A.J., Lamlum, H., Ilyas, M., Wheeler, J., Straub, J., Papadopoulou,A., Bicknell, D., Bodmer,W.F. and Tomlinson, I.P. (2000) APC mutations insporadic colorectal tumors: a mutational ‘hotspot’ and interdependence ofthe ‘two hits’. Proc. Natl. Acad. Sci. USA, 97, 3352–3357.
46. Fodde, R. (2002) The APC gene in colorectal cancer. Eur. J. Cancer, 38,867–871.
47. Yang, J., Zhang, W., Evans, P.M., Chen, X., He, X. and Liu, C. (2006)Adenomatous polyposis coli (APC) differentially regulates beta-cateninphosphorylation and ubiquitination in coloncancer cells. J. Biol.Chem., 281,17751–17757.
48. Beck, S.E., Jung, B.H., Fiorino, A., Gomez, J., Rosario, E.D., Cabrera, B.L.,Huang, S.C., Chow, J.Y. and Carethers, J.M. (2006) Bone morphogeneticprotein signaling and growth suppression in colon cancer. Am. J. Physiol.Gastrointest. Liver Physiol., 291, 135–145.
49. Park, S.W., Hur, S.Y., Yoo, N.J. and Lee, S.H. (2010) Somatic frameshiftmutations of bone morphogenic protein receptor 2 gene in gastric andcolorectal cancers with microsatellite instability. APMIS, 118, 824–829.
50. Slattery, M.L., Lundgreen, A., Herrick, J.S., Kadlubar, S., Caan, B.J., Potter,J.D. and Wolff,R.K. (2012) Geneticvariation in bonemorphogenetic proteinand colon and rectal cancer. Int. J. Cancer, 130, 653–664.
51. Spambalg, D., Sharifi, N., Elisei, R., Gross, J.L., Medeiros-Neto, G. andFagin, J.A. (1996) Structural studies of the thyrotropin receptor and Gs alphain human thyroid cancers: low prevalence of mutations predicts infrequentinvolvement in malignant transformation. J. Clin. Endocrinol. Metab., 81,3898–3901.
52. Matsuo, K., Friedman, E., Gejman, P.V. and Fagin, J.A. (1993) Thethyrotropin receptor (TSH-R) is not an oncogene for thyroid tumors:structural studies of the TSH-R and the alpha-subunit of Gs in human thyroidneoplasms. J. Clin. Endocrinol. Metab., 76, 1446–1451.
53. Russo, D., Arturi, F., Schlumberger, M., Caillou, B., Monier, R., Filetti, S.and Suarez, H.G. (1995) Activating mutations of the TSH receptor indifferentiated thyroid carcinomas. Oncogene, 11, 1907–1911.
54. Cetani, F., Tonacchera, M., Pinchera, A., Barsacchi, R., Basolo, F., Miccoli,P. and Pacini, F. (1999) Genetic analysis of the TSH receptor gene indifferentiated human thyroid carcinomas. J. Endocrinol. Invest., 22,273–278.
55. Tajima, T., Tsubaki, J. and Fujieda, K. (2005) Two novel mutations in thethyroid peroxidase gene with goitrous hypothyroidism. Endocr. J., 52,643–645.
56. Altmann, K., Hermanns, P., Muhlenberg, R., Fricke-Otto, S., Wentzell, R.and Pohlenz, J. (2013) Congenital goitrous primary hypothyroidism in TwoGerman families caused by novel thyroid peroxidase (TPO) gene mutations.Exp. Clin. Endocrinol. Diabetes, 121, 343–346.
57. Moore, L.E., Nickerson, M.L., Brennan, P., Toro, J.R., Jaeger, E., Rinsky, J.,Han, S.S., Zaridze, D., Matveev, V., Janout, V. et al. (2011) Von Hippel-Lindau (VHL) inactivation in sporadic clear cell renal cancer: associationswith germline VHL polymorphisms and etiologic risk factors. PLoS Genet., 7,e1002312.
58. Hemminki, K., Jiang, Y., Ma, X., Yang, K., Egevad, L. and Lindblad, P.(2002) Molecular epidemiology of VHL gene mutations in renal cellcarcinoma patients: relation to dietary and other factors. Carcinogenesis, 23,809–815.
59. Schietke, R.E., Hackenbeck, T., Tran, M., Gunther, R., Klanke, B.,Warnecke, C.L., Knaup, K.X., Shukla, D., Rosenberger, C., Koesters, R.et al. (2012) Renal tubular HIF-2a expression requires VHL inactivation andcauses fibrosis and cysts. PLoS One, 7, e31034.
1536 Human Molecular Genetics, 2014, Vol. 23, No. 6
Dow
nloaded from https://academ
ic.oup.com/hm
g/article-abstract/23/6/1527/733856 by guest on 05 April 2019

60. Kim, W.Y. and Kaelin, W.G. (2004) Role of VHL gene mutation in humancancer. J. Clin. Oncol., 22, 4991–5004.
61. Cheng, L., Zhang, S., MacLennan, G.T., Lopez-Beltran, A. and Montironi,R. (2009) Molecular and cytogenetic insights into the pathogenesis,classification, differential diagnosis, and prognosis of renal epithelialneoplasms. Hum. Pathol., 40, 10–29.
62. Sharma, S.V., Bell, D.W., Settleman, J. and Haber, D.A. (2007) Epidermalgrowth factor receptor mutations in lung cancer. Nat. Rev. Cancer, 7,169–181.
63. Kim, S.T., Lim do, H., Jang, K.T., Lim, T., Lee, J., Choi, Y.L., Jang, H.L., Yi,J.H., Baek, K.K., Park, S.H. et al. (2011) Impact of KRAS mutations onclinical outcomes in pancreatic cancer patients treated with first-linegemcitabine-based chemotherapy. Mol. Cancer Ther., 10, 1993–1999.
64. Laghi, L., Orbetegli, O., Bianchi, P., Zerbi, A., Di Carlo, V., Boland, C.R.and Malesci, A. (2002) Common occurrence of multiple K-RAS mutationsin pancreatic cancers with associatedprecursor lesions and in biliary cancers.Oncogene, 21, 4301–4306.
65. Collins, M.A., Bednar, F., Zhang, Y., Brisset, J.C., Galban, S., Galban, C.J.,Rakshit, S., Flannagan, K.S., Adsay, N.V. and Pasca di Magliano, M. (2012)Oncogenic Kras is required for both the initiation and maintenance ofpancreatic cancer in mice. J. Clin. Invest., 122, 639–653.
66. Sing, T., Sander, O., Beerenwinkel, N. and Lengauer, T. (2005) ROCR:visualizing classifier performance in R. Bioinformatics, 21, 3940–3941.
67. Maass, W. (2000) On the computational power of winner-take-all. Neural.Comput., 12, 2519–2535.
68. Kalady, M.F., Dejulius, K.L., Sanchez, J.A., Jarrar, A., Liu, X., Manilich, E.,Skacel, M. and Church, J.M. (2012) BRAF mutations in colorectal cancer areassociated with distinct clinical characteristics and worse prognosis. Dis.Colon Rectum, 55, 128–133.
69. Xing, M. (2005) BRAF mutation in thyroid cancer. Endocr. Relat. Cancer,12, 245–246.
70. Tufano, R.P., Teixeira, G.V., Bishop, J., Carson, K.A. and Xing, M. (2012)BRAF mutation in papillary thyroid cancer and its value in tailoring initialtreatment: a systematic review and meta-analysis. Medicine (Baltimore), 91,274–286.
71. Li, J., Yen, C., Liaw, D., Podsypanina, K., Bose, S., Wang, S.I., Puc, J.,Miliaresis, C., Rodgers, L., McCombie, R. et al. (1997) PTEN, a putativeprotein tyrosine phosphatase gene mutated in human brain, breast, andprostate cancer. Science, 275, 1943–1947.
72. Duerr, E.M., Rollbrocker, B., Hayashi, Y., Peters, N., Meyer-Puttlitz, B.,Louis, D.N., Schramm, J., Wiestler, O.D., Parsons, R., Eng, C. et al. (1998)PTEN Mutations in gliomas and glioneuronal tumors. Oncogene, 16,2259–2264.
73. Yang, Y., Shao, N., Luo, G., Li, L., Zheng, L., Nilsson-Ehle, P. and Xu, N.(2010) Mutations of PTEN gene in gliomas correlate to tumor differentiationand short-term survival rate. Anticancer Res., 30, 981–985.
74. Vona, G., Sabile, A., Louha, M., Sitruk, V., Romana, S., Schutze, K., Capron,F., Franco, D., Pazzagli, M., Vekemans, M. et al. (2000) Isolation by size ofepithelial tumor cells: a new method for the immunomorphological andmolecular characterization of circulating tumor cells. Am. J. Pathol., 156,57–63.
75. Nagrath, S., Sequist, L.V., Maheswaran, S., Bell, D.W., Irimia, D., Ulkus, L.,Smith, M.R., Kwak, E.L., Digumarthy, S., Muzikansky, A. et al. (2007)Isolation of rare circulating tumour cells in cancer patients by microchiptechnology. Nature, 450, 1235–1239.
76. Yu, M., Ting, D.T., Stott, S.L., Wittner, B.S., Ozsolak, F., Paul, S., Ciciliano,J.C., Smas, M.E.,Winokur,D., Gilman,A.J. et al. (2012) RNA sequencingofpancreatic circulating tumour cells implicates WNT signalling in metastasis.Nature, 487, 510–513.
77. Maheswaran, S., Sequist, L.V., Nagrath, S., Ulkus, L., Brannigan, B.,Collura, C.V., Inserra, E., Diederichs, S., Iafrate, A.J., Bell, D.W. et al.(2008) Detection of mutations in EGFR in circulating lung-cancer cells.N. Engl. J. Med., 359, 366–377.
78. Hou, H.W., Warkiani, M.E., Khoo, B.L., Li, Z.R., Soo, R.A., Tan, D.S., Lim,W.T., Han, J., Bhagat, A.A. and Lim, C.T. (2013) Isolation and retrieval ofcirculating tumor cells using centrifugal forces. Sci. Rep., 3, 1259.
79. Williams, S.C. (2013) Circulating tumor cells. Proc. Natl. Acad. Sci. USA.,110, 4861.
80. Heitzer, E., Auer, M., Gasch, C., Pichler, M., Ulz, P., Hoffmann, E.M., Lax,S., Waldispuehl-Geigl, J., Mauermann, O., Lackner, C. et al. (2013)Complex tumor genomes inferred from single circulating tumor cells byarray-CGH and next-generation sequencing. Cancer Res., 73, 2965–2975.
81. Soda, M., Choi, Y.L., Enomoto, M., Takada, S., Yamashita, Y., Ishikawa, S.,Fujiwara, S., Watanabe, H., Kurashina, K., Hatanaka, H. et al. (2007)Identification of the transforming EML4-ALK fusion gene in non-small-celllung cancer. Nature, 448, 561–566.
82. Koivunen, J.P., Mermel, C., Zejnullahu, K., Murphy, C., Lifshits, E.,Holmes, A.J., Choi, H.G., Kim, J., Chiang, D., Thomas, R. et al. (2008)EML4-ALK fusion gene and efficacy of an ALK kinase inhibitor in lungcancer. Clin. Cancer Res., 14, 4275–4283.
83. Peifer, M., Fernandez-Cuesta, L., Sos, M.L., George, J., Seidel, D., Kasper,L.H., Plenker, D., Leenders, F., Sun, R., Zander, T. et al. (2012) Integrativegenome analyses identify key somatic driver mutations of small-cell lungcancer. Nat. Genet., 44, 1104–1110.
84. Harbour, J.W., Lai, S.L., Whang-Peng, J., Gazdar, A.F., Minna, J.D. andKaye, F.J. (1988) Abnormalities in structure and expression of the humanretinoblastoma gene in SCLC. Science, 241, 353–357.
85. Kim, S.K., Su, L.K., Oh, Y., Kemp, B.L., Hong, W.K. and Mao, L. (1998)Alterations of PTEN/MMAC1, a candidate tumor suppressor gene, and itshomologue,PTH2, in small cell lung cancer cell lines. Oncogene, 16, 89–93.
86. Tsai, J., Lee, J.T., Wang, W., Zhang, J., Cho, H., Mamo, S., Bremer, R.,Gillette, S., Kong, J., Haass, N.K. et al. (2008) Discovery of a selectiveinhibitor of oncogenic B-Raf kinase with potent antimelanoma activity.Proc. Natl. Acad. Sci. USA., 105, 3041–3046.
87. Reuveni, H., Flashner-Abramson, E., Steiner, L., Makedonski, K., Song, R.,Shir, A., Herlyn, M., Bar-Eli, M. and Levitzki, A. (2013) Therapeuticdestruction of insulin receptor substrates for cancer treatment. Cancer Res.,73, 4383–4394.
88. Castresana, J.S., Rubio, M.P., Vazquez, J.J., Idoate, M., Sober, A.J.,Seizinger, B.R. and Barnhill, R.L. (1993) Lack of allelic deletion and pointmutation as mechanisms of p53 activation in human malignant melanoma.Int. J. Cancer, 55, 562–565.
89. Papp, T., Jafari, M. and Schiffmann, D. (1996) Lack of p53 mutations andloss of heterozygosity in non-cultured human melanocytic lesions. J. Cancer
Res. Clin. Oncol., 122, 541–548.90. Houben, R., Hesbacher, S., Schmid, C.P., Kauczok, C.S., Flohr, U.,
Haferkamp, S., Muller, C.S., Schramma, D., Wischhusen, J. and Becker, J.C.(2011) High-level expression of wild-type p53 in melanoma cells isfrequently associated with inactivity in p53 reporter gene assays. PLoS One,6, e22096.
91. Sionov, R.V. (2013) MicroRNAs and glucocorticoid-induced apoptosis inlymphoid malignancies. ISRN Hematol., 2013, 348212.
92. Petrucci, E., Pasquini, L., Bernabei, M., Saulle, E., Biffoni, M., Accarpio, F.,Sibio, S., Di Giorgio, A., Di Donato, V., Casorelli, A. et al. (2012) A smallmolecule SMAC mimic LBW242 potentiates TRAIL- and anticancerdrug-mediated cell death of ovarian cancer cells. PLoS One, 7, e35073.
93. Eschenburg, G., Eggert, A., Schramm, A., Lode, H.N. and Hundsdoerfer, P.(2012) Smac mimetic LBW242 sensitizes XIAP-overexpressingneuroblastoma cells for TNF-a-independent apoptosis. Cancer Res., 72,2645–2656.
94. Dai, Y., Rahmani, M., Dent, P. and Grant, S. (2005) Blockade of histonedeacetylase inhibitor-induced relA/p65 acetylation and NF-kappaBactivationpotentiates apoptosis in leukemiacells througha processmediatedby oxidative damage, XIAP downregulation, and c-Jun N-terminal kinase 1activation. Mol. Cell. Biol., 25, 5429–5444.
Human Molecular Genetics, 2014, Vol. 23, No. 6 1537
Dow
nloaded from https://academ
ic.oup.com/hm
g/article-abstract/23/6/1527/733856 by guest on 05 April 2019