COMPARATIVE ANALYSIS OF THE BUSINESS … 3/Issue 2, 2017/Kehkashan... · Bank Ltd, Bank Islami...
39
Global Journal of Management, Social Sciences & Humanities 182 Vol 3 (2) April-June, 2017 Page # 182-220. ISSN 2520-7113 (Print). ISSN 2520-7121 (Online) www.gjmsweb.com. [email protected] _________________________________________________________________ COMPARATIVE ANALYSIS OF THE BUSINESS PRODUCTS OF ISLAMIC AND CONVENTIONAL BANKS IN PAKISTAN Syeda Kehkshan Iqbal 1 , Abdul Ghafoor Awan 2 ABSTRACT The objective of this paper is to carry out comparative analysis of the business products of Islamic and conventional banks in Pakistan. For this purpose, we selected five banks each from both segments of banking sector as a sample of study. The sampling banks include: Meezan Bank Ltd, Al Baraka Bank Ltd, Habib Metropolitan Bank Ltd, Dubai Islamic Bank Ltd, Bank Islami Pakistan Ltd, Burj Bank Ltd, Askari Bank Ltd, Soneri Bank Ltd, Alfalah Bank Ltd and Bank Al Habib Ltd. Ratio analysis technique was used to analyze the financial indicators of these banks. The results show that profitability of greater than Islamic banks because conventional banks charge fixed interest against Islamic banks which provide financing to their clients on profit and loss basis. However, the customers of Islamic banks are more satisfied over efficient services and wide range of Shariah based business products. As Islamic banks have been established to promote real economy and to avoid being involved in speculative and unethical activities so their focus is on financial projects which are real and productive that will yield profit both for banks and entrepreneurs. Our results further show that conventional banks return on assets and deposits are more than
Transcript of COMPARATIVE ANALYSIS OF THE BUSINESS … 3/Issue 2, 2017/Kehkashan... · Bank Ltd, Bank Islami...
Global Journal of Management, Social Sciences & Humanities 182 Vol 3 (2) April-June, 2017 Page # 182-220. ISSN 2520-7113 (Print). ISSN 2520-7121 (Online) www.gjmsweb.com. [email protected]
_________________________________________________________________
COMPARATIVE ANALYSIS OF THE BUSINESS
PRODUCTS OF ISLAMIC AND CONVENTIONAL
BANKS IN PAKISTAN
Syeda Kehkshan Iqbal 1, Abdul Ghafoor Awan 2
ABSTRACT
The objective of this paper is to carry out comparative analysis of the
business products of Islamic and conventional banks in Pakistan. For
this purpose, we selected five banks each from both segments of banking
sector as a sample of study. The sampling banks include: Meezan Bank
Ltd, Al Baraka Bank Ltd, Habib Metropolitan Bank Ltd, Dubai Islamic
Bank Ltd, Bank Islami Pakistan Ltd, Burj Bank Ltd, Askari Bank Ltd,
Soneri Bank Ltd, Alfalah Bank Ltd and Bank Al Habib Ltd. Ratio
analysis technique was used to analyze the financial indicators of these
banks. The results show that profitability of greater than Islamic banks
because conventional banks charge fixed interest against Islamic banks
which provide financing to their clients on profit and loss basis.
However, the customers of Islamic banks are more satisfied over
efficient services and wide range of Shariah based business products. As
Islamic banks have been established to promote real economy and to
avoid being involved in speculative and unethical activities so their
focus is on financial projects which are real and productive that will
yield profit both for banks and entrepreneurs. Our results further show
that conventional banks return on assets and deposits are more than

Global Journal of Management, Social Sciences & Humanities 183 Vol 3 (2) April-June, 2017 Page # 182-220. ISSN 2520-7113 (Print). ISSN 2520-7121 (Online) www.gjmsweb.com. [email protected]
_________________________________________________________________
Islamic banks while there is negligible difference in the earning per
share of both conventional and Islamic banks. We recommend that
Islamic banks should expand their outreach and focus particularly the
rural areas where the customers are more religious mind and committed
to their faith.
Key words: Return on Assets, EPS, PLS, Interest Rate, Return on Equity, Net
Profit.
Paper received: 30.11.2016
Paper accepted: 10.01.2017
Online published: 01.04.2017
_______________________________________________________________
1. MS Scholar, Department of Management Science, Institute of Southern
Punjab-Multan. [email protected].
2. Professor & Dean, Faculty of Management and Social Sciences, Institute of
Southern Punjab, Multan-Pakistan. [email protected].
Cell # 923136015051.
_______________________________________________________________
1. INTRODUCTION
A system of banking based on the statutes of Islamic law and economics.
Paying or collecting interest or Riba, is prohibited by Islamic law, sharing profit
and loss is a banking principle and shareholder capital and deposits are kept
separate to ensure fair revenue sharing. Islamic banking in its private stage first
began with the worldwide festival of the establishment of the 15thHijra Century
(Islamic Calendar) in the mid-70s. In 1974 the world’s first development bank
agreement with sharia, the Islamic Development Bank was recognized. Islamic
banking method is different from Conventional banking. Riba used in Islamic
banking and interest term used in Conventional banking. In Islamic banking

Global Journal of Management, Social Sciences & Humanities 184 Vol 3 (2) April-June, 2017 Page # 182-220. ISSN 2520-7113 (Print). ISSN 2520-7121 (Online) www.gjmsweb.com. [email protected]
_________________________________________________________________
Ijara, Musharakah and Mudarabah terms are used for Leasing, Profit sharing and
equity financing. Interest is forbidden in Islam. (Shehta, D.S.I, (2013) observing
the concept from the prospects of an Islamic economy and the eventual role to
be played by an Islamic bank within opines that “It is therefore, natural and,
really, imperative for an Islamic bank to incorporate in its functions and practices
commercial investment and social activities, as an organization designed to
stimulate the civilized mission of an Islamic economy.”
1.1. Main Research Question
The main research question is given below:
“Comparative analysis of the business products of Islamic and Conventional
banks in Pakistan”
The main purpose of this research is to examine the business products of Islamic
banking with the conventional banking in the perception of overall working of
banking sector in Pakistan.
1.2 Objectives of the Study
There are four objectives of this study, which are stated below: -
► To study the basic principles of Islamic Banking.
► To compare the products of Islamic Banks.
► To measure the profitability of both Islamic and Conventional banks.
► To examine the performance of Islamic and Conventional Banks.
This research tells us that how both banks work in Pakistan. Which banks are
financially strong Islamic or conventional. Five Islamic and Five Conventional
banks are selected for comparison of business products.
Global Journal of Management, Social Sciences & Humanities 185 Vol 3 (2) April-June, 2017 Page # 182-220. ISSN 2520-7113 (Print). ISSN 2520-7121 (Online) www.gjmsweb.com. [email protected]
_________________________________________________________________
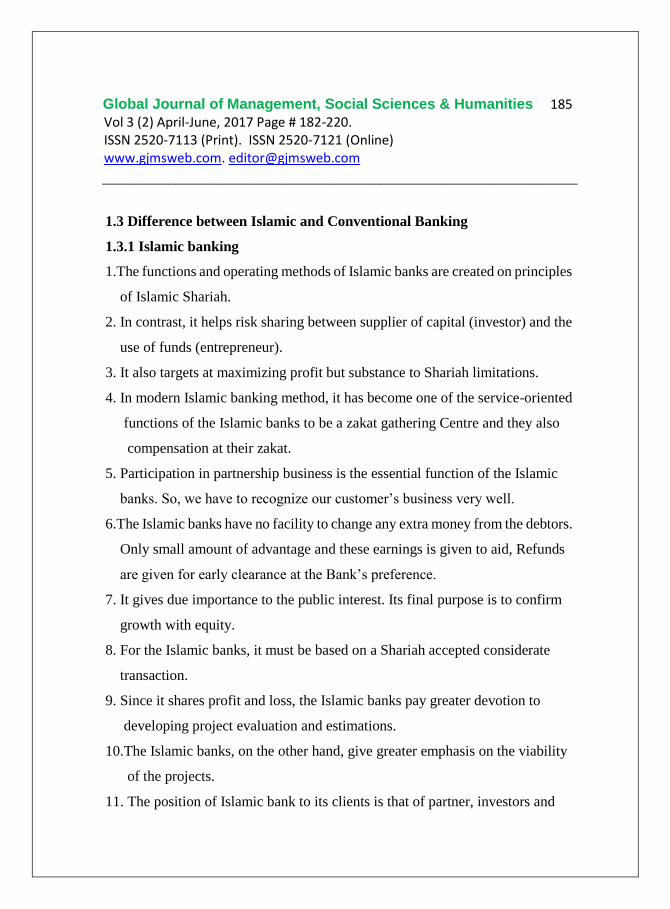
1.3 Difference between Islamic and Conventional Banking
1.3.1 Islamic banking
1.The functions and operating methods of Islamic banks are created on principles
of Islamic Shariah.
2. In contrast, it helps risk sharing between supplier of capital (investor) and the
use of funds (entrepreneur).
3. It also targets at maximizing profit but substance to Shariah limitations.
4. In modern Islamic banking method, it has become one of the service-oriented
functions of the Islamic banks to be a zakat gathering Centre and they also
compensation at their zakat.
5. Participation in partnership business is the essential function of the Islamic
banks. So, we have to recognize our customer’s business very well.
6.The Islamic banks have no facility to change any extra money from the debtors.
Only small amount of advantage and these earnings is given to aid, Refunds
are given for early clearance at the Bank’s preference.
7. It gives due importance to the public interest. Its final purpose is to confirm
growth with equity.
8. For the Islamic banks, it must be based on a Shariah accepted considerate
transaction.
9. Since it shares profit and loss, the Islamic banks pay greater devotion to
developing project evaluation and estimations.
10.The Islamic banks, on the other hand, give greater emphasis on the viability
of the projects.
11. The position of Islamic bank to its clients is that of partner, investors and
Global Journal of Management, Social Sciences & Humanities 186 Vol 3 (2) April-June, 2017 Page # 182-220. ISSN 2520-7113 (Print). ISSN 2520-7121 (Online) www.gjmsweb.com. [email protected]
_________________________________________________________________
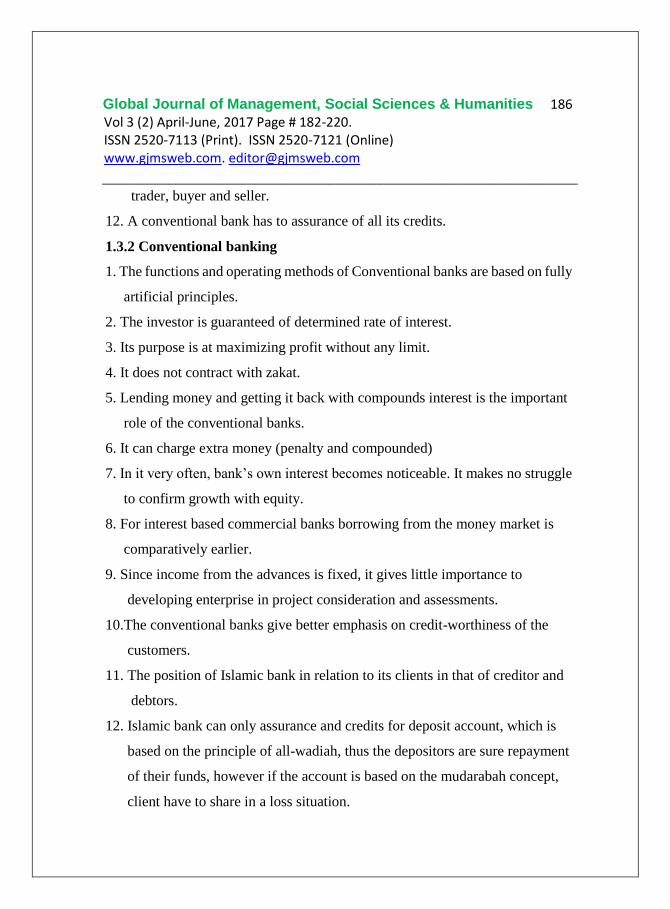
trader, buyer and seller.
12. A conventional bank has to assurance of all its credits.
1.3.2 Conventional banking
1. The functions and operating methods of Conventional banks are based on fully
artificial principles.
2. The investor is guaranteed of determined rate of interest.
3. Its purpose is at maximizing profit without any limit.
4. It does not contract with zakat.
5. Lending money and getting it back with compounds interest is the important
role of the conventional banks.
6. It can charge extra money (penalty and compounded)
7. In it very often, bank’s own interest becomes noticeable. It makes no struggle
to confirm growth with equity.
8. For interest based commercial banks borrowing from the money market is
comparatively earlier.
9. Since income from the advances is fixed, it gives little importance to
developing enterprise in project consideration and assessments.
10.The conventional banks give better emphasis on credit-worthiness of the
customers.
11. The position of Islamic bank in relation to its clients in that of creditor and
debtors.
12. Islamic bank can only assurance and credits for deposit account, which is
based on the principle of all-wadiah, thus the depositors are sure repayment
of their funds, however if the account is based on the mudarabah concept,
client have to share in a loss situation.

Global Journal of Management, Social Sciences & Humanities 187 Vol 3 (2) April-June, 2017 Page # 182-220. ISSN 2520-7113 (Print). ISSN 2520-7121 (Online) www.gjmsweb.com. [email protected]
_________________________________________________________________
2. LITERATURE REVIEW
Customers are profit motivated, they prefer conventional loans rather
than BBA financing when interest rate decline. Islamic banks get direct interest
during trading transections sharing profits and losses with its partners/clients.
The banks have to pay returns on customer deposit, conventional banks denoted
as interest expense, while in Islamic banking it is denoted as share of profit.
Conventional banks are more reliant on external liabilities than Islamic banks.
Islamic banks are less unprotected to liquidity risk. For maintaining liquidity
conventional banks have many revenues, government securities, and short-term
loans, money at call, short bills, rental companies’ bonds, and investment in
shares etc. Islamic banks should be controlled and managed in similar manner
as conventional banks. Comparison of financial ratios of Islamic bank displays
that they are healthy and operating well. Conventional banks implement better
than Islamic banks in term of technical effectiveness but in term of cost and
assign efficiencies Islamic banks implement better than conventional banks.
Customers are satisfied with the total service quality providing by their banks.
Islamic finance basically helps financial transactions with links to the real
economy and withdraws from financing activities that are detrimental to society.
Islamic financial system originates its rules through Quran and Sunnah. In Sudan
Islamic banking system is succeed in converting all banks into interest free.
Banks required to pay Zakah provide more social expose than bank not essential
to pay Zakah. The equilibrium ratio of profit allocation is the one between banks
and depositors sufficient to sustain a supply of investable funds to business
commensurate with business demand. Islamic banking works through
Global Journal of Management, Social Sciences & Humanities 188 Vol 3 (2) April-June, 2017 Page # 182-220. ISSN 2520-7113 (Print). ISSN 2520-7121 (Online) www.gjmsweb.com. [email protected]
_________________________________________________________________
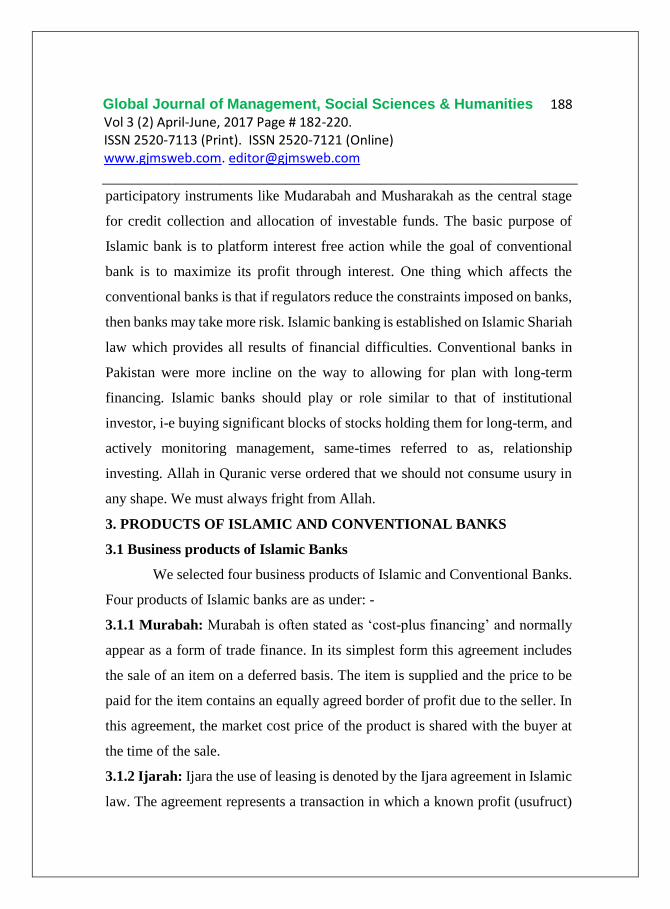
participatory instruments like Mudarabah and Musharakah as the central stage
for credit collection and allocation of investable funds. The basic purpose of
Islamic bank is to platform interest free action while the goal of conventional
bank is to maximize its profit through interest. One thing which affects the
conventional banks is that if regulators reduce the constraints imposed on banks,
then banks may take more risk. Islamic banking is established on Islamic Shariah
law which provides all results of financial difficulties. Conventional banks in
Pakistan were more incline on the way to allowing for plan with long-term
financing. Islamic banks should play or role similar to that of institutional
investor, i-e buying significant blocks of stocks holding them for long-term, and
actively monitoring management, same-times referred to as, relationship
investing. Allah in Quranic verse ordered that we should not consume usury in
any shape. We must always fright from Allah.
3. PRODUCTS OF ISLAMIC AND CONVENTIONAL BANKS
3.1 Business products of Islamic Banks
We selected four business products of Islamic and Conventional Banks.
Four products of Islamic banks are as under: -
3.1.1 Murabah: Murabah is often stated as ‘cost-plus financing’ and normally
appear as a form of trade finance. In its simplest form this agreement includes
the sale of an item on a deferred basis. The item is supplied and the price to be
paid for the item contains an equally agreed border of profit due to the seller. In
this agreement, the market cost price of the product is shared with the buyer at
the time of the sale.
3.1.2 Ijarah: Ijara the use of leasing is denoted by the Ijara agreement in Islamic
law. The agreement represents a transaction in which a known profit (usufruct)

Global Journal of Management, Social Sciences & Humanities 189 Vol 3 (2) April-June, 2017 Page # 182-220. ISSN 2520-7113 (Print). ISSN 2520-7121 (Online) www.gjmsweb.com. [email protected]
_________________________________________________________________
related with a quantified asset is sold for a payment. In the course of this sale of
asset is not shifted the bank keeps the rights of asset.
3.1. 3 Mudarabah: In the mudarabah model, a mudarib or entrepreneur
commonly provides managing expertise which is treated as a form of capital.
The investor is recognized as the rabb-al-mal. The share of estimated future
profits between the mudarib(s) and the investor(s) is decided at the outset in any
ratio equally agreed to buy the parties involved. The rabb-al-mal bears all
sufferers of invested assets (by the cash or other forms of capital).
3.1.4 Musharakah: Musharakah model is basically a sharing model. Parties
involved in a partnership arrangement donate funds to and have the right to
exercise exclusive powers is that project in accordance with a decided formula.
3.2 Products of Conventional Banks
The business products of Conventional banks are stated below: -
3.2.1 Interest: Money that is paid is interchange for borrowing or using interest
is calculated as a percentage of the money borrowed. Simple interest and
compound interest are two types of interest. Simple interest is calculated only
completed the original principal amount. For example, if one borrows $1,000 at
4% interest, the interest is $4 (4% of 1,000) each time it is calculated. In
compound interest, calculation of future interest included already paid interest.
For example, with the above loan, interest paid in the first month is $40 (4% of
1,000), in the second month it is 40.90 (3% of 1040), and so forth compound
interest is more common because its profit is more for the moneylender.
3.2.2 Term Financing: A term financing is a loan from which a bank offer a
specific amount that has a specified repayment schedule with the floating or
fixed interest rate. For example, different banks have run term-loan programs

Global Journal of Management, Social Sciences & Humanities 190 Vol 3 (2) April-June, 2017 Page # 182-220. ISSN 2520-7113 (Print). ISSN 2520-7121 (Online) www.gjmsweb.com. [email protected]
_________________________________________________________________
that are proposal small businesses the cash they need to operate financial
activities. Often, a small business required cash from a term loan to
purchase assets such as equipment for its production process.
3.2.3. Long term financing. It is a form of financing that is finance for a period
of above than a year. Long term finance is provided to those business individuals
that are face a shortage of capital. There are many long term sources of finance.
It is different from short term financing that has to be paid back within a year.
The paid back period may be less than one year as well. For Examples of long-
term financing include a 20 year mortgage or a 15-year Treasury note.
Equity is another form of long-term financing, when a company issues stock to
increase capital for a new project.
3.2.4 Short term financing: It is to any investment, financial plan or anything
else is lasting for one year or less. Short term investments and financial plans
usually contain less insecurity than long-term investment and financial plans
because; market trends are more easily expected for one year than for any longer
period. Similarly, short term financial plans are more easily changeable as a
result of the shorty term frame. Short term financial plans are usually involve
investing in short term securities, such as T Bills or commercial paper.
3.2.5 Project Financing: In it investment of long term projects, industrial and
public services established on a non-resource or limited resource financial
structure, in which project liability and equity used the project are paid back from
the cash flow.
3.2.6. Auto Financing: In direct offering, a loan is directly got from bank,
finance company or credit union. Agreed to pay over a period of time, the amount

Global Journal of Management, Social Sciences & Humanities 191 Vol 3 (2) April-June, 2017 Page # 182-220. ISSN 2520-7113 (Print). ISSN 2520-7121 (Online) www.gjmsweb.com. [email protected]
_________________________________________________________________
financed, plus charge. Once enter in a contract with authorization to buy a
vehicle, use the loan from the direct lender to pay for the vehicle.
4.RESEARCH METHDOLOGY
4.1 Research Design
This research study has been designed in such a way that it helps to
compare the performance and profitability of Islamic banks with the
conventional banks. The area of the study is the whole Pakistan where Islamic
and Conventional banks are operating under the same legal context. Business
products of selected Islamic and Conventional banks tell the performance,
products and also the profitability.
4.2 Sample of study
Five Islamic Banks and seventeen Conventional Banks are operating in
Pakistan. Total five Islamic Banks and five Conventional Banks have been
comprised into of this research study. Islamic banks are:
1. Meezan Bank Limited
2. Al Baraka Bank
3. Bank Islami Pakistan
4. Burj Bank
5. Dubai Islamic Bank
The selected conventional banks are the followings: -
1. Bank Alfalah Limited
2. Habib Metropolitan
3. Bank Al-Habib Limited
4. Askari Bank Limited
5. Soneri Bank Limited

Global Journal of Management, Social Sciences & Humanities 192 Vol 3 (2) April-June, 2017 Page # 182-220. ISSN 2520-7113 (Print). ISSN 2520-7121 (Online) www.gjmsweb.com. [email protected]
_________________________________________________________________
4.3 Data and Source
For research of that topic we use the secondary source. Due to that we
collect data easily. We take experiments and hypothesis. Due to that we come to
know that either the statement of problem is right or not. The result of experiment
is our findings. We describe our problem to others through models and case
studies. We also make graphs. We use different data collection methods. We
collect data through already present data. We get information through internet.
We go to library and search different books about the related topic. We collect
information through newspapers. We collect data through magazines. We also
study the research papers of the related topic. We may use the qualitative and
quantitative methods. Biasness occurs through direct interview because no one
gives the right answer and also does not take it seriously. We collect different
type of information. We check the balance sheet and income statement of these
banks. These methods we follow to make our research complete and appropriate.
4.4. Analytical techniques
The following research techniques are used in this study.
1. Comparative analysis technique applied to compare the business products of
Islamic and conventional banks.
2. We will also use ratio analysis technique to measure the profitability, liquidity
and efficiency of Islamic and conventional banks.
4.5 Formulation of Hypothesis
H0
Is Islamic bank performance is better than Conventional banks and their
profitability are greater?

Global Journal of Management, Social Sciences & Humanities 193 Vol 3 (2) April-June, 2017 Page # 182-220. ISSN 2520-7113 (Print). ISSN 2520-7121 (Online) www.gjmsweb.com. [email protected]
_________________________________________________________________
Both banks are working properly. But Islamic banks are interest free. So we think
that which banks charge interest whose performance is better. We just assume
that but we are not sure about it. Before analysis of both banks we do not give
the proper answer. If Islamic bank performance is better than we also think that
their customers are also satisfied. If Conventional Bank performance is better
than Islamic banks, then our assumption will be false.
For proofing our result and assumption we take ratio analysis for conclusion.
Profitability tells the performance of banks. Other ratios also show clear results
of better performance of banks. Business products of both banks also tells the
terms and conditions they follow. Islamic banks are interest free so we think that
is they earn better profit or not. Conventional banks have saving accounts in
which customers finance increased. Customers consider it benefit for them. So I
think conventional bank customers are satisfied. Conventional banks also
provide bonuses this is a great opportunity for their employees and customers.
H1
Islamic bank performance is better than Conventional banks and their
profitability are also greater.
We analyzed the business products of both banks. We selected 5 Islamic and 5
conventional banks for this analysis. After analyzing we compare the
profitability and performance of both types of banks. Then we draw conclusions
through hypothesis testing.
Global Journal of Management, Social Sciences & Humanities 194 Vol 3 (2) April-June, 2017 Page # 182-220. ISSN 2520-7113 (Print). ISSN 2520-7121 (Online) www.gjmsweb.com. [email protected]
_________________________________________________________________
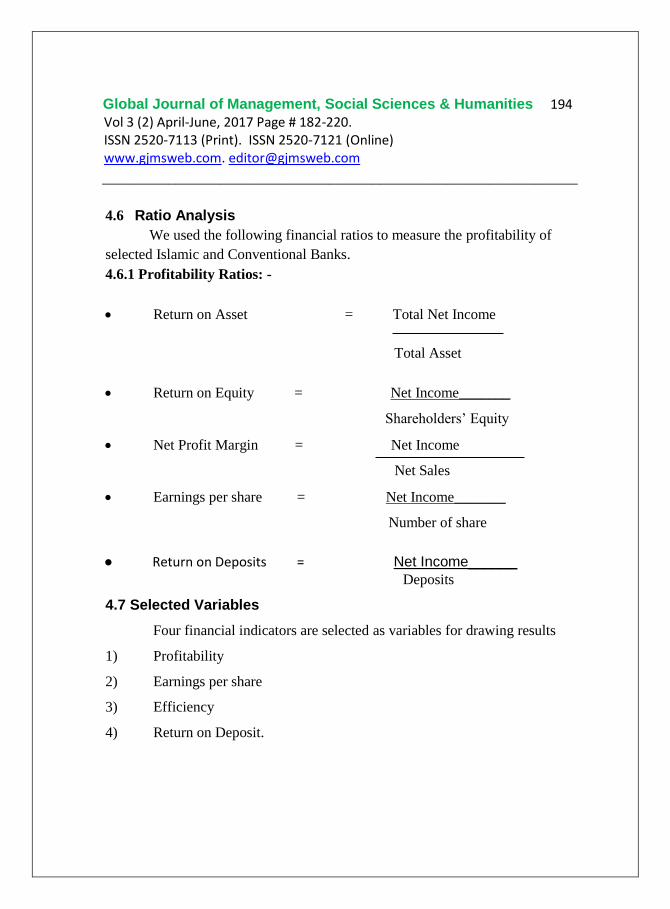
4.6 Ratio Analysis
We used the following financial ratios to measure the profitability of
selected Islamic and Conventional Banks.
4.6.1 Profitability Ratios: -
Return on Asset = Total Net Income
Total Asset
Return on Equity = Net Income_______
Shareholders’ Equity
Net Profit Margin = Net Income
Net Sales
Earnings per share = Net Income_______
Number of share
● Return on Deposits = Net Income______ Deposits
4.7 Selected Variables
Four financial indicators are selected as variables for drawing results
1) Profitability
2) Earnings per share
3) Efficiency
4) Return on Deposit.

Global Journal of Management, Social Sciences & Humanities 195 Vol 3 (2) April-June, 2017 Page # 182-220. ISSN 2520-7113 (Print). ISSN 2520-7121 (Online) www.gjmsweb.com. [email protected]
_________________________________________________________________
4.8 Period of study
Our period of study will be 2010-2015.
5. DATA ANALYSIS
The results of ratio analysis are shown in Table 1
Table 1 Financial indicators of Meezan Bank Ltd, 2011-15.
Meezan Bank Limited (Islamic Bank)
2011 2012 2013 2014 2015
Return on Assets
Net income (loss) 3,391 3,508 3,957 4,570 5,023
Total Assets 200,550 274,437 329,725 437,510 531,850
Return on assets 1.69% 1.28% 1.20% 1.04% 0.94%
Return on Deposits
Net income (loss) 3,391 3,508 3,957 4,570 5,023
Deposits (Revenue) 18,032 21,837 23,171 28,803 33,114
Return on Deposits 18.81% 16.06% 17.08% 15.87% 15.17%
Return on Equity
Net income (loss) 3,391 3,508 3,957 4,570 5,023
Total shareholders'
equity 13,781 16,563 18,913 23,890 26,347
Return on equity 24.61% 21.18% 20.92% 19.13% 19.06%
Earnings per Share
Income After Tax 3,391 3,508 3,957 4,570 5,023
Number of Equity
Shares 802.993 903.367 1,002.738 1,102.463 1,102.463
Earnings per Share 4.22 3.88 3.95 4.15 4.56
Net profit margin
Net Income (Loss) 3,391 3,508 3,957 4,570 5,023

Global Journal of Management, Social Sciences & Humanities 196 Vol 3 (2) April-June, 2017 Page # 182-220. ISSN 2520-7113 (Print). ISSN 2520-7121 (Online) www.gjmsweb.com. [email protected]
_________________________________________________________________ Murabaha 174,093 201,720 232,941 167,593 121,976
Gross profit margin 1.95% 1.74% 1.70% 2.73% 4.12%
Table 2 Financial Indicators of Alfalah Bank Ltd, 2011-2015.
Alfalah Bank Limited (Conventional Bank)
2011 2012 2013 2014 2015
Return on Assets
Net income (loss) 3,503 4,556 4,676 5,641 7,523
Total Assets 468,174 536,568 611,428 743,128 902,607
Return on assets 0.75% 0.85% 0.76% 0.76% 0.83%
Return on Deposits
Net income (loss) 3,503 4,556 4,676 5,641 7,523
Deposits (Revenue) 44,298 46,080 43,961 55,378 61,458
Return on Deposits 7.91% 9.89% 10.64% 10.19% 12.24%
Return on Equity
Net income (loss) 3,503 4,556 4,676 5,641 7,523
Total shareholders'
equity 25,777 30,059 31,902 44,819 53,353
Return on equity 13.59% 15.16% 14.66% 12.59% 14.10%
Earnings per Share
Income After Tax 3,503 4,556 4,676 5,641 7,523
Number of Equity
Shares
1,349.15
6
1,349.15
6 1,349.156 1,587.243 1,589.806
Earnings per Share 2.60 3.38 3.47 3.55 4.73

Global Journal of Management, Social Sciences & Humanities 197 Vol 3 (2) April-June, 2017 Page # 182-220. ISSN 2520-7113 (Print). ISSN 2520-7121 (Online) www.gjmsweb.com. [email protected]
_________________________________________________________________
Net profit margin
Net Income (Loss) 3,503 4,556 4,676 5,641 7,523
Interest 44,298 46,080 43,961 55,378 61,458
Gross profit margin 7.91% 9.89% 10.64% 10.19% 12.24%
Figure 1 Return on Assets
0.00%
0.50%
1.00%
1.50%
2.00%
2.50%
3.00%
2011 2012 2013 2014 2015
Return on Assets
Meezan Bank Limited Alfalah Bank Limited

Global Journal of Management, Social Sciences & Humanities 198 Vol 3 (2) April-June, 2017 Page # 182-220. ISSN 2520-7113 (Print). ISSN 2520-7121 (Online) www.gjmsweb.com. [email protected]
_________________________________________________________________
Figure 2 Returns on Deposits
Figure 3 Returns on Equity
0.00%
5.00%
10.00%
15.00%
20.00%
2011 2012 2013 2014 2015
Return on Deposits
Meezan Bank Limited Alfalah Bank Limited
0.00%
5.00%
10.00%
15.00%
20.00%
25.00%
30.00%
2011 2012 2013 2014 2015
Return on Equity
Meezan Bank Limited Alfalah Bank Limited

Global Journal of Management, Social Sciences & Humanities 199 Vol 3 (2) April-June, 2017 Page # 182-220. ISSN 2520-7113 (Print). ISSN 2520-7121 (Online) www.gjmsweb.com. [email protected]
_________________________________________________________________
Figure 4 Earnings per share
Figure 5 Net Profit margin
0.00
1.00
2.00
3.00
4.00
5.00
2011 2012 2013 2014 2015
Earning per Share
Meezan Bank Limited Alfalah Bank Limited
0.00%
5.00%
10.00%
15.00%
20.00%
2011 2012 2013 2014 2015
Net profit margin
Meezan Bank Limited Alfalah Bank Limited

Global Journal of Management, Social Sciences & Humanities 200 Vol 3 (2) April-June, 2017 Page # 182-220. ISSN 2520-7113 (Print). ISSN 2520-7121 (Online) www.gjmsweb.com. [email protected]
_________________________________________________________________
Table 3 Financial indicators of Al Baraka Bank Ltd, 2011-2015
Al Baraka Bank (Islamic Bank)
2011 2012 2013 2014 2015
Return on Assets
Net income
(loss) 212.29 235.24 257.78 274.77 286.17
Total Assets 17,154.04 19,055.13 20,967.56 23,463.59 24,618.20
Return on assets 1.24% 1.23% 1.23% 1.17% 1.16%
Return on Deposits
Net income
(loss) 212.29 235.24 257.78 274.77 286.17
Deposits
(Revenue) 759.71 911.60 925.47 1,019.49 1,034.31
Return on
Deposits 27.94% 25.81% 27.85% 26.95% 27.67%
Return on Equity
Net income
(loss) 212.29 235.24 257.78 274.77 286.17
Total
shareholders'
equity
1,799.15 1,967.68 1,983.39 2,074.62 2,094.58
Return on equity 11.80% 11.96% 13.00% 13.24% 13.66%
Earnings per Share
Income After
Tax 212.29 235.24 257.78 274.77 286.17
Number of
Equity Shares 2,271.50 2,827.58 3,364.03 3,764.35 4,206.70
Earnings per
Share 10.70 12.02 13.05 13.70 14.70
Net profit margin
Global Journal of Management, Social Sciences & Humanities 201 Vol 3 (2) April-June, 2017 Page # 182-220. ISSN 2520-7113 (Print). ISSN 2520-7121 (Online) www.gjmsweb.com. [email protected]
_________________________________________________________________
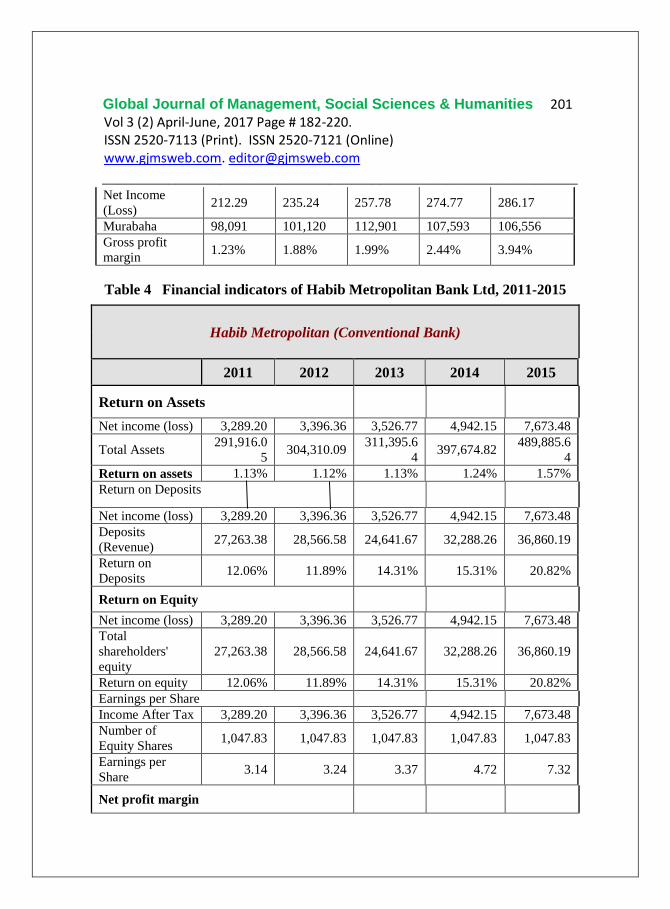
Table 4 Financial indicators of Habib Metropolitan Bank Ltd, 2011-2015
Habib Metropolitan (Conventional Bank)
2011 2012 2013 2014 2015
Return on Assets
Net income (loss) 3,289.20 3,396.36 3,526.77 4,942.15 7,673.48
Total Assets 291,916.0
5 304,310.09
311,395.6
4 397,674.82
489,885.6
4
Return on assets 1.13% 1.12% 1.13% 1.24% 1.57%
Return on Deposits
Net income (loss) 3,289.20 3,396.36 3,526.77 4,942.15 7,673.48
Deposits
(Revenue) 27,263.38 28,566.58 24,641.67 32,288.26 36,860.19
Return on
Deposits 12.06% 11.89% 14.31% 15.31% 20.82%
Return on Equity
Net income (loss) 3,289.20 3,396.36 3,526.77 4,942.15 7,673.48
Total
shareholders'
equity
27,263.38 28,566.58 24,641.67 32,288.26 36,860.19
Return on equity 12.06% 11.89% 14.31% 15.31% 20.82%
Earnings per Share
Income After Tax 3,289.20 3,396.36 3,526.77 4,942.15 7,673.48
Number of
Equity Shares 1,047.83 1,047.83 1,047.83 1,047.83 1,047.83
Earnings per
Share 3.14 3.24 3.37 4.72 7.32
Net profit margin
Net Income
(Loss) 212.29 235.24 257.78 274.77 286.17
Murabaha 98,091 101,120 112,901 107,593 106,556
Gross profit
margin 1.23% 1.88% 1.99% 2.44% 3.94%

Global Journal of Management, Social Sciences & Humanities 202 Vol 3 (2) April-June, 2017 Page # 182-220. ISSN 2520-7113 (Print). ISSN 2520-7121 (Online) www.gjmsweb.com. [email protected]
_________________________________________________________________ Net Income
(Loss) 3,289.20 3,396.36 3,526.77 4,942.15 7,673.48
Interest 38,298 41,088 34,956 55,378 61,458
Gross profit
margin 6.71% 8.33% 09.32% 10.77% 11.22%
Figure 6 Returns on Assets
0.00%
0.20%
0.40%
0.60%
0.80%
1.00%
1.20%
1.40%
1.60%
1.80%
2011 2012 2013 2014 2015
Return on Assets
Al Baraka Bank Habib Metropolitan

Global Journal of Management, Social Sciences & Humanities 203 Vol 3 (2) April-June, 2017 Page # 182-220. ISSN 2520-7113 (Print). ISSN 2520-7121 (Online) www.gjmsweb.com. [email protected]
_________________________________________________________________
Figure 7 Returns on Deposits
Figure 8 Return on Equity
0.00%
5.00%
10.00%
15.00%
20.00%
25.00%
30.00%
2011 2012 2013 2014 2015
Return on Deposits
Al Baraka Bank Habib Metropolitan
0.00%
5.00%
10.00%
15.00%
20.00%
25.00%
2011 2012 2013 2014 2015
Return on Equity
Al Baraka Bank Habib Metropolitan

Global Journal of Management, Social Sciences & Humanities 204 Vol 3 (2) April-June, 2017 Page # 182-220. ISSN 2520-7113 (Print). ISSN 2520-7121 (Online) www.gjmsweb.com. [email protected]
_________________________________________________________________
Figure 9 Earning per share
Figure 10 Net profit margin
0.00
5.00
10.00
15.00
20.00
2011 2012 2013 2014 2015
Earning per Share
Al Baraka Bank Habib Metropolitan
0.00%
5.00%
10.00%
15.00%
20.00%
2011 2012 2013 2014 2015
Net profit margin
Al Baraka Bank Habib Metropolitan

Global Journal of Management, Social Sciences & Humanities 205 Vol 3 (2) April-June, 2017 Page # 182-220. ISSN 2520-7113 (Print). ISSN 2520-7121 (Online) www.gjmsweb.com. [email protected]
_________________________________________________________________
Table 5 Financial Indicators of Bank Islami Pakistan, 2011-2015
Bank Islami Pakistan (Islamic Bank)
2011 2012 2013 2014 2015
Return on Assets
Net income (loss) 410.00 307.00 185.00 314.00 (196.00
)
Total Assets 58,833 74,249 86,856 101,984 174,130
Return on assets 0.70% 0.41% 0.21% 0.31% -0.11%
Return on Deposits
Net income (loss) 410.00 307.00 185.00 314.00 (196.00
)
Deposits
(Revenue) 5,502.00 5,992.00 6,289.00 7,812.00
8,834.0
0
Return on
Deposits 7.45% 5.12% 2.94% 4.02% -2.22%
Return on Equity
Net income (loss) 410.00 307.00 185.00 314.00 (196.00
)
Total
shareholders'
equity
5,325.00 5,591.00 6,242.00 6,867.00 11,186.
00
Return on equity 7.70% 5.49% 2.96% 4.57% -1.75%
Earnings per Share
Income After Tax 410.00 307.00 185.00 314.00 (196.00
)
Number of Equity
Shares 527.97 527.97 527.97 676.87
1,007.8
7
Earnings per
Share 0.78 0.58 0.35 0.46 (0.19)
Net profit margin

Global Journal of Management, Social Sciences & Humanities 206 Vol 3 (2) April-June, 2017 Page # 182-220. ISSN 2520-7113 (Print). ISSN 2520-7121 (Online) www.gjmsweb.com. [email protected]
_________________________________________________________________
Table 6 Financial indicators of Bank Al-Habib Ltd, 2015-2016
Bank Al-Habib Limited (Conventional Bank)
2011 2012 2013 2014 2015
Return on Assets
Net income (loss) 4,533.48 5,455.41 5,154.55 6,348.94 7,404.91
Total Assets 384,282.
46
453,105.
54
460,726.9
2
578,918.8
3
639,712.4
7
Return on assets 1.18% 1.20% 1.12% 1.10% 1.16%
Return on Deposits
Net income (loss) 4,533.48 5,455.41 5,154.55 6,348.94 7,404.91
Deposits
(Revenue)
36,502.7
6
41,467.8
7 37,255.75 44,001.20 50,293.23
Return on
Deposits 12.42% 13.16% 13.84% 14.43% 14.72%
Return on Equity
Net income (loss) 4,533.48 5,455.41 5,154.55 6,348.94 7,404.91
Total
shareholders'
equity
19,853.5
5
23,814.1
5 25,282.05 32,628.35 37,856.66
Return on equity 22.83% 22.91% 20.39% 19.46% 19.56%
Earnings per Share
Income After Tax 4,533.48 5,455.41 5,154.55 6,348.94 7,404.91
Net Income (Loss) 410.00 307.00 185.00 314.00 (196.00
)
Murabaha 75,091 84,122 112,900 107,555 106,572
Gross profit
margin 1.75% 1.46% 1.22% 2.44% 1.21%

Global Journal of Management, Social Sciences & Humanities 207 Vol 3 (2) April-June, 2017 Page # 182-220. ISSN 2520-7113 (Print). ISSN 2520-7121 (Online) www.gjmsweb.com. [email protected]
_________________________________________________________________
Number of
Equity Shares 878.60 1,010.39 1,010.39 1,111.43 1,111.43
Earnings per
Share 5.16 5.40 5.10 5.71 6.66
Net profit margin
Net Income
(Loss) 4,533.48 5,455.41 5,154.55 6,348.94 7,404.91
Murabaha/
Interest 38,233 41,045 34,921 50,438 59,338
Gross profit
margin 7.81% 9.33% 10.32% 10.77% 11.22%
Figure 11 Return on Assets
-0.20%
0.00%
0.20%
0.40%
0.60%
0.80%
1.00%
1.20%
1.40%
2011 2012 2013 2014 2015
Return on Assets
Bank Islami Pakistan Bank Al-Habib Limited

Global Journal of Management, Social Sciences & Humanities 208 Vol 3 (2) April-June, 2017 Page # 182-220. ISSN 2520-7113 (Print). ISSN 2520-7121 (Online) www.gjmsweb.com. [email protected]
_________________________________________________________________
Figure 12 Return on deposits
Figure 13 Return on Equity
-5.00%
0.00%
5.00%
10.00%
15.00%
20.00%
2011 2012 2013 2014 2015
Return on Deposits
Bank Islami Pakistan Bank Al-Habib Limited
-5.00%
0.00%
5.00%
10.00%
15.00%
20.00%
25.00%
2011 2012 2013 2014 2015
Return on Equity
Bank Islami Pakistan Bank Al-Habib Limited

Global Journal of Management, Social Sciences & Humanities 209 Vol 3 (2) April-June, 2017 Page # 182-220. ISSN 2520-7113 (Print). ISSN 2520-7121 (Online) www.gjmsweb.com. [email protected]
_________________________________________________________________
Figure 14 Earning per share
-1.00
0.00
1.00
2.00
3.00
4.00
5.00
6.00
7.00
8.00
2011 2012 2013 2014 2015
Earning per Share
Bank Islami Pakistan Bank Al-Habib Limited

Global Journal of Management, Social Sciences & Humanities 210 Vol 3 (2) April-June, 2017 Page # 182-220. ISSN 2520-7113 (Print). ISSN 2520-7121 (Online) www.gjmsweb.com. [email protected]
_________________________________________________________________
Figure 15 Net profit margin
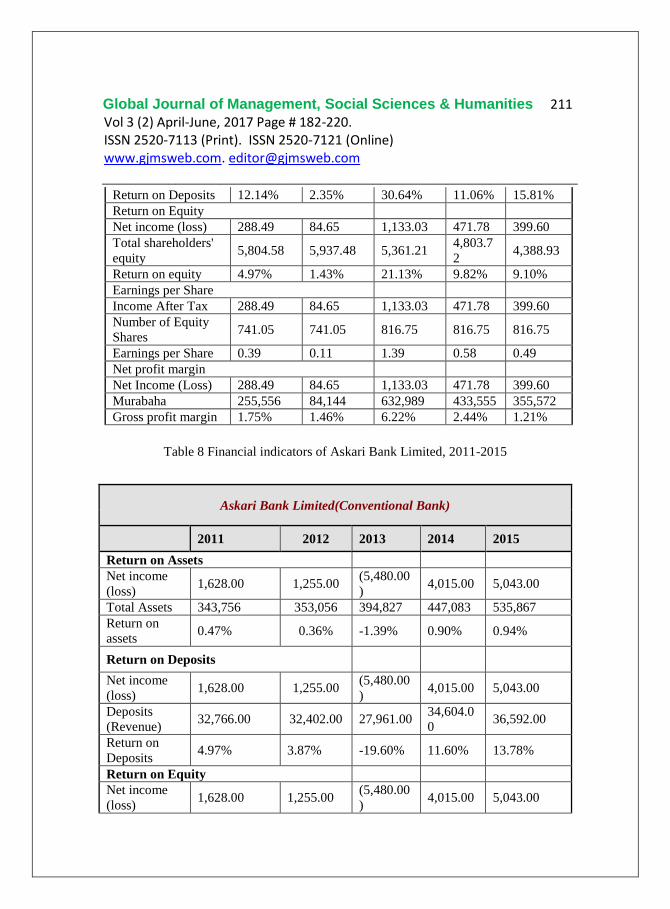
Table 7 Financial indicators of Burj Bank Ltd, 2011-2015
-4.00%
-2.00%
0.00%
2.00%
4.00%
6.00%
8.00%
10.00%
12.00%
14.00%
16.00%
2011 2012 2013 2014 2015
Net profit margin
Bank Islami Pakistan Bank Al-Habib Limited
Burj Bank (Islamic Bank)
2011 2012 2013 2014 2015
Return on Assets
Net income (loss) 288.49 84.65 1,133.03 471.78 399.60
Total Assets 27,656.22 47,185.45 53,389.06 34,090.
53
32,736.0
7
Return on assets 1.04% 0.18% 2.12% 1.38% 1.22%
Return on Deposits
Net income (loss) 288.49 84.65 1,133.03 471.78 399.60
Deposits (Revenue) 2,375.59 3,603.35 3,698.46 4,265.5
4 2,528.22
Global Journal of Management, Social Sciences & Humanities 211 Vol 3 (2) April-June, 2017 Page # 182-220. ISSN 2520-7113 (Print). ISSN 2520-7121 (Online) www.gjmsweb.com. [email protected]
_________________________________________________________________
Table 8 Financial indicators of Askari Bank Limited, 2011-2015
Askari Bank Limited(Conventional Bank)
2011 2012 2013 2014 2015
Return on Assets
Net income
(loss) 1,628.00 1,255.00
(5,480.00
) 4,015.00 5,043.00
Total Assets 343,756 353,056 394,827 447,083 535,867
Return on
assets 0.47% 0.36% -1.39% 0.90% 0.94%
Return on Deposits
Net income
(loss) 1,628.00 1,255.00
(5,480.00
) 4,015.00 5,043.00
Deposits
(Revenue) 32,766.00 32,402.00 27,961.00
34,604.0
0 36,592.00
Return on
Deposits 4.97% 3.87% -19.60% 11.60% 13.78%
Return on Equity
Net income
(loss) 1,628.00 1,255.00
(5,480.00
) 4,015.00 5,043.00
Return on Deposits 12.14% 2.35% 30.64% 11.06% 15.81%
Return on Equity
Net income (loss) 288.49 84.65 1,133.03 471.78 399.60
Total shareholders'
equity 5,804.58 5,937.48 5,361.21
4,803.7
2 4,388.93
Return on equity 4.97% 1.43% 21.13% 9.82% 9.10%
Earnings per Share
Income After Tax 288.49 84.65 1,133.03 471.78 399.60
Number of Equity
Shares 741.05 741.05 816.75 816.75 816.75
Earnings per Share 0.39 0.11 1.39 0.58 0.49
Net profit margin
Net Income (Loss) 288.49 84.65 1,133.03 471.78 399.60
Murabaha 255,556 84,144 632,989 433,555 355,572
Gross profit margin 1.75% 1.46% 6.22% 2.44% 1.21%

Global Journal of Management, Social Sciences & Humanities 212 Vol 3 (2) April-June, 2017 Page # 182-220. ISSN 2520-7113 (Print). ISSN 2520-7121 (Online) www.gjmsweb.com. [email protected]
_________________________________________________________________ Total
shareholders'
equity
17,776.00 19,688.00 18,729.00 23,707.0
0 26,853.00
Return on
equity 9.16% 6.37% -29.26% 16.94% 18.78%
Earnings per Share
Income After
Tax 1,628.00 1,255.00
(5,480.00
) 4,015.00 5,043.00
Number of
Equity Shares 707.02 813.07 1,260.26 1,260.26 1,260.26
Earnings per
Share 2.30 1.54 -4.35 3.19 4.00
Net profit margin
Net Income
(Loss) 1,628.00 1,255.00
(5,480.00
) 4,015.00 5,043.00
Interest 443,233 421,045 566,921 250,438 559,338
Gross profit
margin 6.81% 7.33% 0.32% 10.77% 11.22%
Figure 16 Returns on Assets
-2.00%
-1.50%
-1.00%
-0.50%
0.00%
0.50%
1.00%
1.50%
2.00%
2.50%
2011 2012 2013 2014 2015
Return on Assets
Burj Bank Askari Bank Limited

Global Journal of Management, Social Sciences & Humanities 213 Vol 3 (2) April-June, 2017 Page # 182-220. ISSN 2520-7113 (Print). ISSN 2520-7121 (Online) www.gjmsweb.com. [email protected]
_________________________________________________________________
Figure 17 Return on deposits
Figure 18 Return on Equity
-30.00%
-20.00%
-10.00%
0.00%
10.00%
20.00%
30.00%
40.00%
2011 2012 2013 2014 2015
Return on Deposits
Burj Bank Askari Bank Limited
-40.00%
-30.00%
-20.00%
-10.00%
0.00%
10.00%
20.00%
30.00%
2011 2012 2013 2014 2015
Return on Equity
Burj Bank Askari Bank Limited

Global Journal of Management, Social Sciences & Humanities 214 Vol 3 (2) April-June, 2017 Page # 182-220. ISSN 2520-7113 (Print). ISSN 2520-7121 (Online) www.gjmsweb.com. [email protected]
_________________________________________________________________
Figure 19 Earning per share
Figure 20 Net profit margins
-6.00
-4.00
-2.00
0.00
2.00
4.00
6.00
2011 2012 2013 2014 2015
Earning per Share
Burj Bank Askari Bank Limited
-20.00%
-15.00%
-10.00%
-5.00%
0.00%
5.00%
10.00%
15.00%
20.00%
25.00%
30.00%
2011 2012 2013 2014 2015
Net profit margin
Burj Bank Askari Bank Limited

Global Journal of Management, Social Sciences & Humanities 215 Vol 3 (2) April-June, 2017 Page # 182-220. ISSN 2520-7113 (Print). ISSN 2520-7121 (Online) www.gjmsweb.com. [email protected]
_________________________________________________________________
6. FINDINGS AND RESULTS
We have compared the performance of Meezan bank and Alfalah Bank.
We have chosen five indicators of every bank. The Results show that Return of
Asset of Meezan Bank is increasing constantly, however, it is downward
flopping because company’s assets are increasing more rapidly as compared to
net income. Return on Asset of Alfalah Bank is almost constant throughout the
study period, showing more stable growth in income as well as assets. Return on
deposit of Meezan Bank is decreasing constantly during the study period. This
shows low margin of bank’s earnings, which is effected due to tough competition
with peer. Return on deposit of Alfalah Bank is increasing gradually. It shows
there is improvement in the performance of bank’s financial activities. Return
on Equity of Meezan Bank is maintained at almost 20% constantly for many
years. This shows company’s earning is stable in the competitive environment.
Return on Equity of Alfalah Bank is keep changing year by year. It depicts
unstable earnings per share which is critical for bank. Earnings per Share for
shareholders of Meezan Bank is almost kept at four Rupee per share. It shows
good and steady earnings for the shareholders and handsome return on their
investments. Earnings per Share of Alfalah Bank is increasing year by year. It
can be seen that bank is trying to pay more and more dividend to its shareholders
in order to build trust and increase potential growth. Net profit margin of Meezan
Bank is decreasing constantly. It indicates that the expenses are not under control
and bank needs to improve its performance by having control over its
overheads.Net profit margin of Alfalah Bank was stable until 2014 and then

Global Journal of Management, Social Sciences & Humanities 216 Vol 3 (2) April-June, 2017 Page # 182-220. ISSN 2520-7113 (Print). ISSN 2520-7121 (Online) www.gjmsweb.com. [email protected]
_________________________________________________________________
increased in 2015. It indicates that bank is having good control over its overhead
and tries to reduce it as much as possible in order to earn high profit.
Our results show that Return on Asset of Al Baraka Bank is constantly
remain stable between 1.00% to 1.50%, means consistent return is generated
efficiently from utilization of assets during the study period. Return on Asset of
Habib Metropolitan was also constant between 1.00% to 1.50%, but it was
increased in year 2015 at 1.57% that shows improvement in return generated from
existing assets. Return on deposits of Al Baraka Bank remains stable between
25.00% to 30.00%, which means consistent return generated from deposits. Return
on Deposit of Habib Metropolitan Bank was increased from 12.06% to as high as
20.86% in year 2015, showing continuous improvement in revenue generation
from operating assets. Return on Equity of Al Baraka Bank was increased from
11.80% to 13.66%. We can understand from this data that consistency in getting
return from investments for shareholders throughout the years. Return on Equity
of Habib Metropolitan is keep changing year by year, which is beneficial for banks
and its shareholders. Earnings per Share for shareholders of Al Baraka Bank is
high as compared to Habib Metropolitan Bank. Earnings per Share for
shareholders of Habib Metropolitan shows that bank yields higher return for its
shareholders.Net profit margin of Al Baraka Bank indicates that the expenses of
bank is under control and its management have strict control on expenses to
maintain constant return.Net profit margin of Habib Metropolitan shows
improvement in revenue generation and efficiency of the bank.
For Bankislami Pakistan the results show that bank’s assets are increasing
more rapidly as compared to net income. Return on Asset of Bank Al Habib
Limited is almost constant throughout the study; it shows more stable growth in

Global Journal of Management, Social Sciences & Humanities 217 Vol 3 (2) April-June, 2017 Page # 182-220. ISSN 2520-7113 (Print). ISSN 2520-7121 (Online) www.gjmsweb.com. [email protected]
_________________________________________________________________
income as well as assets of the bank. Return on Deposit has good values for bank
al Habib as compared to BankIslami. Earnings per Share for shareholders of
BankIslami are decreasing study period. It can be seen that bank is trying to pay
more and more dividend to its shareholders in order to gain their trust. .Net profit
margin of Bank Al Habib Limited has good control over its overhead and try to
reduce it as much as possible in order to earn high profit.
This Results show that Return on Asset of Askari Bank limited is almost
constant throughout the year of 2012 but it decreases in 2013. However, it rapidly
increased in 2014-2015.Net Profit Margin of Burj Banks decreased in 2012 then
again increases rapidly then decreases constantly. Earnings per Share of Burj Banks
decreased in 2012 then then slightly increased in 2013 and again decreased in 2014.
It shows the bank’s Assets are decreasing more rapidly as compare to it net income
after 2013.Earning per Share of Askari Bank limited is almost constant in 2012 but
it decreased in 2013. However, it rapidly increased 2014 and 2015. Return on
deposits of Burj Banks decreased in 2012 but slightly increased in next year. Then
again decreased in 2014 and 2015. It shows the bank’s assets are decreasing more
rapidly as compared to net income after 2013.
The Results show that Return on Asset of Dubai Islamic bank is on Zigzag
path. It increased in 2012 then decreased in 2013 then again rapidly increased in
2014 and again decreased in 2015.Return on Asset of Soneri Bank Limited is on
right path. It is constantly increasing since 2012. Return on Equity of Dubai Islamic
bank is on Zigzag path. It increases in 2012 then decreased in 2013 but rapidly
increased in 2014 and again decreased in 2015.Return on Asset of Soneri Bank
Limited is on right path. It is constantly increasing. It has constantly increased
during 2012-15. Net Profit Margin of Dubai Islamic bank is good for 2012. It
Global Journal of Management, Social Sciences & Humanities 218 Vol 3 (2) April-June, 2017 Page # 182-220. ISSN 2520-7113 (Print). ISSN 2520-7121 (Online) www.gjmsweb.com. [email protected]
_________________________________________________________________
decreased in 2013 and then again rapidly increased in 2014 but decreased in
2015.Earning per share of Soneri Bank Limited is on right path. It constantly
increased during the study period.
7.CONCLUSION
After carrying out ratio analysis, we conclude that the profitability of
Conventional bank is more than Islamic bank because of fixed return on their loan
portfolio and investment. Islamic banks’ return is fluctuating because Islamic banks
provide loans to their customers free of interest and their financing is on profit and
loss basis. Islamic banks offer Murabah, Ijara, Mudarabah and Musharakah
contracts to their customers. In these contracts, they follow Islamic Shariah’s rules.
That’s why their customers are more satisfied than conventional banks because they
know that under these contracts they will not have to pay fixed interest. The
customers of both Islamic and conventional banks are bound to repay their loans at
the completion of agreed time period. The working of Islamic bank is more efficient
than conventional banks because most of their income is generated from services.
The main difference between two segments of banks is interest. Conventional
banks’ business products are interest-based while the business products of Islamic
banks are developed on profit and loss system (PLS). Thus, Islamic banking is
customers ‘welfare-oriented.
REFERENCES
Ahmad, A. (2010). A comparative study of Islamic banking in Pakistan:
Proposing and testing a model. Foundation University, Islamabad.
Ahmad, W. (2008). Islamic banking in the United Kingdom: Opportunities
and challenges. Business School, London.
Akhtar, M. F., Ali, K., & Sadaqat, S. (2011). Liquidity risk management: A
comparative study between Islamic banks of Pakistan Interdisciplinary

Global Journal of Management, Social Sciences & Humanities 219 Vol 3 (2) April-June, 2017 Page # 182-220. ISSN 2520-7113 (Print). ISSN 2520-7121 (Online) www.gjmsweb.com. [email protected]
_________________________________________________________________
of Research in Business, 1 (1), 35-44.
Amin, M., & Isa, Z. (2008). Faculty of science and Technology. An examination
of the relationship between service quality perception and customer
satisfaction. International Journal of Islamic and Middle Eastern
Finance and Management. 1 (3), 191:209.
Awan, A. G. (2009). Comparison of Islamic and conventional banking in
Pakistan. Department of Economics, Islamia University, Bahawalpur,
Pakistan, Proceedings 2nd CBRC, Lahore.
Awan, Abdul Ghafoor and Maleeha Azhar (2014) Consumer Behaviour
towards Islamic Banking in Pakistan, European Journal of Accounting
Auditing and Finance Research,Vol.2 (9): 42-95.
Awan,Abdul Ghafoor and Shabana Sheikh (2016) “ Islamic Banking Scenario
in Pakistan”, Global Journal of Management and Social Sciences, Vol 2
(1): 38-57.
Awan,Abdul Ghafoor and Maria Hanif (2016) Financial performance of
Islamic and Conventional Banks in Pakistan”, Global Journal of
Management and Social Sciences, Vol 2 (2):1-28.
Awan, Abdul Ghafoor and Muhammad Zeeshan (2016). Customer Preferences
in selection of Islamic and Conventional Banking in Pakistan”, Global
Journal of Management and Social Sciences, 2(3), 72-101.
Cevik, S., & Charap, J. (2011). The Behavioure of Conventional and Islamic
Bank Deposit Returns in Malysia and Turkey. IMF Working Paper,
WP/11/156.
Chong, B. S. (2009). Nanyang Business School, Nanyang Technological
University, Singapore, & Liv, M. H. (2007). Department of Finance,
Faculty of Business, Auckland University of Technology, Islamic
banking: Interest free or interest based? Pacific-Basin Finance Journal,
17, 125-144.
Hanif, M., Tariq, M., Tahir, A., Momeneen W. (2012). Comparative
Performance Study of Conventional and Islamic Banking in Pakistan.
International Research Journal of Finance and Economics.
Kader, R. A., & Leong, Y. K. (2009). The impact of interest rate changes on

Global Journal of Management, Social Sciences & Humanities 220 Vol 3 (2) April-June, 2017 Page # 182-220. ISSN 2520-7113 (Print). ISSN 2520-7121 (Online) www.gjmsweb.com. [email protected]
_________________________________________________________________
Islamic bank financing. International Review of Business Research
Papers, 5 (3), 189-201.
Maali, B., Casson, P., & Napier, C. (2006) Accounting Foundation. Social
reporting by Islamic banks. ABACUS. 42 (2).
Mohsin, M. I. A., (2005). The Practice of Islamic banking system in Sudan.
Journal Economic Cooperation 26 (4), 27-50.
Shahid, H., Rehman, R. Assistant Professor, Raoof, A. & Niazi, G. S. K.
(2010) .Efficiencies comparison of Islamic and conventional banks of
Pakistan. International Research Journal of Finance and Economics,
ISSN 1450-2887.
Siddiqi, M. N., (1983). Issues in Islamic Banking. Islamic Econ. 1 (1), 57-59.
Siraj, K. K., & Pillai, P. S., (2012). Comparative study on Performance Islamic
banks and Conventional banks in GCC region. Journal of Applied
Finance and Banking, 2 (3), 123-161.
Tabash, M. I., & Dhankar, R.S., (2014). Islamic banking and Economic
Growth: An Empirical Evidence from Qatar. Journal of Applied Economics and
Business, 2 (1), 51-67.